
The Composition and Seasonal Variation of Epigeic Arthropods in Different Types of Agricultural Crops and Their Ecotones


1
Department of Zoology and Anthropology, Faculty of Natural Sciences, Constantine the Philosopher University in Nitra, Tr. A. Hlinku 1, 94901 Nitra, Slovakia
2
Faculty of Agrobiology and Food Resources, Slovak Institute of Plant and Environmental Sciences, University of Agriculture in Nitra, Tr. A. Hlinku 2, 94901 Nitra, Slovakia
*
Author to whom correspondence should be addressed.
Agronomy 2021, 11(11), 2276; https://doi.org/10.3390/agronomy11112276
Submission received: 14 August 2021
/
Revised: 5 November 2021
/
Accepted: 8 November 2021
/
Published: 10 November 2021
Abstract
:Changes in the structures of epigeic arthropods reflect changes in the ecological status of their habitats. The aim of this research was to assess the influence of ecotones and environmental variables (pH soil, soil moisture, potassium, phosphorus, nitrogen) on the abundance of epigeic arthropods. Between 2018 and 2020, an investigation of different types of crops (Brassica napus L., Pisum sativum L., Triticum aestivum L., T. spelta L., Zea mays L., grass mixture) recorded 31,315 individuals belonging to 14 taxonomic groups and their ecotones, using pitfall traps. The abundance of epigeic arthropods was affected by moisture, pH of soil, and levels of phosphorus, potassium and nitrogen. We observed a greater average number of individuals in the ecotones than in the fields in the months of September and October and in Triticum aestivum crops. During other months and for the remaining crops, we did not notice this difference. This contributed new information regarding the ecotone rule. Our results suggest that agricultural intensification affects epigeic arthropods in the crop Triticum aestivum, which is important for the production of biomass and also affects crop yields.
1. Introduction
Agricultural landscapes vary with the cropping system, topography and intensity of management. Agriculture is considered one of the key drivers of biodiversity loss [1,2]. Agricultural interventions affect the level of agroecosystem biodiversity and mainly contribute to a reduction in abundance of edaphic groups [3]. The use of hedges and field margins (ecotones) in the landscape creates a specific habitat for insects, birds, plants, and other animals [4,5]. Ecotones, serving as biodiversity refuges, can help lessen the effects of agricultural practices. They benefit biodiversity by harbouring diverse plant communities that support and act as shelters or overwintering sites for invertebrate communities [6]. This means that flora has natural value, because it can support agricultural production by attracting pollinating insects or other beneficial animals that can regulate pest populations [7,8]. Field margins also act as ecological corridors, assuring connectivity between non-crop areas and fields and preventing separation from important landscape patches [9].
Soil communities play an important role in the decomposition of organic matter in the biogeochemical cycles of the biogenic elements carbon, nitrogen, sulphur and phosphorus. Therefore, they also are important for the sustainability of the soil ecosystem via their contribution to the transformation and degradation of waste and toxic substances. The response of soil organisms is a key part of the sustainability of the soil ecosystem [10,11], being considered a bioindicator of the environment [12,13,14,15]. Epigeic arthropods constitute an important part of the biodiversity in agricultural areas, fulfilling a wide variety of ecological roles that influence the function of the ecosystem. [16]. Predator and parasitoid species are viewed as beneficial for agriculture, and introducing them as biological control agents is common [17]. Phytophagous species have economic implications, as they may act as pests and become the target of insecticides. In general, arthropod communities are fundamental to agricultural ecosystems, with seasonal variation being a common trait, especially in areas with strong climatic seasonality [18].
One criterion for evaluating the sustainability of ecosystems is assessment of the fluctuations in soil quality, an important natural resource; few phenomena on our planet match the complexities of the processes within it. Agricultural land is a type of modified ecosystem with a significant human influence, wherein the course of natural processes has been disturbed. The soil reflects ecosystem metabolism, as within soils the bio-geochemical processes of all different ecosystem components are combined [19]. Soil quality can be evaluated using chemical, physical and biological indicators. To determine soil quality, appraisals of its organic matter [20], bulk density [21] and aggregate stability [22] are required. Biological monitoring is also required to correctly assess soil degradation and correlated risks [23].
The purpose of this study was to analyse the effect of an ecotone on the conditions of Brassica napus L., Pisum sativum L., Triticum aestivum L., T. spelta L., Zea mays L. and grass mixture with respect to the abundance and composition of epigeic arthropods. It was also intended to discover the influence of environmental variables (soil humidity, soil pH, and levels of potassium, phosphorus and nitrogen) on epigeic arthropods.
2. Materials and Methods
Research took place during the years 2018–2020, during which we collected epigeic arthropods from six types of agricultural crops. These types of agricultural crops were examined throughout each year, as the position of crops in the fields changed every year. In winter-planted crops (Brassica napus, Pisum sativum, Triticum aestivum, T. spelta), epigeic arthropods were collected from November to July. In the spring-planted crop (Zea mays), epigeic arthropods were trapped from April to October. In the grass mixture, epigeic arthropods were collected all year round (Figure 1). We used five pitfall traps (750 mL) for each site, which were placed in a line at distances of 10 m. The placement of the pitfall traps varied; the first and second pitfall traps were located in the ecotones (meadow type), and the other traps were inside the fields (Figure 2). Ecotone-placed traps were always at the edge of the fields, next to the white line; the average width of the ecotones was 15 m. Formaldehyde solution (4%) for material fixation during regular collection at two-week intervals was used. Pitfall traps were always in the fields and were collected at two-week intervals. The nomenclature of epigeic arthropods was established according to the work of [24,25]. The study area was located in the Podunajská pahorkatina—Danubian upland geomorphological unit (in southwestern Slovakia) in the cadastral territory of Nitra. The altitude of the monitored area was approximately 130 m above sea level with a brown soil type. The study area is considered a warm arid climate with mild winters. The mean temperature ranges during each month were as follows: January −5–5 °C, February −3–6 °C, March 0–12 °C, April 10–20 °C, May 15–22 °C, June 18–27 °C, July 22–29 °C, August 20–29 °C, September 15–23 °C, October 8–15 °C, November −3–7 °C, December −5–5 °C. The average precipitation for each month was as follows: January 30 mm, February 26 mm, March 35 mm, April 12 mm, May 65 mm, June 77 mm, July 41 mm, August 57 mm, September 64 mm, October 54 mm, November 40 mm and December 55 mm.
The insecticide FORCE (Syngenta, Basel, Switzerland), a granular insecticide intended for soil application to control soil pests, was applied to the crops. Insects were killed through respiratory and tactile poison ingestion. The preparation had a fast effect and a strong residual (repellent) action against a wide range of soil pests from the orders of Coleoptera, Aranea, and Hymenoptera. The applied dose was administered uniformly at a concentration of 12–15 kg per ha each year for the duration of the research. Solinure FX fertilizer (Medilco Hellas S.A., Athens, Greece) containing chlorides and urea, was applied to the crops and was intended for field fertility. Due to its acidifying effect, it contributed to lowering the soil pH.
Conventional tillage was based on annual tillage plowing, incorporating crop residues and weeds into the soil. The soil was plowed three times and turned. Pre-sowing preparation and sowing were combined. Machines with driven working tools were used in conjunction with a seed drill. When sowing, it was possible to use seed coulters with an obtuse angle of penetration into the soil.
At each pitfall trap location we removed stones and fallen leaves from crops and sampled the soil to a depth of 15 cm for analysis. Five samples (one from each of five sites) were taken from each field every two weeks over the three years of the study period. Subsequently, environmental variables (N, P, K, pH, moisture) were analysed using a soil moisture meter (Rapitest 3 1835, Luster Leaf, Illinois, IL, USA) and a pH meter (Dexxer PH-03, Luboň, Poland). We thoroughly wetted the broken-up soil with water (ideally distilled or de-ionised water) to a muddy consistency. We wiped the meter probe clean with a tissue or paper towel and inserted it into the soil up to the probe base (7–10 cm). We waited one minute and wrote down the value. We converted the measured values into units of mg. The average values of environmental variables at traps for all crops during the years 2018–2020 are shown in Table 1.
2.1. Database Quality
The data obtained were saved in the Microsoft SQL Server 2017 database program (Express Edition) (Microsoft Corporation, Washington, DC, USA), consisting of frequency tables for collections and measured environmental variables (pH, soil moisture, potassium, phosphorus, nitrogen). The database also contained code tables for study sites and their variables (crops, habitat, locality name, cadastral area, altitude, coordinates of localities). Matrices for statistical calculations using [26] were programmed.
2.2. Statistical Analyses
Multivariate analysis (redundancy analysis, RDA) was employed to determine the dependencies between objects (abundance of epigeic arthropods, soil characteristics, crops). The number of individuals of each crop in pitfall traps 1–5 was used as a matrix. We tested the statistical significance of soil pH, soil moisture, and levels of potassium, phosphorus and nitrogen with the Monte Carlo permutation test (iterations = 499) in the Canoco5 program [27].
To determine the normality of the data distribution, we used the Shapiro–Wilk W-test for analysis in the statistical program [28], As the data distribution did not achieve normality (p-value = 0.00), we used the nonparametric Kruskal–Wallis test (ANOVA) to test the differences in abundance between pitfall traps.
3. Results
Over the three-year research period, we found a total of 31,315 individuals belonging to 14 taxonomic groups in the studied area. Taxa of Coleoptera (45.65%), Collembola (17.41%) and Julida (15.59%) had an eudominant representation of individuals. Araneae (6.65%) demonstrated the dominant group of individuals in crops. Other groups of epigeic arthropods had subdominant to subrecendent representation (Table 2).
Multivariate analysis of arthropod abundance over the study period was determined using redundancy analysis (RDA, SD (length of gradient) = 1.10 on the first ordination axis). We observed relationships between the abundance of epigeic arthropods and environmental variables (pH of the soil, soil moisture, potassium, phosphorus, nitrogen). The values of the explained variability in taxonomic data were 54.6% on the first ordination axis and 66.5% on the second ordination axis. The cumulative variability of the set of species explained by environment variables was on the first ordination axis 73.8% and on the second axis 89.9%. Using the Monte Carlo permutation test, we identified statistically significant effects of soil moisture (p = 0.0267, F(1.3376) = 2.0521, df = 3), pH of soil (p = 0.0188, F(1.9583) = 2.0297, df = 3), phosphorus (p = 0.0458, F(1.1012) = 3.0885, df = 3), potassium (p = 0.0278, F(1.2125) = 1.9810, df = 3) and nitrogen (p = 0.0485, F(1.5986) = 2.2546, df = 3) on the structure of arthropod distribution. The selected variables were not mutually correlated with the maximum value of the inflation factor = 4.9440. The ordination graph (triplot) had arthropod predominance ordered around pitfall traps one and two, located in the ecotone. The number of taxa of arthropods decreased in the pitfall traps located inside the fields (3–5). Environmental variable pH correlated with the prevalence of Diptera, Hymenoptera, Haplotaxida, Araneae, Lithobiomorpha, Isopoda, Orthoptera at pitfall trap 1. Environmental variables moisture (%), potassium (mg), phosphorus (mg), nitrogen (mg) correlated with the prevalence of Coleoptera, Julida, and Opilionida at pitfall traps 2, 3 and 4 (Figure 3).
In the second stage of multivariate analysis using redundancy analysis (RDA, SD (length of gradient) = 1.20 on the first ordination axis), we observed relationships between epigeic arthropods groups and crops (Brassica napus, Pisum sativum, Triticum aestivum, T. spelta, Zea mays, grass mixture). The values of the explained variability in taxonomic data were 55.4% on the first ordination axis and 84.3% on the second ordination axis. The cumulative variability of the set of species explained by environmental variables (crops) was on the first ordination axis 60.1% and on the second axis 92.7%. The selected variables were not mutually correlated with the maximum value of the inflation factor = 1.3164. The ordination graph (triplot) had arthropod predominance ordered around pitfall traps one and two, located in the ecotone, and pitfall trap three, located in a field on the border with the ecotone. This trend was reflected in all studied crops. Pitfall traps four and five were located deeper into the field, which was associated with a reduced number of taxa caught in these pitfall traps (Figure 4).
We confirmed statistically significant differences in the number of individuals among pitfall traps 1–5 in Triticum aestivum (p = 0.0462, F(1.5716) = 4.99, df = 4), Triticum spelta (p = 0.049, F(3.0531) = 4.41, df = 4), and Zea mays (p = 0.0075, F(1.0148) = 4.329, df = 4). No significant difference was found in the number of individuals among pitfall traps 1–5 in grass mixture (p = 0.9331, F(4.393) = 0.8391, df = 4), Pisum sativum (p = 0.8227, F(4.103) = 1.5223, df = 4), or Brassica napus (p = 0.9113, F(4.84) = 0.9898, df = 4) (Figure 5). The results showed significantly more individuals in pitfall traps 1, 2 (located in the ecotones) than in pitfall traps 3, 4, 5 (located in the fields) in the crop Triticum aestivum. In the grass mixture, Pisum sativum, Triticum spelta and Zea mays we did not find a decline in the number of individuals in traps located inside the fields.
We confirmed a statistically significant difference in the number of individuals among pitfall traps 1–5 in May (p = 0.05, F(1.3636) = 4.73, df = 4), July (p = 0.0449, F(3.7223) = 4.134, df = 4), August (p = 0.0082, F(1.449) = 4.120, df = 4), September (p = 0.05, F(2.992) = 4.148, df = 4), and October (p = 0.0372, F(4.254) = 4.82, df = 4). A statistically insignificant difference was observed in the number of individuals among pitfall traps 1–5 in March (p = 0.6082, F (4.72) = 2.7056, df = 4), April (p = 0.7222, F(4.128) = 2.0735, df = 4), June (p = 0.5951, F(4.212) = 2.781, df = 4), and November (p = 0.6743, F(4.80) = 2.3353, df = 4) (Figure 6). The results showed a greater average number of individuals in pitfall traps 1, 2 (located in the ecotones) than in pitfall traps 3, 4, 5 (located in the fields) during September and October. In March, April, May, July and August there was no such difference observed.
4. Discussion
In intensively managed agricultural landscapes, ecotones survive as remnants, of which field margins are usually the most common structures. Boundaries (ecotones) have an important agricultural function, and their role in environmental and conservation functions is acquiring greater significance. Agricultural operations render them susceptible to disturbance, particularly from pesticide drift and eutrophication from fertiliser misplacement [29]. Epigeic arthropods living in agricultural landscapes have a greater tolerance than the epigeic arthropods of natural habitats [30]. They also achieve high local density due to the influence of agriculture, and field margins support the most abundant and diverse communities of soil arthropods [31]. We recorded an arthropod community dominated by Coleoptera, Collembola, Julida and Araneae. The great abundance of these groups influenced the maintenance of the natural balance and the substance cycle of the biogenic elements in ecosystems such as carbon, nitrogen, sulphur and phosphorus. The dominance of Hymenoptera (Formicidae) and Coleoptera has been described as a general trait of ground-dwelling assemblages [32]. Their activities accelerate the decomposition of plant residues, aerate the soil and improve soil structure and quality [33]. The presence of other epigeic arthropods is heterogeneous and may depend on the management regime and the surrounding vegetation [34].
The scale, structure, use and management of land can affect the composition of fields. These features may be sources of weeds, pests and disease; ecotones may be of great importance in providing habitats for species beneficial for agriculture [35]. Using a multivariate model, we demonstrated the positive influence of environmental variables within ecotones on the abundance of soil arthropods. Thus, our results agree with the results of [36], who observed a decline in arthropods with increasing land use. In conditions of complex land use, ecotones are numerous, whilst fewer ecotones may be available in less complex systems. As a result, coexistence through resource allocation in simplified systems is likely to be limited, resulting in a reduction in species richness. More complex habitat and structure may allow greater access to food resources [37]. The explanation for greater species richness in less disturbed habitats is that in frequently or intensely disturbed environments, community composition cannot progress beyond early pioneer stages. The results are environments that favour early successional species and disadvantage later successional species [38]. Whilst more data on the impact of introduced margin strips on different taxa are required, the beneficial effects of botanical diversity, particularly wild flowers, have an effect on invertebrate diversity [39,40,41].
Traps located near the field margins captured more arthropods than those located at medium and large distances from the ecotone. Ecotones bordering crop fields provide stable shelter, food sources, and microclimates to a wide range of arthropods [8]. In our study traps, the number of individual arthropods captured in Triticum aestivum crops was distinct from the number of individual arthropods captured in grass mixture, Pisum sativum, Triticum spelta, and Zea mays regarding differences between pitfall traps 1, 2 (located in the ecotones) and 3, 4, 5 (located in the fields), which may have been affected by the width of the ecotone. Common crop management practices may serve to increase the frequency and severity of disturbance regimes [42]; for example, tillage disrupts a number of beneficial invertebrate groups [43,44,45].
The prominence of arthropod abundance from month to month is related to fluctuations in climatic factors (such as temperature, precipitation and day length) [46]. These factors, in combination with distinct life histories, are thought to greatly influence arthropod assemblages [47]. The number of individual arthropods captured in September and October was distinct from the number of individuals of arthropods captured in March, April, May, July and August regarding differences between pitfall traps 1, 2 (located in the ecotones) and 3, 4, 5 (located in the fields), which may have been affected by the weather and climate. The trend of decreasing numbers of individual arthropods towards the centre of fields was not observed in March, April, May, July and August, when the ecotone rule did not manifest. Differences in the number of arthropods were affected by the different weather conditions during the seasons and months [48]. The monthly trends regarding abundance of arthropod groups, with individual taxa exhibiting distinct seasonal patterns, reflected the high variability among the life-cycles of the captured groups [49].
5. Conclusions
Our results provided new knowledge regarding the preference of epigeic arthropods in conditions of Brassica napus, Pisum sativum, Triticum aestivum, T. spelta, Zea mays, and grass mixture, and of the influence of ecotones on their occurrence. We confirmed a decrease in the average number of individuals in pitfall traps located further from the ecotone during the months September and October and in the crop Triticum aestivum. Interestingly, this trend did not apply to the other months or for the remaining crops, which did not confirm the ecotone rule (that the highest diversity is found in semi-natural areas). Based on the above facts, our results have provided new information regarding this ecotone rule. The dispersion of epigeic arthropods was also positively influenced by soil moisture, pH of soil, and levels of phosphorus, potassium and nitrogen. Epigeic arthropods are important drivers of ecosystem functions such as nutrient cycling, pest control and maintenance of soil structure. Ecotones are important for increasing the number of epigeic arthropods, thereby increasing biomass, which affects crop yields. Therefore, it is important to promote strategies for addressing the conservation of arthropods in agricultural landscapes.
Author Contributions
Conceptualization, V.L.; methodology, V.L.; software, V.L.; validation, V.L., K.P. and J.S.; formal analysis, V.L., K.P. and J.S.; investigation, V.L.; resources, V.L.; data curation, V.L.; writing—original draft preparation, V.L.; writing—review and editing, V.L.; visualization, V.L.; supervision, V.L.; project administration, V.L., K.P. and J.S.; funding acquisition, V.L. and K.P. All authors have read and agreed to the published version of the manuscript.
Funding
This research was supported by the grants VEGA 1/0604/20 Environmental assessment of specific habitats in the Danube Plain and KEGA No. 019UKF-4/2021 Creation and innovation of education—Zoology for Ecologists, part—Invertebrates.
Institutional Review Board Statement
Not applicable.
Informed Consent Statement
Not applicable.
Data Availability Statement
Not applicable.
Conflicts of Interest
The authors declare no conflict of interest.
References
- Dudley, N.; Alexander, S. Agriculture and biodiversity: A review. Biodiversity 2017, 18, 45–49. [Google Scholar] [CrossRef]
- Stoate, C.; Boatman, N.D.; Borralho, R.J.; Carvalho, C.R.; de Snoo, G.R.; Eden, P. Ecological impacts of arable intensification in Europe. J. Environ. Manag. 2001, 63, 337–365. [Google Scholar] [CrossRef]
- Gill, H.K.; McSorley, R.; Branham, M. Effect of organic mulches on soil surface insects and arthropods. Fla. Entomol. 2011, 94, 226–232. [Google Scholar] [CrossRef]
- Haddaway, N.R.; Brown, C.; Eggers, S.; Josefsson, J.; Kronvang, B.; Randall, N.; Uusi-Kämppä, J. The multifunctional roles of vegetated strips around and within agricultural fields. A systematic map protocol. Environ. Evid. 2016, 5, 18. [Google Scholar] [CrossRef] [Green Version]
- Nowakowski, M.; Pywell, R.F. Habitat Creation and Management for Pollinators; Centre for Ecology & Hydrology: Wallingford, UK, 2016; p. 92. [Google Scholar]
- Marshall, E.J.P. Agricultural landscapes: Field margin habitats and their interaction with crop production. J. Crop Improv. 2004, 12, 365–404. [Google Scholar] [CrossRef]
- Brussaard, L.; De Ruiter, P.C.; Brown, G.G. Soil biodiversity for agricultural sustainability. Agric. Ecosyst. Environ. 2007, 121, 233–244. [Google Scholar] [CrossRef]
- Smith, J.; Potts, S.G.; Woodcock, B.A.; Eggleton, P. Can arable field margins be managed to enhance their biodiversity, conservation and functional value for soil macrofauna? J. Appl. Ecol. 2008, 45, 269–278. [Google Scholar] [CrossRef]
- New, T.R. Invertebrate Conservation and Agricultural Ecosystems; Cambridge University Press: Cambridge, UK, 2005; p. 368. [Google Scholar]
- Porhajašová, J.; Noskovič, J.; Rakovská, A.; Babošová, M.; Čeryová, T. Biodiversity and dynamics of occurence of epigeic groups in different types of farming. Acta Hortic. Regiotect. 2015, 18, 5–10. [Google Scholar] [CrossRef] [Green Version]
- Porhajašová, J.; Bartošová, L.M.; Noskovič, J.; Ondrišík, P. Long-term developments and biodiversity in Carabid and Staphylinid (Coleoptera: Carabidae and Staphylinidae) fauna during the application of organic fertilizers under agroecosystem conditions. Pol. J. Environ. Stud. 2018, 27, 2229–2235. [Google Scholar] [CrossRef]
- Krumpálová, Z. Epigeic spiders (Araneae) of one Middle Danube floodplain forest. Biologia 2002, 57, 161–169. [Google Scholar]
- Krumpálová, Z.; Krumpál, M.; Štrbík, I. Classification of epigeic spiders (Araneae) at the western part of the Carpathians (Slovakia). Biologia 2009, 64, 116–123. [Google Scholar] [CrossRef]
- Langraf, V.; David, S.; Babosová, R.; Petrovičová, K.; Schlarmannová, J. Change of ellipsoid biovolume (EV) of ground beetles (Coleoptera, Carabidae) along an urban–suburban–rural gradient of central Slovakia. Diversity 2020, 12, 475. [Google Scholar] [CrossRef]
- Langraf, V.; Petrovičová, K.; David, S.; Svoradová, A.; Schlarmannová, J. Prediction of ecological importance of Carabidae biotopes using community index of the ground beetles (Iks) in the southern part of Central Slovakia. Appl. Ecol. Environ. Res. 2020, 18, 1197–1210. [Google Scholar] [CrossRef]
- Swift, M.J.; Vandermeer, J.; Ramakrishnan, P.S.; Anderson, J.M.; Ong, C.K.; Hawkins, B.A. Biodiversity and agroecosystem function. In Functional Roles of Biodiversity; Mooney, H.A., Cushman, J.H., Medina, E., Sala, O.E., Schulze, E.D., Eds.; Wiley: New York, NY, USA, 1996; pp. 261–297. [Google Scholar]
- Starý, P.; Gerding, M.; Norambunea, H.; Remaudiere, G. Environmental research on aphid parasitoid biocontrol agents in Chile (Hym., Aphidiidae; Hom., Aphidoidea). J. Appl. Entomol. 1993, 115, 292–306. [Google Scholar] [CrossRef]
- Berg, M.P.; Bengtsson, J. Temporal and spatial variability in soil food web structure. Oikos 2007, 116, 1789–1804. [Google Scholar] [CrossRef]
- Schoenholtz, S.H.; Van Miegroet, H.; Burger, J.A. A review of chemical and physical properties as indicators of forest soil quality: Challenges and opportunities. For. Ecol. Manag. 2000, 138, 335–356. [Google Scholar] [CrossRef]
- Li, Y.; Lindstrom, M.J.; Zhang, J.; Yang, J. Spatial variability of soil erosion and soil quality on hillslopes in the Chinese Loess Plateau. Acta Geol. Hisp. 2001, 35, 261–270. [Google Scholar]
- Gilley, J.E.; Doran, J.W.; Eghball, B. Tillage and fallow effects on selected soil quality characteristics of former conservation reserve program sites. J. Soil Water Conserv. 2001, 56, 126–132. [Google Scholar]
- Six, J.; Elliott, E.T.; Paustian, K. Soil structure and soil organic matter. II. A normalized stability index and the effect of mineralogy. Soil Sci. Soc. Am. J. 2000, 64, 1042–1049. [Google Scholar] [CrossRef]
- Turco, R.F.; Kennedy, A.C.; Jawson, M.D. Microbial indicators of soil quality. In Defining Soil Quality for a Sustainable Environment; Doran, J.W., Coleman, D.C., Bezdicek, D.F., Stewart, B.A., Eds.; SSSA: Madison, WI, USA, 1994; pp. 73–90. [Google Scholar]
- Majzlan, O. Bezchordáty a Chordáty; Danubiaprint, A.S.: Bratislava, Slovakia, 2009; p. 286. [Google Scholar]
- Pokorný, V.; Šifner, F. Book of Insecta; Paseka: Prague, Czeck Republic, 2004; p. 221. [Google Scholar]
- Microsoft SQL Server 2017; Microsoft Corporation: Redmond, WA, USA, 2017.
- Ter Braak, C.J.F.; Šmilauer, P. Canoco Reference Manual and User′s Guide: Software for Ordination, version 5.0; Microcomputer Power: Ithaca, NY, USA, 2012. [Google Scholar]
- Statistica Cz (Softwarový Systém na Analýzu Dat); Version 7; Statsoft, Inc: Tulsa, OK, USA, 2004; Available online: www.StatSoft.Cz (accessed on 1 June 2010).
- Kleijn, D.; Snoeijing, G.I.J. Field boundary vegetation and the effects of agrochemical drift: Botanical change caused by low levels of herbicide and fertilizer. J. Appl. Ecol. 1997, 34, 1413–1425. [Google Scholar] [CrossRef]
- Bote, P.J.; Romero, A.J. Epigeic soil arthropod abundance under different agricultural land uses. Span. J. Agric. Res. 2012, 10, 55–61. [Google Scholar] [CrossRef] [Green Version]
- Magura, T.; Ferrante, M.; Lövei, L.G. Only habitat specialists become smaller with advancing urbanization. Glob. Ecol. Biogeogr. 2020, 29, 1978–1987. [Google Scholar] [CrossRef]
- Lenoir, L.; Lennartsson, T. Effects of timing of grazing on arthropod communities in semi-natural grasslands. J. Insect Sci. 2010, 10, 60. [Google Scholar] [CrossRef] [Green Version]
- Holecová, M.; Lukáš, J.; Haraka′ová, E. Mravce (Hymenoptera, Formicidae) dubovo-hrabových lesov v okolí Bratislavy (JZ Slovensko). Folia Faun. Slov. 2003, 8, 63–69. [Google Scholar]
- Morris, T.; Campos, M. Predatory insects in olive-grove soil. Zool. Baetica 1999, 10, 149–160. [Google Scholar]
- Le Coeur, D.; Baudry, J.; Burel, F. Field margins plant assemblages: Variation partitioning between local and landscapefactors. Landsc. Urban Plan. 1997, 37, 57–71. [Google Scholar] [CrossRef]
- Attwood, S.J.; Maron, M.; House, A.P.N.; Zammit, C. Do arthropod assemblages display globally consistent responses to intensified agricultural land use and management? Glob. Ecol. Biogeogr. 2008, 17, 585–599. [Google Scholar] [CrossRef]
- Langellotto, G.A.; Denno, R.F. Responses of invertebrate natural enemies to complex-structured habitats: A meta-analytical synthesis. Oecologia 2004, 139, 1–10. [Google Scholar] [CrossRef]
- Büchs, W.; Harenberg, A.; Zimmermann, J.; Weiβ, B. Biodiversity, the ultimate agri-environmental indicator? Potential and limits for the application of faunistic elements as gradual indicators in agroecosystems. Agric. Ecosyst. Environ. 2003, 98, 99–123. [Google Scholar] [CrossRef]
- Thomas, C.F.G.; Marshall, E.J. Arthropod abundance and diversity in differently vegetated margins of arable fields. Agric. Ecosyst. Environ. 1999, 72, 131–144. [Google Scholar] [CrossRef]
- MacLeod, A. Attraction and retention of Episyrphus balteatus DeGeer (Diptera: Syrphidae) at an arable field margin with rich and poor floral resources. Agric. Ecosyst. Environ. 1999, 73, 237–244. [Google Scholar] [CrossRef]
- Frank, T. Density of adult hoverflies (Dipt. Syrphidae) in sown weed strips and adjacent fields. J. Appl. Entomol. 1999, 123, 351–355. [Google Scholar] [CrossRef]
- Thorbek, P.; Bilde, T. Reduced numbers of generalist arthropod predators after crop management. J. Appl. Ecol. 2004, 41, 526–538. [Google Scholar] [CrossRef]
- Sharley, D.J.; Hoffmann, A.A.; Thomson, L.J. The effects of soil tillage on beneficial invertebrates within the vineyard. Agric. For. Entomol. 2008, 10, 233–243. [Google Scholar] [CrossRef]
- Lionello, P.; Malanotte-Rizzoli, P.; Boscolo, R. Mediterranean Climate Variability; Elsevier Science: San Diego, CA, USA, 2006; p. 438. [Google Scholar]
- Leather, S.R.; Walters, K.F.A.; Bale, J.S. The Ecology of Insect Overwintering; Cambridge University Press: Cambridge, UK, 1995; p. 268. [Google Scholar]
- Simão, F.C.P.; Carretero, M.A.; Amaral, M.J.A.; Soares, A.M.V.M.; Mateos, E. Composition and seasonal ariation of epigeic arthropods in field margins of NW Portugal. Turk. J. Zool. 2015, 39, 404–411. [Google Scholar] [CrossRef]
- Greenberg, C.H.; McGrane, A. A comparison of relative abundance and biomass of ground-dwelling arthropods under different forest management practices. For. Ecol. Manag. 1996, 89, 31–41. [Google Scholar] [CrossRef]
- Faly, L.I.; Kolombar, T.M.; Prokopenko, E.V.; Pakhomov, O.Y.; Brygadyrenko, V.V. Structure of litter macrofauna communities in poplar plantations in an urban ecosystem in Ukraine. Biosyst. Divers. 2017, 25, 29–38. [Google Scholar] [CrossRef] [Green Version]
- Brygadyrenko, V.V. Community structure of litter invertebrates of forest belt ecosystems in the Ukrainian steppe zone. Int. J. Environ. Res. 2015, 9, 1183–1192. [Google Scholar] [CrossRef]
Figure 1.
Map of the study area. Years: (A) 2018, (B) 2019, (C) 2020. Crops: (1) Brassica napus, (2) Pisum sativum, (3) Zea mays, (4) Grass mixture, (5) Triticum aestivum, (6) Triticum spelta.
Figure 1.
Map of the study area. Years: (A) 2018, (B) 2019, (C) 2020. Crops: (1) Brassica napus, (2) Pisum sativum, (3) Zea mays, (4) Grass mixture, (5) Triticum aestivum, (6) Triticum spelta.
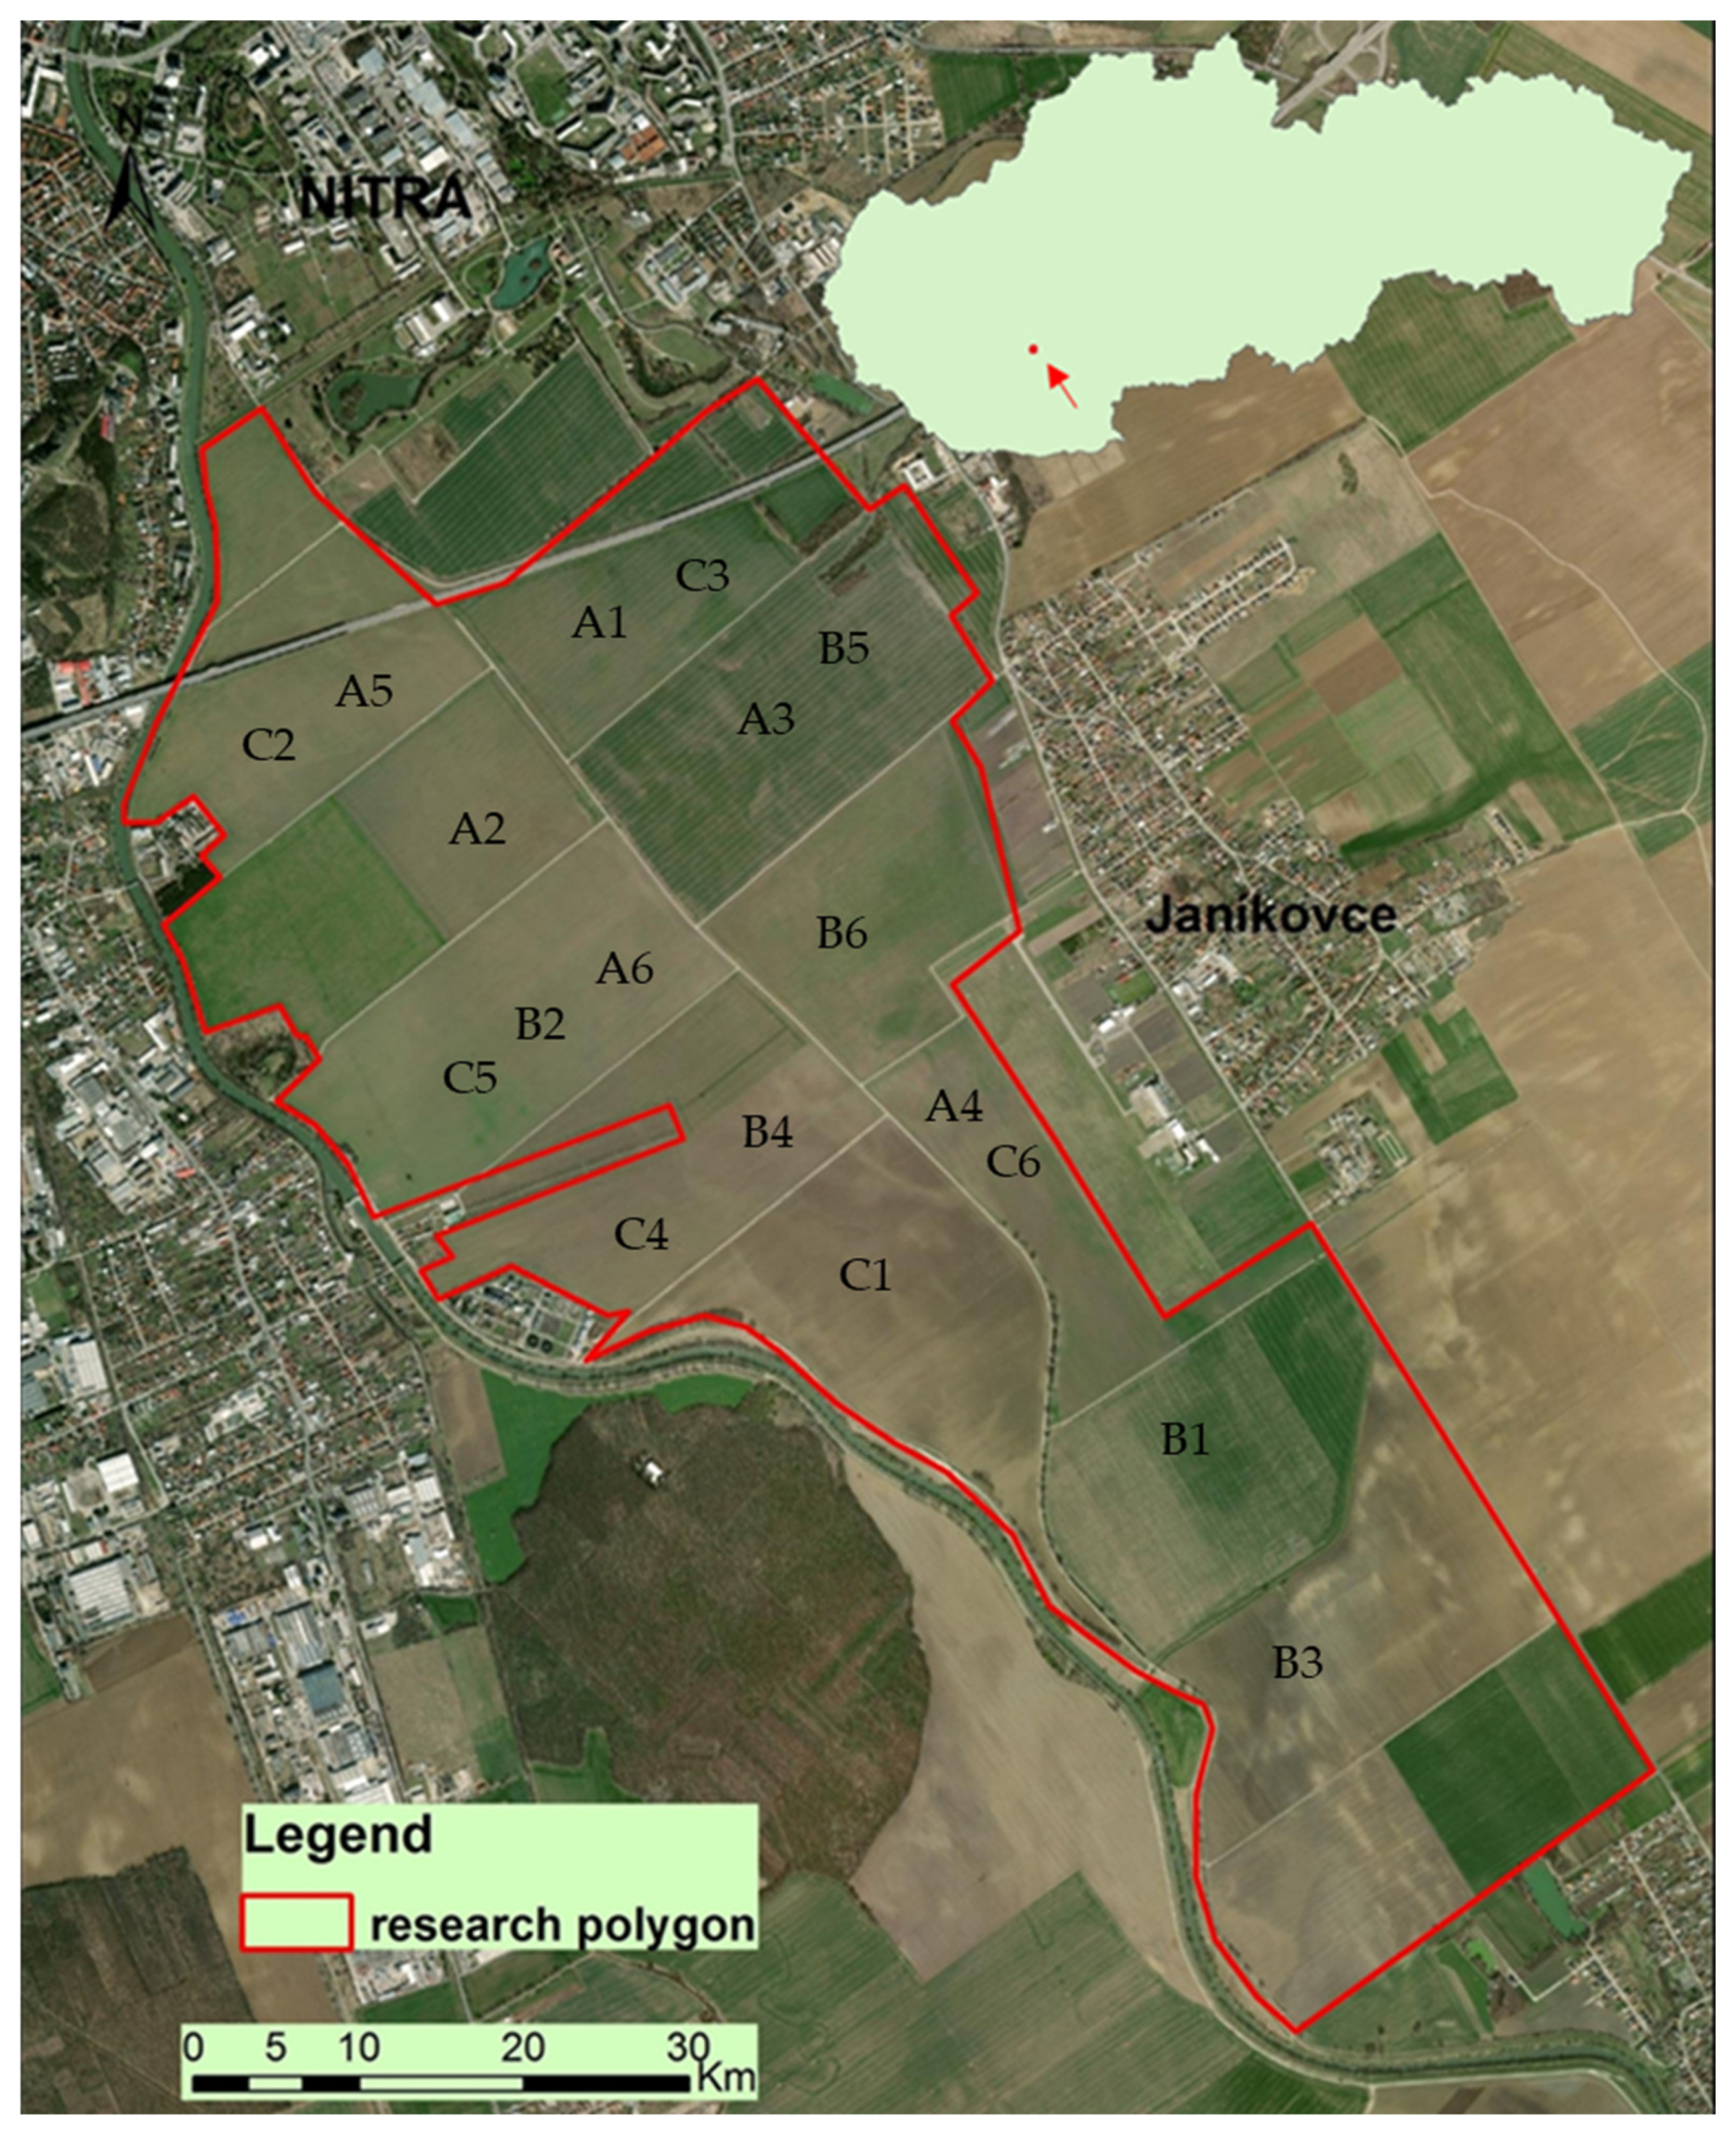
Figure 2.
Diagram of the sites of pitfall traps.
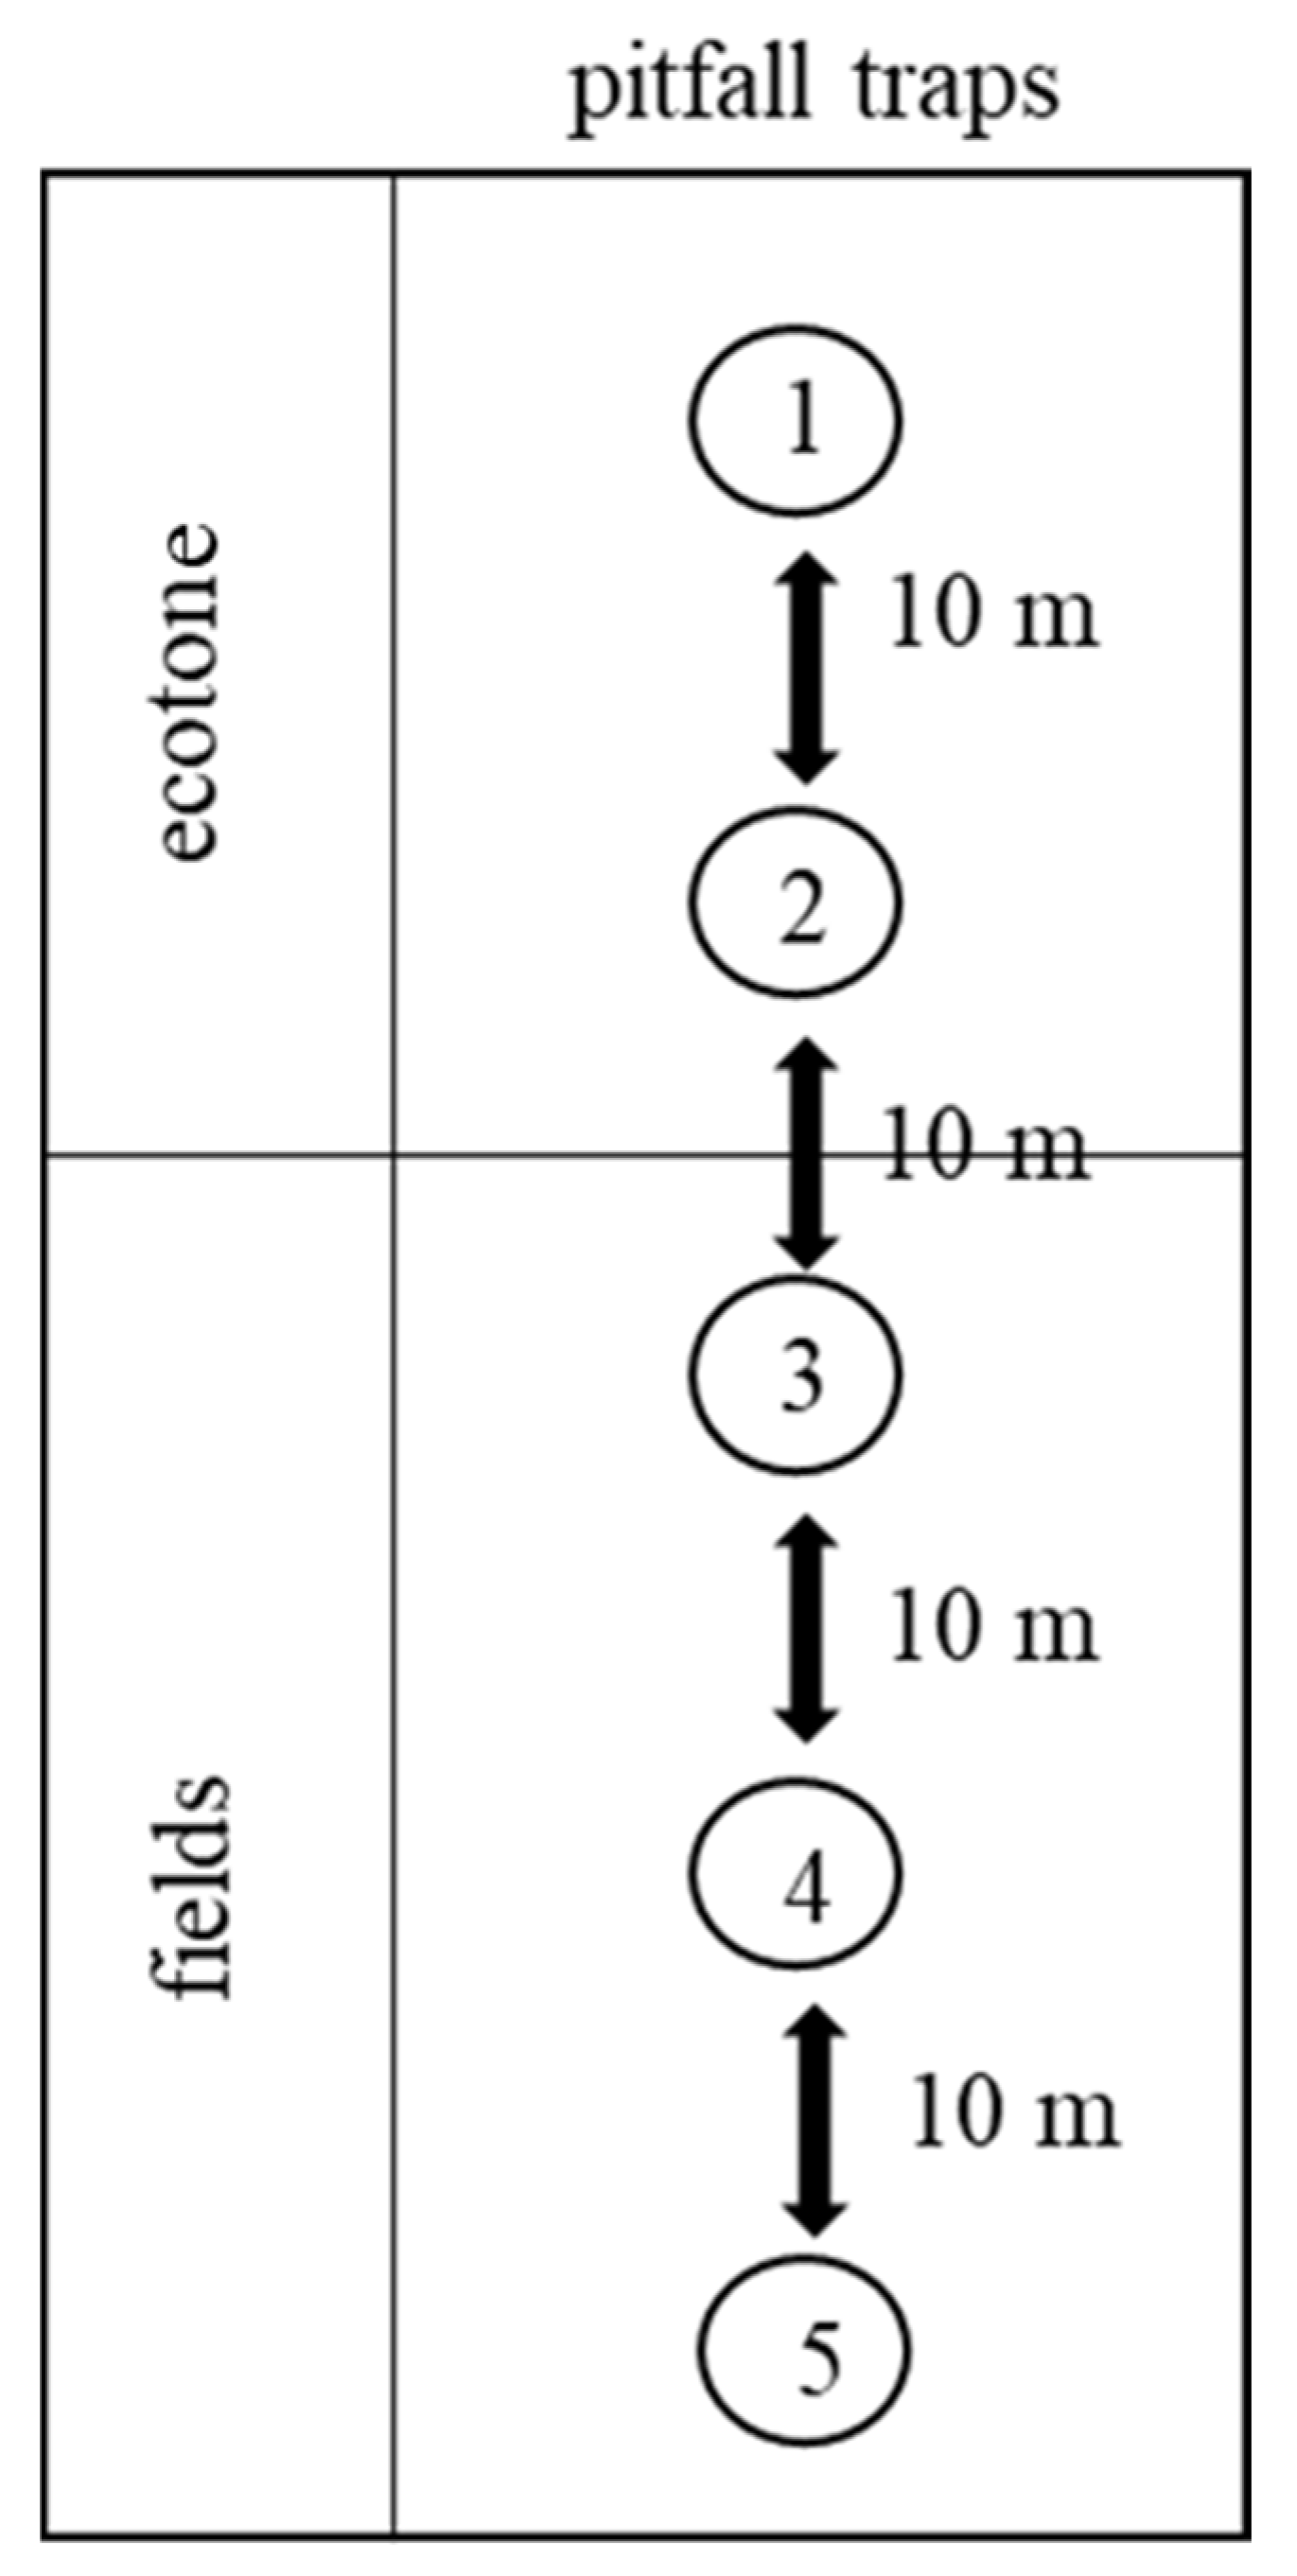
Figure 3.
RDA (redundancy analysis) analysis of arthropods with respect to environmental variables.
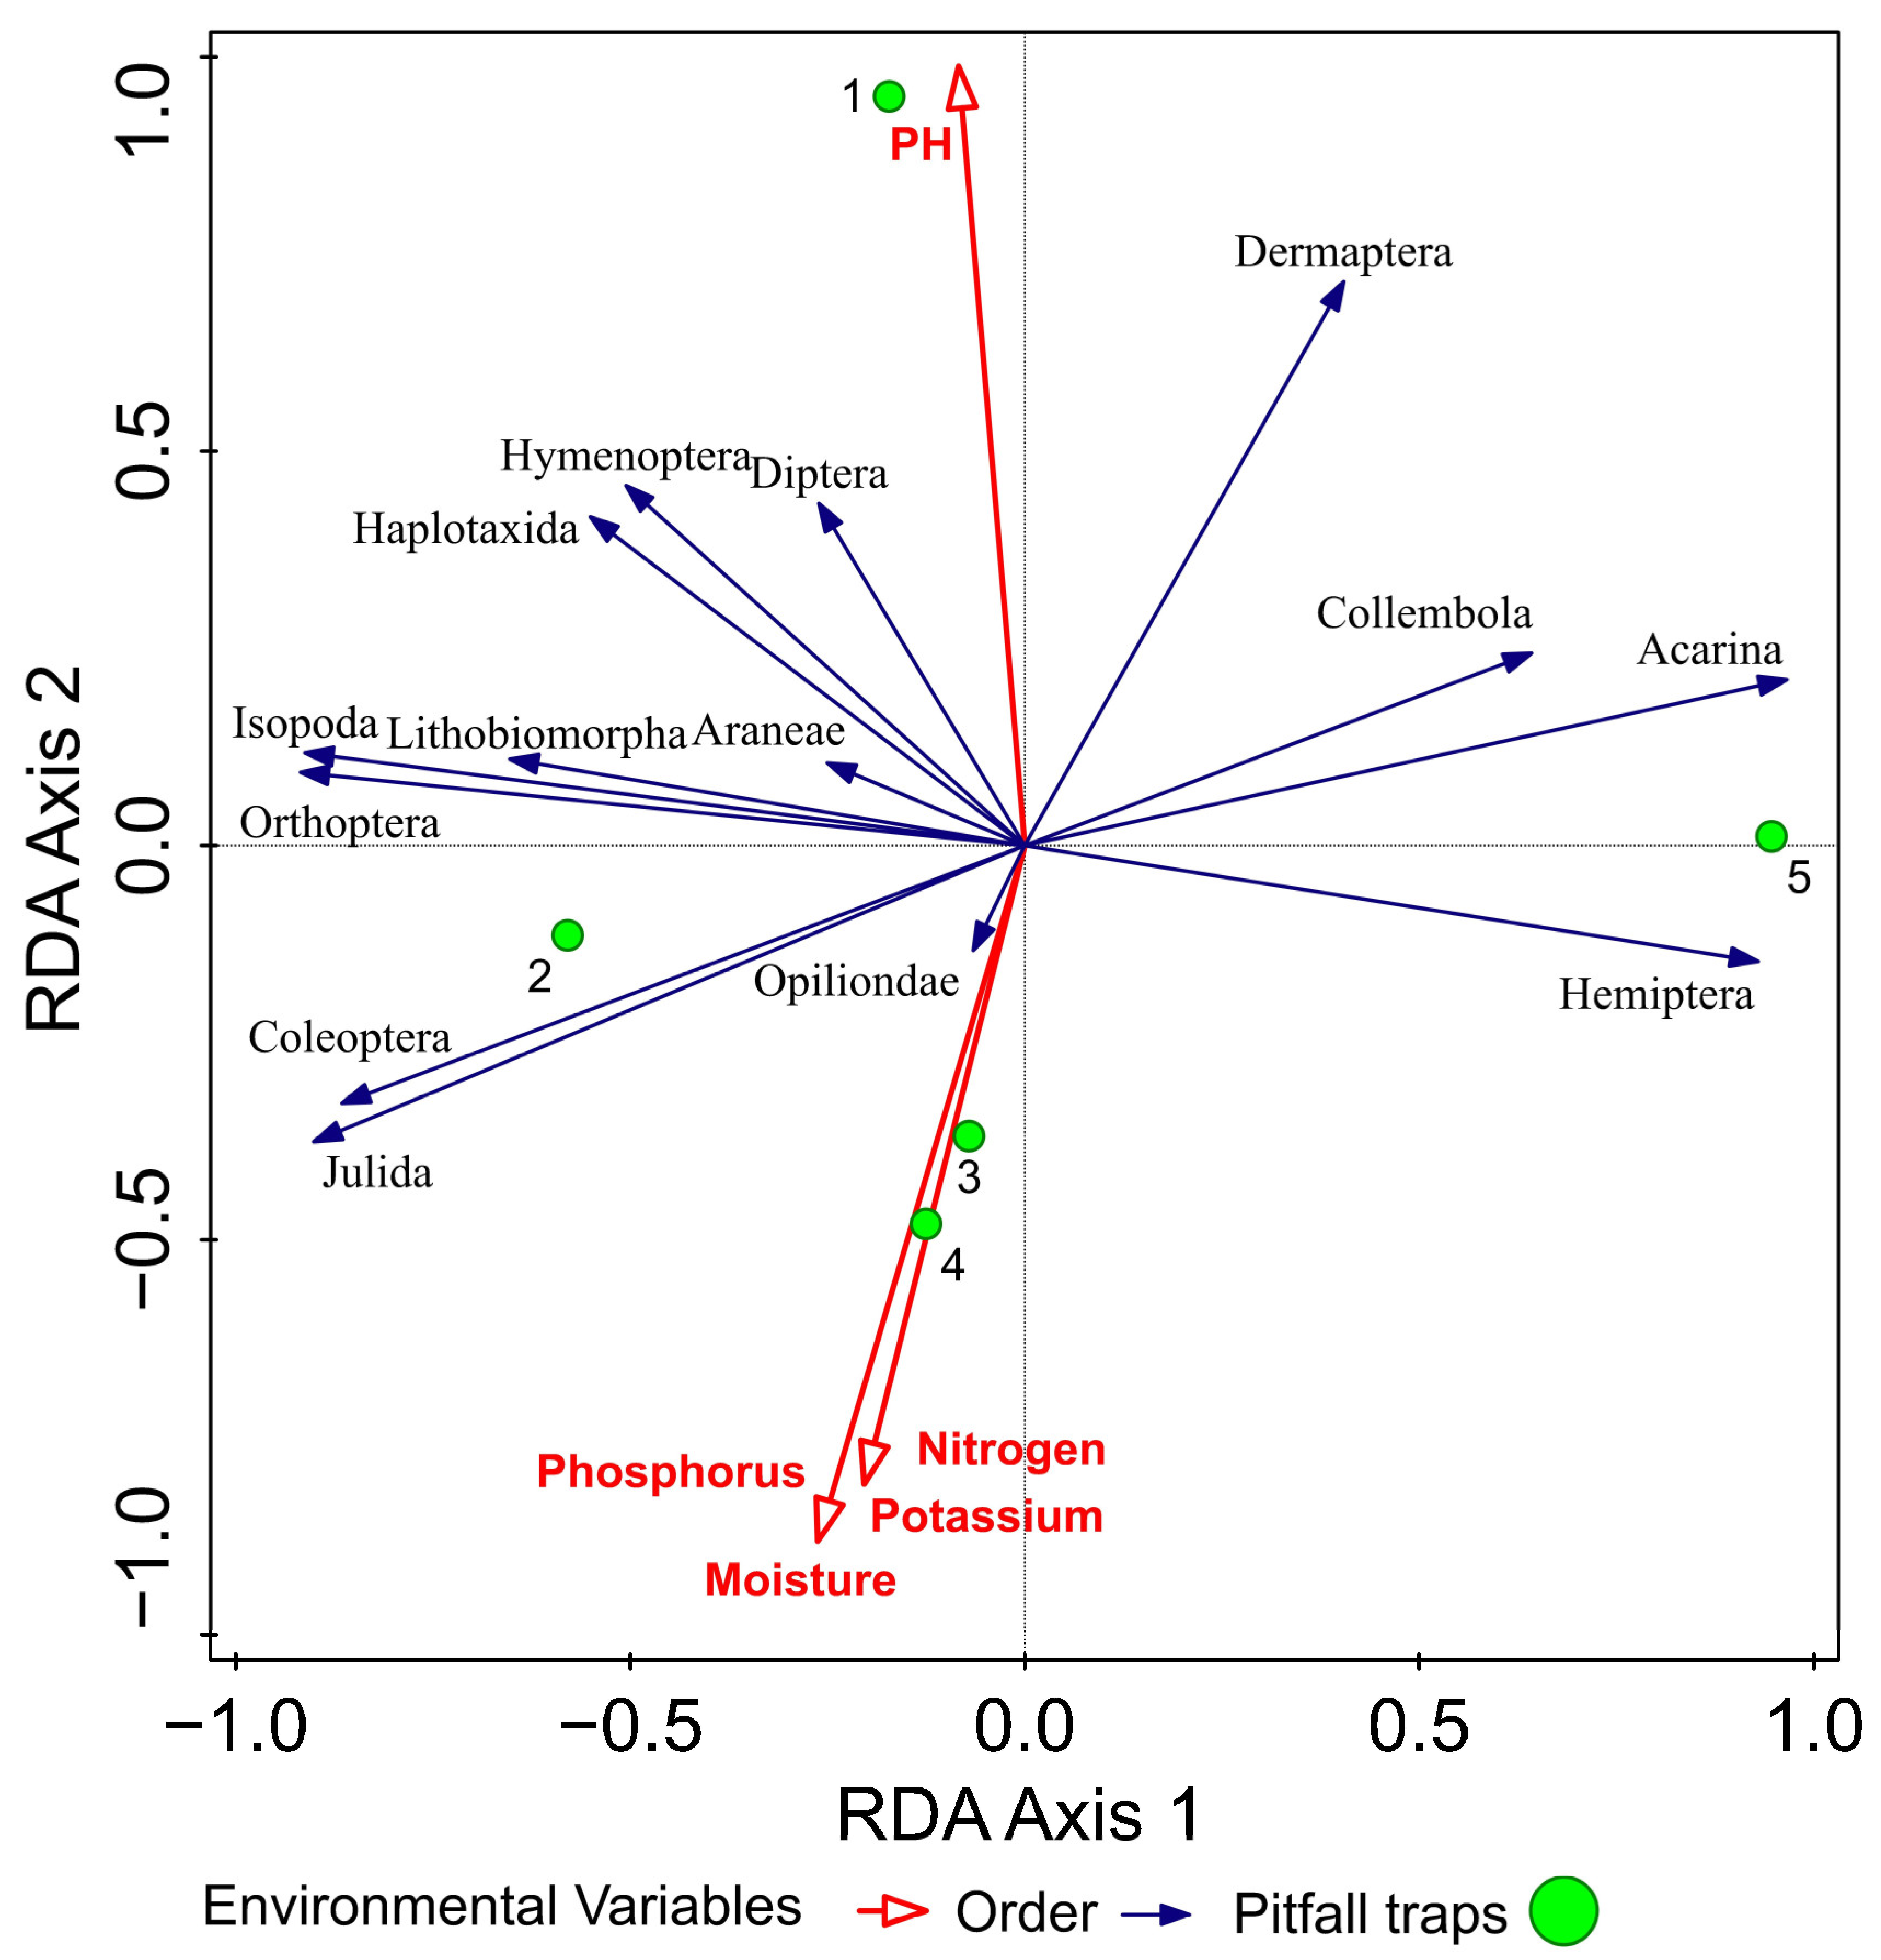
Figure 4.
RDA (redundancy analysis) analysis of arthropods with respect to crops.
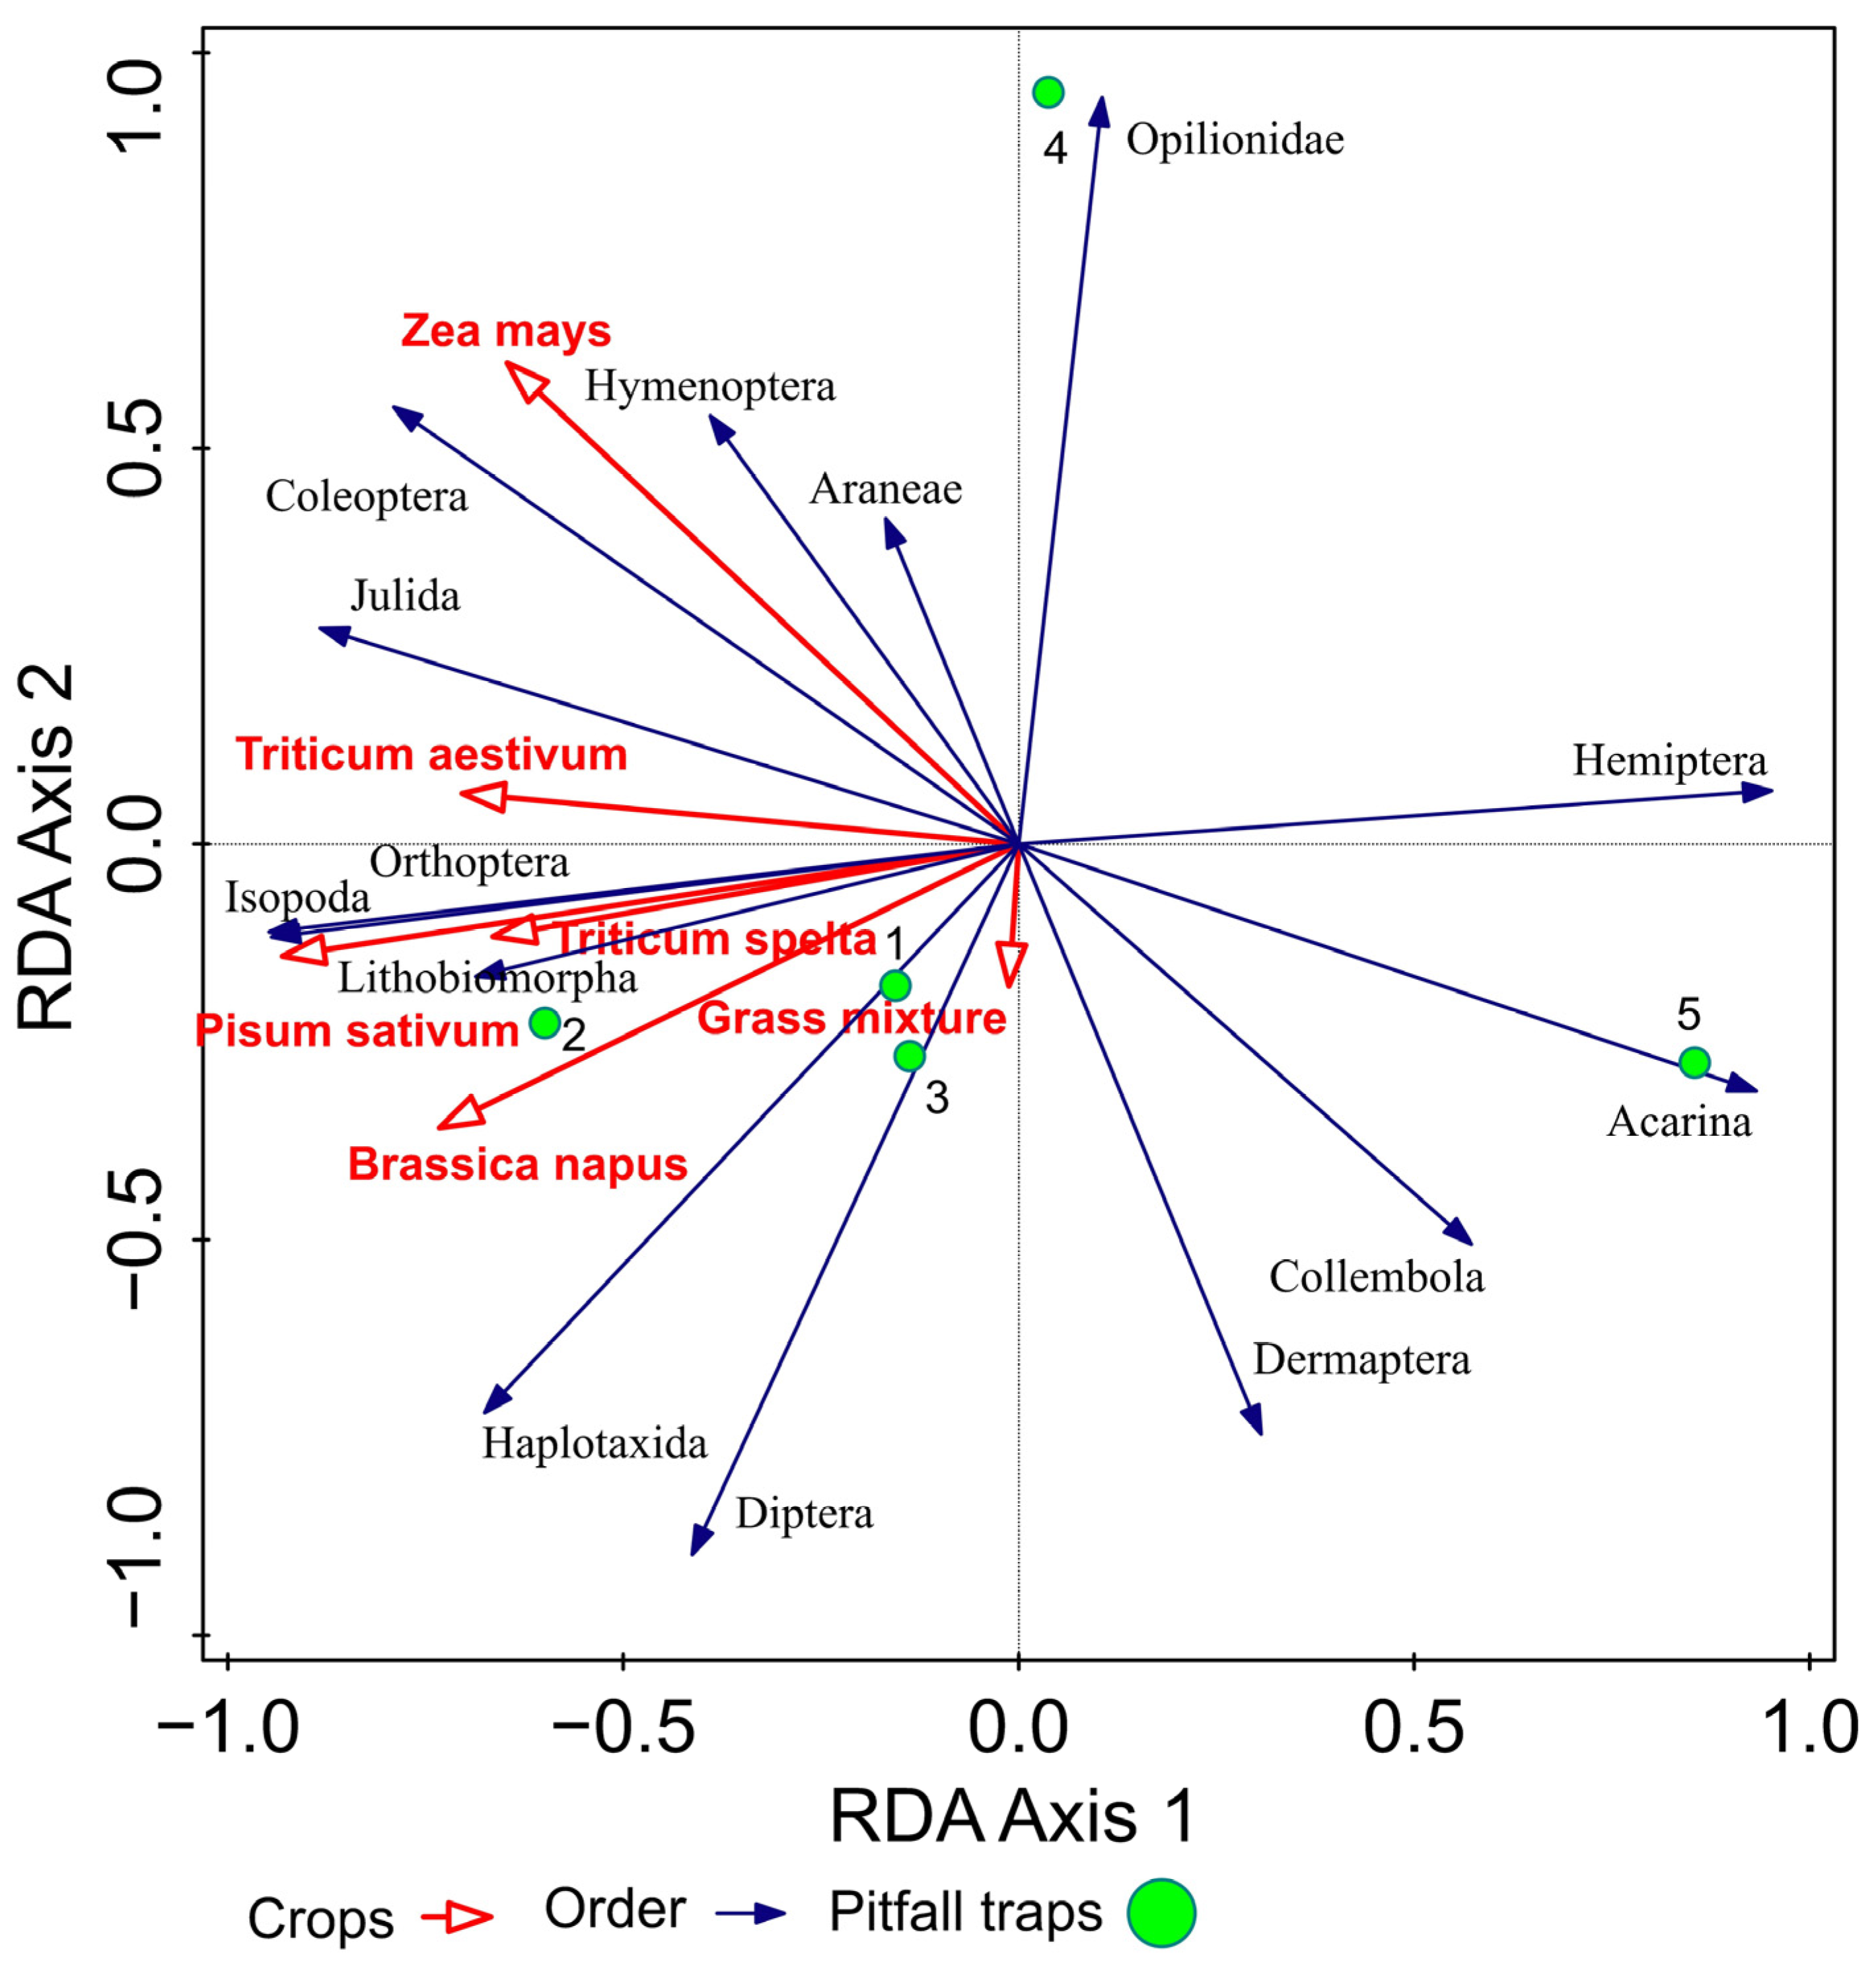
Figure 5.
Mean numbers of individuals (±95% Confidence Interval, CI) in pitfall traps located in the ecotones (traps 1 and 2) and in the fields (traps 3, 4, 5). Significant impact (*).
Figure 5.
Mean numbers of individuals (±95% Confidence Interval, CI) in pitfall traps located in the ecotones (traps 1 and 2) and in the fields (traps 3, 4, 5). Significant impact (*).
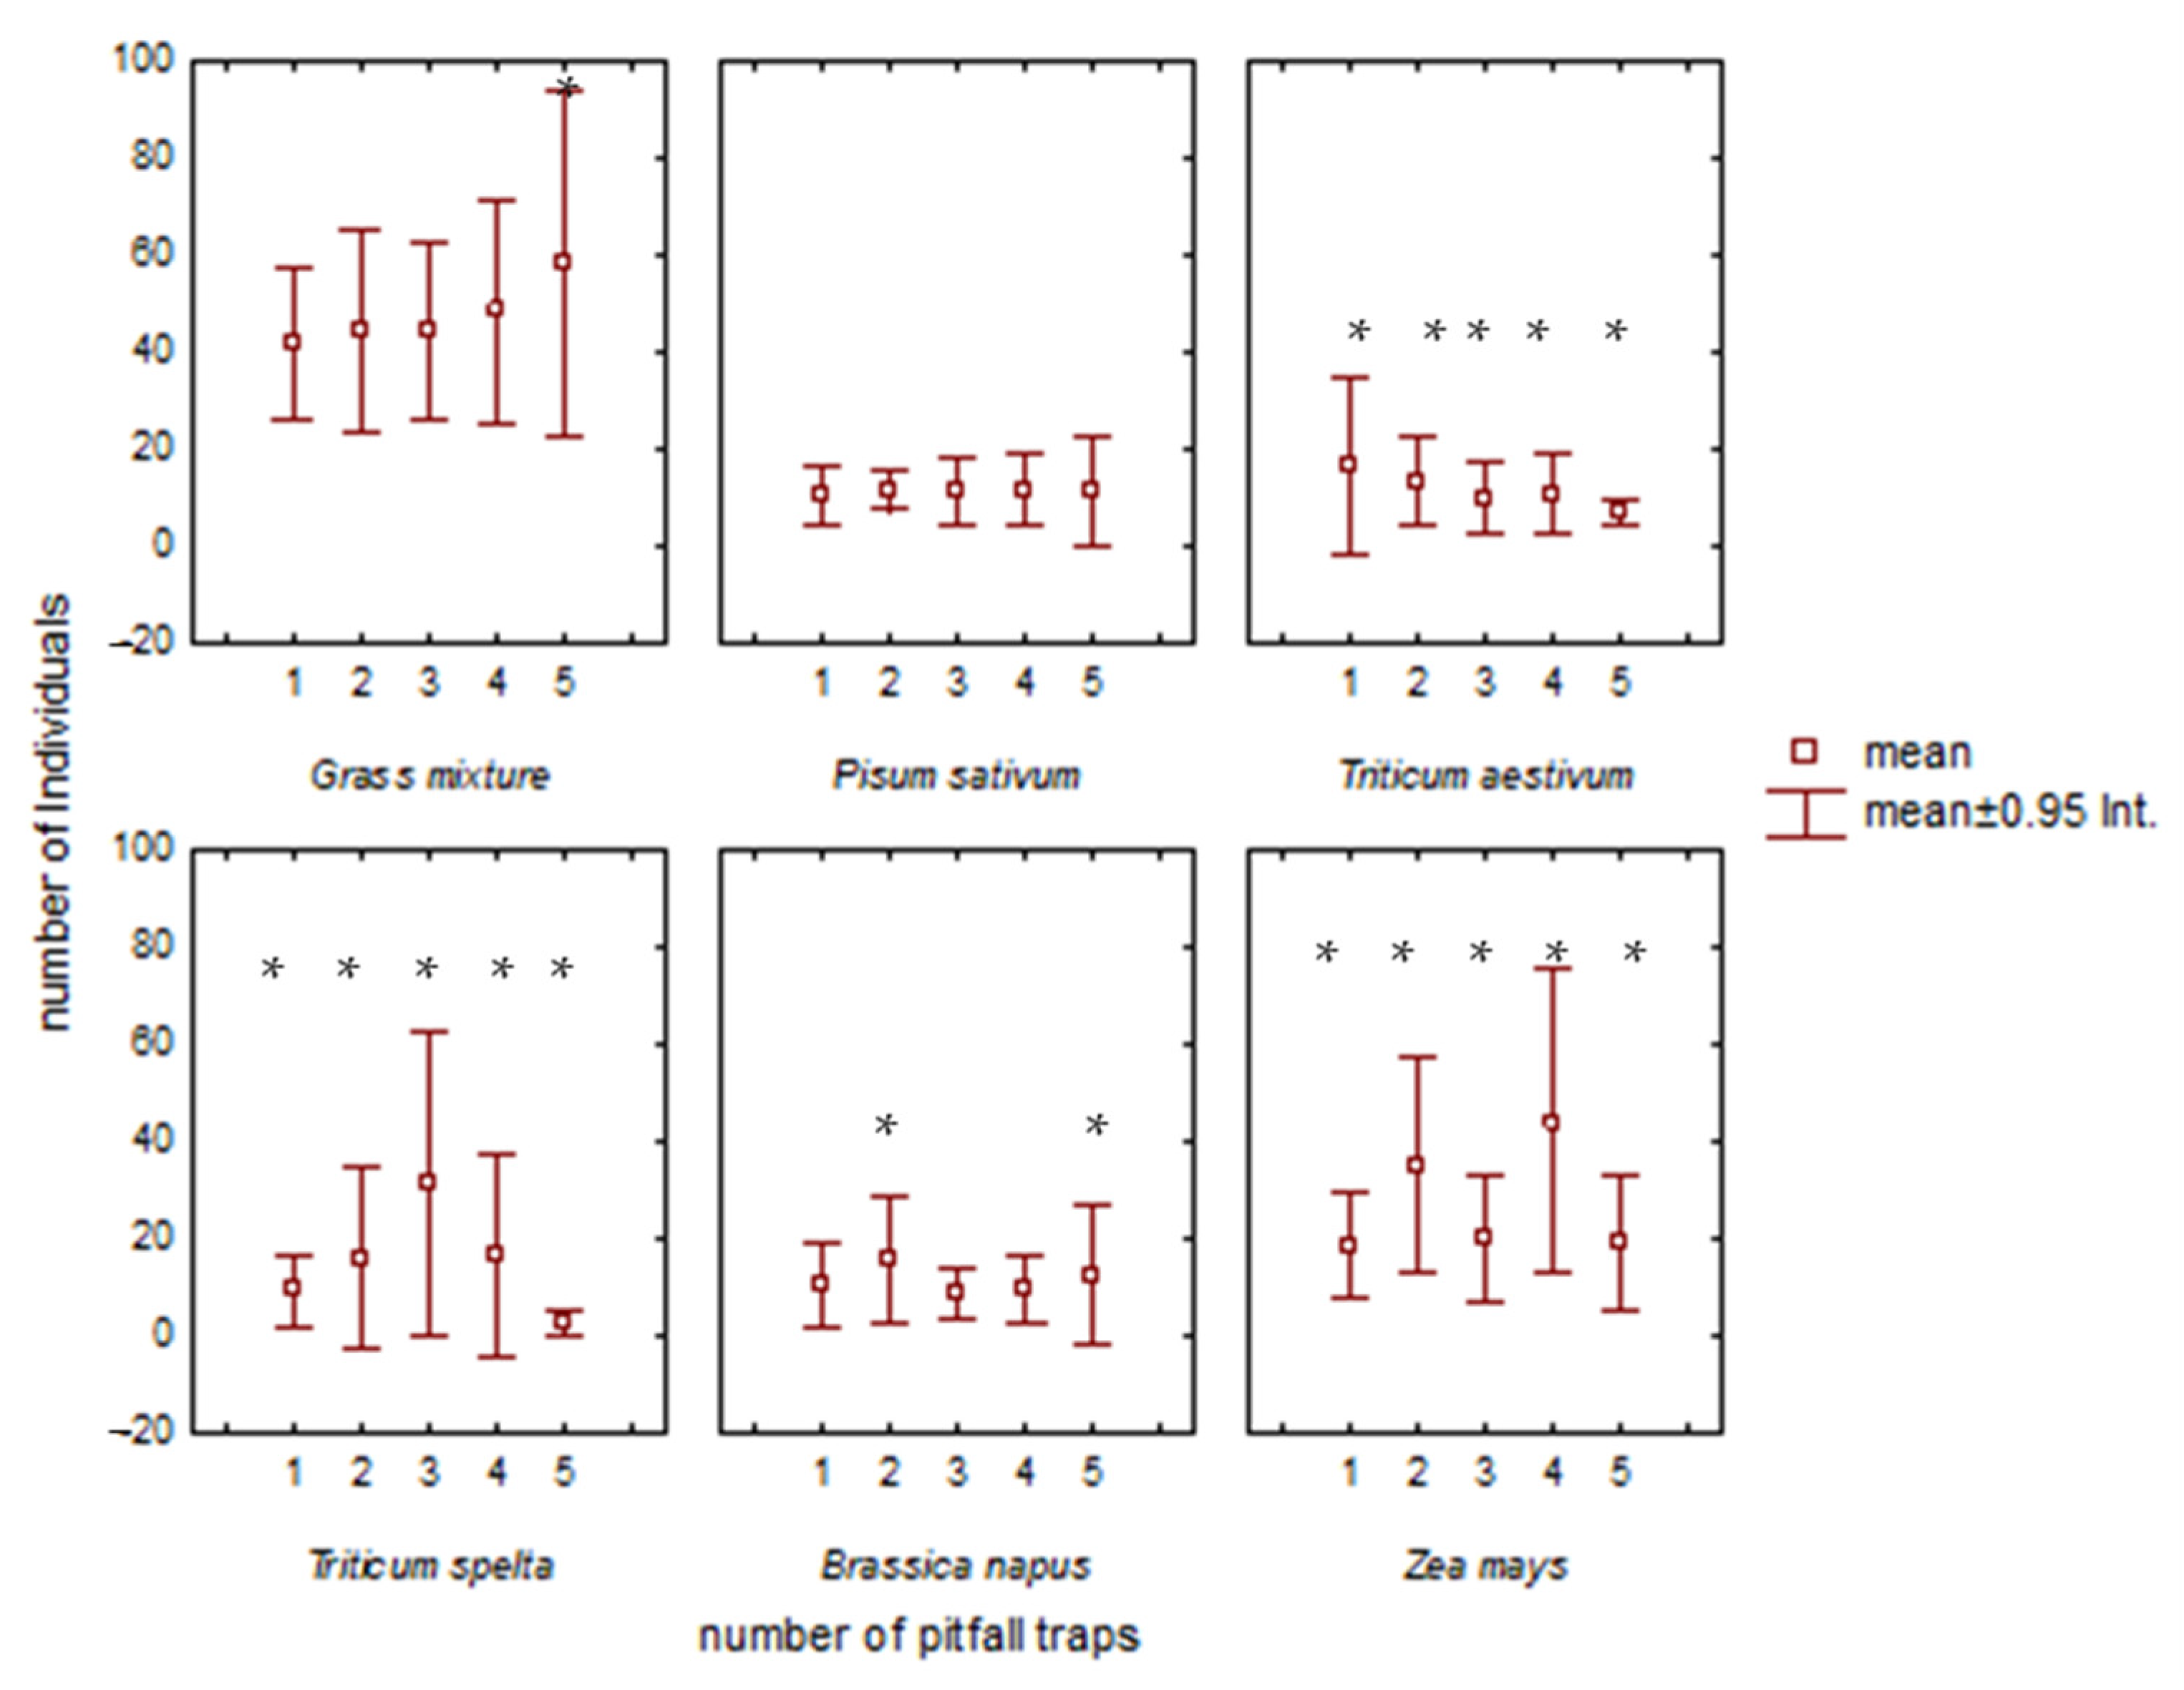
Figure 6.
Mean numbers of individuals (±95% CI) in pitfall traps located in the ecotones (traps 1 and 2) and in the fields (traps 3, 4, 5). Significant impact (*).
Figure 6.
Mean numbers of individuals (±95% CI) in pitfall traps located in the ecotones (traps 1 and 2) and in the fields (traps 3, 4, 5). Significant impact (*).


Table 1.
Average values of environmental variables during 2018–2020 for the studied crops.
| Crops/Environmental Variables | Pitfall Traps | ||||
|---|---|---|---|---|---|
| 1 | 2 | 3 | 4 | 5 | |
| Brassica napus | |||||
| potassium | 14.09 | 16.36 | 16 | 16.88 | 14.38 |
| phosphorus | 1.13 | 1.31 | 1.28 | 1.35 | 1.15 |
| nitrogen | 14.09 | 16.36 | 16 | 16.88 | 14.38 |
| pH | 7.01 | 7.10 | 7.11 | 6.98 | 6.98 |
| moisture | 2 | 2.09 | 1.90 | 2.13 | 2.13 |
| Grass mixture | |||||
| potassium | 8 | 13.50 | 13.50 | 14 | 12.50 |
| phosphorus | 0.64 | 1.08 | 1.08 | 1.12 | 1 |
| nitrogen | 8 | 13.50 | 13.50 | 14 | 12.50 |
| pH | 6.99 | 6.93 | 6.82 | 6.90 | 6.92 |
| moisture | 1.30 | 1.70 | 1.70 | 1.60 | 1.60 |
| Pisum sativum | |||||
| potassium | 11.54 | 14.17 | 12.08 | 13.33 | 15.42 |
| phosphorus | 0.92 | 1.13 | 0.97 | 1.07 | 1.23 |
| nitrogen | 11.54 | 14.17 | 12.08 | 13.33 | 15.42 |
| pH | 7.06 | 6.81 | 6.88 | 6.90 | 6.85 |
| moisture | 1.54 | 1.58 | 1.75 | 1.50 | 1.58 |
| Triticum aestivum | |||||
| potassium | 16.67 | 17.50 | 16.67 | 19.17 | 15 |
| phosphorus | 1.33 | 1.40 | 1.33 | 1.53 | 1.20 |
| nitrogen | 16.67 | 17.50 | 16.67 | 19.17 | 15 |
| pH | 7.02 | 6.95 | 7 | 7 | 6.98 |
| moisture | 1.50 | 1.67 | 1.83 | 1.83 | 1.67 |
| Triticum spelta | |||||
| potassium | 14 | 14 | 10 | 14 | 10 |
| phosphorus | 1.12 | 1.12 | 0.80 | 1.12 | 0.80 |
| nitrogen | 14 | 14 | 10 | 14 | 10 |
| pH | 6.96 | 7 | 7 | 7 | 7.13 |
| moisture | 1.40 | 1.60 | 1.40 | 1.80 | 1.50 |
| Zea mays | |||||
| potassium | 10 | 15.45 | 12.73 | 12.73 | 13.18 |
| phosphorus | 0.80 | 1.24 | 1.02 | 1.02 | 1.05 |
| nitrogen | 10 | 15.45 | 12.73 | 12.73 | 13.18 |
| pH | 7 | 7 | 6.86 | 6.89 | 7.02 |
| moisture | 1.45 | 1.91 | 1.55 | 1.55 | 1.73 |
Table 2.
Distribution of the arthropods in the agricultural crops during the years 2018–2020.
| Arthropods/Crops | Pitfall Traps | ∑ Ind. | ||||
|---|---|---|---|---|---|---|
| 1 | 2 | 3 | 4 | 5 | ||
| Grass mixture/∑ individuals | 3494 | 3940 | 3526 | 3622 | 3800 | 18,382 |
| Araneae | 355 | 356 | 253 | 382 | 353 | 1699 |
| Opilionidea | 3 | 9 | 7 | 24 | 14 | 57 |
| Collembola | 1011 | 1161 | 838 | 835 | 1603 | 5448 |
| Isopoda | 60 | 39 | 56 | 32 | 22 | 209 |
| Julida | 773 | 1062 | 1103 | 1013 | 490 | 4441 |
| Lithobiomorpha | 15 | 27 | 15 | 17 | 13 | 87 |
| Coleoptera | 751 | 833 | 806 | 908 | 752 | 4050 |
| Dermaptera | 0 | 0 | 0 | 2 | 0 | 2 |
| Diptera | 144 | 160 | 172 | 110 | 156 | 742 |
| Hemiptera | 36 | 34 | 37 | 44 | 61 | 212 |
| Hymenoptera | 124 | 67 | 57 | 97 | 51 | 396 |
| Orthoptera | 98 | 112 | 70 | 76 | 58 | 414 |
| Haplotaxida | 25 | 29 | 18 | 10 | 9 | 91 |
| Pisum sativum/∑ individuals | 281 | 287 | 229 | 211 | 148 | 1156 |
| Araneae | 23 | 42 | 20 | 13 | 20 | 118 |
| Isopoda | 9 | 9 | 9 | 16 | 0 | 43 |
| Julida | 31 | 54 | 17 | 17 | 12 | 131 |
| Coleoptera | 175 | 145 | 156 | 150 | 96 | 722 |
| Dermaptera | 12 | 15 | 13 | 1 | 14 | 55 |
| Diptera | 2 | 0 | 0 | 0 | 0 | 2 |
| Hymenoptera | 10 | 22 | 1 | 7 | 6 | 46 |
| Orthoptera | 19 | 0 | 13 | 7 | 0 | 39 |
| Zea mays/∑ individuals | 1426 | 2556 | 1398 | 2565 | 1017 | 8962 |
| Araneae | 15 | 24 | 38 | 10 | 19 | 106 |
| Opilionidea | 33 | 24 | 24 | 21 | 20 | 122 |
| Collembola | 0 | 0 | 3 | 0 | 0 | 3 |
| Isopoda | 123 | 144 | 131 | 121 | 120 | 639 |
| Julida | 21 | 25 | 14 | 0 | 0 | 60 |
| Lithobiomorpha | 21 | 29 | 17 | 16 | 20 | 103 |
| Coleoptera | 1126 | 2178 | 1109 | 2329 | 777 | 7519 |
| Dermaptera | 0 | 1 | 0 | 0 | 0 | 1 |
| Diptera | 54 | 65 | 26 | 14 | 21 | 180 |
| Hymenoptera | 16 | 6 | 16 | 23 | 14 | 75 |
| Orthoptera | 11 | 53 | 13 | 31 | 21 | 129 |
| Haplotaxida | 6 | 7 | 7 | 0 | 5 | 25 |
| Triticum aestivum/∑ individuals | 315 | 256 | 192 | 226 | 145 | 1134 |
| Araneae | 2 | 1 | 2 | 11 | 0 | 16 |
| Isopoda | 0 | 0 | 0 | 2 | 0 | 2 |
| Julida | 34 | 52 | 34 | 59 | 59 | 238 |
| Coleoptera | 225 | 156 | 101 | 124 | 56 | 662 |
| Dermaptera | 10 | 4 | 4 | 12 | 9 | 39 |
| Diptera | 20 | 19 | 14 | 2 | 9 | 64 |
| Hymenoptera | 17 | 0 | 4 | 4 | 0 | 25 |
| Orthoptera | 4 | 23 | 25 | 12 | 12 | 76 |
| Haplotaxida | 3 | 1 | 8 | 0 | 0 | 12 |
| Brassica napus/∑ individuals | 210 | 379 | 151 | 125 | 129 | 994 |
| Araneae | 16 | 22 | 26 | 14 | 17 | 95 |
| Isopoda | 1 | 2 | 1 | 1 | 0 | 5 |
| Julida | 0 | 4 | 2 | 0 | 0 | 6 |
| Lithobiomorpha | 2 | 0 | 0 | 2 | 0 | 4 |
| Coleoptera | 171 | 313 | 106 | 80 | 100 | 770 |
| Diptera | 1 | 12 | 1 | 1 | 4 | 19 |
| Hemiptera | 1 | 2 | 0 | 0 | 0 | 3 |
| Hymenoptera | 6 | 2 | 4 | 23 | 1 | 36 |
| Orthoptera | 12 | 21 | 11 | 4 | 7 | 55 |
| Haplotaxida | 0 | 1 | 0 | 0 | 0 | 1 |
| Triticum spelta/∑ individuals | 113 | 162 | 286 | 117 | 9 | 687 |
| Araneae | 7 | 10 | 14 | 14 | 4 | 49 |
| Isopoda | 10 | 16 | 12 | 6 | 0 | 44 |
| Julida | 2 | 0 | 1 | 0 | 2 | 5 |
| Coleoptera | 85 | 132 | 256 | 97 | 3 | 573 |
| Hymenoptera | 4 | 3 | 0 | 0 | 0 | 7 |
| Orthoptera | 5 | 1 | 3 | 0 | 0 | 9 |
| ∑ individuals from all crops | 5839 | 7580 | 5782 | 6866 | 5248 | 31,315 |
Publisher’s Note: MDPI stays neutral with regard to jurisdictional claims in published maps and institutional affiliations. |
© 2021 by the authors. Licensee MDPI, Basel, Switzerland. This article is an open access article distributed under the terms and conditions of the Creative Commons Attribution (CC BY) license (https://creativecommons.org/licenses/by/4.0/).
Share and Cite
MDPI and ACS Style
Langraf, V.; Petrovičová, K.; Schlarmannová, J. The Composition and Seasonal Variation of Epigeic Arthropods in Different Types of Agricultural Crops and Their Ecotones. Agronomy 2021, 11, 2276. https://doi.org/10.3390/agronomy11112276
AMA Style
Langraf V, Petrovičová K, Schlarmannová J. The Composition and Seasonal Variation of Epigeic Arthropods in Different Types of Agricultural Crops and Their Ecotones. Agronomy. 2021; 11(11):2276. https://doi.org/10.3390/agronomy11112276
Chicago/Turabian StyleLangraf, Vladimír, Kornélia Petrovičová, and Janka Schlarmannová. 2021. "The Composition and Seasonal Variation of Epigeic Arthropods in Different Types of Agricultural Crops and Their Ecotones" Agronomy 11, no. 11: 2276. https://doi.org/10.3390/agronomy11112276
Note that from the first issue of 2016, this journal uses article numbers instead of page numbers. See further details here.