Article

Calcium Ion Richness in Cornus hongkongensis subsp. elegans (W. P. Fang et Y. T. Hsieh) Q. Y. Xiang Could Enhance Its Salinity Tolerance

1
Co-Innovation Center for Sustainable Forestry in Southern China, College of Forestry, Nanjing Forestry University, Nanjing 210037, China
2
Shanghai Wildlife and Protected Natural Areas Research Center, Shanghai 200336, China
3
Suzhou Forestry Station, Suzhou 215128, China
*
Author to whom correspondence should be addressed.
Forests 2021, 12(11), 1522; https://doi.org/10.3390/f12111522
Submission received: 2 October 2021 / Revised: 1 November 2021 / Accepted: 2 November 2021 / Published: 4 November 2021
(This article belongs to the Special Issue Abiotic and Biotic Stress in Forest and Plantation Trees)

Abstract

:
Cornus hongkongensis subsp. elegans (W. P. Fang et Y. T. Hsieh) Q. Y. Xiang has attracted much attention for its potential ornamental value and extensive adaptation to heterogeneous environments. In this study, seedlings were treated with four sea salt concentrations (0 (S0), 0.2 (S2), 0.3 (S3), and 0.4% (S4), w/w) by hydroponics. We determined that the degree of injury symptoms in the salinized seedlings increased with the rising salt concentration and with the extent of stress duration. Calcium ion (Ca2+) concentrations reached peaks of 22.00, 17.05, and 12.77 mg g−1 in the leaves, stem, and root in the S4 treatment, respectively. As the salt concentration rose, calcium oxalate crystals in leaves were mainly enriched in the abaxial parenchyma of the main vein, as well as the palisade tissues and their junction with the spongy tissues of the mesophyll. The density of calcium oxalate crystals increased almost 1.6-fold in the leaves in the S4 treatment compared to the S0 treatment. Our results suggest that C. elegans could be cultivated in coastal areas with a salt concentration of 0.2%–0.3% in eastern China. In addition, a high Ca2+ supply in the field may be an effective strategy to enhance salinity tolerance in dogwoods.

1. Introduction

Salinity is a major abiotic stress that generally negatively influences the survival, biomass production, and yield of plants [1]. Salinity results from soil salinization and/or soil secondary salinization (basically caused by unreasonable irrigation), which mainly increase both osmotic pressure and ionic strength [2]. When plants are exposed to salinity stress, they usually exclude or sequester sodium ions (Na+) and chlorine ions (Cl) in the cytoplasm to avoid toxicity and maintain the appropriate cellular levels of potassium ions (K+) and calcium ions (Ca2+) necessary for ameliorating the inhibitory effects on their survival and growth [3]. Calcium plays essential roles in preserving the structural and functional integrity of plant membranes, stabilizing cell wall structures, regulating cell osmotic pressure and ion selective transport, and enhancing the resistance of plants to environmental stress [4].
Mostly, salinity stress triggers an increase in cytosolic free Ca2+ ([Ca2+]cyt), so as to stimulate the Ca2+-related salt overly sensitive (SOS) pathway to expulse excess intracellular Na+ [2]. The SOS pathway comprises the calcineurin B-like protein 4/SOS3 (CBL4/SOS3), CBL-interacting protein kinase 24/SOS2 (CIPK24/SOS2), and Na+/H+ antiporter SOS1 [5]. Moreover, downstream [Ca2+]cyt could act as a second messenger to activate calcium-dependent protein kinases (CDPKs) and salt-sensing channels, and transduce the hyperosmotic signal to downstream gene transcription and protein activity [6]. Notably, a high Ca2+ supply is thought to be one of the most efficient approaches for improving salt tolerance by inhibiting the unidirectional influx of Na+ and Cl into various organs [4]. However, excessive Ca2+ can combine with endogenous oxalic acid to form calcium oxalate crystals through a physical–chemical process in cells [7]. Additionally, calcium oxalates are extensively distributed in plant organs and could become a Ca2+ pool for multifunctional calcium regulation [8].
Saline soil is distributed extensively in coastal, arid, and semi-arid areas of the world. Over 6% of total land area and about 30% of irrigated farmlands in the world is affected by soil salinization and/or secondary soil salinization [9]. Contemporary soil salinization has gradually become one of the main limiting factors for plant propagation, introduction, and cultivation [10]. Unfortunately, there are more than 34 million hm2 of salinized regions and about 1 million hm2 of coastal saline soil regions in China, which profoundly affects plant survival [11], especially woody ornamental plants, resulting in less biodiversity and a fragile ecosystem in coastal regions [12]. With the increasing demands for horticultural tree species for landscaping in the coastal area in China, more and more attractive ornamental trees have been introduced, domesticated, and cultivated. Thus, salt-tolerant species, such as Pongamia pinnata (L.) pierre and red-osier dogwood (Cornus sericea L. syn. Cornus stolonifera Michx), have become potential species for afforestation in coastal saline soil regions [13,14].
Dogwoods belong to the genus of Cornus subg. syncarpea (Nakai) Q. Y. Xiang with two groups: the East Asian group and North American group [15]. Their cultivars are widely used as ornamental plants in gardens and urban landscapes owing to attractive horticultural traits, such as petal-like bracts of red, pink, or white in the spring, bright red berries, and colorful leaves in the fall. Furthermore, more than 100 cultivars selected from the North American group have enjoyed considerable success as excellent garden ornamentals in the United States, Canada, and Mexico for over 100 years [16,17], although their domestication in eastern China is not entirely successful. As a group of dogwoods native to China, the East Asian group contains eight evergreen and two deciduous species, whose distributions cover most subtropical to tropical areas in China. Most importantly, these dogwoods have abundant variability in leaf and bract color [18], especially in extensive adaptation to various habitats, i.e., moderate drought and salinity stress. Consequently, they are considered a promising species for the breeding of horticultural cultivars and elite rootstocks for grafting cultivars selected from the North American group [19,20].
Although the effects of salinity stress have been widely reported in many woody species [13,14,21,
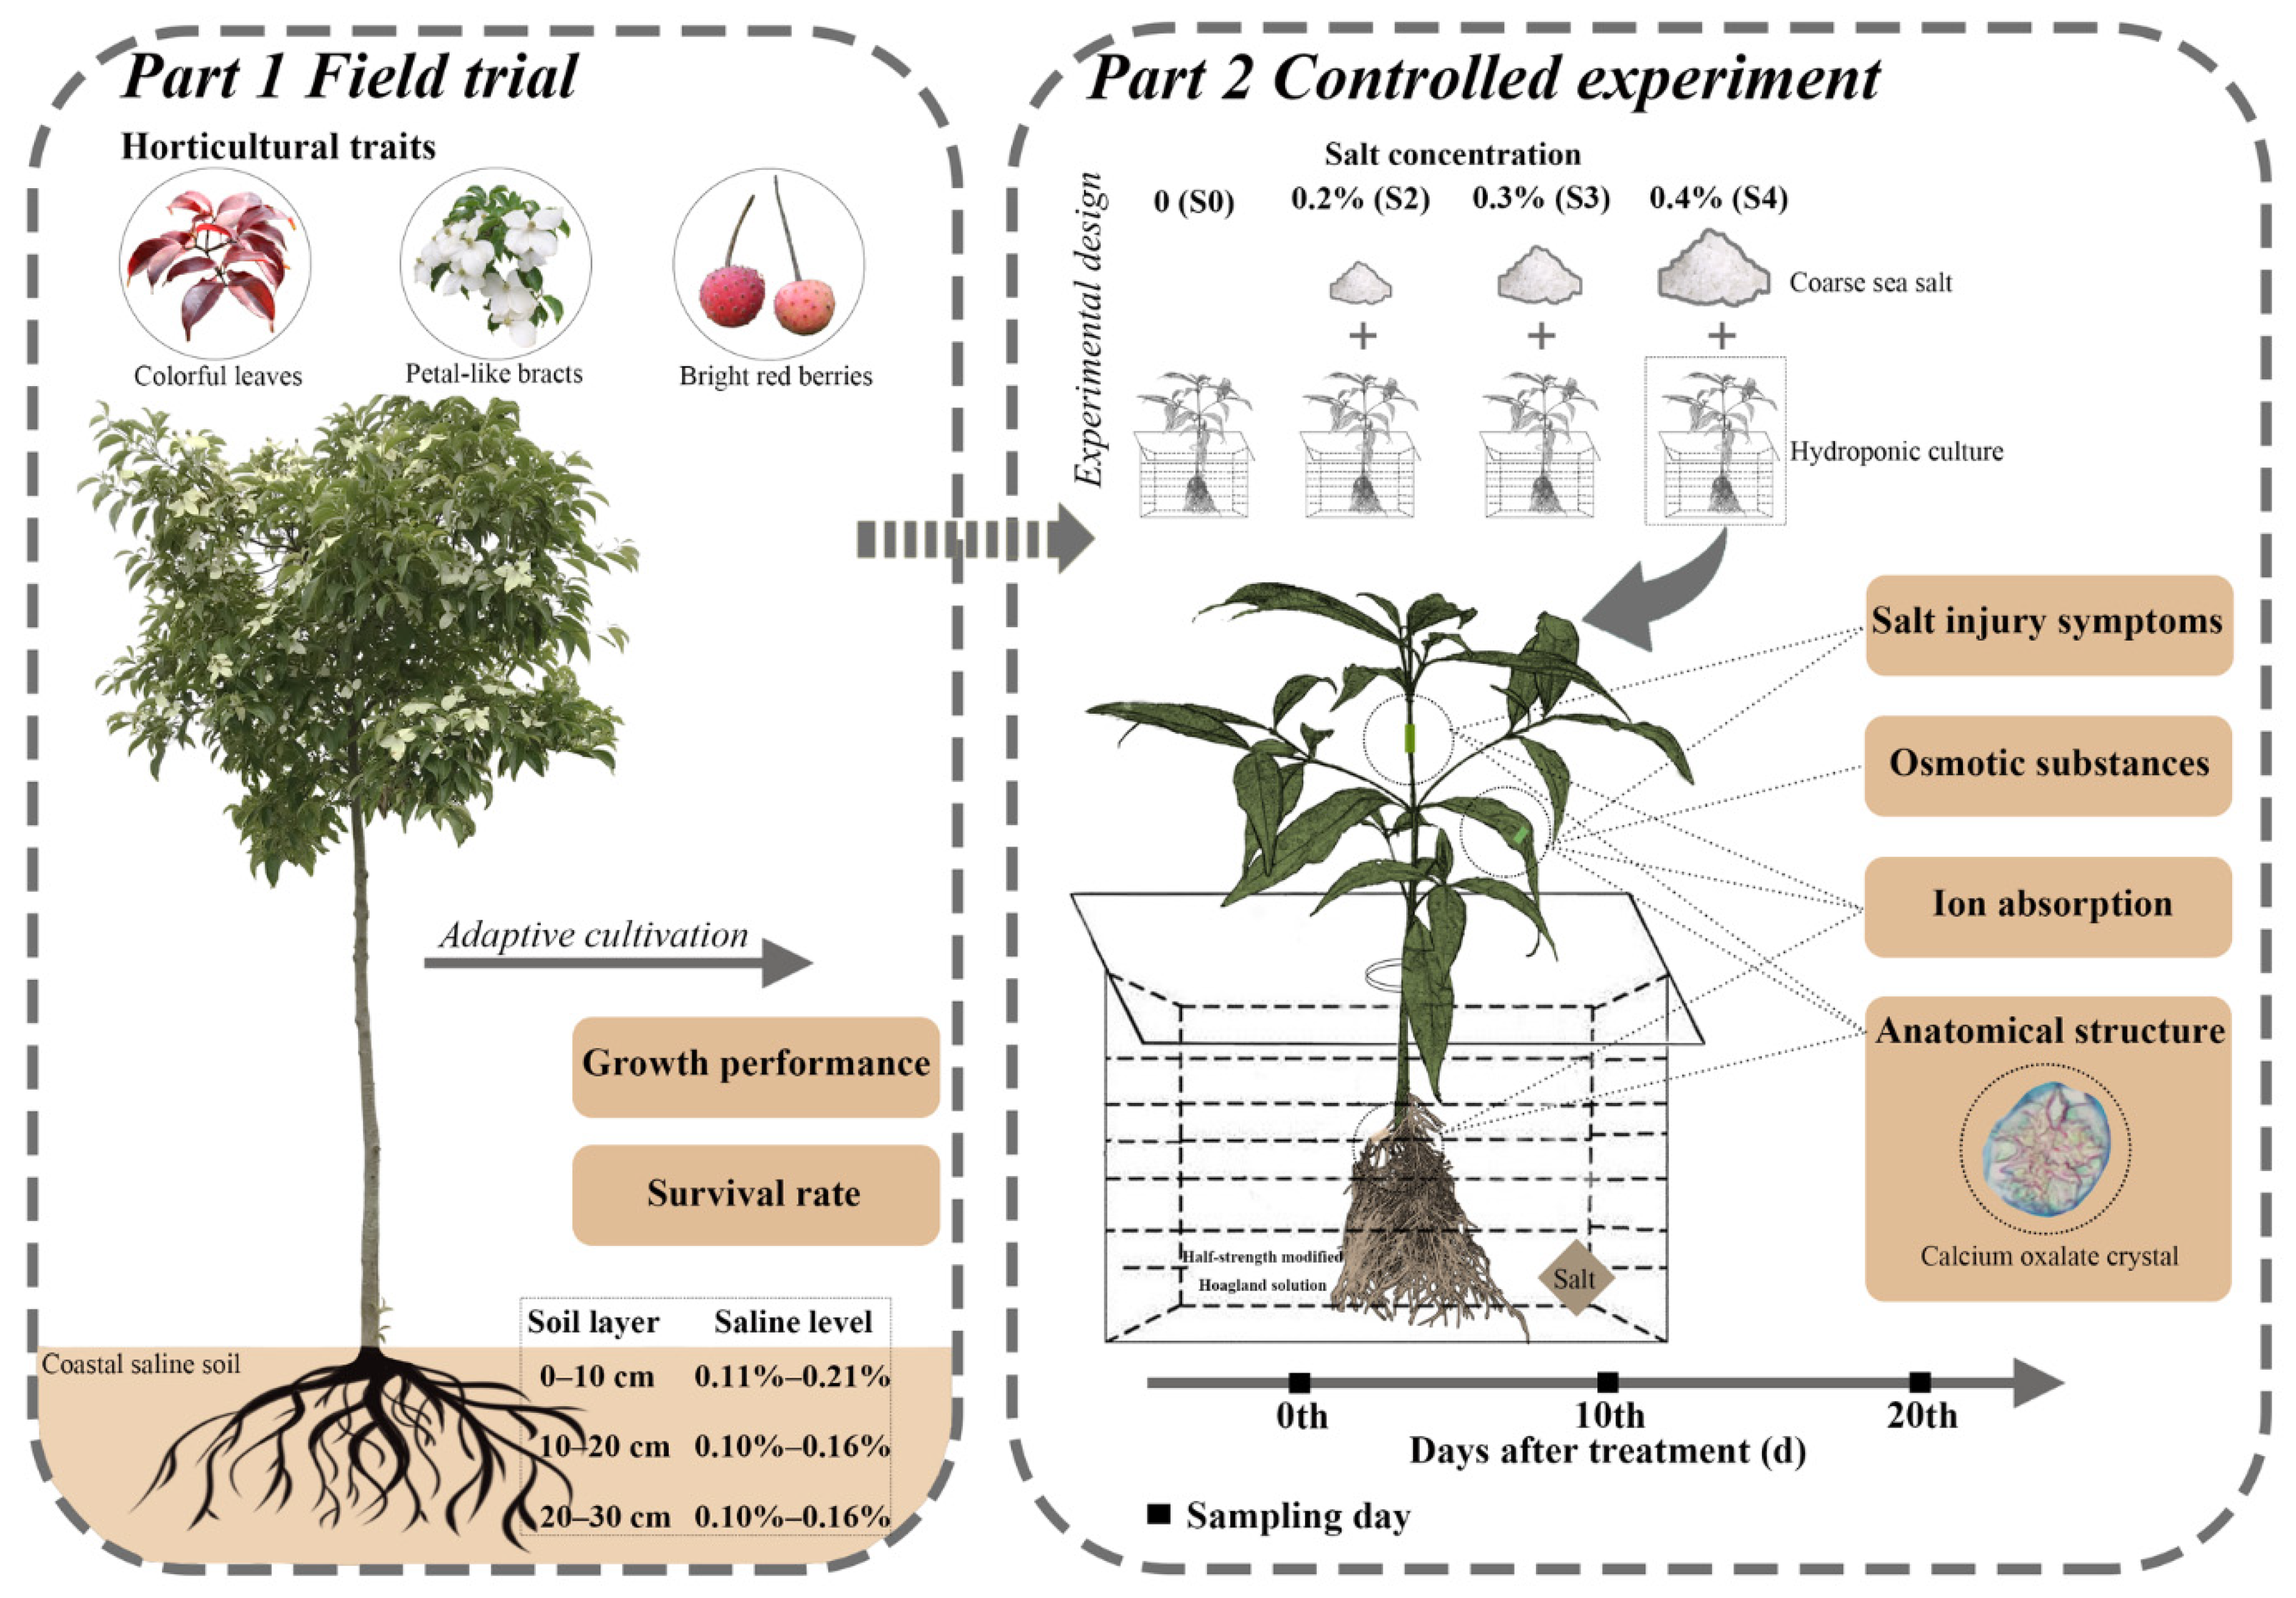
22], little is known about the salt tolerance of dogwoods. We took Cornus hongkongensis subsp. elegans (W. P. Fang et Y. T. Hsieh) Q. Y. Xiang seedlings as the experimental materials, whose natural distribution is mainly located in the middle and lower reaches of the Yangtze River in the subtropical region of China, where extremely high temperature and high humidity short-term events occur frequently in summer. A large amount of coastal saline soil is distributed in the Yangtze–Huaihe Region north of the Yangtze River estuary and west of the Yellow Sea. This area is a potential cultivatable saline area for ornamental dogwoods because of its suitable climatic conditions. The aims of this study focused on (i) clarifying the salt tolerance capability of this species; (ii) verifying the response to increasing salt concentration on physiological levels, including osmolytes and ion absorption; and (iii) emphasizing the tissue deposition specificity of calcium oxalate crystal in response to salinity stress on an anatomical level, then speculating on the regulating role of Ca2+ in salinized C. elegans seedlings.

2. Materials and Methods

2.1. Field Trial

A field adaptive cultivation of Cornus hongkongensis subsp. elegans was conducted in a coastal area of the Yangtze–Huaihe Region in eastern China (Dafeng Forest Farm, Yancheng City, Jiangsu Province: 33°12′ N, 120°30′ E) in 2015. The basic physical and chemical properties of the field soil are reported in Table 1. The salt concentration in the planted area ranged from 0.10% to 0.21%. The field trial was arranged in 3 blocks, with 64 seedlings in each block.
The experimental design of this research was based on the results of the field trial.

2.2. Plant Materials and Salinity Treatments

Seeds of C. elegans collected from Lishui City, Zhejiang Province, China, were soaked with 500 mg g−1 gibberellic acid (GA3, Yuanye Biotechnology Co. Ltd., Shanghai, China) and stratified at 0–5 °C for 2 months, according to the seed dormancy breaking techniques of Fu et al. [16]. Then, the seedlings were raised in the containers (diameter × height: 8 × 12 cm) filled with a mixture of yellow-brown soil/peat soil/vermiculite (5/3/2, v/v/v) after stratification. Homogenous one-year-old seedlings with a morphology of 40–55 cm in height and 0.50–0.90 cm in diameter were selected as the experimental materials in June 2018.
The selected seedlings were washed to remove the culture substrate attached to the roots. After pruning the roots, the seedlings were transplanted to water culture boxes (length × width × height: 110 × 57 × 16 cm) filled with nutrient solution. The boxes were assembled from perforated foam boards embedded with planting cups, and sponges in the cups were used to support the seedlings. Preculture was supplemented with half-strength modified Hoagland solution (2.50 mM Ca(NO3)2·4H2O, 2.50 mM KNO3, 0.50 mM NH4NO3, 1.00 mM MgSO4·7H2O, 30.65 μM C10H12FeN2NaO8, 23.13 μM H3BO3, 4.57 μM MnCl2·4H2O, 0.38 μM ZnSO4·7H2O, 0.10 μM CuSO4·5H2O and 0.28 μM H2MoO4, pH 6.0), which was replaced weekly to ensure nutrient stability for plant growth. Preculture lasted 1 month after the emergence of new roots.
Subsequently, the nutrient solution was combined with coarse sea salt from the Yellow Sea (to simulate the coastal saline environment of the Yangtze–Huaihe Region), which is mainly composed of chlorine, sodium, sulfur, magnesium, calcium, potassium, carbon, bromine, strontium, boron, and fluorine [24]. Four salt concentrations were used as treatments: 0 (S0), 0.2 (S2), 0.3 (S3), and 0.4% (S4) (w/w). The electrical conductivity (EC) measurements of the S0, S2, S3, and S4 treatments were 1.06, 4.22, 5.69, and 7.14 mS cm−1, respectively. To avoid abrupt osmotic shock, the designed concentrations were achieved by increasing the salt by 0.1% every 2 days. Three replicates of 20 seedlings in each replicate were arranged for each treatment. The salinity stress treatments started on 19 July and ended on 8 August, a total of 20 days of treatment. Detailed information about the experimental design is provided in Figure 1.
During the culture, fresh air was pumped into the solution continuously to satisfy root breath. In order to simulate the high temperature and high humidity environment in the middle and lower reaches of the Yangtze River in summer, the hydroponic culture was conducted in a semi-open site covered with plastic film and sunshade nets to prevent the rain and sunshine of the natural conditions on the campus of Nanjing Forestry University, Nanjing City, Jiangsu Province, China, from July to August. The daily maximum temperatures as well as the minimum temperatures in the test area throughout the duration of the experiment were much higher than those of the natural conditions (Figure 2). Nevertheless, the daily average temperatures in the natural conditions and test area were 30.62 °C and 35.95 °C, respectively, during the experimental trial. The average daily temperature in the test area was consistent with that in the field when C. elegans seedlings are exposed to direct sunlight in summer.

2.3. Investigation of Salt Injury Symptoms

The growth performances of seedlings were investigated on the basis of morphological features. The grade of salt damage was classified into 7 degrees based on salt injury symptoms, according to a previous study [25] with slight modifications (Table 2).

2.4. Sampling for Parameters Measurement

On day 0, 10, and 20 of salt stress, the developed fresh leaves in the middle of the plants were randomly collected from 5 seedlings in each replicate and mixed for determination of the concentrations of osmotic substances. At the end of the experiment, 3 intact seedlings in each replicate were randomly selected for measurements of the macroelement concentration, and the developed leaves and stems in the upper, as well as 1st class lateral roots, were collected separately for anatomical observations.

2.5. Determination of Osmoregulation Substance Concentration

The proline, soluble sugars, and soluble proteins concentrations were determined by colorimetric methods with a spectrophotometer (DU800, Beckman Coulter Inc., Brea, CA, USA) according to Wang and Huang [26]. The specific methods are as follows.

2.5.1. Proline Concentration

A finely cut and well-mixed fresh leaf sample weighing 0.5 g was heated in boiling water for 10 min with 5 mL 3% sulfosalicylic acid solution, then centrifuged for 5 min at 3000 rpm after cooling. The 2 mL supernatant was fully mixed with 2 mL glacial acetic acid and 2 mL acidic ninhydrin reagent, and heated at 100 °C for 30 min to begin the chromogenic reaction. After cooling to room temperature, 4 mL of methylbenzene was added to the reaction liquid to begin the extraction reaction. The upper red extraction was centrifuged for 5 min at 3000 rpm. The absorbance of the supernatant was measured at 520 nm. The calibration curve was prepared with standard proline (Sigma-Aldrich, St. Louis, MO, USA).

2.5.2. Soluble Sugar Concentration

Finely cut fresh leaves weighing 0.2 g were heated at 100 °C for 30 min twice with 20 mL of distilled water. After heating, the insoluble residue was removed by centrifuging at 5000 rpm for 10 min. The supernatant volume was set to 25 mL with a volumetric flask. A total of 0.5 mL of sample solution, 1.5 mL of distilled water, 0.5 mL of anthrone–ethyl acetate reagent, and 5 mL of concentrated sulfuric acid were added sequentially in a test tube. After oscillation, the mixed solution was kept for 1 min in a boiling water bath. Absorbance was determined at 630 nm after cooling to room temperature. The calibration curve was prepared with standard sucrose (Sinopharm Chemical Reagent Co. Ltd., Shanghai, China).

2.5.3. Soluble Protein Concentration

Finely cut fresh leaves weighing 0.2 g were fully ground using a mortar and pestle and mixed with 6 mL 0.05 M phosphate-buffered solution (PBS, pH 7.8) and a little quartz. The mixture was fully oscillated and extracted at room temperature for 1 h. After centrifugation for 20 min at 4000 rpm, 5 mL of Coomassie brilliant blue G-250 (Solarbio Life Sciences Co. Ltd., Peking, China) was added to 0.1 mL of supernatant. The absorbance of the reaction liquid was measured at 595 nm after sufficient mixing for 2 min. The calibration curve was prepared with the bovine serum albumin (Sinopharm Chemical Reagent Co. Ltd., Shanghai, China) and the Coomassie brilliant blue G-250.

2.6. Determination of Macroelement Concentration

The upper fresh leaf, stem, and root were separated and washed with deionized water. After drying to constant weight, the samples were shattered by a grinder and sifted into a fine powder. About 0.2 g of powder was mixed with 9 mL of concentrated sulfuric acid and 1 mL of perchloric acid in a digested bottle. After overnight extraction, the sample was digested in an electric furnace for 20 min at 200 °C, then diluted with 100 mL deionized water after cooling down. The calibration curve was prepared with standard solutions of potassium, sodium, and calcium (Guobiao (Beijing) Testing & Certification Co. Ltd., Beijing, China). The concentrations of potassium ions (K+), sodium ions (Na+), and calcium ions (Ca2+) were determined to be 769.90, 589.00, and 422.67 nm, respectively, with an atomic absorption spectrometer (AA900T, Perkin Elmer Co., Waltham, MA, USA). The calculation formula was as follows:
Macroelement   concentration   ( mg   g 1 ) = C × V × N m × 1000
where C is the concentration (mg L−1), V is the volume of extracted solution (mL), N is the dilution multiple, and m is the sample quality (g).

2.7. Observation of Anatomical Traits

The leaf was fixed in 50% formalin–acetic acid–alcohol (FAA) fixation solution for 1 week, whereas the stem and root segments were fixed in 70% FAA fixation solution for 1 month, then softened with 10% ethylenediamine. The sections were prepared by serial dehydrations in ethanol, followed by the double staining procedure (safranine and fast green) for coloring various cells and tissues [27]. Finally, the sections were observed and photographed under an optical microscope (BX53, Olympus Co. Ltd., Tokyo, Japan). Five random microscope views of the stem, and fifteen random microscope views of leaves for each treatment were measured to determine the proportion of various tissues. Such a measurement was not conducted for the root, which would be meaningless because only root hairs and the root area affect plant absorption.

2.8. Statistical Analysis

Statistical analysis was carried out with IBM SPSS Statistics 20 (IBM Co., Amonk, NY, USA). Subsequently, analyses of variance (ANOVA), Duncan’s multiple comparisons, two-factor variance analyses, and Pearson correlations were performed. The data are presented as the mean ± standard error. Differences were considered significant if p < 0.05 and/or 0.01.

3. Results

3.1. Salt Injury Symptoms

With the increase in salinity stress duration, the degree of salt injury in the seedlings all tended to be serious (Table 3). The growth performances of seedlings also deteriorated over time (Figure 3). On the fifth day of salt stress, no obvious or slight salt injury symptom was observed for all treatments, but the plaque-like purple and anthracnose-like symptoms gradually appeared in leaves with the increase in salt concentration. In particular, injury symptoms worsened after the 15-day treatment, and the salt damage level of seedlings in the S3 and S4 treatments reached Grade 6 on the 20th day. Markedly, the damage of the seedlings from the S0 treatment also reached Grade 4 on the 20th day. According to the results of temperature monitoring, the daily maximum temperature during testing time was higher than 40 °C, reaching 45 °C (Figure 2); we judged that in addition to salt stress, the seedlings in this study were also subjected to heat stress, which also explained the severe damage symptoms that appeared in the S0 treatment.
The increased salt concentrations affected the survival rate of seedlings recorded at the end of the experiment (Table 3). Survival rates of 88.33% and 81.67% in S0 and S2 treatments, respectively, were significantly higher than those of 50.00% and 46.67% in S3 and S4, respectively.
The better growth performances were found in seedlings growing in the field (Figure S1, Table S1). However, the survival rate of the field trail seedlings was only 47.40%, far below that of the S2 treatment in the control experiment. It was also found that provisional plaque-like purple and anthracnose-like symptoms appeared in the leaves of individual field trail plants (Figure S1).

3.2. Accumulation of Osmoregulation Substances under Salt Stress

3.2.1. Proline Concentration

The proline (Pro) concentration in the seedlings of C. elegans rose significantly with the extension of the salinity stress duration, but the differences among the four treatments at the same stress duration were not significant (Figure 4a). Duncan’s multiple comparisons showed that the Pro concentration was remarkably increased on the 20th day, and the increments were 55.86%, 51.91%, and 57.35% for the S2, S3, and S4 treatments, respectively, in comparison with the concentration before salt stress. In the S0 treatment, a 39.04% increment in Pro concentration was determined on the 20th day compared with that before salt stress, suggesting that the Pro concentration could respond to heat stress as well. In addition, two-factor variance analysis showed that stress duration instead of salt concentration significantly affected the accumulation of Pro in the stressed seedlings (Table 4).

3.2.2. Soluble Sugar Concentration

A significant effect of salt stress duration on SSC only occurred in the S4 treatment (Figure 4b), and a 23.67% increment in SSC was monitored on day 20, compared with day 0. Among treatments, SSCs on the 20th day were obviously increased by 38.06% and 43.89% in the S3 and S4 treatments, respectively, in comparison with that of the S0 treatment. Accordingly, the variance analysis presented in Table 4 shows that the significant effect on SSC was mainly induced by salt concentration, whereas there was no effect of stress duration.

3.2.3. Soluble Protein Concentration

The soluble protein concentration (SPC) was mainly induced by stress duration, and significant increments were 32.32%, 58.70%, and 35.45% for the S2, S3, and S4 treatments, respectively, on the 10th day, in comparison with the concentration before salt stress (Figure 4c). In the S0 treatment, a 30.83% increment in SPC was determined on day 10, compared with that on day 0, suggesting that the value responded not only to salt stress, but also heat stress. Furthermore, the SPC peaked on the 10th day in all treatments, indicating that the seedlings might accumulate enough soluble protein at the onset of osmoregulation in response to salt and heat stress, then change to Pro and soluble sugar in the later phase. Two-factor variance analysis showed the salt concentration and stress duration, as well as the interaction effect between them, significantly affected the accumulation of soluble protein in the stressed seedlings (Table 4).

3.3. Ion Absorption in Various Organs under Salt Stress

3.3.1. Sodium Ion Concentration

Significant increases in sodium ion (Na+) concentration in various organs of C. elegans seedlings were measured for all salinity treatments (Figure 5a). As salt concentration increased, the rising trend of Na+ was displayed in both stem and leaves, and the maximum of 6.96 mg g−1 in the stem and 6.25 mg g−1 in the leaves were reached when seedlings were subjected to the S4 treatment. In the root, the unimodal pattern with the peak of 4.84 mg g−1 was observed in the S3 treatment. In general, Na+ was mainly accumulated in the root and stem of seedlings treated with lower salt concentrations of 0.2% and 0.3%. However, the accumulation model of Na+ under high salt concentration (0.4%) changed, and more Na+ tended to be enriched in the stem and leaves. Considering that the stem is the transportation corridor, the location of Na+ accumulation seemed to shift from the root to leaves with the rising salt concentration.

3.3.2. Potassium Ion Concentration

Potassium ion (K+) concentration varied depending on the organs of the seedlings. Significantly, no matter which treatment, the K+ concentration in the leaves was far higher than that in the root and stem (Figure 5b). Similar to the accumulation model of Na+ in the root, the maximum K+ concentrations in the root and leaves were reached in the S3 treatment and significantly increased by 78.23% and 36.71%, respectively, compared with the control. In the stem, significant increments of K+ concentration in S2, S3, and S4 treatments increased 68.06%, 101.99%, and 103.67%, respectively, in comparison with the control, inferring that salt culture drove the influx of K+ from root to leaves, so as to relieve the absorption of excess Na+.

3.3.3. Calcium Ion Concentration

As with the pattern of K+ accumulation, calcium ions (Ca2+) mainly accumulated in the leaves of C. elegans seedlings (Figure 5c). Consistently, the Ca2+ concentration in all organs rose significantly with the rise in salt concentration, and peaks of 22.00 in the leaves, 17.05 in the stem, and 12.77 mg g−1 in the roots all appearing in the S4 treatment, were 1.17-, 2.64-, and 3.95-fold greater than those in the S0 treatment, respectively. Multiple comparisons indicated that significant differences were determined for all the treatments in various organs, except the S0 and S2 treatments in the leaves, suggesting that depositing more Ca2+ could antagonize Na+ invasion when seedlings were exposed to higher salt stress.
Overall, the existence of salinity significantly triggered reductions in the Ca2+/Na+ ratio in the root, stem, and leaves (Figure 5d). The declining trend in the Ca2+/Na+ ratio mainly depended upon the rise in Na+. As shown in Figure 5d, the minimum ratio of 2.29 in the root of the S3 treatment and 3.52 in the leaves of the S4 treatment occurred when the maximum Na+ concentration occurred (Figure 5a), whereas in the stem, the minimum Ca2+/Na+ ratio (1.98) in the S2 treatment was probably caused by a higher Na+ concentration (4.74 mg g−1) but lower Ca2+ concentration (9.37 mg g−1) (Figure 4c and Figure 5a). These results indicated that improving the Ca2+/Na+ ratio might be the crucial strategy to reduce Na+ absorption.

3.4. Pearson Correlation Analysis

The Pearson correlation analysis revealed that salt concentrations (SCs) were positively correlated with the SSC (r = 0.43) and Na+ concentration (r = 0.81), as well as the Ca2+ concentration (r = 0.51), but not correlated with the Pro concentration, SPC, or K+ concentration in the seedlings of C. elegans (Table 5). Pro concentration displayed a significantly positive correlation with the K+ concentration (r = 0.84) and Ca2+ concentration (r = 0.79), and SSC was positively correlated with the Na+ concentration (r = 0.44). For the three osmoregulation substances, there were no significant correlations between them. Notably, the concentrations of Na+ and K+ were all positively correlated with the Ca2+ concentration (r = 0.34 and 0.86, respectively), but the former two ions were not correlated with each other. It suggested that Ca2+ could adjust the absorption of Na+ when the seedling is stressed by saline.

3.5. Response of Organ Structure to Salt Stress at Anatomical Level

3.5.1. Anatomical Structure of Organs

Observations of root transverse sections revealed many alterations in the configuration of epidermal and cortical cells (Figure 6a), showing that the cells were loosely arranged and disintegrated when exposed to salinity stress. Compared with the control, cortical cells in stem transverse sections were crumpled and depressed under salinity stress, leading to a significant decrease in the cortical thickness/stem radius (Ct/Sr) in the S2 and S4 treatments (Table 6). Meanwhile, the parenchyma pith cells exhibited shrinkage, disintegrating into cavities as the salt concentration rose (Figure 6b), also causing a remarkable decrease in pith width/stem diameter (Pw/Sd) and xylem thickness/stem radius (Xt/Sr). In contrast, increases in Pw/Sd and Xt/Sr in the S2 treatment suggested that lower salinity might favor seedling growth. Interestingly, salt treatments all significantly improved the phloem thickness/stem radius (Pt/Sr).
Observations of longitudinal leaf sections showed the looser arrangement of palisade tissue and spongy tissue (Figure 6c), inducing a notable increase in palisade tissue thickness/leaf thickness (Pt/Lt) in the S2 and S3 treatments, as well as spongy tissue thickness/leaf thickness (St/Lt) in the S4 treatment, compared with the control (Table 6). This implied that the leaf structure of tightness might be strengthened by lower salt stress (such as 0.2% and 0.3% salt concentrations), but the leaf structure of osteoporosis might be widened by the 0.4% salt concentration. In addition, the leaf gas chamber became larger as the saline level rose.

3.5.2. Response of Calcium Crystals to Salt Stress

More light-yellow calcium oxalate crystals were observed in the parenchyma cells with the increasing salt concentration (Figure 6). The calcium oxalate crystals were mainly deposited in the cortex of the root and stem, the pith, and its junction with the xylem of the stem, and were especially enriched in the abaxial parenchyma of the main vein, as well as the palisade tissues and their junction with spongy tissues of the mesophyll. In all stressed seedlings, the density of calcium oxalate crystals significantly increased almost 17.25–20.00-fold in the root and 2.25–2.63-fold in the stem, in comparison with the control (Table 7). In the leaves, the density of calcium oxalate crystals was only remarkably increased in the S4 treatment. In the leaves, the calcium oxalate crystals were mainly deposited in the main vein for its transport channel, but less so in the mesophyll tissues, ensuring normal photosynthetic function (Figure 5c).

4. Discussion

Salinity stress mainly inhibits plant growth and development through osmotic stress and ion poisoning [28]. Therefore, plants have developed a wide range of strategies to minimize the adverse effects by rebuilding osmotic and ionic homeostasis, then maintaining the physiological and biochemical stability necessary for growth and survival under saline conditions [29,30]. In this study, three salt concentrations (0.2%, 0.3%, and 0.4%) were assessed, according to the survey of saline levels in the field for crop production [31] and adaptive cultivation of C. elegans in Dafeng Forest Farm (Table 1).
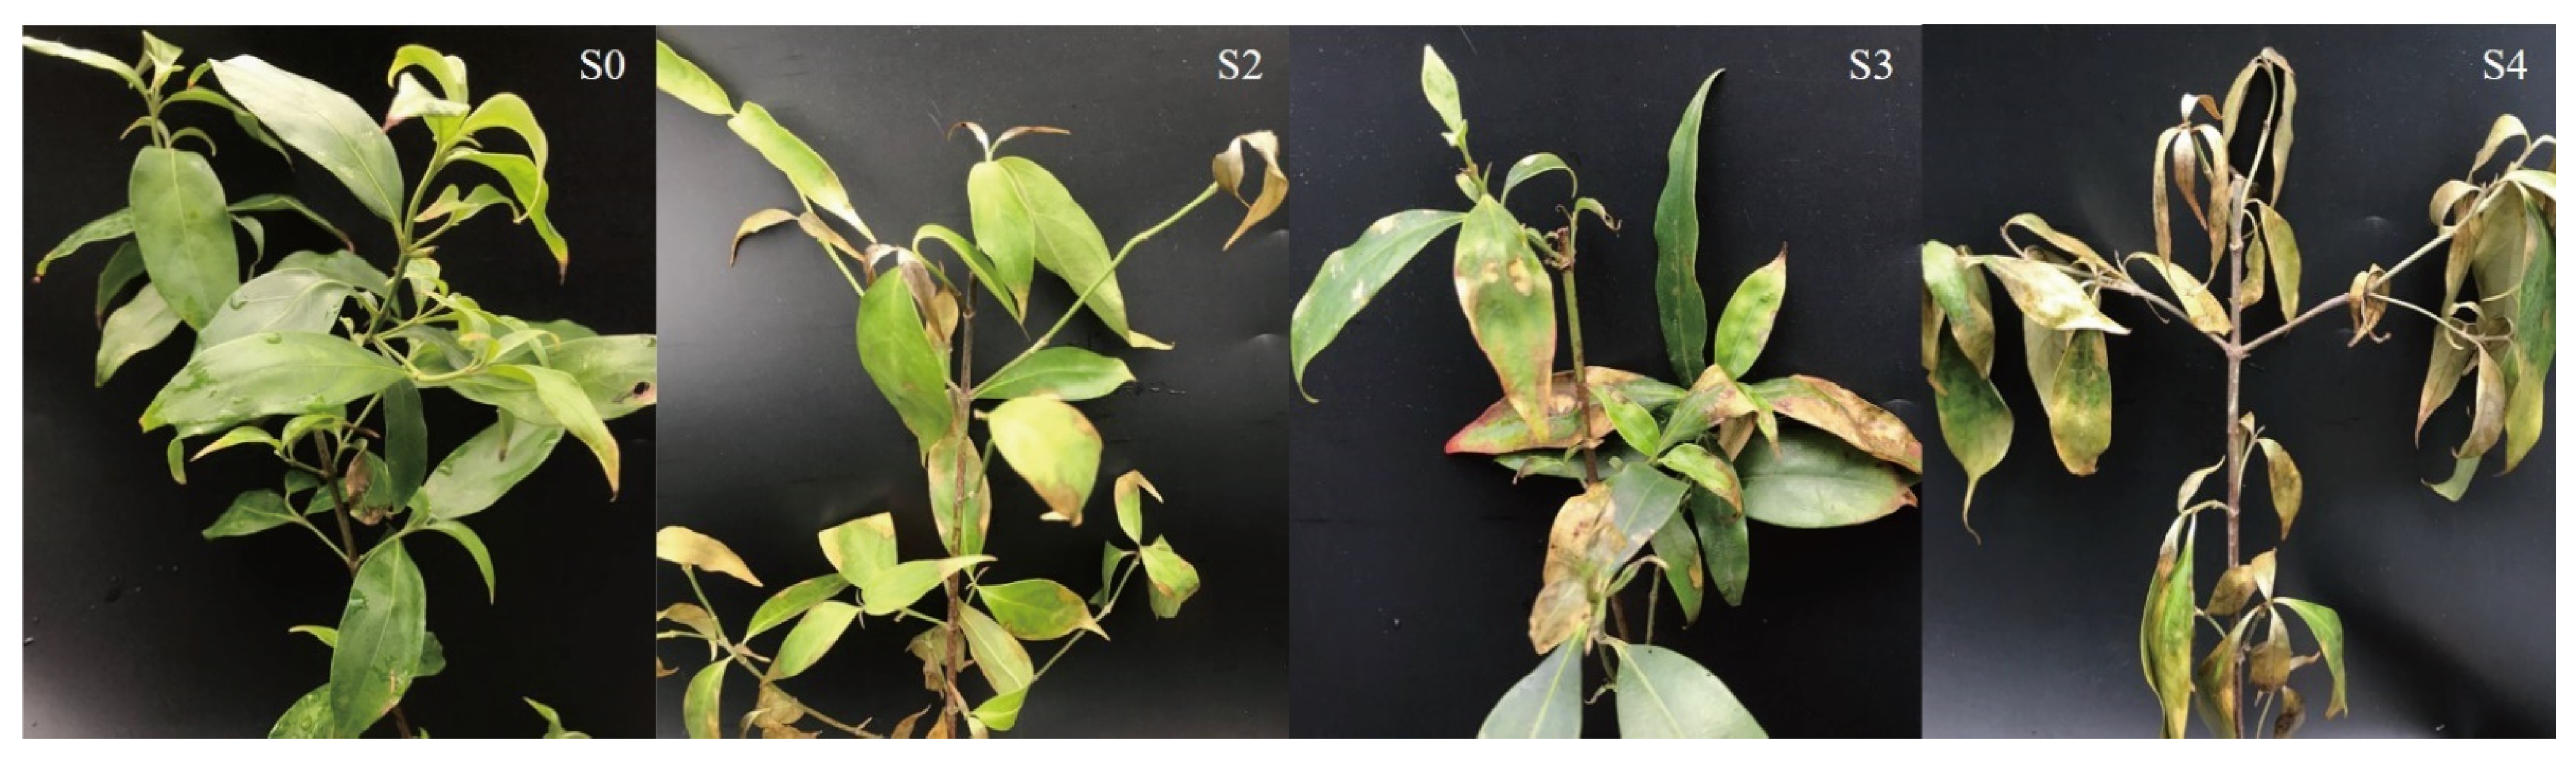
Salt damage symptoms are phenotypic phenomena following physiological responses to salt stress and are commonly used as evaluating criteria of the salt tolerance of plants. When sodium ions (Na+) and chlorine ions (Cl) accumulate in leaves but are not compartmentalized in vacuoles, the leaves can be metabolically toxic so as to manifest features such as “scorched” or “burned” and slight bronzing, followed by leaf-tip death and general necrosis [32]. In our study, the degree of salt injury symptoms in salinized seedlings of C. elegans worsened as the stress duration extended (Table 3). Similar symptoms have been described in many plants suffering from salt stress [32], but the degree varies depending on the salt tolerance of the plant species [1,25]. In addition, the similarity of salt injury symptoms and survival rates in S2 to S0 treatments implied that C. elegans plants could be tolerant of lower salt concentration stress (0.2%).
The survival rate of plants growing in the field was lower than that in the controlled experiment owing to multiple adverse environmental factors, such as strong coastal winds and physiological drought. However, the growth performance of the surviving plants was much better than that under the controlled experimental conditions (Table 3 and Table S1). The reasons may lie in the double stress in salt-treated seedlings under the controlled experimental conditions, as well as being due to the irregular rainfall and irrigation, lowering soil salt concentration, thereby alleviating salt damage in C. elegans in the field trial. In addition, plants of C. elegans in the field with normal blooming and fruiting (Figure S1) revealed strong adaptability as well as valuable ornamental effects under moderate salt concentration stress (≤0.2%).
Salinity stress induces a set of common responses in plants owing to the osmotic stress signal [13]. Osmoregulation can be executed through the accumulation of osmolytes such as proline (Pro), soluble sugar, and soluble protein, which are compatible with cell metabolism in an adverse environment [29,33,34]. The Pro concentrations in 
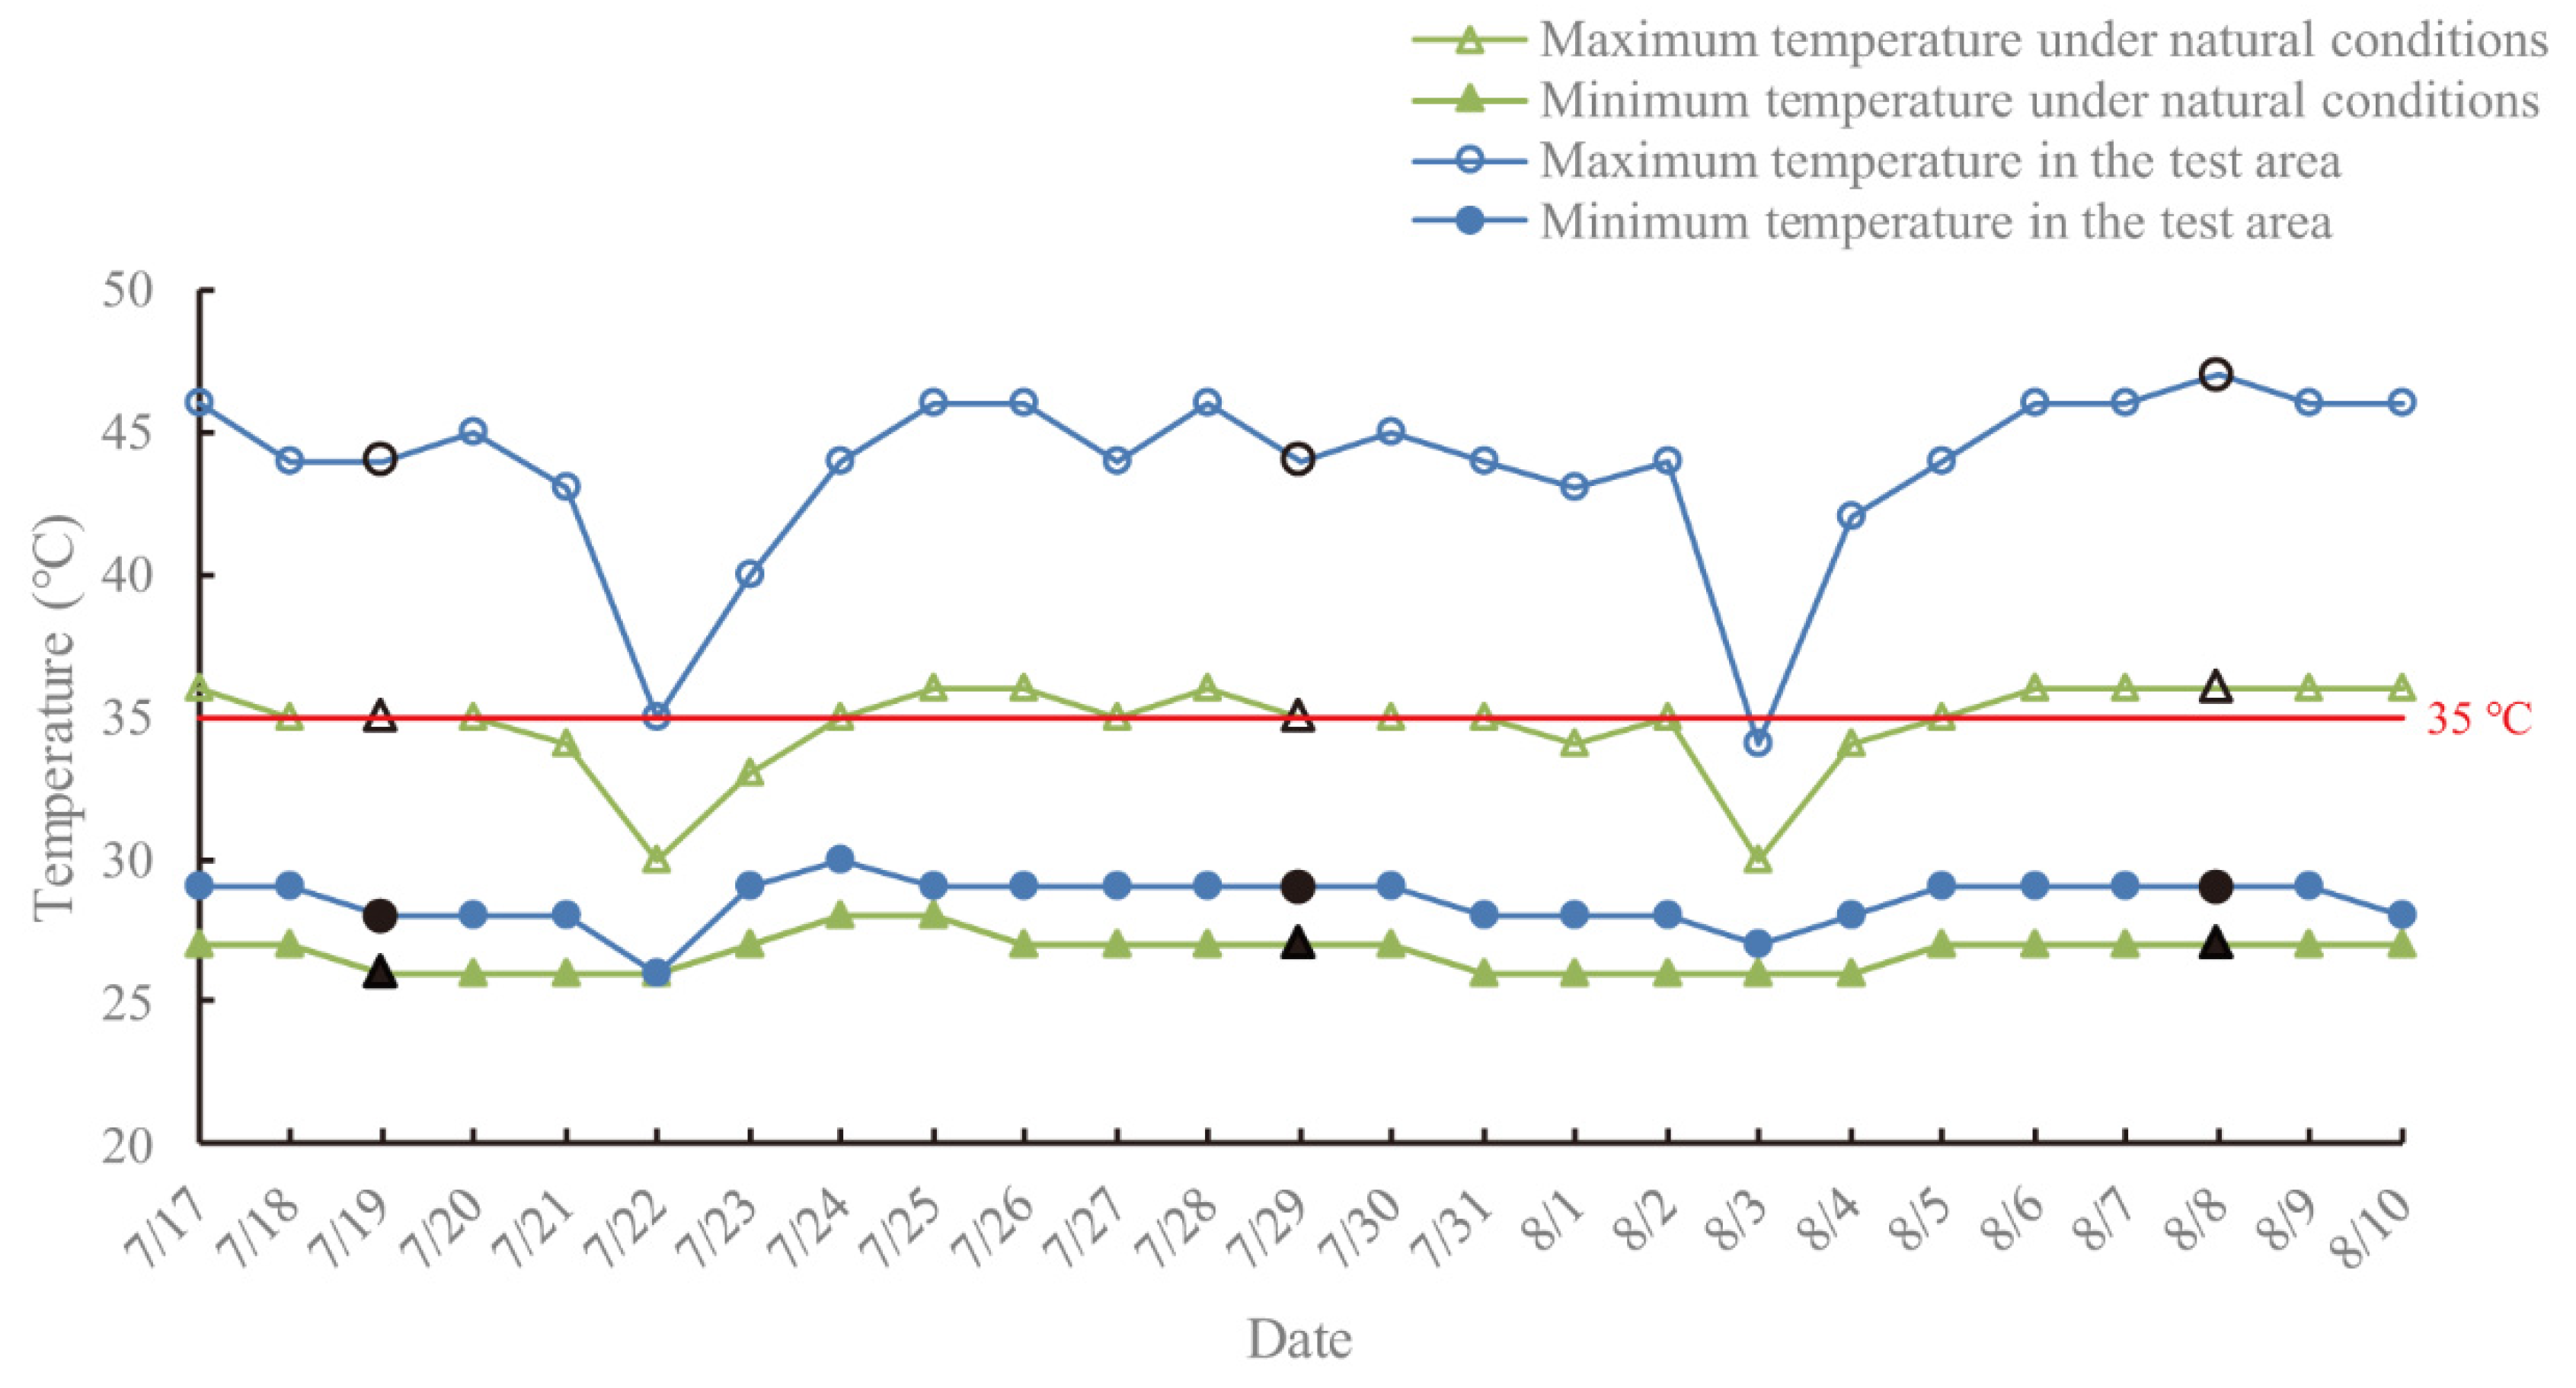
C. elegans seedlings on the 20th day of stress were almost twofold greater than the concentrations on day 0 and day 10 of culture, regardless of no/salt treatments, respectively (Figure 4a), demonstrating that the rise in concentration resulted from dual stress, i.e., salt and heat (Figure 2). This speculation was also supported by the high Pro concentration in CK on the 20th day of culture.
Similarly, the soluble sugar concentration (SSC) significantly increased in response to high salinity stress (≥0.3%) at the termination of the experiment (Figure 4b), parallel to the findings for Medicago truncatula Gaertn. (barrel medic) [35]. In addition, the unimodal pattern, with the maximum of soluble protein concentration (SPC) in all salt-treated seedlings reached on the 10th day (Figure 4c) was similar to that in Camptotheca acuminata Decne. var. acuminata [36]. Thus, we supposed the osmoregulation mode in C. elegans under salt and heat stress to be the earliest accumulation of soluble protein and was the onset of osmoregulation, followed by soluble sugar, and Pro as the later osmolytes.
Usually, excess Na+ and Cl ions are absorbed along with water entering the plant when it is exposed to a high salt concentration for a long time, causing cytosol ion homeostasis imbalance at the cellular level [37]. In this study, Na+ was mainly isolated in the root to prevent it from being transported to the leaves when the salt concentration ≤ 0.2%. However, Na+ ions were transferred to the leaves when the salt concentration ≥ 0.3% (Figure 5a), and corresponding salt damage symptoms in the seedlings also provided strong support (Table 3).
As an exclusion strategy under the salinity field, high potassium/sodium (K+/Na+) and calcium/sodium (Ca2+/Na+) ion ratios may enhance salt tolerance in some crops [38]. The great increase in K+ concentration was induced by the salt culture, but was far behind the increase in Na+ concentration in C. elegans (Figure 5b). Commonly, an increase in Ca2+ concentration induced by a high-salt environment is thought to be more powerful because of its function as a secondary messenger in many biological systems [3,21,39]. However, the high Ca2+ level background in the leaves (as in S0, Figure 6c-S0 and Figure 5d-S0) and abrupt increase in Na+ concentration in salted treatments did not cause an effective increment in the Ca2+/Na+ ratio in salt-stressed C. elegans seedlings (
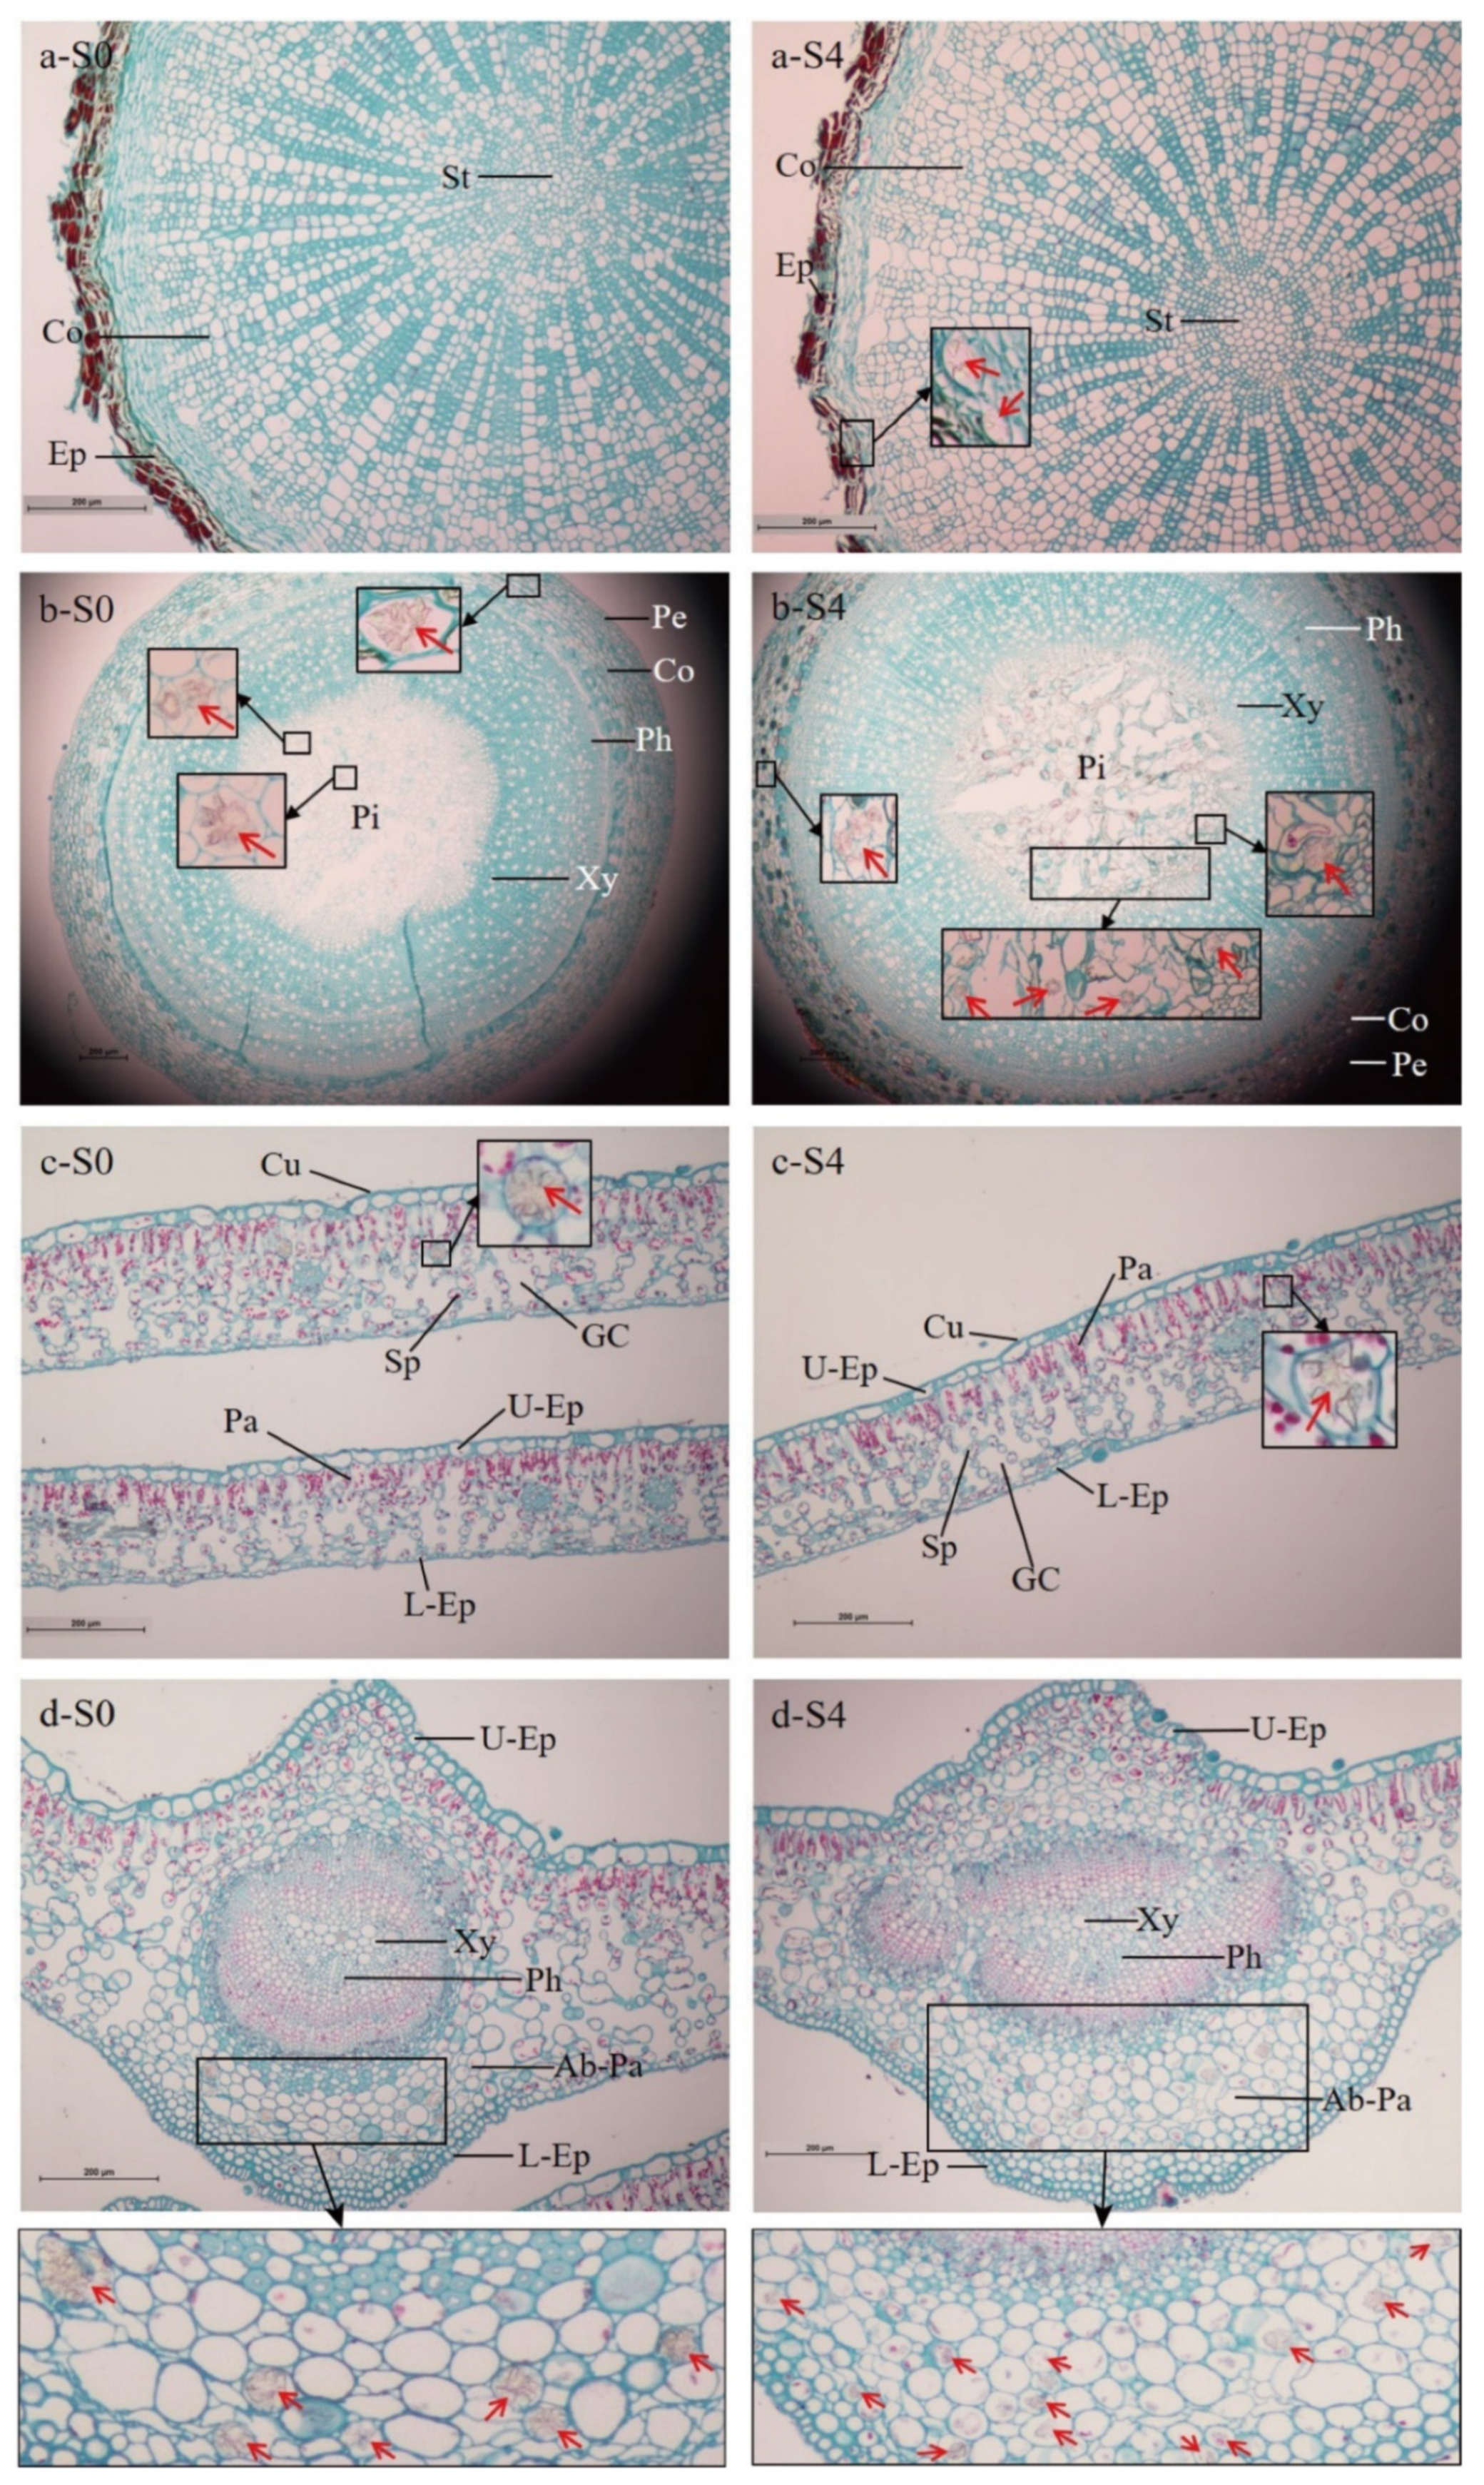
Figure 5d). Even so, a high salt concentration still drove higher calcium oxalate crystal formation (Figure 6-S4, Table 7) to relieve salt stress.
As previous reports have stated, calcium oxalate crystals can serve as a strong localized Ca2+ sink in regulating bulk Ca2+ levels, maintaining ionic equilibrium and enhancing stress tolerance in plants, such as salt stress [8]. Indeed, in C. elegans, massive calcium oxalate crystals were mainly deposited in the parenchyma cells, the palisade tissues and their junction with spongy tissues of the mesophyll, and were particularly enriched in the main vein (Figure 6). The pattern of calcium oxalate crystal accumulation along the veins is common in numerous plants. It is supposed that such precipitation in the cells surrounding the veins could prevent Ca2+ from accumulating around the chlorenchyma cells, which would affect cellular function [8], e.g., photosynthesis.
Under adverse conditions, plants must gradually evolve certain specific morphological structural modifications [27]. As we observed in the stressed seedlings, the looseness and disintegration of cortical cells in the root and stem (Figure 6a,b), and looseness in the palisade and spongy tissues, as well as the enlargement of the gas chamber of the leaves (Figure 6c), demonstrated that the loss of intracellular water causes cells to shrink. On the other hand, the loose arrangement in the palisade and spongy tissues in the leaves enlarged their areas, and combined with enlargement of the leaf gas chamber, these modifications could improve CO2 utilization [40].
Consequently, the results of Ca2+ distribution and anatomic structure changes in the leaves coincided with the results provided by Lu et al. [20], who observed the presence of normal photosynthetic characteristics in C. elegans seedlings treated with 0.2% salt stress.

5. Conclusions

C. elegans is a potential ornamental tree species that can enrich the ecosystem of saline areas. Although alterations at physiological and anatomical levels were observed in the seedlings stressed with various salt concentrations, C. elegans treated with a salt concentration of 0.2%–0.3%, both in controlled conditions and in field environments, displayed good performance in growth, blooming, and fruiting. The high Ca2+ level in the leaves of C. elegans seedlings induced by rising Na+ could explain the salt tolerance at physiological and anatomical levels. Thus, our results highlighted that C. elegans can be cultivated and used as an elite rootstock for grafting cultivars of dogwood in the coastal regions with a salt concentration of 0.2%–0.3% in eastern China. Moreover, a high Ca2+ supply in the field may be an effective strategy to enhance the salinity tolerance of dogwoods. However, further adaptive evaluations should be carried out for long-term cultivation.

Supplementary Materials

The following are available online at https://www.mdpi.com/article/10.3390/f12111522/s1, Figure S1: The growth performances of whole plant (a), florescence (b), red leaves in autumn (c), and leaves with plaque-like purple and anthracnose-like spots (d) in C. elegans in the field experiments. The photos were taken at Dafeng Forest Farm, Yancheng City, Jiangsu Province; Table S1: The average annual relative growth (AARG) of plant height and basal diameter, and survival rate of C. elegans plants in the field observations in 2021. To avoid the impact of individual death and intermediate transplantation, the AARG of plant height and basal diameter was used in this experiment. Its calculation was expressed by dividing the mean difference between the two-survey data (investigated in 2015 and 2021, respectively) by the year apart.

Author Contributions

Conceptualization, Q.L. and X.F.; methodology, Q.L.; validation, Q.L. and X.F.; investigation, Q.L., L.Y., H.W. and J.Y.; resources, X.F.; data curation, Q.L.; writing—original draft preparation, Q.L.; writing—review and editing, Q.L. and X.F.; visualization, Q.L., L.Y. and H.W.; supervision, X.F.; project administration, X.F.; funding acquisition, X.F. All authors have read and agreed to the published version of the manuscript.

Funding

This research was funded by the Jiangsu Provincial Innovation and Promotion of Forestry Science and Technology (LYKJ [2018]06), and the Priority Academic Program Development of Jiangsu Higher Education Institutions (PAPD).

Institutional Review Board Statement

Not applicable.

Informed Consent Statement

Not applicable.

Data Availability Statement

Data are available on request from the corresponding author.

Acknowledgments

We are thankful to Qian Wang for technical support during the original draft preparation and assistance in editing pictures.

Conflicts of Interest

The authors declare no conflict of interest.

References

  1. Jafari, S.; Garmdareh, S.E.H. Effects of salinity on morpho-physiological, and biochemical characteristics of stock plant (Matthiola incana L.). Sci. Hortic. 2019, 257, 108731. [Google Scholar] [CrossRef]
  2. Jiang, Z.H.; Zhou, X.P.; Tao, M.; Yuan, F.; Liu, L.L.; Wu, F.H.; Wu, X.M.; Xiang, Y.; Niu, Y.; Liu, F.; et al. Plant cell-surface GIPC sphingolipids sense salt to trigger Ca2+ influx. Nature 2019, 572, 341–346. [Google Scholar] [CrossRef]
  3. Tuna, A.L.; Kaya, C.; Ashraf, M.; Altunlu, H.; Yokas, I.; Yagmur, B. The effects of calcium sulphate on growth, membrane stability and nutrient uptake of tomato plants grown under salt stress. Environ. Exp. Bot. 2007, 59, 173–178. [Google Scholar] [CrossRef]
  4. Tattini, M.; Traversi, M.L. Responses to changes in Ca2+ supply in two Mediterranean evergreens, Phillyrea latifolia and Pistacia lentiscus, during salinity stress and subsequent relief. Annu. Bot. 2008, 102, 609–622. [Google Scholar] [CrossRef] [Green Version]
  5. Tracy, F.E.; Gilliham, M.; Dodd, A.N.; Webb, A.A.R.; Tester, M. NaCl-induced changes in cytosolic free Ca2+ in Arabidopsis thaliana are heterogeneous and modified by external ionic composition. Plant Cell Environ. 2008, 31, 1063–1073. [Google Scholar] [CrossRef] [PubMed]
  6. Deinlein, U.; Stephan, A.B.; Horie, T.; Luo, W.; Xu, G.H.; Schroeder, J.I. Plant salt-tolerance mechanisms. Trends Plant Sci. 2014, 19, 371–379. [Google Scholar] [CrossRef] [PubMed] [Green Version]
  7. Zhu, G.L.; Ma, Y.; Han, L.; Huo, Z.L.; Wei, X.Z. Current status of research on morphological structure, biological function and formation mechanism of plant crystals. Acta Ecol. Sin. 2014, 34, 6429–6439. [Google Scholar] [CrossRef] [Green Version]
  8. Franceschi, V.R.; Nakata, P.A. Calcium oxalate in plants: Formation and function. Annu. Rev. Plant Biol. 2005, 56, 41–71. [Google Scholar] [CrossRef] [PubMed]
  9. Hussin, S.; Geissler, N.; El-Far, M.M.M.; Koyro, H.W. Effects of salinity and short-term elevated atmospheric CO2 on the chemical equilibrium between CO2 fixation and photosynthetic electron transport of Stevia rebaudiana Bertoni. Plant Physiol. Bioch. 2017, 118, 178–186. [Google Scholar] [CrossRef]
  10. Amira, M.S.; Abdul, Q. Effect of salt stress on plant growth and metabolism of bean plant Vicia faba (L.). J. Saudi Soc. Agric. Sci. 2011, 10, 7–15. [Google Scholar] [CrossRef] [Green Version]
  11. Zhang, J.F. Principle and Technology of Ecological Restoration of Saline Alkali Land, 1st ed.; China Forestry Press: Beijing, China, 2008; pp. 14–15. [Google Scholar]
  12. Wang, S.F.; Hu, Y.X.; Li, Z.L.; Sun, H.J.; Chen, Y.T. Effects of NaCl stress on growth and mineral ion uptake, transportation and distribution of Quercus virginiana. Acta Ecol. Sin. 2010, 30, 4609–4616. [Google Scholar]
  13. Marriboina, S.; Sengupta, D.; Kumar, S.; Reddy, A.R. Physiological and molecular insights into the high salinity tolerance of Pongamia pinnata (L.) pierre, a potential biofuel tree species. Plant Sci. 2017, 258, 102–111. [Google Scholar] [CrossRef]
  14. Renault, S. Salinity tolerance of Cornus sericea seedlings from three provenances. Acta Physiol. Plant 2012, 34, 1735–1746. [Google Scholar] [CrossRef]
  15. Xiang, Q.Y.; Brunsfeld, S.J.; Soltis, D.E.; Soltis, P.S. Phylogenetic relationships in Cornus based on chloroplast DNA restriction sites: Implications for biogeography and character evolution. Syst. Bot. 1996, 21, 515–534. [Google Scholar] [CrossRef]
  16. Fu, X.X.; Liu, H.N.; Zhou, X.D.; Shang, X.L. Seed dormancy mechanism and dormancy breaking techniques for Cornus kousa var. chinensis. Seed Sci. Technol. 2013, 41, 458–463. [Google Scholar] [CrossRef]
  17. Fu, X.X.; Liu, H.N.; Xu, J.; Tang, J.J.; Shang, X.L. Primary metabolite mobilization and hormonal regulation during seed dormancy release in Cornus japonica var. chinensis. Scand. J. For. Res. 2014, 29, 542–551. [Google Scholar] [CrossRef]
  18. Yuan, J.Q.; Fang, Q.; Liu, G.H.; Fu, X.X. Low divergence among natural populations of Cornus kousa subsp. chinensis revealed by ISSR markers. Forests 2019, 10, 1082. [Google Scholar] [CrossRef] [Green Version]
  19. Lu, Q.; Xu, J.; Fu, X.X.; Fang, Y. Physiological and growth responses of two dogwoods to short-term drought stress and re-watering. Acta Ecol. Sin. 2020, 40, 172–177. [Google Scholar] [CrossRef]
  20. Lu, Q.; Yang, L.; Wang, H.W.; Yuan, J.Q.; Fu, X.X.; Fang, Y. Responses of photosynthetic characteristics and chloroplast ultrastructure to salt stress in seedlings of Cornus hongkongensis subsp. elegans. J. Nanjing For. Univ. Nat. Sci. Ed. 2020, 44, 29–37. [Google Scholar] [CrossRef]
  21. Cimato, A.; Castelli, S.; Tattini, M.; Traversi, M.L. An ecophysiological analysis of salinity tolerance in olive. Environ. Exp. Bot. 2010, 68, 214–221. [Google Scholar] [CrossRef]
  22. Equiza, M.A.; Calvo-Polanco, M.; Cirelli, D.; Señorans, J.; Wartenbe, M.; Saunders, C.; Zwiazek, J.J. Long-term impact of road salt (NaCl) on soil and urban trees in Edmonton, Canada. Urban For. Urban Gree. 2017, 21, 16–28. [Google Scholar] [CrossRef]
  23. Lu, R.K. Soil Agrochemical Analysis Method, 1st ed.; China Agricultural Science and Technology Press: Beijing, China, 2000; pp. 12–168. [Google Scholar]
  24. Park, E.S.; Yu, T.; Lee, H.J.; Lim, Y.I.; Lee, S.M.; Park, K.Y. Shinan sea salt intake ameliorates colorectal cancer in AOM/DSS with high fat diet-induced C57BL/6N mice. J. Med. Food 2021, 24, 431–435. [Google Scholar] [CrossRef] [PubMed]
  25. Abid, M.; Zhang, Y.J.; Li, Z.; Bai, D.F.; Zhong, Y.P.; Fang, J.B. Effect of salt stress on growth, physiological and biochemical characters of Four kiwifruit genotypes. Sci. Hortic. 2020, 271, 109473. [Google Scholar] [CrossRef]
  26. Wang, X.K.; Huang, J.L. Principles and Techniques of Plant Physiological Biochemical Experiment, 3rd ed.; Higher Education Press: Beijing, China, 2015; pp. 171–275. [Google Scholar]
  27. Naz, N.; Fatima, S.; Hameed, M.; Naseer, M.; Batool, R.; Ashraf, M.; Ahmad, F.; Ahmad, M.S.A.; Zahoor, A.; Ahmad, K.S. Adaptations for salinity tolerance in Sporobolus ioclados (Nees ex Trin.) Nees from saline desert. Flora 2016, 223, 46–55. [Google Scholar] [CrossRef]
  28. Zhang, G.C.; Dai, L.X.; Ding, H.; Ci, D.W.; Ning, T.Y.; Yang, J.S.; Zhao, X.H.; Yu, H.Q.; Zhang, Z.M. Response and adaptation to the accumulation and distribution of photosynthetic product in peanut under salt stress. J. Integr. Agric. 2020, 19, 690–699. [Google Scholar] [CrossRef]
  29. Hasegawa, P.M.; Bressan, R.A.; Zhu, J.K.; Bohnert, H.J. Plant cellular and molecular responses to high salinity. Annu. Rev. Plant Physiol. Plant Mol. Biol. 2000, 51, 463–499. [Google Scholar] [CrossRef] [Green Version]
  30. Munns, R.; Tester, M. Mechanisms of salinity tolerance. Annu. Rev. Plant Biol. 2008, 59, 651–681. [Google Scholar] [CrossRef] [PubMed] [Green Version]
  31. Li, J.; Gao, J.; Sun, Z.Y.; Li, X.P.; Mu, S.H. Change of ion content in Phyllostachys vivax and Ph. glauca and its relationships with growth and photosynthesis in coastal regions. Chin. J. Appl. Ecol. 2016, 27, 3145–3152. [Google Scholar] [CrossRef]
  32. Cassaniti, C.; Leonardi, C.; Flowers, T.J. The effect of sodium chloride on ornamental shrubs. Sci. Hortic. 2009, 122, 586–593. [Google Scholar] [CrossRef]
  33. Zhang, R.; Xu, C.; Bao, Z.L.; Xiao, R.; Chen, X.D.; Xiao, W.; Li, D.M.; Fu, X.L.; Yang, C.; Li, L. Auxin alters sodium ion accumulation and nutrient accumulation by playing protective role in salinity challenged strawberry. Plant Physiol. Bioch. 2021, 164, 1–9. [Google Scholar] [CrossRef] [PubMed]
  34. Mansour, M.M.F.; Ali, E.F. Evaluation of proline functions in saline conditions. Phytochemistry 2017, 140, 52–68. [Google Scholar] [CrossRef]
  35. Hidalgo-Castellanos, J.; Duque, A.S.; Burgueño, A.; Herrera-Cervera, J.A.; Fevereiro, P.; López-Gómez, M. Overexpression of the arginine decarboxylase gene promotes the symbiotic interaction Medicago truncatula-Sinorhizobium meliloti and induces the accumulation of proline and spermine in nodules under salt stress conditions. J. Plant. Physiol. 2019, 241, 153034. [Google Scholar] [CrossRef] [PubMed]
  36. Meng, C.J.; Du, X.C.; Zhao, Y.P. Physiological mechanism of mitigative effects of salicylic acid on salt-stressed Camptotheca acuminata seedlings. J. Northeast Agric. Sci. 2018, 43, 23–27. [Google Scholar] [CrossRef]
  37. Tester, M.; Davenport, R. Na+ tolerance and Na+ transport in higher plants. Annu. Bot. 2003, 91, 503–527. [Google Scholar] [CrossRef] [PubMed]
  38. Al-Karaki, G.N. Growth, water use efficiency, and sodium and potassium acquisition by tomato cultivars grown under salt stress. J. Plant. Nutr. 2000, 23, 1–8. [Google Scholar] [CrossRef]
  39. Mansour, M.M.F.; Salama, K.H.A.; Al-Mutawa, M.M. Transport proteins and salt tolerance in plants. Plant. Sci. 2003, 164, 891–900. [Google Scholar] [CrossRef]
  40. Chartzoulakis, K.; Patakas, A.; Kofidis, G.; Bosabalidis, A.; Nastou, A. Water stress affects leaf anatomy, gas exchange, water relations and growth of two avocado cultivars. Sci. Hortic. 2002, 95, 39–50. [Google Scholar] [CrossRef]
Figure 1. Conceptual map of the experimental design of the field trial and controlled experiment.
Forests 12 01522 g001
Figure 2. Comparisons between maximum and minimum temperatures in the natural field and test area during the experimental trial. The black marks denote the sampling times. The meteorological data under natural conditions were obtained from the China Meteorological Administration (http://www.cma.gov.cn/ (accessed on 2 October 2021)), and the daily data for the test area were recorded with an agricultural environmental monitor (TNHY-D, TOP Instrument Co. Ltd., Zhejiang, China).
Forests 12 01522 g002
Figure 3. Damage symptoms in the leaves and branches in Cornus hongkongensis subsp. elegans (W. P. Fang et Y. T. Hsieh) Q. Y. Xiang seedlings. The photos were taken at the end of the experiment. S0, S2, S3, and S4 indicate control, 0.2%, 0.3%, and 0.4% salt concentration treatments, respectively.
Forests 12 01522 g003
Figure 4. Effects of salinity stress on (a) proline concentration, (b) soluble sugar concentration, and (c) soluble protein concentration in C. elegans seedlings. S0, S2, S3, and S4 indicate control, 0.2%, 0.3%, and 0.4% salt concentration treatments, respectively. Columns are the mean ± standard error. Lowercase letters denote statistical results among different treatments at the same sampling time, and uppercase letters denote statistical results among different sampling times for the same treatment. The same letters are not different by the Duncan’s new multiple range test at 5% probability.
Forests 12 01522 g004
Figure 5. Effects of salinity stress on (a) sodium ion (Na+) concentration, (b) potassium ion (K+) concentration, (c) calcium ion (Ca2+) concentration, and (d) calcium/sodium (Ca2+/Na+) ion ratio in C. elegans seedlings. S0, S2, S3, and S4 indicate control, 0.2%, 0.3%, and 0.4% salt concentration treatments, respectively. Columns are the mean ± standard error. Lowercase letters denote statistical results among different treatments in the same organ, and uppercase letters denote statistical results among different organs for the same treatment. The same letters indicate no difference by the Duncan’s new multiple range test at 5% probability.
Forests 12 01522 g005
Figure 6. Effects of salinity stress on the anatomical structure of the (a) root, (b) stem, (c) mesophyll, and (d) main vein in C. elegans seedlings. To highlight the contrast effects, only images from the S0 (control treatment) and S4 (0.4% salt concentration treatment) are shown here. Ep, epidermis; Co, cortex; St, stele; Pe, periderm; Ph, phloem; Xy, xylem; Pi, pith; Cu, cuticula; U-Ep, upper epidermis; Pa, palisade tissue; Sp, spongy tissue; L-Ep, lower epidermis; GC, gas chamber; Ab-Pa, abaxial parenchyma. The red arrows indicate the regions of calcium oxalate crystals deposition in various tissues. The black box area shows the magnified picture. Bar = 200 μm.
Forests 12 01522 g006
Table 1. The basic physical and chemical properties of the field soil. The measurement methods were according to Lu [23]. Values are the mean ± standard error. Values for each column followed by different letters denote a significant difference among different treatments according to Duncan’s new multiple range test (p < 0.05).
Soil TypeSoil LayerSalt Concentration (%)pHTotal Carbon (g kg−1)Total Nitrogen (g kg−1)Total Phosphorus (g kg−1)
Sandy soil0–10 cm0.11–0.218.22 ± 0.06 b9.57 ± 0.55 a0.67 ± 0.05 a1.11 ± 0.08
10–20 cm0.10–0.168.34 ± 0.07 b7.55 ± 1.39 a0.60 ± 0.10 a1.03 ± 0.10
20–30 cm0.10–0.168.64 ± 0.04 a4.21 ± 0.85 b0.23 ± 0.03 b0.86 ± 0.04
Table 2. Classification system of salt injury degree based on symptoms of seedling.
GradeSalt Injury Symptoms
0No obvious salt damage symptoms.
1The color in the vein, leaf tip, and edge turns yellow, and a few leaves are plaque-like purple in a minority of individuals.
2The color in the vein, leaf tip, and edge turns yellow, and anthracnose-like spots are present in leaves in some individuals.
3Scorched leaf tips and edges occur in half the individuals; purple leaf, as well as disease-like symptoms are also observed.
4Scorched leaf tips and edges occur in most individuals; leaf fall and minor death phenomena are also observed.
5Withered branch and leaf fall phenomena occur in some individuals; 20%–30% of dead individuals are noted.
6Withered branch and leaf fall phenomena occur in most individuals; 50% of dead individuals are noted.
Table 3. Salt damage levels of Cornus hongkongensis subsp. elegans (W. P. Fang et Y. T. Hsieh) Q. Y. Xiang seedlings at various stages of salt stress. S0, S2, S3, and S4 indicate control, 0.2%, 0.3%, and 0.4% salt concentration treatments, respectively. Values are the mean ± standard error. Values for each column followed by different letters denote a significant difference among different treatments according to Duncan’s new multiple range test (p < 0.05).
TreatmentsDuration of Salt Stress (Day) and Salt Damage GradeSurvival Rate (%)
5th10th15th20th
S0013488.33 ± 1.67 a
S2014481.67 ± 3.33 a
S3135650.00 ± 2.89 b
S4235646.67 ± 1.67 b
Table 4. Two-factor variance analysis of osmoregulation substances with the factors of salt treatment. *, **: significant at the 0.05 and 0.01 probability levels, respectively.
ParametersF Value
Salt ConcentrationSalt Stress DurationSalt Concentration × Salt Stress Duration
Proline concentration1.5852.27 **0.52
Soluble sugar concentration3.66 *1.341.24
Soluble protein concentration5.22 **85.16 **2.66 *
Table 5. Correlation analysis of salt concentrations with osmoregulation substances and ion concentrations in C. elegans seedlings. *, **: significant at the 0.05 and 0.01 probability levels, respectively, by the Pearson correlations. SCs, salt concentrations; Pro, proline; SSC, soluble sugar concentration; SPC, soluble protein concentration; Na+, sodium ions; K+, potassium ions; Ca2+, calcium ions.
SCsPro ConcentrationSSCSPCNa+ ConcentrationK+ ConcentrationCa2+ Concentration
SCs1.00
Pro concentration0.181.00
SSC0.43 **0.171.00
SPC0.05−0.040.211.00
Na+ concentration0.81 **0.040.44 **0.261.00
K+ concentration0.180.84 **0.300.070.121.00
Ca2+ concentration0.51 **0.79 **0.300.090.34 *0.86 **1.00
Table 6. Effects of salinity stress on the anatomical structure of organs in C. elegans seedlings. S0, S2, S3, and S4 indicate control, 0.2%, 0.3%, and 0.4% salt concentration treatments, respectively. Pw/Sd, pith width/stem diameter; Xt/Sr, xylem thickness/stem radius; Pt/Sr, phloem thickness/stem radius; Ct/Sr, cortical thickness/stem radius; Pt/Lt, palisade tissue thickness/leaf thickness; St/Lt, spongy tissue thickness/leaf thickness. Values are the mean ± standard error. Values for each column followed by different letters denote a significant difference among different treatments according to Duncan’s new multiple range test (p < 0.05).
TreatmentsPw/SdXt/SrPt/SrCt/SrPt/LtSt/Lt
S00.48 ± 0.02 b0.28 ± 0.01 b0.08 ± 0.01 b0.13 ± 0.00 a0.22 ± 0.01 b0.61 ± 0.01 b
S20.55 ± 0.02 a0.44 ± 0.02 a0.25 ± 0.02 a0.12 ± 0.00 b0.25 ± 0.01 a0.61 ± 0.01 b
S30.40 ± 0.01 c0.25 ± 0.02 b0.23 ± 0.02 a0.13 ± 0.00 a0.25 ± 0.01 a0.62 ± 0.01 b
S40.43 ± 0.01 c0.21 ± 0.01 c0.22 ± 0.01 a0.09 ± 0.00 c0.22 ± 0.01 b0.64 ± 0.01 a
Table 7. Density of calcium oxalate crystals in various organs of C. elegans seedlings. Calcium oxalate crystals were counted in three visual fields for each treatment. S0, S2, S3, and S4 indicate control, 0.2%, 0.3%, and 0.4% salt concentration treatments, respectively. Values are the mean ± standard error. Values for each row in the same organ followed by different letters denote a significant difference among different treatments according to Duncan’s new multiple range test (p < 0.05).
OrganTreatments and Density (Number mm−2)
S0S2S3S4
Root4.00 ± 2.31 b69.33 ± 7.06 a74.67 ± 1.33 a80.00 ± 4.62 a
Stem32.00 ± 6.11 b72.00 ± 8.00 a78.67 ± 1.33 a84.00 ± 4.62 a
LeafMain vein346.67 ± 35.28 b433.33 ± 35.28 ab446.67 ± 29.06 ab506.67 ± 26.67 a
Mesophyll133.33 ± 29.06 b140.00 ± 11.55 b153.33 ± 13.33 b246.67 ± 40.55 a
Publisher’s Note: MDPI stays neutral with regard to jurisdictional claims in published maps and institutional affiliations.

