Abstract
Uncontrolled deforestation and land clearing for agricultural, urban development, and infrastructure construction without considering cover management (C&P) factors have resulted in severe soil erosion over the land surface of Cameron Highlands in the state of Pahang, Malaysia. Thus, this study determines the C&P factors for the Universal Soil Loss Equation (USLE) to forecast soil loss risk. Land use and land cover recorded by PLANMalaysia and the Department of Agriculture (DOA) Malaysia have produced different C&P factors in Cameron Highlands. The C&P factor produced from PLANMalaysia and the DOA has values ranging between 0.01 to 1.00 and 0.30 to 0.49, respectively. Since the C&P factor varies according to the data source, this study combined both data sources to capture both agricultural and urban development impacts, resulting in an acceptable C&P factor. These new C&P factors have improved the prediction of soil loss risk with 15.63% (10,581.86 hectares) of the Cameron Highlands area classified as having a moderate–critical soil loss risk compared to DOA 7.16% (4844.97 hectares) and PLANMalaysia’s 11.46% (7725.26 hectares). Thus, local authorities must strengthen all regulations and policies to address the predicted moderate–critical soil loss risk in Cameron Highlands, thereby preventing severe soil erosion.
1. Introduction
Soil erosion significantly impacts on land degradation globally [1,2] and can be defined as the excessive soil removal by erosion agents that lead to soil degradation [2]. Soil degradation can be categorized into seven major groups based on the cause of degradation: water erosion, wind erosion, mass motion, salt excess, physical, biological, and chemical degradation [1]. Soil erosion has become a global environmental problem, especially for developing and undeveloped countries, due to population growth and continuous land clearing activity. Soil erosion has endangered developing nations, such as Malaysia, by destroying fertile topsoil, reducing water holding capacity, reducing water quality, and increasing the risk of flooding [2]. Erosion and sedimentation issues are inevitable in Malaysia due to rapid development of numerous nation pieces, for example, land clearing for lodging, logging, and agribusiness estate [3]. Soil erosion studies assist decision-makers in determining the rate of soil loss in a given region and developing alternative land management measures [2].
For a long time, grounds in Cameron Highlands have been opened and levelled for horticultural development, concentrated harvest creation, and metropolitan advancement [3,4]. A good country alludes to an area with incline slopes of more than 25° at an elevation more noteworthy than 500 m above the mean ocean level. If not adequately supervised, it has a high potential for avalanches and soil erosion [2,3,4]. Cameron Highlands’ complete agrarian inclusion is often limited and is fundamentally accomplished on steep slants. Undeniable degrees of soil degradation and natural pollution have occurred due to the high utilization of manures and pesticides by neighborhood ranchers, trailed by an expanded recurrence of significant tempest occasions [5]. Numerous new rural practices have resulted in widespread soil erosion due to wind or stream, or both [2,3,6]. Hence, this discovery is critical, and a superior precision forecast of soil erosion danger should be produced for future planning.
However, measuring soil loss due to water erosion at different spatiotemporal scales remains difficult; soil loss is usually calculated using erosion models [7,8]. Soil erosion models have been developed to determine soil loss due to water erosion, ranging from simple analytical models such as the Universal Soil Loss Equation (USLE) to process-based models. Incorporating data from various local agencies and the Urban Stormwater Management Manual for Malaysia, developed by the Department of Irrigation and Drainage (DID) Malaysia [9], the difficulties associated with measuring the soil loss/erosion were alleviated. Slope and land-use exercises are vital in determining C&P factors. The C&P values are equivalent to 1.00 under bare surface soil conditions without cover management and conservation practice based on USLE standard plots [10,11]. These variables are then included in the USLE model to assess anticipated soil erosion hazards [7].
Based on past research, the degree of accuracy for C&P factors and soil loss can be improved further by including both agricultural and development activities that have the most significant impact on the study area, thereby highlighting the gaps of the research study. For example, a study by Rizeei et al. [12] computed C&P factors using input data from Landsat images, which may have missed important values of C&P factors by classifying crops into agriculture and development as urban. Another study by Omar et al. [13] computed C&P factors only based on agricultural impact, omitting the impact from urban development. On the other hand, the range value in the study for soil loss assessment is more detailed and acceptable than the previous studies that used a broader soil loss risk category [12,13].
Thus, precise C&P variables will ultimately deliver specific soil loss hazards, which can aid local authorities in monitoring and strategizing about land-use exercises [7]. Hence, the proposed research objective is to create new acceptable C (crop management factor) and P (support practice factor) values and a risk map and categories system for soil loss in the Cameron Highlands.
2. Literature Reviews
Cropping and management decisions regularly have the greatest potential to affect soil erosion on agricultural land directly. Prior land usage and current soil humidity can also contribute to the soil’s erodibility [14]. Combined, the cover management factor, or C factor, expresses the effects of management practices on the soil. The C factor quantifies the impact of tillage and the use of cover crops and plant residues on soil loss, and its value differs seasonally due to cover change [15]. The C factor is generally calculated by comparing the weighted average ratio of soil loss in the experimental plot to that of a unit (control) plot. Still, it has been determined differently in various studies [16].
Terracing, sheltering, and contouring are common conservation practices in agricultural landscapes that significantly reduce soil erosion. Consider how water flows through a landscape better to understand the effect of these activities [15]. The support practices factor, or P factor, quantifies the impact of these practices. These practices are large-scale investments that rarely alter. The P factor quantifies the impact of contour farming, bundle buildings, and other physical land management systems on soil loss [15]. This factor is calculated by measuring the soil loss ratio due to runoff in a plot, introducing a conservation method to soil loss from a unit plot [17]. The P factor considers measures that lower runoff’s erosion potential by modifying runoff concentration and velocity, drainage patterns, and the hydraulic force exerted on the soil surface by a runoff [15,17].
C&P factors influence local variables such as land use and cover, land management activities, soil type, topography, and climate. Therefore, establishing C&P variables using locally calculated data would improve USLE’s reliability in predicting soil loss, which is influenced by other factors such as rainfall erosivity, soil erodibility, slope length, and slope steepness [18]. This consideration of all six factors of the USLE, which had not been included previously [11,19], provides a more accurate assessment of soil loss, which is widely used regionally and internationally [20]. The USLE allows the effect of these activities on soil erosion to be measured and used in creating a specific field conservation plan.
3. Materials and Methods
3.1. Study Area
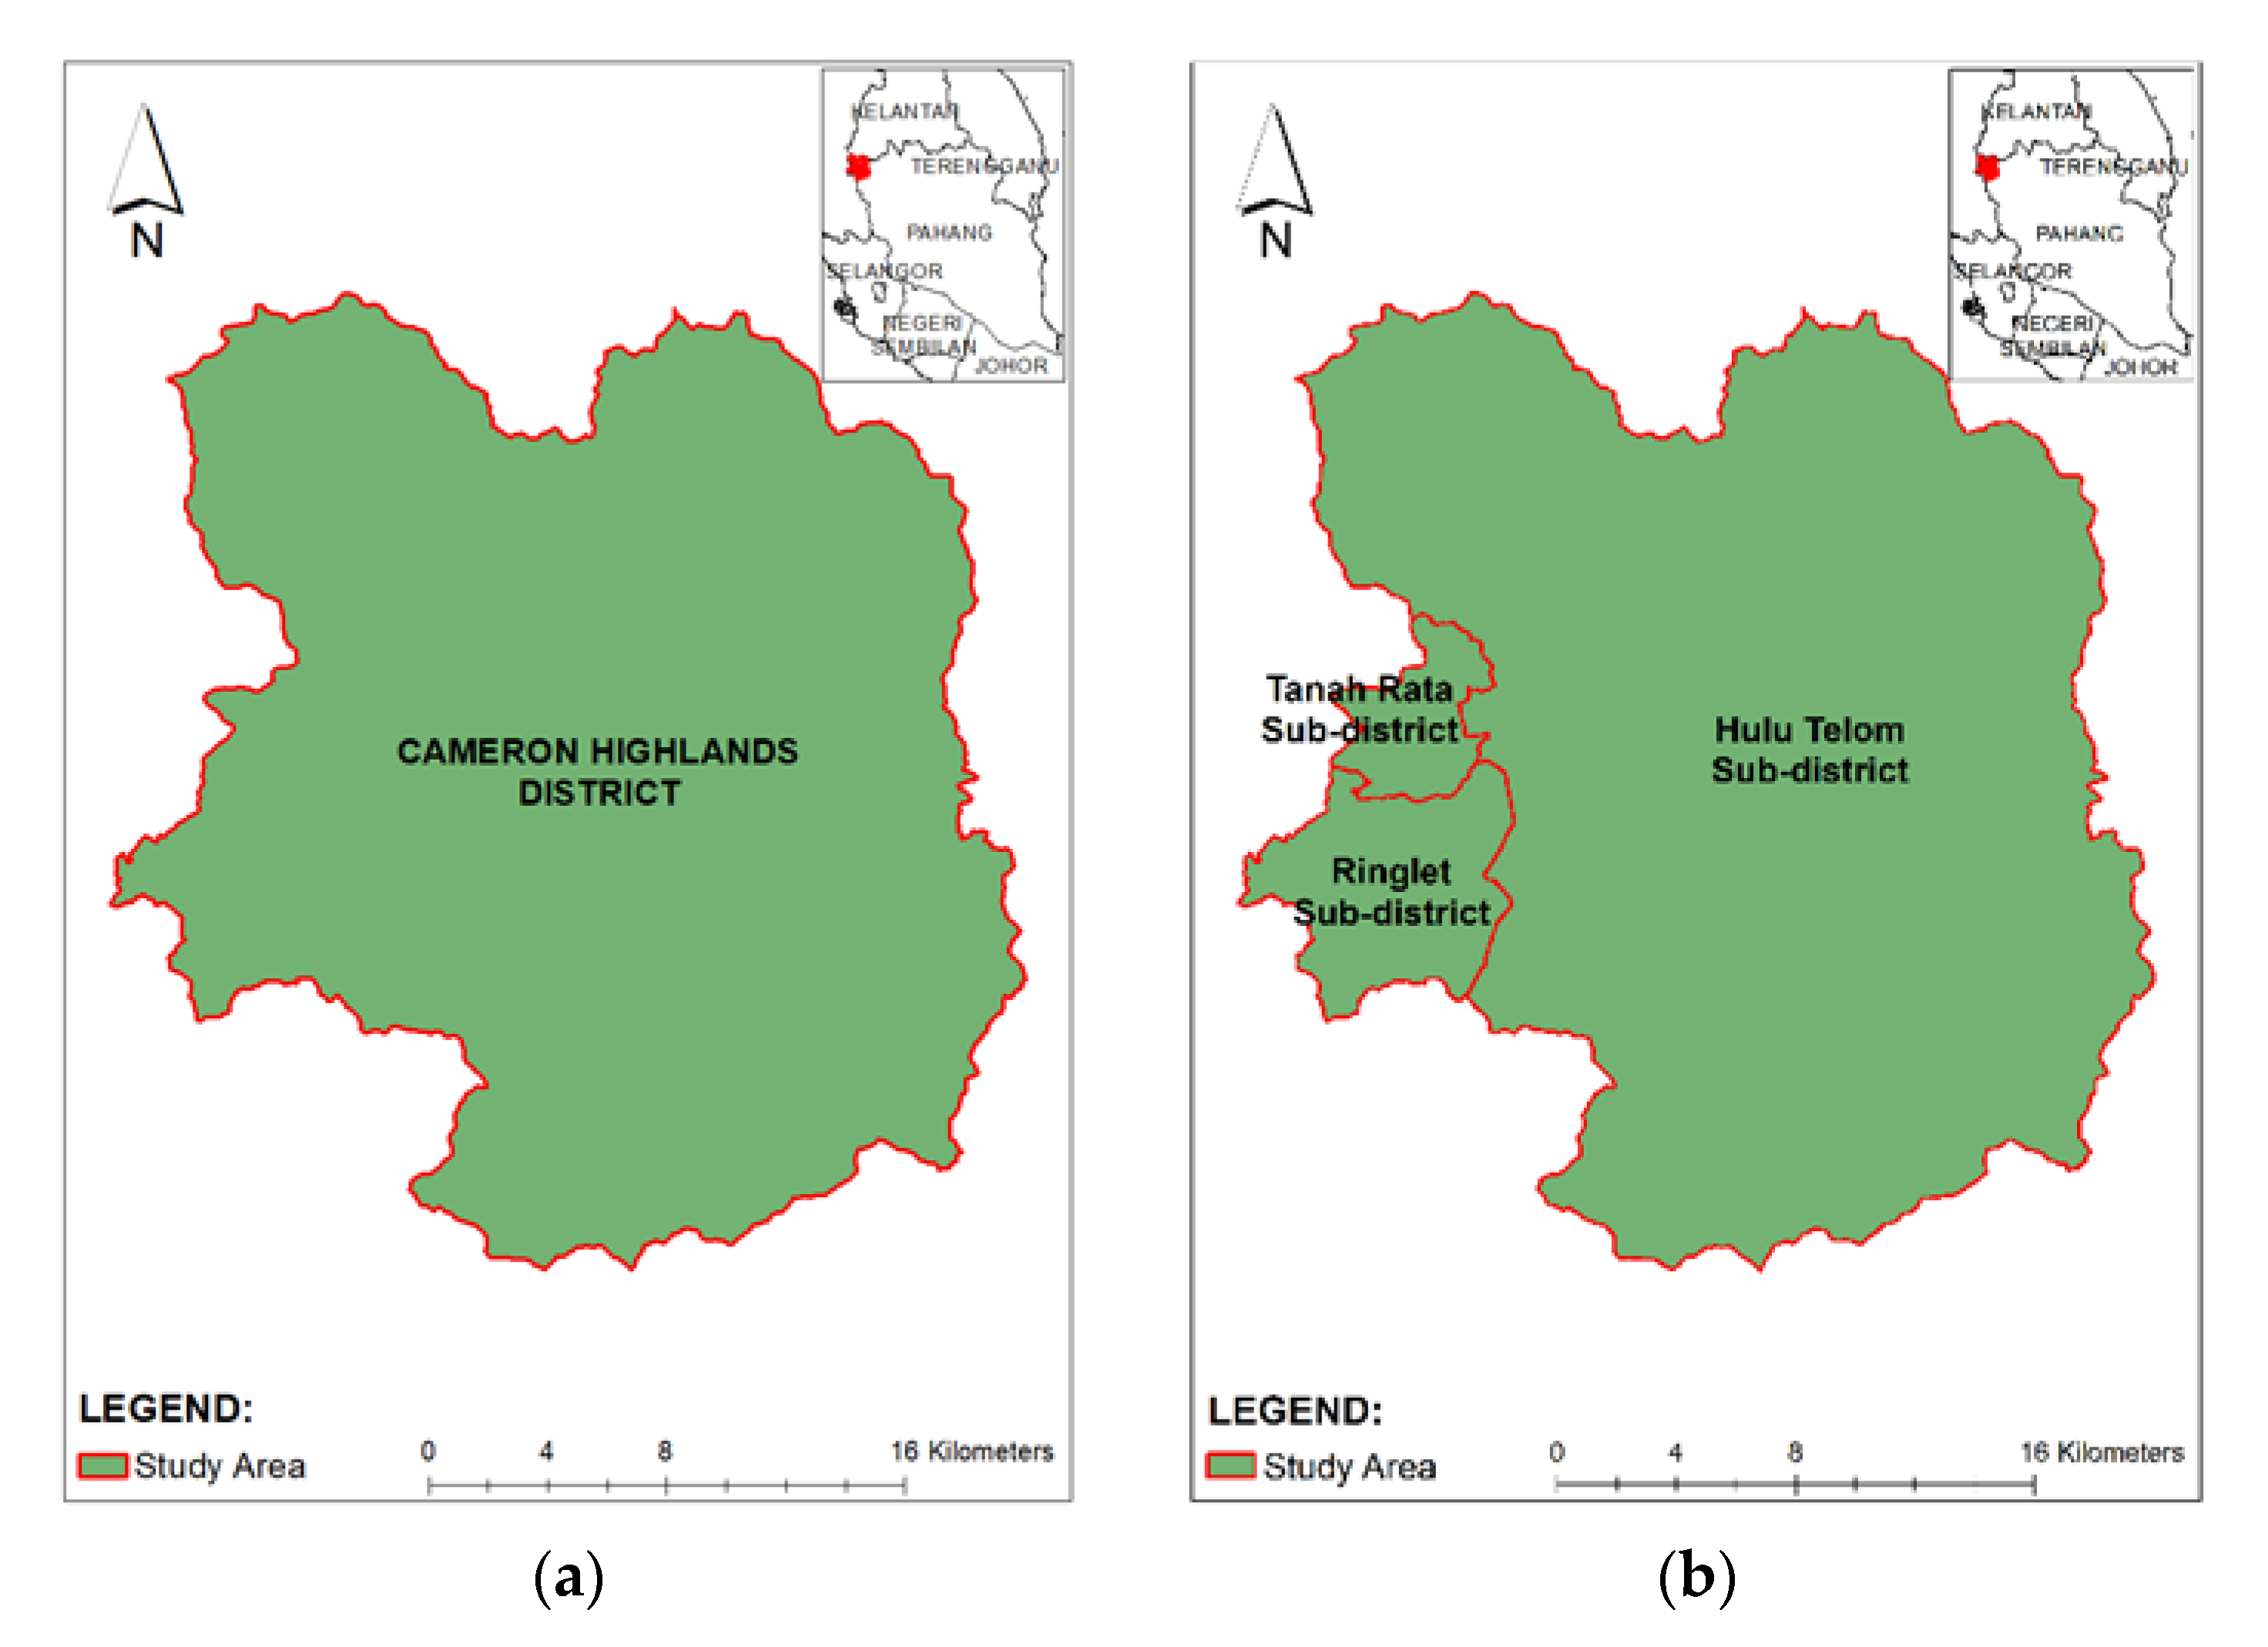
Cameron Highlands is a district in Pahang, Malaysia, with an approximate area of 68,156.74 hectares. Cameron Highlands is divided into three sub-districts: Hulu Telom (an area of approximately 61,321.78 hectares), Tanah Rata (an area approximately of 2003.10 hectares), and Ringlet (an area approximately of 4831.87 hectares). Hulu Telom is the largest sub-district in Cameron Highlands, while Tanah Rata is the smallest sub-district in Cameron Highlands. Cameron Highlands has three river catchments: Sg. Telom (an approximate area of 30,531.47 hectares), Sg. Bertam (an approximate area of 26,579.81), and Sg. Lemoi (an approximate area of 11,045.44 hectares). Sg. Telom is the largest catchment in the north of Cameron Highlands, while Sg. Lemoi is the smallest catchment in the south. Figure 1 shows the Cameron Highlands by district, sub-district, and river catchment.
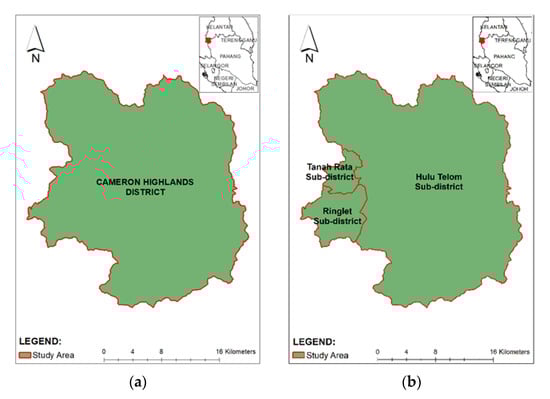
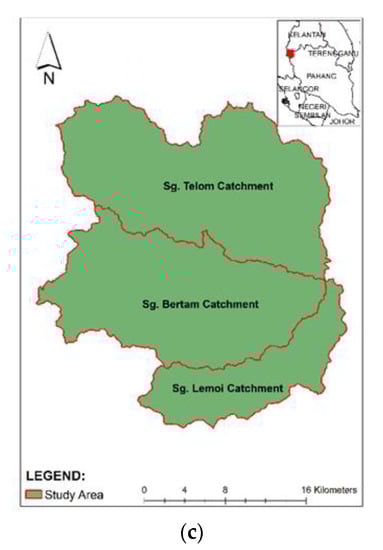
Figure 1.
Cameron Highlands by (a) district, (b) sub-district, and (c) river catchment.
3.2. Land-Use Activities
Land-use management involves managing and modifying natural or wilderness areas to create built environments such as fields, pastures, settlements, military, leisure, and transportation. The land-use data is critical for analyzing and planning the study area. The catchment’s surface characteristic can greatly influence the flow rate and other runoff characteristics. Various activities can affect soil, resulting in various problems such as flooding and landslides. With land-use information, soil loss risk can be modeled and calculated to guide planners and local authorities.
The study gathered data on land use from two sources: the Department of Agriculture (DOA) Malaysia and PLANMalaysia. Figure 2a,b show the land-use activities in Cameron Highlands [13,14]. Forestry is the major land use in Cameron Highlands, with 91.85 percent (based on DOA) and 87.90 percent (based on PLANMalaysia). Simultaneously, agriculture is the primary economic activity in Cameron Highlands. Table 1 shows the area of each land-use activity in Cameron Highlands. Tea, vegetables, and decorative plants are major agriculture activities in Cameron Highlands. This information, obtained from both agencies, was analyzed and assessed.
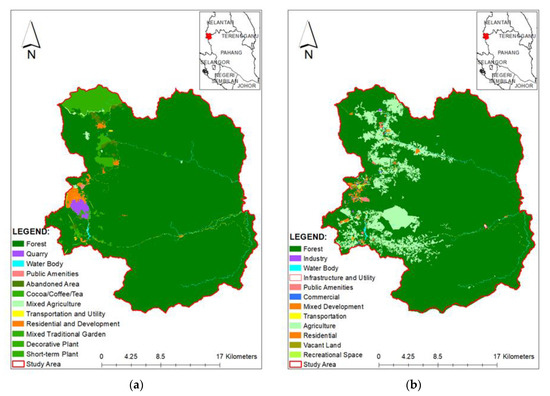
Figure 2.
Land-use activities of Cameron Highlands for (a) the year 2015 [21] and (b) the year 2018 [22].

Table 1.
Area for each land-use activities in Cameron Highlands.
3.3. Topographic Features
Cameron Highlands is surrounded by hilly areas with steep slopes of more than 20° [23]. The Cameron Highlands range in elevation from 200 m to 2069.85 m [24]. Figure 3 shows the elevation in Cameron Highlands obtained from The Department of Survey and Mapping Malaysia.
Figure 3.
DEM for Cameron Highlands [16].
3.4. Soil Map
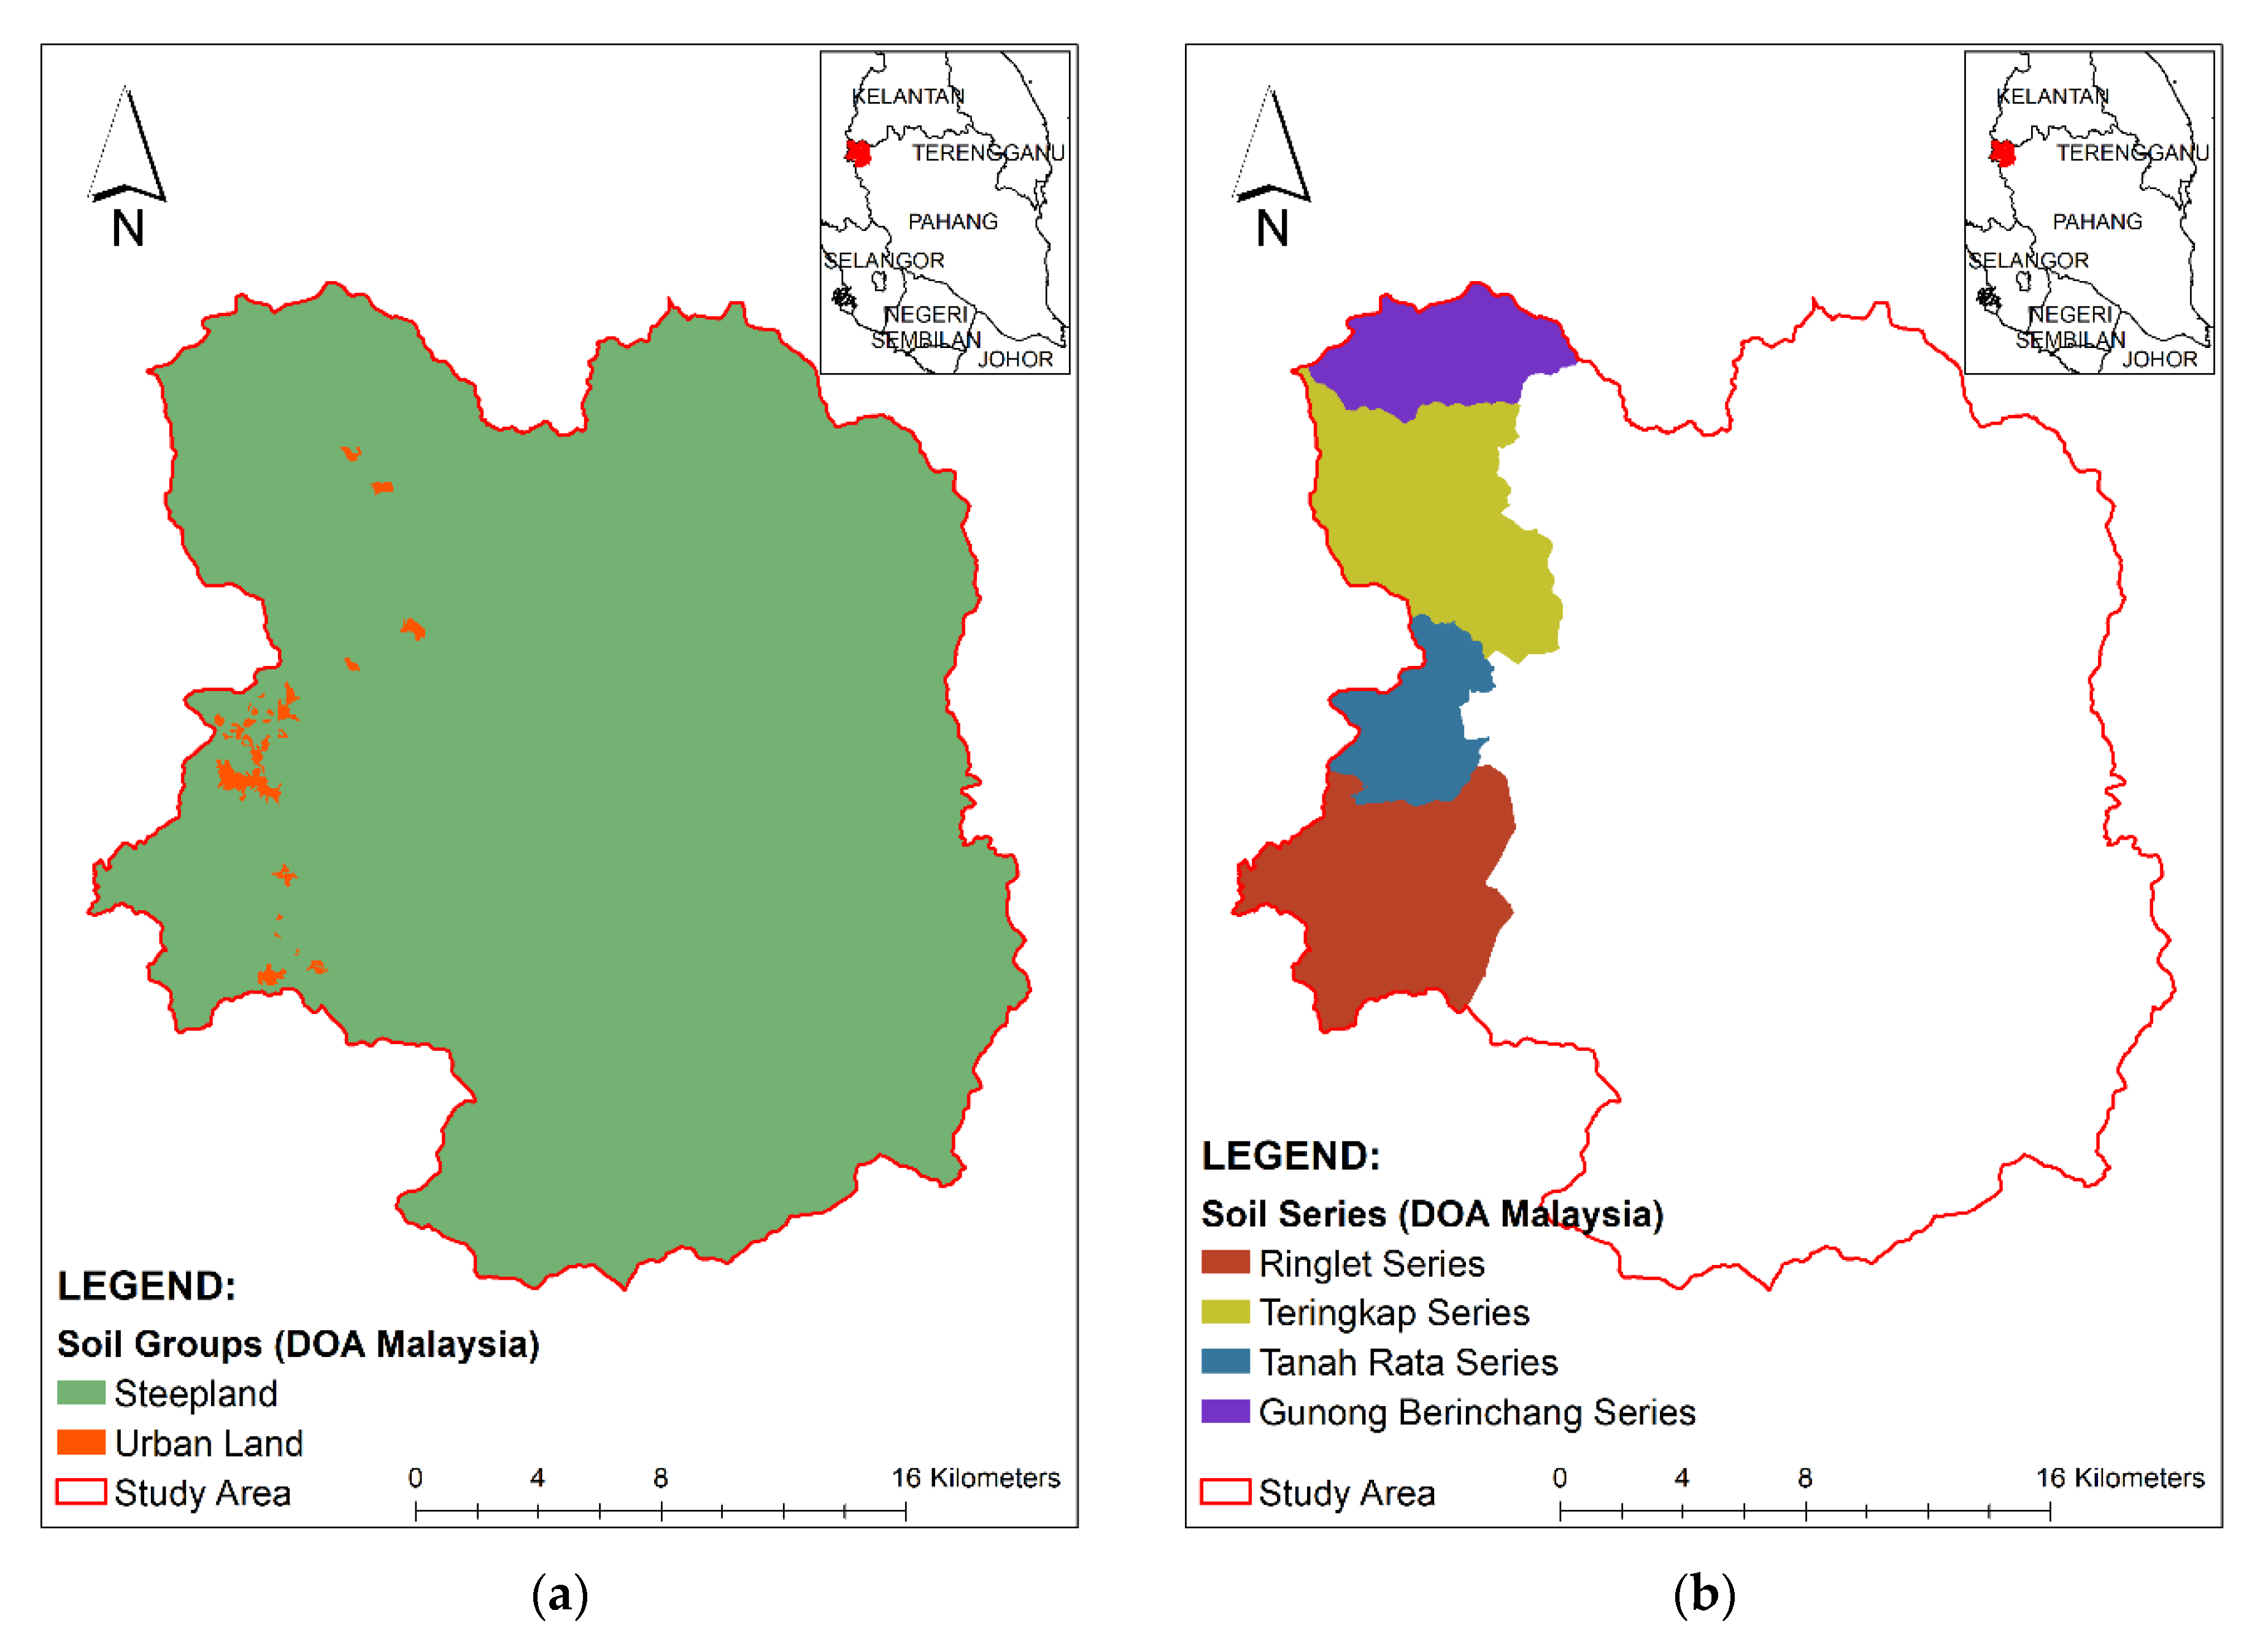
As gazetted and published by the Department of Agriculture Malaysia, there are two primary land uses or soil groups: steep land and urban land [25]. The DOA has also identified four soil series in Cameron Highlands: the Teringkap Series (Spodosols order), the Ringlet Series (Inceptisols order), the Tanah Rata Series (Spodosols order), and the Gunong Berinchang Series (Histosols order) [23,26]. These soil series have been named locally with regards to the soil sample taken in that area, and the physical properties of the soil have been classified based on the United States Department of Agriculture (USDA) soil taxonomy [26]. However, other local soil series names in Cameron Highlands are still not published by DOA until field investigation is completed. Figure 4 shows the location of land uses and soil series in the Cameron Highlands.
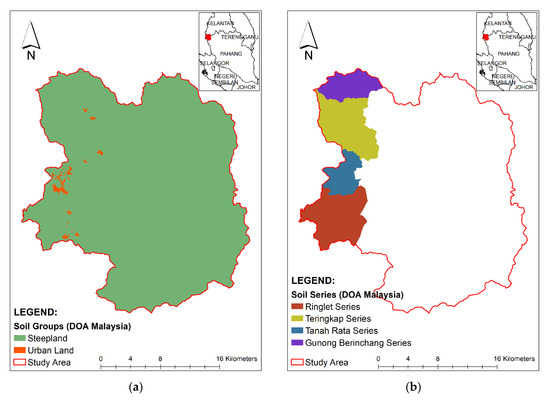
Figure 4.
Map of (a) major land uses and (b) edited soil series in Cameron Highlands [23,25,26].
3.5. Methodology
The collection of spatial data is critical during the preliminary stage of developing C&P factors. Spatial data were acquired from various agencies, including the Department of Agriculture Malaysia [21,25], PLANMalaysia [22], and the Department of Survey and Mapping Malaysia [24]. Spatial data were entered into Aeronautical Reconnaissance Coverage Geographic Information System (ArcGIS) 10.4, tabulated and/or graphical representation produced for significant analysis. The data collection in this research includes acquiring, collating, and cleaning up existing information from various agencies’ sources. This information and data will be formatted to form an integrated database for ease of use and future reference. Gaps and discrepancies in these data will be identified and rectified accordingly. Additional data required to bridge the gap or solve discrepancies can be obtained via further data collection or fieldwork.
The primary data collection in the proposed study will involve hydrological and geospatial data, including the digital elevation model (DEM), soil properties, and land use. Most government agencies have developed their Geographic Information System (GIS) databases to store spatial data under their custody. The study will also acquire secondary hardcopy data, such as maps, reports, and satellite images, to capture required information when the data is unavailable. Spatial data is an important piece of information required for any analysis or planning. It gives information on the spatial variability of properties. Since no two localities are identical, this variability must be carefully observed.
3.6. Determination of C&P Factors
Cover Management, C factor, is one of the management factors employed to control soil loss at a specific site. The C factors, including ground cover, vegetation, and pavements, contribute to soil erosion reduction on construction sites or disturbed land [7,8]. Table 2, Table 3 and Table 4 as being adopted from DID Malaysia [9] include C values that are suitable for Cameron Highlands. It should be noted that the C factor suggested here is representative of typical runoff conditions. Therefore, it should be used cautiously in other surface and runoff conditions.
Table 2.
Cover management, C factor, for agricultural and urbanized areas 1 [18,20].
Table 3.
Cover management, C factor, for forested and undisturbed lands 1 [18,20,27,28,29].
Table 4.
Cover management, C factor, for BMPs at construction sites 1 [18,20,27,28,29,30].
Conservation practice, P factor is a management factor that can control soil loss at a specific site. If erosion is already occurring, the P factor is needed to prevent the silt and sediment in flowing water from washing away. Combining both C&P factors estimation techniques make it possible to minimize erosion on a construction site and reduce sediment loading to downstream receiving water bodies.
Table 5 adopted from DID Malaysia [9] shows the P values used for Cameron Highlands. The P factor was calculated by multiplying the P value from Table 5 by the ratio of conservation practices that are commonly used in Cameron Highlands, namely contouring, terracing, and sheltering [23]. It should be noted that the P factor suggested here is representative of typical runoff conditions. Therefore, it should be used cautiously for other surface and runoff conditions.
Table 5.
Conservation practice, P factor, for BMPs at construction/developing sites 1 [11,12,27,28,29].
4. Results and Discussion
C&P factors play an important role in determining the soil erosion in Cameron Highlands district, included in the USLE equation. The C factor is calculated based on the land use and land cover of the Cameron Highlands district. The agency collected two different sets of land-use data, from the Department of Agriculture and PLANMalaysia. The new C factor established from this study is a combination of data from the DOA and PLANMalaysia, to collect all inputs in deriving an acceptable C factor for soil erosion risk analysis. Figure 5 shows the new C factor in the study.
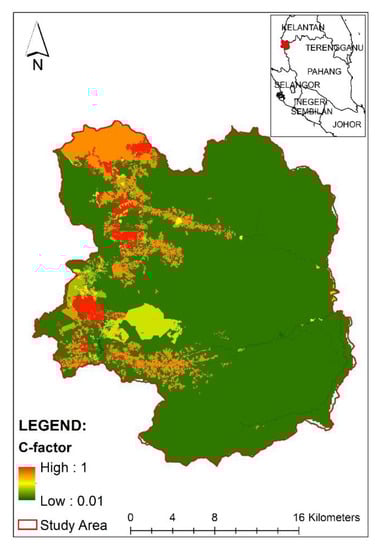
Figure 5.
New C factor in Cameron Highlands district [21,22].
The P factor is derived in conjunction with the ratio of conservation practice in Cameron Highlands district, as shown in Table 6. Figure 6 shows the new P factor in the study.
Table 6.
Ratio (in percentage) of conservation practice in Cameron Highlands district [23].
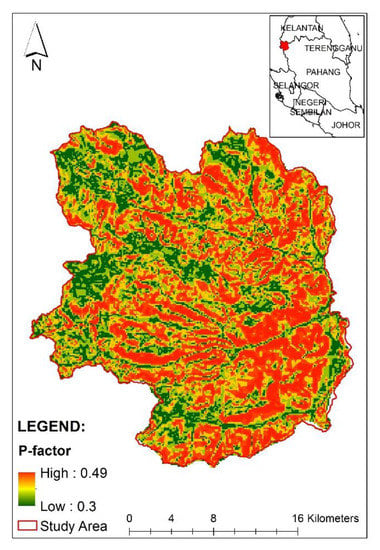
Figure 6.
New P factor in Cameron Highlands district [21,23].
Based on the study’s new C&P findings, the locations of highest and lowest C&P factors are more comprehensive, covering most of the area in Cameron Highlands, compared to the past results that focused exclusively on agricultural or development activities. This new C&P will affect the risk level and categories of soil loss developed in the study.
The study’s new C&P factors developed are then used to map soil loss risk for the Cameron Highlands district, sub-district, and river catchment. Soil loss was evaluated and adapted to the biophysical environment comprising soil, rainfall, topography, land cover, and interactions. Soil loss risk is determined by calculating the A factor developed by Musgrave [19] and Wischmeier and Smith [29]. The unit of A factor (annual average soil loss) is measured in tons/hectares/year. Based on the literature review, the permissible soil loss in any situation of soil degradation is 11.2 tons/hectares/year. Using that as a benchmark, the A factor calculated in this study is categorized into soil loss class category, as presented in Table 7.
Table 7.
Soil loss class category.
Figure 7 shows the Cameron Highlands soil loss risk map produced from the new C&P factors established in the study. As mentioned in Section 3.1, Cameron Highlands is divided into three sub-districts: Ringlet, Tanah Rata, and Hulu Telom, while river catchments are also divided into three catchments: Sg. Telom, Sg. Bertam, and Sg. Lemoi. These sub-districts and river catchments are monitored by Cameron Highlands District Council and DID, respectively. The maps of soil loss risk produced for sub-districts and river catchments used the same model input with the same soil loss risk level.
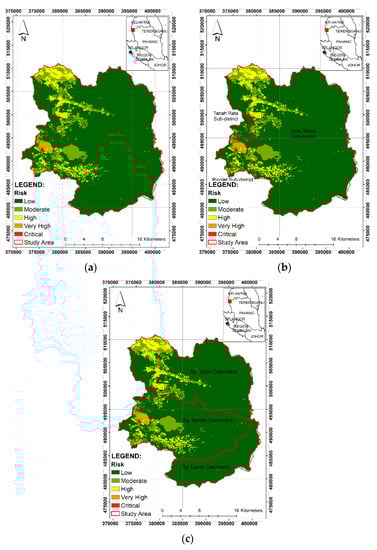
Figure 7.
Soil loss risk map for Cameron Highlands by (a) district, (b) sub-district, and (c) river catchment.
Table 8 shows the area (in hectares) of soil loss risk level of the Cameron Highlands established using the C&P factors in the study. Table 8 shows that Ringlet has the highest risk of moderate–critical soil loss, while Sg. Lemoi has the highest percentage of moderate–critical soil loss risk levels.
Table 8.
Area and percentage of soil loss risk level in Cameron Highlands.
This study found that only 84.37% of the total area in Cameron Highlands falls within the category of low-risk soil loss level, compared to the previous results from the DOA (92.84% low-risk soil loss level) or from PLANMalaysia (88.54% low-risk soil loss level). As for the sub-district, the results showed that Ringlet possessed the highest moderate–critical-risk soil loss level at 41.80%, compared to the results from the DOA (19.70% moderate–critical-risk soil loss level) or from PLANMalaysia (31.02% moderate–critical-risk soil loss level). As for river catchment, Sg. Bertam possessed the highest moderate–critical-risk soil loss level at 18.69%, in comparison to the results from the DOA (4.95% moderate–critical-risk soil loss level) or from PLANMalaysia (16.66% moderate–critical-risk soil loss level), whereby the results in the study justified the current soil erosion risk situation at the Ringlet sub-district and Sg. Bertam catchment of the Cameron Highlands.
Based on the previous results of C&P factors and soil loss risk level and categories, the current scenario of soil erosion risk in Cameron Highlands was very compatible with the new developed C&P factors and new soil loss risk levels and categories. Furthermore, the new soil loss risk level introduced in the study was more detailed and in line with the permissible soil loss that was not addressed in the previous results. Thus, local authorities can profit from the findings of this study and should exercise extra caution and attention to these newly developed C&P factors, soil loss risk level, and categories to avoid future unwanted incidents.
5. Conclusions
This study was conducted to determine the values of C&P factors of the USLE for different cover conditions and land management practices across the Cameron Highlands district. Using different land-use land and cover data from PLANMalaysia and the Department of Agriculture Malaysia, an acceptable C factor that reflects agricultural and urban development impacts was obtained. Considering the latest conservation practices ratio in Cameron Highlands, the P factor also provides effective results that can help mitigate the area’s predicted soil loss risk.. The C factor, calculated by combining both data, indicates that agricultural and urban development in the Cameron Highlands district is between 0.01 to 1.00. An acceptable C factor was established by incorporating both sets of data into the equation, enhancing prediction accuracy when evaluating soil loss risk levels. The P factor in Cameron Highlands ranges from 0.30 to 0.49, reflecting the conservation practice ratio used in the Cameron Highlands. According to the soil loss risk assessment, 84.37 percent (57,106.05 hectares) of the Cameron Highlands area has a low soil loss risk, while 15.63 percent (10,580.68 hectares) of the Cameron Highlands area has a moderate–critical soil loss risk.
Further results predicted that 41.80 percent of the Ringlet area has a moderate–critical soil loss risk, followed by Hulu Telom and Tanah Rata with 13.60% and 14.79%, respectively. For river catchment, 18.69% of the Sg. Bertam area has a moderate–critical soil loss risk, followed by Sg. Telom and Sg. Lemoi with 18.50% and 0.07%, respectively. The results produced in the study have justified the current soil erosion risk situation in the Cameron Highlands. Local authorities must enforce strict regulations and policies in areas at moderate–critical risk of soil loss to prevent severe soil erosion in Cameron. Establishing acceptable new C&P factor values will help minimize uncertainties in future soil loss prediction studies in the Cameron Highlands District. Moreover, the outcome of the study can also be used by other local authorities regionally and internationally to monitor soil erosion risk in other highlands areas worldwide.
Author Contributions
Conceptualization, R.Z.A.; methodology, M.F.Y. and M.A.M.; software, M.A.M.; validation, N.A.Z. and M.A.R.M.A.A.; formal analysis, M.A.M.; writing—original draft preparation, M.A.M.; writing—review and editing, R.Z.A. and M.F.Y.; visualization, M.A.M.; supervision, N.A.Z.; project administration, M.A.R.M.A.A. All authors have read and agreed to the published version of the manuscript.
Funding
This research was funded by the National Hydraulic Research Institute of Malaysia (NAHRIM), grant number 304.PREDAC.6050430.I36 and the Article Processing Charge (APC) was funded by the River Engineering and Urban Drainage Research Centre Universiti Sains Malaysia (REDAC USM).
Data Availability Statement
The data presented in this study are available on request from the corresponding author and respective Malaysian agencies. The data are not publicly available due to Malaysian Government regulations which are strictly adhered.
Acknowledgments
The authors acknowledge the National Hydraulic Research Institute of Malaysia (NAHRIM), grant number 304.PREDAC.6050430.I36 (Research on Preparation of Erosion and Sediment Control Plans (ESCP) Manual for logging and agriculture activities in Malaysia) for funding the research and River Engineering and Urban Drainage Research Centre Universiti Sains Malaysia (REDAC USM) for supporting the research and Article Processing Charge (APC).
Conflicts of Interest
The authors declare no conflict of interest.
References
- Raj, J. Land Use Changes, Soil Erosion and Decreased Base Flow of Rivers at Cameron Highlands, Peninsular Malaysia. Bull. Geol. Soc. Malays. 2002, 45, 3–10. [Google Scholar] [CrossRef]
- Parveen, R.; Kumar, U. Integrated Approach of Universal Soil Loss Equation (USLE) and Geographical Information System (GIS) for Soil Loss Risk Assessment in Upper South Koel Basin, Jharkhand. J. Geogr. Inf. Syst. 2012, 4, 588–596. [Google Scholar] [CrossRef] [Green Version]
- Razali, A.; Syed Ismail, S.N.; Awang, S.; Praveena, S.M.; Zainal Abidin, E. Land Use Change in Highland Area and Its Impact on River Water Quality: A Review of Case Studies in Malaysia. Ecol. Process. 2018, 7, 19. [Google Scholar] [CrossRef] [Green Version]
- Vijith, H.; Seling, L.W.; Dodge-Wan, D. Estimation of Soil Loss and Identification of Erosion Risk Zones in a Forested Region in Sarawak, Malaysia, Northern Borneo. Environ. Dev. Sustain. 2018, 20, 1365–1384. [Google Scholar] [CrossRef]
- Noh, N.S.M.; Sidek, L.M.; Wayayok, A.; Abdullah, A.F.; Basri, H.; Farhan, S.A.; Sulaiman, T.; Md Ariffin, A.B. Erosion and Sediment Control Best Management Practices in Agricultural Farms for Effective Reservoir Sedimentation Management at Cameron Highlands. Int. J. Recent Technol. Eng. 2019, 8, 6198–6205. [Google Scholar]
- Samat, N.; Mahamud, M.A. Urbanisation in the George Town Conurbation and Its Impact to the Environment. Int. J. Environ. Eng. 2018, 9, 240–253. [Google Scholar] [CrossRef]
- Akale, A.T.; Dagnew, D.C.; Belete, M.A.; Tilahun, S.A.; Mekuria, W.; Steenhuis, T.S. Impact of Soil Depth and Topography on the Effectiveness of Conservation Practices on Discharge and Soil Loss in the Ethiopian Highlands. Land 2017, 6, 78. [Google Scholar] [CrossRef] [Green Version]
- Badmos, B.K.; Agodzo, S.K.; Villamor, G.B.; Odai, S.N. An Approach for Simulating Soil Loss from an Agro-Ecosystem Using Multi-Agent Simulation: A Case Study for Semi-Arid Ghana. Land 2015, 4, 607–626. [Google Scholar] [CrossRef] [Green Version]
- Department of Irrigation and Drainage Malaysia—DID. Guideline for Erosion and Sediment Control in Malaysia; DID: Kuala Lumpur, Malaysia, 2010.
- Israelsen, C.E.; Clyde, C.G.; Fletcher, J.E.; Israelsen, E.K.; Haws, F.W.; Packer, P.E.; Farmer, E.E. Erosion control during highway construction. In Manual on Principles and Practices; National Cooperative Highway Research Program Report 221; Transportation Research Board, National Research Council: Washington, DC, USA, 1980. [Google Scholar]
- Kuenstler, W. C Factor: Cover-Management. 2009. Available online: www.techtransfer.osmre.gov/NTTMainSite/Library/hbmanual/rusle/chapter5.pdf (accessed on 11 November 2020).
- Rizeei, H.M.; Saharkhiz, M.A.; Pradhan, B.; Ahmad, N. Soil erosion prediction based on land cover dynamics at the Semenyih watershed in Malaysia using LTM and USLE models. Geocarto Int. 2016, 31, 1158–1177. [Google Scholar] [CrossRef]
- Omar, M.N.; Rahaman, Z.A.; Hashim, M. The development of a soil erosion risk map for Perak, Malaysia. Int. J. Acad. Res. Bus. Soc. Sci. 2018, 8, 1108–1123. [Google Scholar] [CrossRef]
- Kuok, K.; Mah, D.; Chiu, P. Evaluation of C and P Factors in Universal Soil Loss Equation on Trapping Sediment: Case Study of Santubong River. J. Water Resour. Prot. 2013, 5, 1149–1154. [Google Scholar] [CrossRef] [Green Version]
- Renard, K.G.; Foster, G.R.; Weesies, G.A.; Porter, J.P. RUSLE: Revised Universal Soil Loss Equation. J. Soil Water Conserv. 1991, 46, 30–33. [Google Scholar]
- Karpilo, R.D.; Toy, T.J. Non-agricultural C and P Values for RUSLE. In Proceedings of the National Meeting of the American Society of Mining and Reclamation Conference Proceedings, Lexington, KY, USA, 18–22 April 2004; pp. 18–24. [Google Scholar]
- Renard, K.G.; Foster, G.R.; Weesies, G.A.; McCool, D.K.; Yoder, D.C. Predicting Soil Loss by Water: A Guide to Conservation Planning with the Revised Soil Loss Equation (RUSLE); US Department of Agriculture: Washington, DC, USA, 1997; p. 703.
- Troeh, F.R.; Hobbs, J.A.; Donahue, R.L. Soil and Water Conservation: Productivity and Environment Protection; Prentice-Hall: Upper Saddle River, NJ, USA, 1999. [Google Scholar]
- Musgrave, G.W. The quantitative evaluation of factors in water erosion: A first approximation. J. Soil Water Conserv. 1947, 2, 133–138. [Google Scholar]
- Layfield, Erosion Management Factors. 2009. Available online: https://www.layfieldgroup.com/Geosynthetics/Tech-Notes/Erosion-Mgmt-Factors.aspx (accessed on 11 November 2020).
- Department of Agriculture Malaysia—DOA. Land-Use Activities 2015; Department of Agriculture Malaysia: Putrajaya Federal Territory, Malaysia, 2015.
- Department of Town and Country Planning Malaysia—PLANMalaysia. Land-Use Activities 2018; PLANMalaysia: Putrajaya Federal Territory, Malaysia, 2018.
- Department of Agriculture Malaysia—DOA. Garis Panduan Pembangunan Pertanian di Tanah Bercerun; Department of Agriculture Malaysia: Putrajaya Federal Territory, Malaysia, 2020. (In Malayan)
- Department of Survey and Mapping Malaysia—JUPEM. Digital Elevation Model 2020; JUPEM: Kuala Lumpur, Malaysia, 2020.
- Department of Agriculture Malaysia—DOA. Soil Groups 2020; Department of Agriculture Malaysia: Putrajaya Federal Territory, Malaysia, 2020.
- Department of Agriculture Malaysia—DOA. Common Soils of Peninsular Malaysia: Soil Profile Description and Analytical Data; DOA: Kuala Lumpur, Malaysia, 2018.
- ECTC. Guidelines for Rolled Erosion Control Products; Erosion Control Technology Council: St. Paul, MN, USA, 2003. [Google Scholar]
- SCS. Urban Hydrology for Small Watersheds; Tech. Release No. 55; Soil Conservation Service: Washington, DC, USA, 1986.
- UNEP/RIVM/ISRIC. A Qualitative Assessment of Water Erosion Risk Using 1:5 M SOTER Data. An Application for Northern Argentina, South-East Brazil and Uruguay; Report 96/04; ISRIC: Wageningen, DC, USA, 1996. [Google Scholar]
- Wischmeier, W.H.; Smith, D.D. Predicting Rainfall Erosion Losses-A Guide to Conservation Planning; Agricultural Handbook No. 537; USDA: Washington, DC, USA, 1978.


Publisher’s Note: MDPI stays neutral with regard to jurisdictional claims in published maps and institutional affiliations. |
© 2021 by the authors. Licensee MDPI, Basel, Switzerland. This article is an open access article distributed under the terms and conditions of the Creative Commons Attribution (CC BY) license (https://creativecommons.org/licenses/by/4.0/).