1. Introduction
Advertising has been used as a competitive weapon in some form or other by firms for centuries. Spending on advertising in 2008 in the US alone is estimated at between
$162 and
$173 billion [
1]. Given this huge expenditure, it is no surprise that effectiveness of advertising is one of the key themes in advertising research [
2]. Researchers have found that advertising has a positive impact on firm performance and that this impact persists for at least four years [
3].
This focus of this paper is on the dynamics of competition between firms using advertising, with a particular emphasis on the impact of the effectiveness of advertising on firm profitability. Advertising is one of the three policy variables which a firm can use in order to maximize profits; the other two being price and product [
4]. The interplay of advertising and inter-firm competition is an important area of research but relatively under-examined. Researchers have explored the dynamics of a Cournot duopoly where advertising alters the slope of the demand function [
5]: Refs. [
6,
7,
8] examine closed-form equilibrium solutions to Cournot and Bertrand differentiated duopolies where advertising alters the intercept of the demand function; Ref. [
9] use numerical simulation and adaptive control theory to explore the chaotic dynamics inherent in duopoly competition where advertising directly influences quantity sold and the amount of advertising is proportional to firm profit; Ref. [
10] examine a Cournot/Bertrand duopoly where advertising alters both the slope and the intercept of the demand function; Ref. [
11] take an experimental game-theoretic approach in their examination of a Hotelling model of advertising competition; Ref. [
12] models the behaviour of a duopoly under semi-collusive informative advertising; Ref. [
13] examines the impact of informative advertising on oligopoly under different levels of product differentiation; Ref. [
14] model duopoly competition by means of advertising using a differential game approach. Other authors have carried out related research: Ref. [
15] analytically model the evolution of the Cournot Nash equilibrium where costs reduce due to R&D activity; Ref. [
16] models the evolution of the Nash equilibrium in a duopoly when one of the firms competes as a price leader.
The present paper takes a numerical simulation approach to examine the evolution of firm performance over time in a duopoly when advertising alters the intercept of the demand function. The simulation model is based on the standard game-theoretic duopoly model developed by a long line of theorists from Cournot’s [
17] original work in the early nineteenth century. Use of simulation to examine managerial and economic problems has become more widespread in recent years [
18,
19,
20] and can complement the more usual analytical approaches to theory building [
21,
22]. Numerical simulation has the advantage that it can deal with asymmetric firms or analytically intractable models where explicit differential game/optimal control theoretic solutions are difficult or impossible to obtain. For example, Ref. [
23] points out the ‘impossibility of deriving an analytical solution in the feedback equilibrium when marginal costs differ’; Ref. [
24] point out that solving a differential game using the closed loop approach requires the simultaneous solution of two partial differential equations—‘a tricky task indeed’ (p. 276); Ref. [
25] recognises that the assumption of symmetry is restrictive but points out that it can be relaxed only ‘at the cost of considerable mathematical and notational complexity’ and suggests that this will not yield ‘much new insight’. Note that the literature in general adopts symmetric models and seeks to determine the conditions that yield an equilibrium outcome at a point in time [
26] or a steady state outcome over time [
23,
27,
28]. Taking a simulation approach allows examination of the behaviour of asymmetric models, the spillover effect of one firm’s advertising on the other, and the evolution of the duopoly beyond equilibria or steady states.
This paper adopts the version of the Cournot duopoly model given in [
29] and extends it to include advertising by adding three rules: a rule to determine the amount of advertising that a firm will choose, a rule specifying the response of sales to an amount of advertising, and a rule specifying the cost of advertising. The Dorfman–Steiner condition [
30] is used to determine the optimal amount of advertising. The model follows [
26] in assuming that the impact of advertising is to shift the demand function to the right but not to alter its slope. The demand function is shifted to the right by increasing the value of the reservation price (the intercept of the inverse demand function with the vertical axis) in proportion to the amount and effectiveness of advertising. Reservation price can be therefore viewed as embodying the value of the brand as created by advertising. The cost of advertising is taken into account in the profit identity. The simulation model computes the Cournot Nash equilibrium [
31] at each point in time as the market evolves under the influence of advertising. The computations are carried out by computer but, as they require no use of heuristics, approximations, or probability distributions, calculations could be carried out by hand, although this would be tedious.
The remainder of the paper is organised as follows: section two details the model itself, section three uses simulation to examine a number of competitive scenarios under advertising, and section four concludes.
2. The Model
The usual profit maximising objective is assumed where each firm aims to maximise the residual between revenues and costs according to the accounting identity:
where
p is unit price,
q is quantity sold,
c is unit variable cost and
A represents the cost of advertising; subscript
i refers to the firm. The common assumption is made that firm costs are linear and symmetric and fixed costs are zero. The standard objective function has been extended to include the cost of advertising.
The traditional downward sloping law of demand is adopted. Price is determined from the inverse demand function using the duopoly formula [
29]:
where
p′ is price,
a is reservation price,
q is quantity,
b is own-price effect and
d is cross price effect; subscript
i refers to one of the firms and subscript
j to its rival. Products are assumed to be symmetrically differentiated, i.e., cross price effect
d is not equal to own price effect
b and, in this sense, products are differentiated; however, the cross price effects are the same for the two firms and, in this sense, differentiation is symmetric. See [
32] for a discussion of the significance of the symmetry or asymmetry of such associations between products. While reservation prices
ai are often assumed constant and symmetric, under advertising they cannot be assumed to remain so and hence the more generalised form above is used. Although technically expression (2) is the inverse demand function for convenience, it is referred to from now on in this paper as the demand function.
The common assumption that advertising shifts the demand function outwards by increasing the value of the intercept with the vertical axis is adopted. The approach suggested by [
26,
27] is used to model this outward shift due to advertising:
where ∆
ai is the change in reservation price due to advertising,
Ai represents the money amount of advertising by firm
i,
φi is the advertising effectiveness parameter and represents the response of the firm’s own demand to the firm’s own advertising, and
ρ is the advertising interaction factor and represents the relative response of the firm to its rival’s advertising. Where
ρ is positive advertising is cooperative, i.e., advertising by one firm also assists the other firm; where
ρ is negative advertising is predatory, i.e., advertising by one firm depresses demand for the rival firm’s product. Where
ρ is zero then advertising by one firm has no effect upon its rival. Note that whereas
φ represents own advertising effect,
ρφ represents cross advertising effect, i.e., the spillover effect of one firm’s advertising on the other firm. It is assumed that no force other than advertising acts to change demand—i.e., there is no spontaneous growth or decay in demand or no cyclical change in demand. Incorporating expression (3) into the demand function (as shown in expression (2)) yields a revised demand function that includes the impact of advertising and quantity on price:
This model embodies Friedman’s two criteria for advertising: that advertising by one firm may affect the demand for a competitor product and that the impact of advertising is cumulative. The former criterion is met through the advertising interaction parameter. The latter criterion is met through the permanent increase in reservation price, which acts as a stock representing the cumulative impact of advertising. This increase in reservation price may also be viewed as the embodiment of the concept of goodwill [
33] into the demand function for the product.
To determine the amount of advertising used by firms, Martin’s [
34] representation (p. 277) of the Dorfman–Steiner condition is adopted to select the optimal amount of advertising:
where
R is firm revenue (price multiplied by quantity),
ηAi is advertising elasticity of demand, and
ηi is price elasticity of demand. When the ratio of elasticities is constant, this is equivalent to the well-known managerial heuristic of spending a fixed proportion of revenue on advertising.
Advertising elasticities of demand for the two firms are by definition:
Inverting expressions (4), differentiating with respect to advertising, and substituting the result into the above expression yields:
Price elasticities of demand for the two firms are by definition:
Inverting expressions (4), differentiating with respect to price, and substituting into the above yields:
Advertising elasticity and price elasticity can now be calculated using expressions (7) and (9) respectively and the results used in expression (5) to determine the optimal amount of advertising. However, there exists a practical difficulty. Advertising appears on both sides of the revised expressions (5)—as the dependent variable on the left hand side and as a component of advertising elasticity on the right hand side. To overcome this difficulty in the simulation model, the value of advertising from the immediately prior time period is used in the calculation of advertising elasticity in the current period.
The simulation works as follows. At time zero the model determines quantity, price, and profit for each firm at the Cournot Nash equilibrium. The Cournot Nash equilibrium is determined in the standard way by substituting expression (4) for price into expression (1), the profit function, differentiating the two profit equations represented by expression (1) with respect to quantity, and simultaneously solving the two resulting expressions to yield optimal quantities for the two firms. Price is then determined by substituting these optimal quantities into expression (4) and profit determined by substituting optimal quantities and price into expression (1).
The simulation model then computes price elasticity and advertising elasticity of demand and determines the optimal level of advertising using the Dorfman–Steiner condition [
30]. The shift in demand due to this advertising is then computed using the Friedman–Cellini–Lambertini [
26,
27] expression (3) above and the reservation price incremented accordingly. In the next time period, a new competitive situation exists with new inverse demand functions facing the two firms. The Cournot Nash equilibrium is computed for this new competitive situation, giving optimal quantities, prices, and profit figures for the two firms. This in turn leads to a new computation for elasticities, optimal advertising, and consequent shift in demand, and so the simulation continues. No stopping rule is applied: the simulations were allowed to continue until firms showed either exponential growth or came to an asymptotic equilibrium. See [
35] for a discussion of the feedback loops inherent in the simulation model.
3. Simulation of Duopoly under Advertising
The simulation model represents a differentiated Cournot duopoly where both firms act as profit maximisers. The two firms are assumed to be symmetric in all respects, except for their propensity to advertise. This is achieved by setting identical parameter values for both firms for initial reservation price a, own price effect b, cross price effect d, and unit variable cost c. These were set at 25, 0.0001, 0.00005, and 8, respectively. This means that a firm’s price decreases by $1 for every additional 10,000 units put on the market by itself and by $1 for every additional 20,000 units put on the market by its rival. These are reasonable values for a low-priced high volume differentiated product; for example, a calculator, a book, or a box of chocolates.
Using these parameter values, the monopoly quantity is = 85,000 units, the monopoly price is = $16.50, and monopoly profit is = $722,500. The Cournot equilibrium quantity is = 68,000 units for each firm at a price of = $14.80, resulting in each firm earning a profit of = $462,400. As expected, duopolistic competition leads to a higher total quantity placed on the market at a lower price. I refer to this baseline situation as the static Cournot equilibrium.
Parameters b, c, and d remain constant throughout each simulation and for all simulation scenarios carried out in support of the propositions below. The same initial value for reservation price a is used for all simulation experiments. The only parameters whose values change from one experiment to another are advertising effectiveness φ and advertising interaction ρ. To initiate the simulation, initial values for advertising and for demand are set. The initial value for quantity is set at the static Cournot equilibrium quantity, i.e., 68,000 units. The managerial heuristic of a proportion of revenue is used for initial value of advertising: $100,000, which is approximately 10% of the static Cournot equilibrium revenue. A number of specific scenarios that become progressively more complex are now examined.
3.1. Unilateral Advertising with No Spillover
In this scenario it is assumed that only one firm advertises and there is no advertising spillover from this firm to its rival’s product. This scenario is formed as a proposition, then results of the simulation are shown and discussed. This format is also adopted for all scenarios examined.
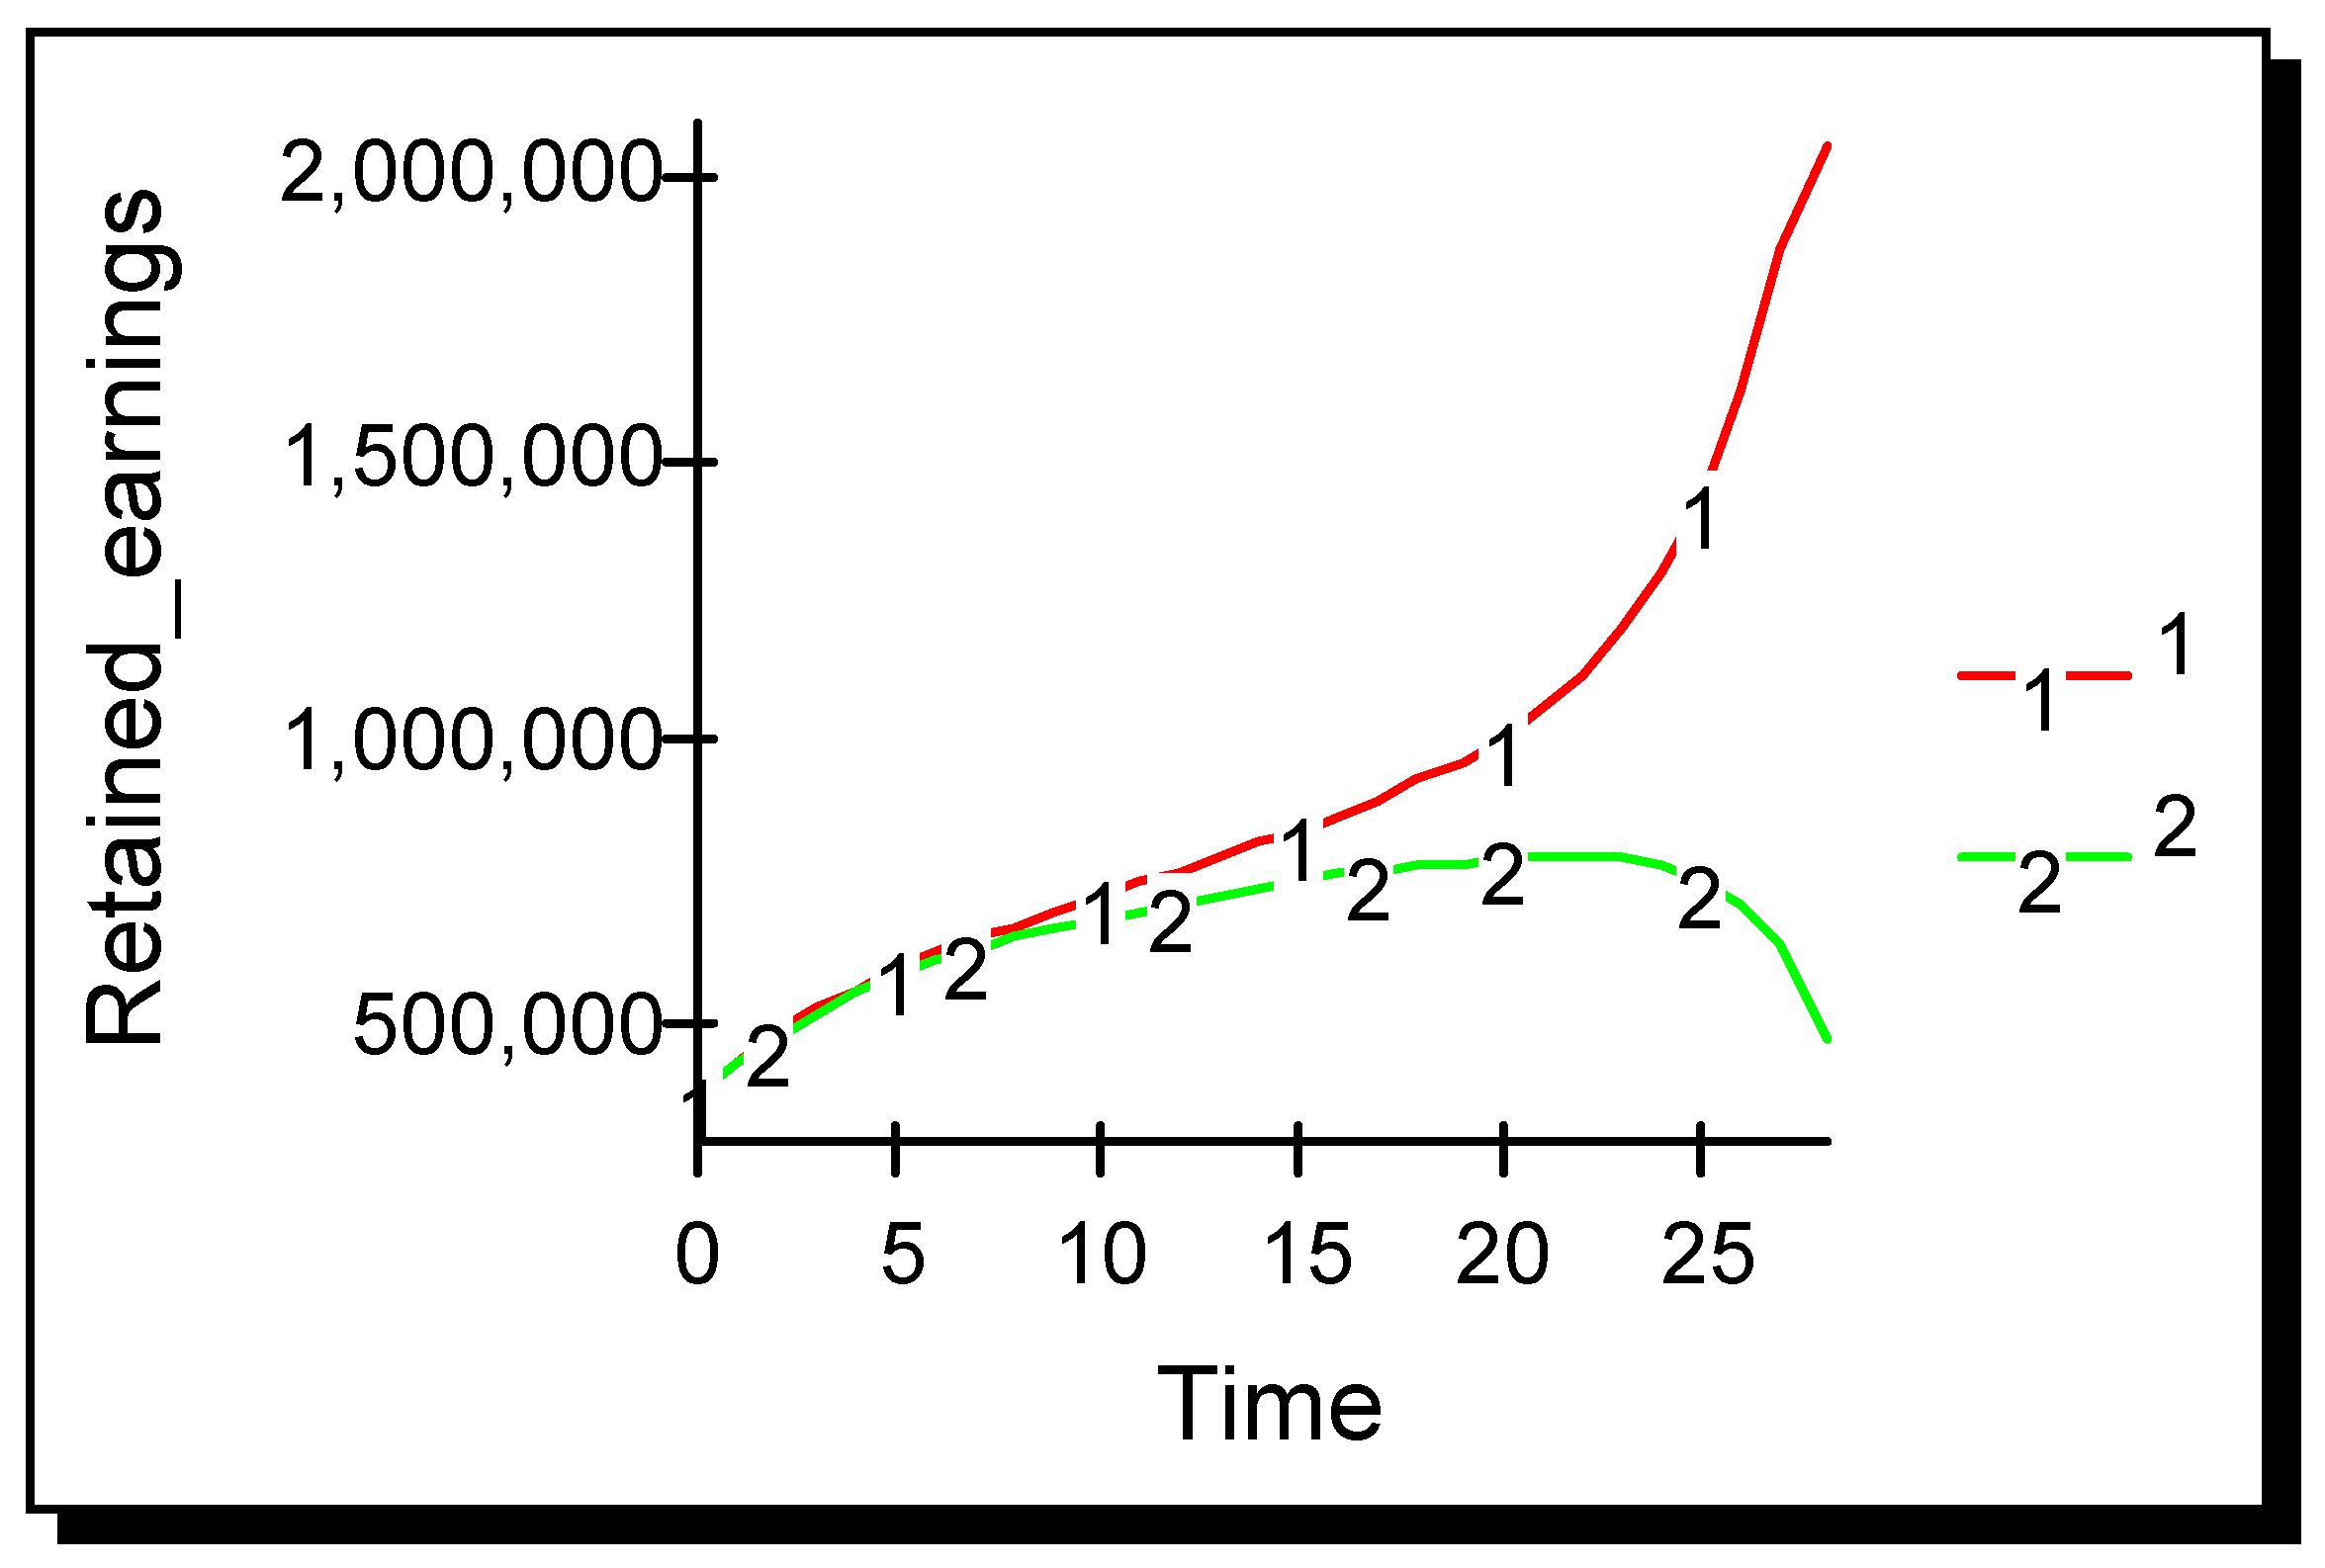
Proposition 1. In a differentiated Cournot duopoly where advertising shifts the demand function to the right and where one firm advertises and the other firm does not then: (a) the firm that advertises outperforms the firm that does not; (b) there exists a threshold level of advertising effectiveness, below which both firms achieve a terminal Cournot equilibrium position and both firms remain in the marketplace for all time, and above which the advertising firm achieves exponential type growth while the non-advertising firm is driven out of the marketplace.
Advertising is introduced into the model by setting the advertising effectiveness parameter φ to 0.000011 for firm one and leaving it at zero for firm two. This means that $100,000 worth of advertising will increase the value of the reservation price by $1.50, i.e., will shift the reservation price for the firm’s product from $25 to $26.50. The advertising interaction parameter ρ is set to zero, meaning that a firm’s advertising has no impact on its rival’s demand. Growth in demand is due entirely to the impact of advertising: no spontaneous or cyclic growth or decay occurs.
Results in
Figure 1 show that the firm that advertises outperforms its non-advertising rival and eventually drives it out of the market. Each vertical pair of points in
Figure 1, one for each firm, represents a Cournot equilibrium at a point in time; the diagram as a whole therefore represents the evolution of the Cournot equilibrium over time. Although, at the static Cournot equilibrium both firms are equally profitable, once advertising occurs the competitive situation becomes asymmetric and the firm that advertises outperforms its rival. After 19 time periods the non-advertiser is driven from the market.
Behaviour of price and advertising elasticities of demand differ greatly between the advertiser and the non-advertiser as shown in
Figure 2. The advertiser’s price elasticity of demand decreases in absolute value over time as it tends to the monopoly position; for the non-advertiser it increases over time as demand for its product drops. Advertising elasticity for the non-advertiser remains at zero throughout the computation as expected; for the advertiser it initially decreases because the initial value of advertising was above the optimal value, but after a number of periods it begins to increase. The amount of advertising selected is proportional to the ratio of these two elasticities. From period six onwards, as the numerator is increasing in value and the denominator is reducing in absolute value, the proportion of revenue selected for advertising increases over time. (Note: For space reasons this side discussion of the evolution of price and advertising elasticities is for scenario one only. Note also that while values of price elasticity of demand are commonly referred to in the positive, technically they are negatively valued as given in
Figure 2a.)
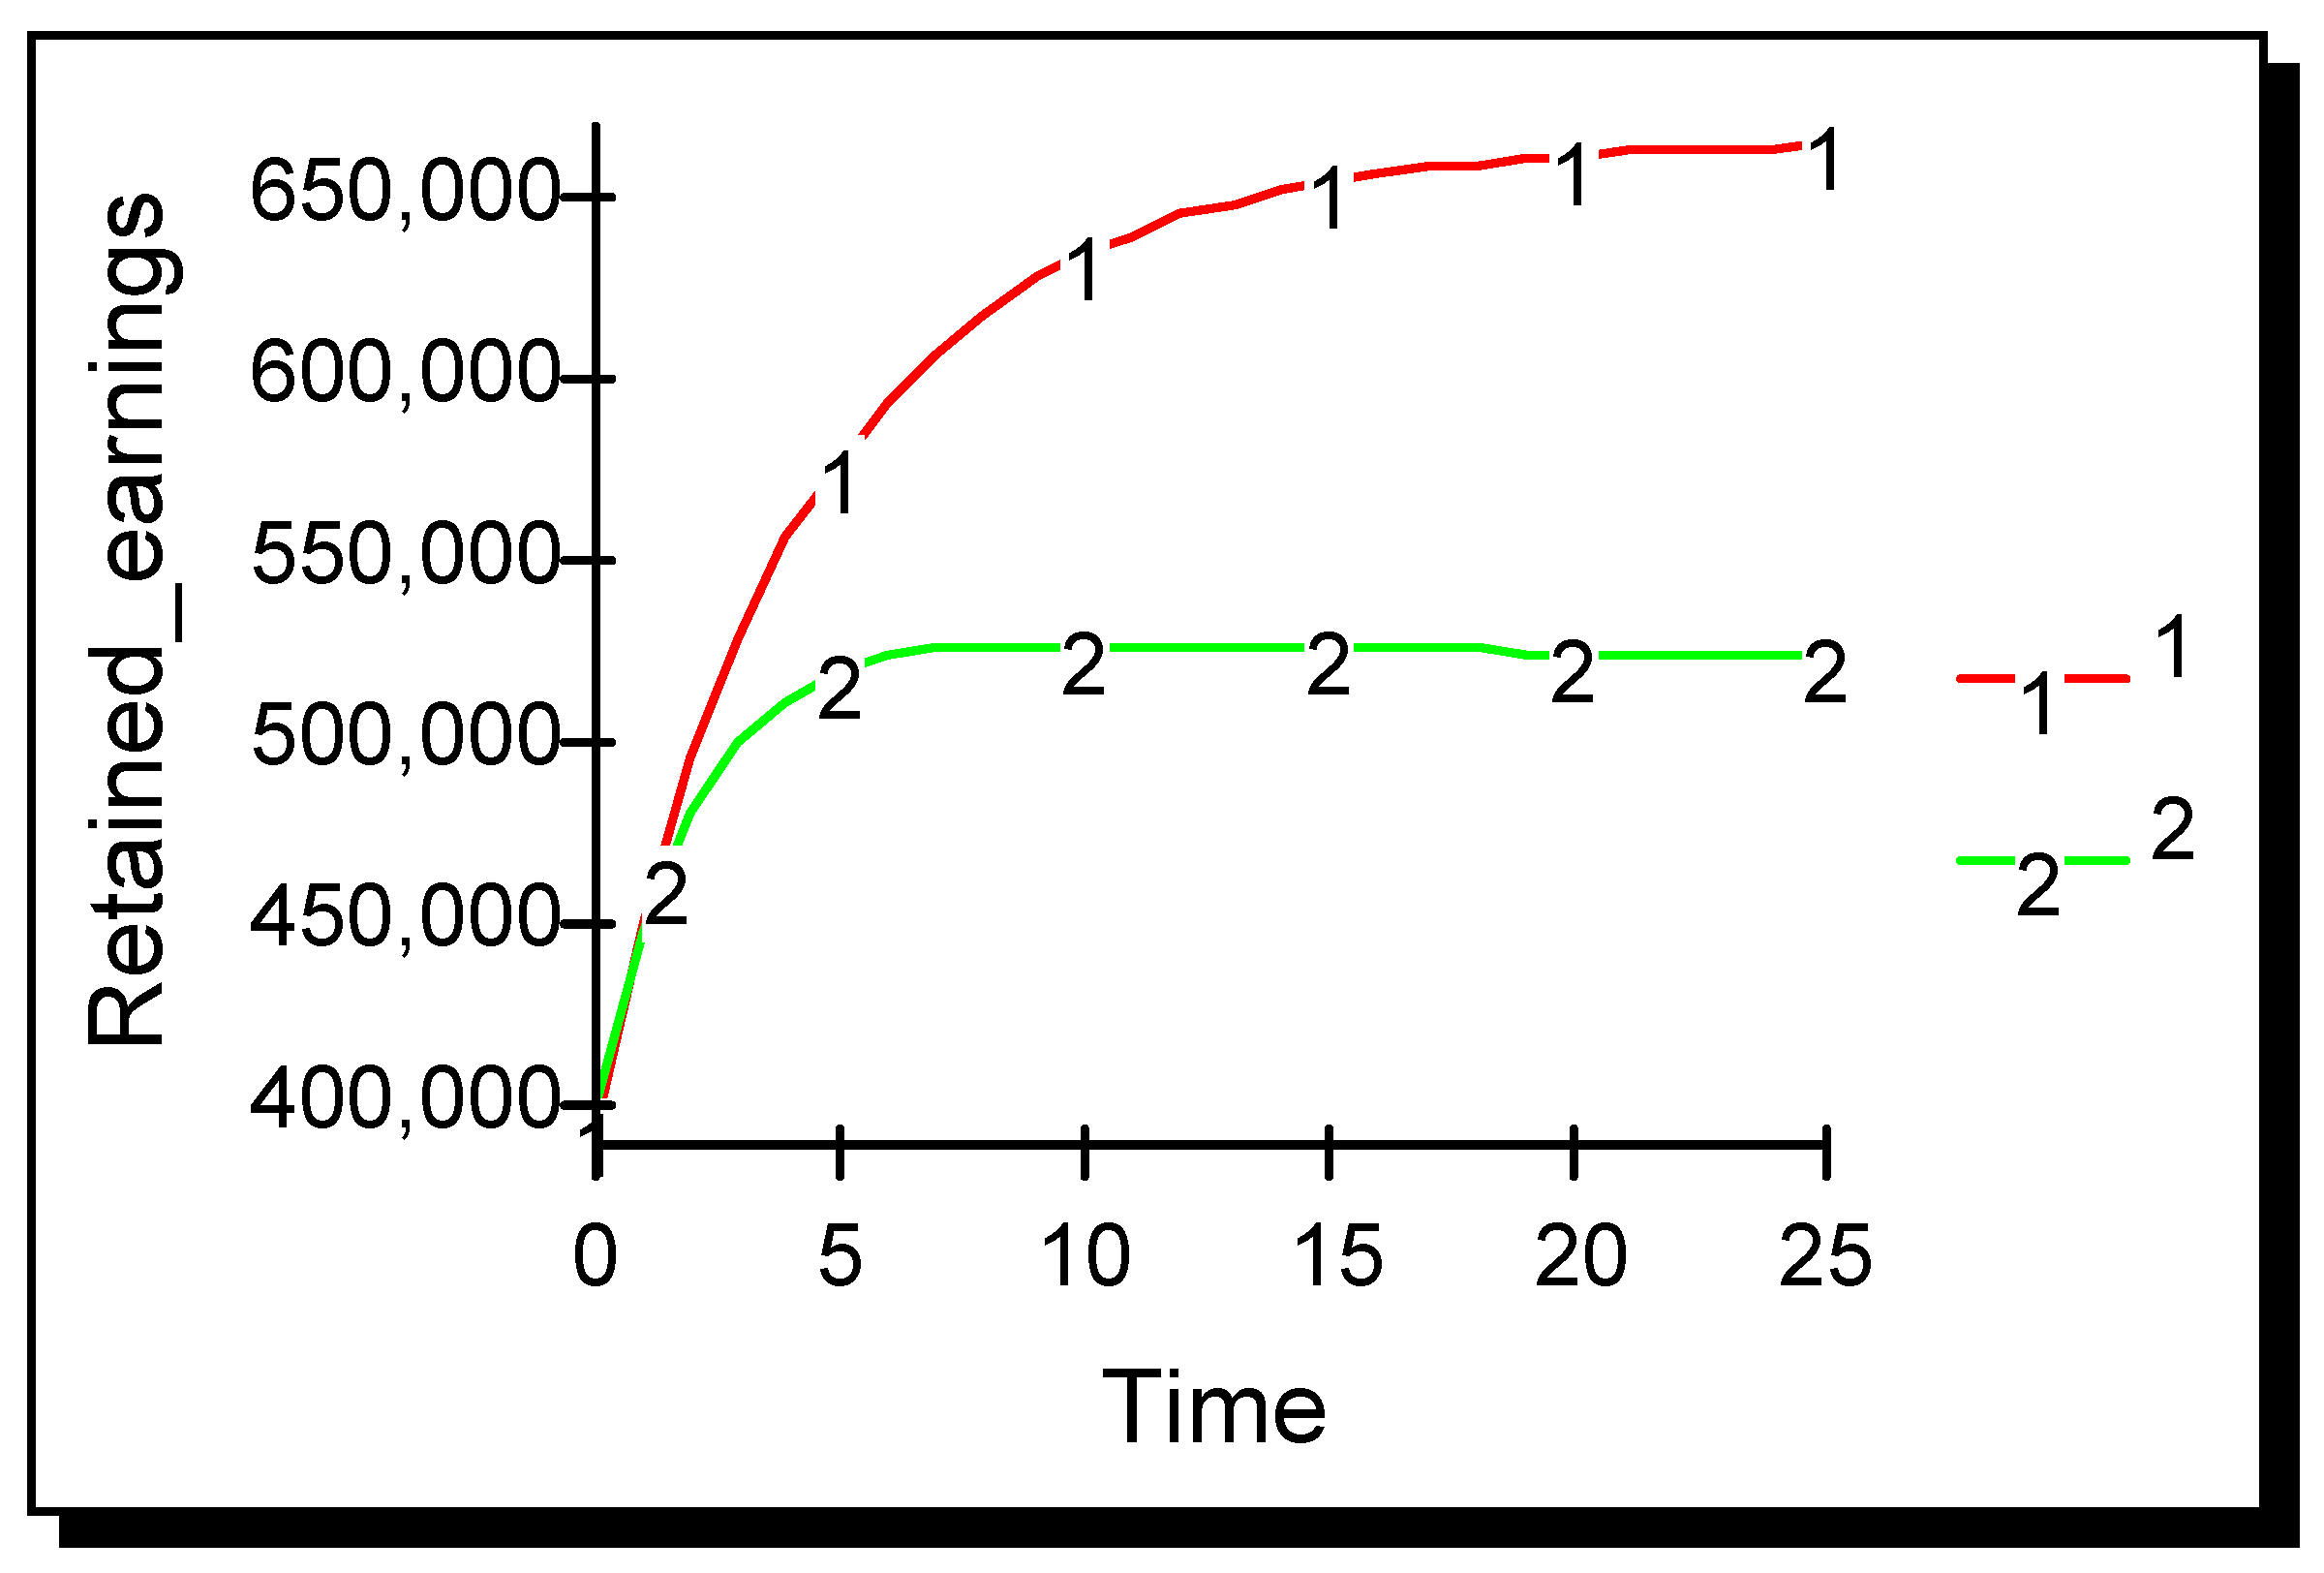
Industry behaviour as the level of advertising effectiveness is reduced below the threshold level is now examined.
Figure 3 shows results when advertising effectiveness is reduced to 0.000010. Both firms remain in the marketplace for all time. Clearly a regime change in the behaviour of the duopoly has taken place as advertising effectiveness drops below a threshold level. For the duopoly conditions being simulated here, the threshold level lies at approximately 0.0000102, i.e., when advertising effectiveness is at or below this level both firms tend asymptotically to an equilibrium, referred to as a terminal Cournot equilibrium; when advertising effectiveness is above this threshold then the advertiser achieves exponential growth and the non-advertiser is driven out of the market.
The situation when advertising effectiveness is reduced even further is now examined. Results shown in
Figure 4 are for the case when advertising effectiveness is 0.000001. Such an industry is unresponsive to advertising and it is clear that the advertiser gains negligible competitive advantage over its non-advertising rival.
The lesson for managers from this proposition is that if the industry is unresponsive to advertising then there is no necessity to advertise, even if your rival advertises, as advertising yields no competitive advantage. If the industry is mildly responsive to advertising, then there is merit in advertising as the firm can gain a significant competitive advantage over its rival, although failure to advertise will not result in the firm being eliminated from the market. However, if the industry is responsive to advertising, then the advertising firm gains an enormous competitive advantage and ultimately drives its rival out of the market. In such an industry, it will become necessary for the non-advertising firm to advertise in order to survive. The next proposition looks at the situation where both firms advertise and both are equally effective at advertising.
3.2. Symmetric Advertising with No Spillover
Proposition 2. In a differentiated Cournot duopoly where advertising shifts the demand function to the right and where both firms advertise and their advertising effectiveness is symmetric then: (a) both firms perform symmetrically; (b) there exists a threshold level above which both firms achieve exponential type growth and below which both firms tend asymptotically to a terminal Cournot equilibrium.
The simulation was run with the advertising effectiveness parameter for both firms set to 0.000010 and results are shown in
Figure 5. The amount of advertising optimally selected by both firms decreases over time. Performance of both firms is identical over time and the industry comes to a terminal Cournot equilibrium. A comparison of
Figure 3 and
Figure 5 shows that the equilibrium level when two firms advertise is lower than that achieved when only one firm advertises, but is substantially higher than that achieved at the static Cournot equilibrium when neither firm advertised.
Advertising effectiveness is now increased to 0.000011 and the simulation run again. The results in
Figure 6 show that both firms grow in exponential fashion. However, comparing this with
Figure 1 shows that growth is slower than when only one firm advertised. The threshold level at which industry behaviour bifurcated was found to lie at approximately 0.0000106, which is slightly higher than but very close to the threshold found under Proposition 1 where only one firm advertised. The simulation was also run for the case where the industry is unresponsive to advertising, i.e., advertising effectiveness for both firms was set at 0.000001. Results were similar to those given in
Figure 4 and showed that the industry remained approximately at the static Cournot equilibrium values for all time.
The implications of this proposition for managers is that when the industry is responsive or mildly responsive to advertising then it is worthwhile for both firms to advertise as both gain an absolute advantage. However, when both firms are equally effective as advertisers, no relative advantage is gained by either firm—i.e., no opportunity for competitive advantage exists. In the next section the situation in which both firms advertise but advertising effectiveness is asymmetric is examined.
3.3. Asymmetric Advertising with No Spillover
Proposition 3. In a differentiated Cournot duopoly where advertising shifts the demand function to the right and where both firms advertise and their advertising effectiveness is asymmetric then: (a) the firm with higher advertising effectiveness always outperforms the firm with lower advertising effectiveness; (b) there exists a threshold level of advertising effectiveness below which both firms tend to a terminal Cournot equilibrium and above which the firm with higher advertising effectiveness achieves exponential type growth and the firm with lower advertising effectiveness is driven out of the marketplace.
A small advertising asymmetry is introduced into the model. Advertising effectiveness for firms one and two is set at 0.000011 and 0.0000109, respectively. Results in
Figure 7 show that firm one, the firm with the greater competence in advertising, outperforms firm two and eventually drives it out of the market. An insight for managers is that the difference in performance is almost imperceptible for the first ten periods, which may lull the less competent advertiser into a false sense of security; however, the cumulative impact of the advertising asymmetry has a dramatic impact from period fifteen onwards.
A bifurcation in industry behaviour again occurs when advertising effectiveness falls below a threshold level. A small asymmetry in advertising effectiveness is introduced: for firm one it is set at 0.000010 and for firm two at 0.000009. Decreasing amounts of advertising are selected over time and the industry reaches a terminal Cournot equilibrium, but with both firms achieving a higher result than at the static Cournot equilibrium. Both firms remain in the market as shown in
Figure 8 but the more competent advertiser gains a competitive advantage over its rival. A comparison with
Figure 3 shows that the firm with higher advertising effectiveness achieves a slightly lower result at equilibrium than it did when its rival chose not to advertise. Performance of firm two, the less competent advertiser, is much improved on the situation when it did not advertise at all.
The threshold level is more difficult to determine when advertising is asymmetric as results vary with the amount of asymmetry. Trial and error experimentation showed that the threshold occurs at approximately 0.0000105. When the advertising effectiveness for the higher firm is set at or below 0.0000105 then the industry moves to a terminal Cournot equilibrium. At levels of effectiveness above this level, the profitability of the more competent advertiser grows exponentially and its less competent rival is driven from the market.
There are several insights for managers from this proposition. A firm that has even a minor relative advantage over its rival in advertising will gain a competitive advantage, as well as an absolute advantage, unless the industry is unresponsive to advertising in which case advertising has no effect. Secondly, the inferior advertiser may not notice for some time that its rival is gaining such an advantage and so may be slow to respond to the threat. Where the industry is responsive to advertising, this threat is very real as even a very small asymmetry in advertising effectiveness will ultimately lead to the less competent advertiser being forced out of the industry. Thirdly, the threshold level at which bifurcation in industry behaviour occurs has shown itself to be remarkably constant for the three propositions examined.
So far, the discussion has focussed on the cumulative impact of advertising. Friedman’s second criterion—advertising spillover—is now considered. The next proposition examines the situation where firm advertising, as well as shifting out its own demand function, also shifts that of its rival.
3.4. Symmetric Advertising with Spillover
Proposition 4. In a differentiated Cournot duopoly where both firms advertise and their advertising effectiveness is symmetric and where advertising influences the firm’s demand function and also that of its rival then: (a) for each level of advertising interaction there exists a level of advertising effectiveness below which both firms tend to a terminal Cournot equilibrium and above which both grow exponentially; (b) threshold levels of advertising effectiveness increase as spillover increases.
Advertising spillover occurs when advertising by one firm impacts on the demand of another firm. It is represented in the model by the advertising interaction parameter ρ. When this parameter takes a zero value, then advertising by one firm has no impact on its rival. When the interaction parameter takes a positive value, then advertising is cooperative, i.e., advertising by one firm also increases demand for its rival’s product. If advertising interaction ρ is set equal to 1, then advertising by a firm has an impact on its rival’s demand equal to that which it has on its own demand—at this point advertising has become a public good. When the interaction parameter ρ takes a negative value, then advertising is predatory: it increases demand for its own product and depresses demand for the rival product.
Spillover has two distinct effects. Firstly, advertising elasticity of demand is negatively related to advertising interaction according to expression (7). The greater the spillover, the lower the advertising elasticity of demand for the firm’s own product, and consequently the lower the optimal amount of advertising selected by the Dorfman–Steiner condition (expression 5). A lower amount of advertising has a lower impact on firm price (expression 4). Conversely, predatory advertising, where spillover is negative, increases advertising elasticity of demand stimulating greater expenditure on advertising and a consequent greater shift outwards in the demand function. However, spillover has a second effect: advertising interaction directly impacts on rival’s price according to expression (4); cooperative advertising will increase the rival’s price and predatory advertising will reduce it.
The impact of these two combined effects differs depending on whether advertising is cooperative or predatory. When advertising is cooperative, a lesser amount of advertising is selected (than when no spillover occurred) and this has a lesser effect on own price. Through the spillover term in expression (4), cooperative advertising by the rival has a positive effect on firm price. Therefore, under cooperative advertising both effects act to increase price. In contrast, when advertising is predatory a greater amount of advertising is selected; this will have a greater positive impact on own price but the rival’s advertising, through the spillover term, will act to depress firm price. When advertising is predatory, the two effects on price act in opposition to one another.
The relationship between spillover and advertising effectiveness when advertising is symmetric is now examined. Trial and error experimentation determined that the bifurcation point—the level of advertising effectiveness at which industry behaviour switches from asymptotic growth to exponential growth—increases as advertising interaction increases, as shown in
Figure 9. This implies that, as advertising becomes increasingly cooperative, firms must become increasingly more effective at advertising in order to generate a substantial increase in demand. Industry performance when advertising is cooperative is lower than that when advertising is non-cooperative.
There are a number of implications for managers from this discussion. Firstly, it is advantageous for a firm to carry out advertising in such a way that it has as little positive spillover on its rival’s demand as possible. This is as intuitively expected. Secondly, for a particular level of advertising effectiveness, predatory advertising creates a greater absolute advantage for both firms than cooperative advertising does. However, high levels of predatory advertising may lead to profitless growth for both firms. Thirdly, cooperative advertising opens up the possibility of one firm shirking on advertising while still benefiting from that carried out by its rival. In the next two sections the impacts of perfectly cooperative and perfectly predatory advertising are examined.
3.5. Cooperative Advertising
Proposition 5. In a differentiated Cournot duopoly where only one firm advertises and advertising shifts the demand function of both the firm and its rival to the right then: (a) when advertising is perfectly cooperative (ρ = 1) the non-advertiser gains a competitive advantage over the advertiser; (b) below a threshold level of advertising interaction the advertiser gains a competitive advantage over the non-advertiser.
Advertising is perfectly cooperative (
ρ = 1) when it has the same impact on its rival’s product as it has on its own. Firstly, the case where only one firm advertises cooperatively is examined. In the scenario shown in
Figure 10, the advertiser gains absolute advantage (i.e., profits increase from the static Cournot equilibrium situation where no advertising takes place) but cedes competitive advantage to its non-advertising rival. This is intuitively obvious from expressions (4)–(7): the non-advertiser gains from its rival’s advertising but bears none of the cost. Although the advertiser gains an absolute advantage it loses competitive advantage to its rival. Clearly there is little incentive for a firm to advertise unilaterally when advertising is perfectly cooperative, i.e., when advertising is a public good. In such cases advertising may take place at industry rather than firm level; for example, industry advertising of milk or European Union advertising of olive oil. However, as the level of spillover reduces, unilateral cooperative advertising can lead to competitive advantage. For example, for the scenario shown in
Figure 10, if spillover is only partial (e.g., where
ρ = 0.5) then the advertiser gains a competitive advantage as well as an absolute advantage.
The situation changes if both firms advertise perfectly cooperatively. Where advertising effectiveness is symmetric and above the threshold level shown in
Figure 9 then both firms grow exponentially. Where advertising effectiveness is asymmetric then, counterintuitively, the more effective advertiser loses competitive advantage to its less effective rival; the greater the asymmetry, the greater the loss in competitive advantage. However, as the effectiveness of the less effective advertiser falls below that of its more effective rival, the combined impact of advertising is lower and so the absolute advantage gained by both firms is lower. The insight for managers here is that when advertising is perfectly cooperative then it pays to spend on advertising in order to gain absolute advantage, but spend less than your competitor in order to gain competitive advantage.
Predatory advertising—where firm advertising acts to shift out its own demand function but to depress that of its rival—is now examined.
3.6. Predatory Advertising
Proposition 6. In a differentiated Cournot duopoly where firm advertising shifts the demand function of the firm to the right but that of its rival to the left and advertising is perfectly predatory (ρ = −1) then: (a) if only one firm advertises, the advertiser gains a competitive advantage over the non-advertiser (b) when both firms advertise symmetrically both firms stagnate.
Where advertising is carried out by only one firm and is perfectly predatory (
ρ = −1), the advertiser gains a competitive advantage both above and below the bifurcation level of advertising effectiveness as shown in
Figure 11. Note that the bifurcation level of advertising effectiveness is much lower when advertising is predatory than when it is cooperative: even relatively ineffective advertising that is predatory can have a significant impact on firm profitability. This is consistent with the results for symmetric advertising shown in
Figure 9. It is also consistent with real world advertising: predatory advertising, such as that carried out by supermarkets in the national papers, is relatively simple in format, whereas advertising where high positive spillover occurs, for example in the beer and soft drinks industry, is carried out using sophisticated television advertisements.
When advertising is unilateral and predatory only one of the two spillover effects acts on the demand curve of the advertiser. A greater amount of advertising is selected via expressions (5) and (7) and this acts to increase price according to the second term in expression (4). Given that the rival does not advertise, the third term in expression (4), which acts to depress price, is zero. The converse is the case for the non-advertiser: the second term which acts to increase price is inactive and the third term, which is active, depresses price. The overall effect is that the demand curve for the advertiser is shifted to the right and that of the non-advertiser is shifted to the left; this couple effect yields a competitive advantage to the predatory advertiser.
The situation where both firms advertise in a perfectly predatory fashion (
ρ = −1) is now considered. The competitive situation alters dramatically when both firms advertise in a predatory manner. The results of the simulations show that profits remain stagnant for low levels of advertising effectiveness and decline for higher levels of effectiveness. This counterintuitive result occurs because at low levels of advertising effectiveness little advertising is selected and neither firm gains an absolute or competitive advantage. However, at high levels of advertising effectiveness large amounts of advertising are selected but the impact of this advertising by both firms on both firms cancels itself out and so demand and price remain constant but the high cost of advertising acts to reduce firm profits. Predatory advertising therefore poses a dilemma for firms: there is great advantage to be gained by the firm if it is the only predatory advertiser but if the rival joins in and also advertises then both firms will be worse off. Such a situation can occur during an advertising war between two strong and equally well-endowed firms: both spend a great deal of money on advertising but gain little in terms of either absolute or competitive advantage; both firms must remain in the contest for the duration as to unilaterally stop advertising would result in significant gains by the rival. Successive whole page advertisements by grocery retailers in Sunday newspapers are a current example of this phenomenon. When advertising effectiveness is asymmetric and above the threshold then the more effective predatory advertiser drives its rival out of the market, as shown in
Figure 12. Gains due to predatory advertising are therefore possible if one is more adept at it than one’s rival.
4. Discussion and Conclusions
This paper considers a strategic decision that faces many firms—whether or not to advertise—and examines it using simulation, a technique from the operational research stable. Simulation offers the ability to examine a competitive situation where obtaining a closed-form analytical solution would be difficult or intractable. The simulation model is founded on a solid analytical base and is entirely deterministic.
The simulation results show that duopoly behaviour differs remarkably under different advertising scenarios. Where advertising is symmetric, both firms remain in the market but tend to an equilibrium if advertising is below a threshold level, or to grow exponentially if above. Where advertising is asymmetric, above the threshold level of advertising effectiveness the more-effective advertiser will drive its rival out of the market while below the threshold both firms will tend to an equilibrium. When advertising of one firm also impacts on its rival, more complex behaviour ensues: depending on initial conditions both firms tend to an equilibrium, both firms achieve exponential growth, or the more effective advertiser drives its rival out of the market. The research identified that in the long term both steady state and non-steady state outcomes occur and explicitly determined initial conditions that define the boundary between these two classes of outcome (see Propositions 1, 2 and 3). The research demonstrated a significant difference in the behaviour of symmetric and asymmetric models (see
Figure 6 and
Figure 7). The results support [
5] who also found that the behaviour of a duopoly varies greatly for small changes in advertising parameter values.
The results suggest that firms should advertise little when advertising effectiveness is low and advertise significantly when it is high. This is consistent with empirical findings of [
3] that advertising to sales ratios vary widely: from zero to 8.2% with an average of 3.7%. A contribution of the present paper is to demonstrate a bifurcation in industry behaviour when advertising effectiveness exceeds a threshold level. This finding suggests that advertising response does not increase in any regular or linear pattern in accordance with advertising effectiveness, but instead a sudden shift in advertising response takes place at a particular threshold level. These findings support the finding of [
36] that advertising expenditures ‘vary drastically across industries’ (p. 281) from as little as 0.1% of sales for vegetables to 60% of sales for cosmetics, the assertion of [
34] that even ‘a firm that exercises market power will not advertise if advertising does not affect demand’ (p. 278), and the conclusion of [
37] that the ‘effectiveness of advertising is an important determinant of advertising outlays’ (p. 20). The results also support the contention of [
23] that ‘the dominant firm will exert more promotional effort’, although [
23] regards the dominant firm as that with lower marginal cost whereas the present paper regards the dominant firm as that with higher advertising effectiveness.
Advertising is predatory when a firm’s advertising shifts the demand function of its rival to the left [
26], an action which clearly has a negative impact on its rival’s demand. The simulation results show, however, that it is not necessary to shift the rival’s demand curve to the left in order to increase market share at the rival’s expense. An asymmetric shift of demand functions to the right also yields a result that is predatory-like: the more effective advertiser increases its market share at the expense of its less effective rival even though demand is expanding for both firms.
Inter-firm aspects of advertising effort are an important facet of advertising [
26,
34] (p. 278). This research demonstrates that advertising spillover is a complex phenomenon. While firms have an incentive to ‘free-ride’ on the advertising of competitors due to its ‘public good’ nature [
28], the spillover effect is reduced as one of the firms becomes dominant or as the predatory effect of advertising becomes more relevant [
23]. When advertising is highly cooperative, there exists a strong incentive for a firm to free-ride: both firms gain from the advertising effort of the advertiser but the non-advertising firm gains competitive advantage over the advertiser due to its lower costs. However, as the level of advertising interaction falls advertising, although still cooperative, can lead to a competitive advantage for the advertiser. This provides support for [
23]’s finding that under certain conditions firms will advertise despite the public good nature of advertising. While unilateral predatory advertising yields competitive advantage, bilateral advertising that is perfectly predatory and symmetric yields little competitive or absolute advantage despite large expenditures on advertising. This result supports a long line of literature that suggests that combative costly advertising by firms can be mutually destructive [
11]; a contribution of this paper is to provide specific instances of when this is so.


