Article

Evolution of Green Space under Rapid Urban Expansion in Southeast Asian Cities

by
Amal Najihah Muhamad Nor
1,2,*,
Hasifah Abdul Aziz
1,
Siti Aisyah Nawawi
1,
Rohazaini Muhammad Jamil
1,
Muhamad Azahar Abas
1,
Kamarul Ariffin Hambali
1,
Abdul Hafidz Yusoff
3,
Norfadhilah Ibrahim
3,
Nur Hairunnisa Rafaai
4,
Ron Corstanje
2,
Jim Harris
2,
Darren Grafius
2 and
Humberto L. Perotto-Baldivieso
5
1
Faculty of Earth Science, Universiti Malaysia Kelantan, Jeli Campus, Jeli 17600, Malaysia
2
School of Energy, Environment and Agrifood, Cranfield University, Bedford MK43 0AL, UK
3
Faculty of Bioengineering and Technology, Universiti Malaysia Kelantan, Jeli Campus, Jeli 17600, Malaysia
4
Institute for Environment and Development, Universiti Kebangsaan Malaysia, Bandar Baru Bangi 43600, Malaysia
5
Caesar Kleberg Wildlife Research Institute, Texas A&M University, Kingsville, TX 78363, USA
*
Author to whom correspondence should be addressed.
Sustainability 2021, 13(21), 12024; https://doi.org/10.3390/su132112024
Submission received: 13 September 2021 / Revised: 19 October 2021 / Accepted: 21 October 2021 / Published: 30 October 2021

Abstract

:
Globally, rapid urban expansion has caused green spaces in urban areas to decline considerably. In this study, the rapid expansion of three Southeast Asia cities were considered, namely, Kuala Lumpur City, Malaysia; Jakarta, Indonesia; and Metro Manila, Philippines. This study evaluates the changes in spatial and temporal patterns of urban areas and green space structure in the three cities over the last two decades. Land use land cover (LULC) maps of the cities (1988/1989, 1999 and 2014) were developed based on 30-m resolution satellite images. The changes in the landscape and spatial structure were analysed using change detection, landscape metrics and statistical analysis. The percentage of green space in the three cities reduced in size from 45% to 20% with the rapid expansion of urban areas over the 25-year period. In Metro Manila and Jakarta, the proportion of green space converted to urban areas was higher in the initial 1989 to 1999 period than over the latter 1999 to 2014 period. Significant changes in green space structure were observed in Jakarta and Metro Manila. Green space gradually fragmented and became less connected and more unevenly distributed. These changes were not seen in Kuala Lumpur City. Overall, the impact of spatial structure of urban areas and population density on green space is higher in Jakarta and Metro Manila when this is compared to Kuala Lumpur. Thus, the results have the potential to clarify the relative contribution of green space structure especially for cities in Southeast Asia where only a few studies in urban areas have taken place.

1. Introduction

Globally, urban areas are expanding and undergoing rapid development, with 65% of the world’s population expected to be urban by the year 2025 [1]. This development is predominant in the fastest growing economies and human populations, particularly in developing countries. According to the United Nations Population Fund [2], 90% of urban population growth will be in Asia, Africa and Latin America, with 80% of the world’s largest cities being in these areas. In Southeast Asia, urbanization has increased significantly in the last two decades as industry has become the focus for economic development [3]. In this region, the urban growth rate is 2.4% per year, which is relatively high versus developed regions of the world [4], and exhibits different patterns of growth to well-studied developed cities. This situation complicates the management of urban ecosystems and green spaces and potentially poses threats to the environment [3].
Urban green spaces support valuable functions and provide many different ecosystem services, offsetting the negative environmental and health effects of urbanization while providing benefits to human well-being [5]. Rapid urban expansion profoundly transforms these spaces and can result in significant decline of green spaces [6]. For example, cities in China have lost an estimated 47.1 km2 of green space annually (1992 to 2004) [7]. As green spaces shrink and become fragmented within the built-up matrix, they suffer degradation in connectivity, biodiversity, and ecosystem function [8]. This degradation may reduce the quality of life of urban dwellers.
Changes in landscape structure are associated with patterns and processes at various spatial scales, so quantifying these changes is important for assessing the impact of rapid urban expansion on green space [9]. However, it is not clear how interactions between rapid urban expansion patterns affect the amount and spatial distribution of green space. The examination of spatial information over time is one way to determine these relationships [10], and the size, shape and spatial configuration of green spaces help to determine their resulting ecosystem service delivery as well as public perceptions, visiting patterns and their use [11].
Limited studies exist for Southeast Asian cities on the importance of green space structure. Previous studies in Asian countries and on large cities in China have focused primarily on urban expansion and social benefits of green space rather than understanding landscape structure [12,13,14]. Less attention has been paid to middle-sized Southeast Asian cities, such as Kuala Lumpur, and megacities of Southeast Asia such as Jakarta and Metro Manila. These three cities are the capitals of their respective countries and their most important economic and political centres, and they have developed rapidly in recent decades. The mixing of land use and uncontrolled rapid growth are major features of Southeast Asian urban expansion [15], which is further typified by increasing populations and rural-to-urban migration [3]. Sodhi et al., 2010 [16] reported that among tropical regions, Southeast Asia has one of the highest rates of green space loss and deforestation. This loss is due largely to a lack of integrated land use and regional planning, the relatively weak structure of urban policy and the absence of a legal basis for controlling urban expansion [17]. The pace of development has largely surpassed the ability of policy to keep pace [18]. While integrated city planning is available, it has generally been designed for developed Western cities and is not readily compatible with the considerations of rapidly growing cities [19]. As such, studies of urban development in this region should consider the impacts of local planning policy in order to understand its effects on green space condition, extent and form [15]. This is not only key to understanding the dynamics of the landscape but can inform future urban planning, enabling the maintenance and expansion of ecosystem services and human well-being [20]. Comparing changes in green space and urban development between similar but distinct cities is important to gaining a better understanding of how these changes are affected by different driving forces and framing conditions [21]. Moreover, comparative analysis may lead to identifying policies that effectively protect and promote urban green space. Not least, it is hoped that comparative analysis will lead to results and conclusions that can be generalised and applied to different cities.
In order to understand the impact of urban expansion on green space in Southeast Asia and to support local urban planning, we use landscape structure analysis to address three objectives: (i) to quantify changes in urban areas and green space spatial distribution in three rapidly growing cities in Southeast Asia; (ii) to evaluate the impact of these changes on the structure of green spaces; and (iii) to explore the impact of different types of urban expansion and planning policies on changes to green space structure. The results from this study may lead to new insights into the effects of rapid urban expansion on green space in the developing urban landscapes of Southeast Asia and provide empirical support for more effective green space design and planning.

2. Materials and Methods
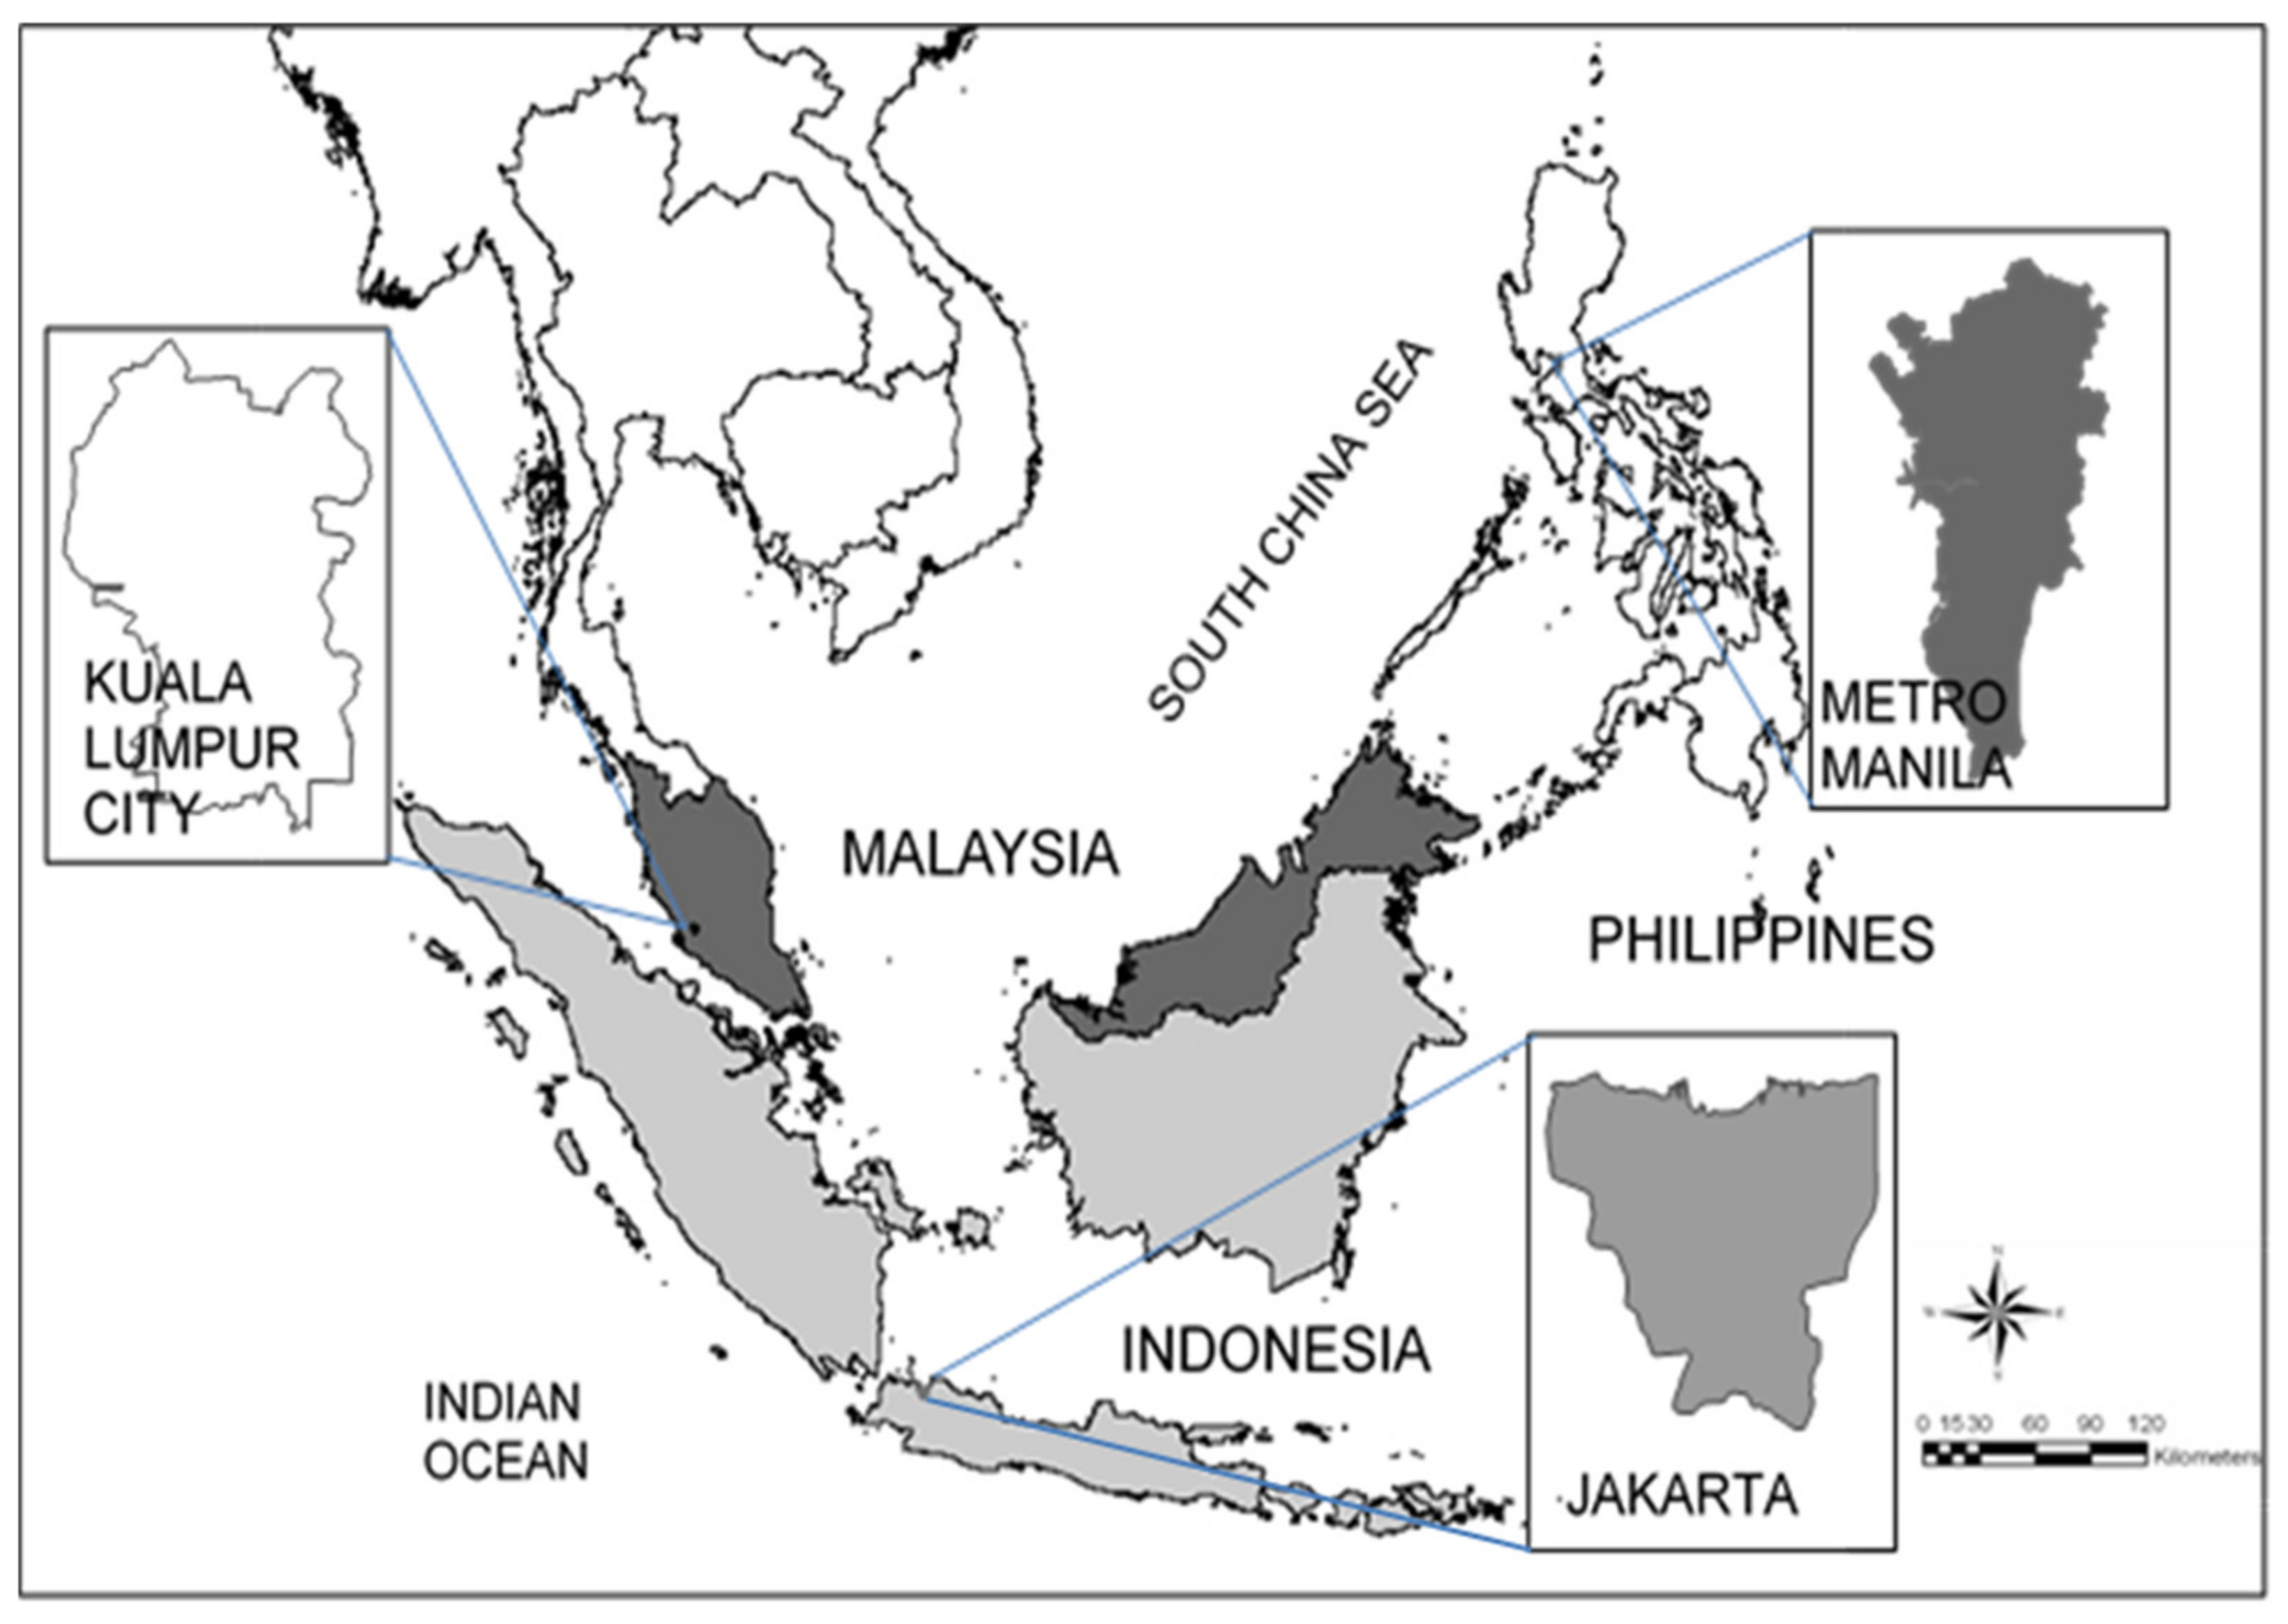
2.1. Study Area

Three larger Asian cities (Figure 1) were chosen for this study (Kuala Lumpur, Jakarta and Metro Manila) due to their rapid urban expansion, their development as urban areas and the increase of economic growth, environmental destruction and societal concerns [22]. Kuala Lumpur City, Malaysia’s capital, is situated at the intersection of the Klang and Gombak rivers. It has a total area of 23,934 ha (239 km2) and a population of 1.6 million citizens in 2010 (Department of Statistics Malaysia). By 2020, the Kuala Lumpur Structural Plan 2020 anticipates a population of 2.2 million [23,24]. Jakarta, the capital of Indonesia, consists of five municipalities and lies in the lowland on the northwest coast of Java Island, occupying an area of 64,000 ha (640 km2). Jakarta’s landscape is flat, elevating progressively from 5 to 50 metres above mean sea level [25]. In 2012, the population was expected to be 9.7 million (BPS DKI Jakarta Provinces, Indonesia). Metro Manila, the Philippines’ capital, is comprised of eight contiguous cities that encompass an area of nearly 63,800 hectares (638 km2). The city is located on the eastern coast of Manila Bay in the lowlands of Southwestern Luzon Island [25]. According to the 2010 census, it has a population of 11.8 million (Philippine National Statistical Coordination Board) [24]. Multi-year population data of Kuala Lumpur, Jakarta and Metro Manila were taken from the Department of Statistics Malaysia, the Bureau of Statistics (BPS DKI Jakarta Provinces) and the Philippine National Statistical Coordination Board, respectively.

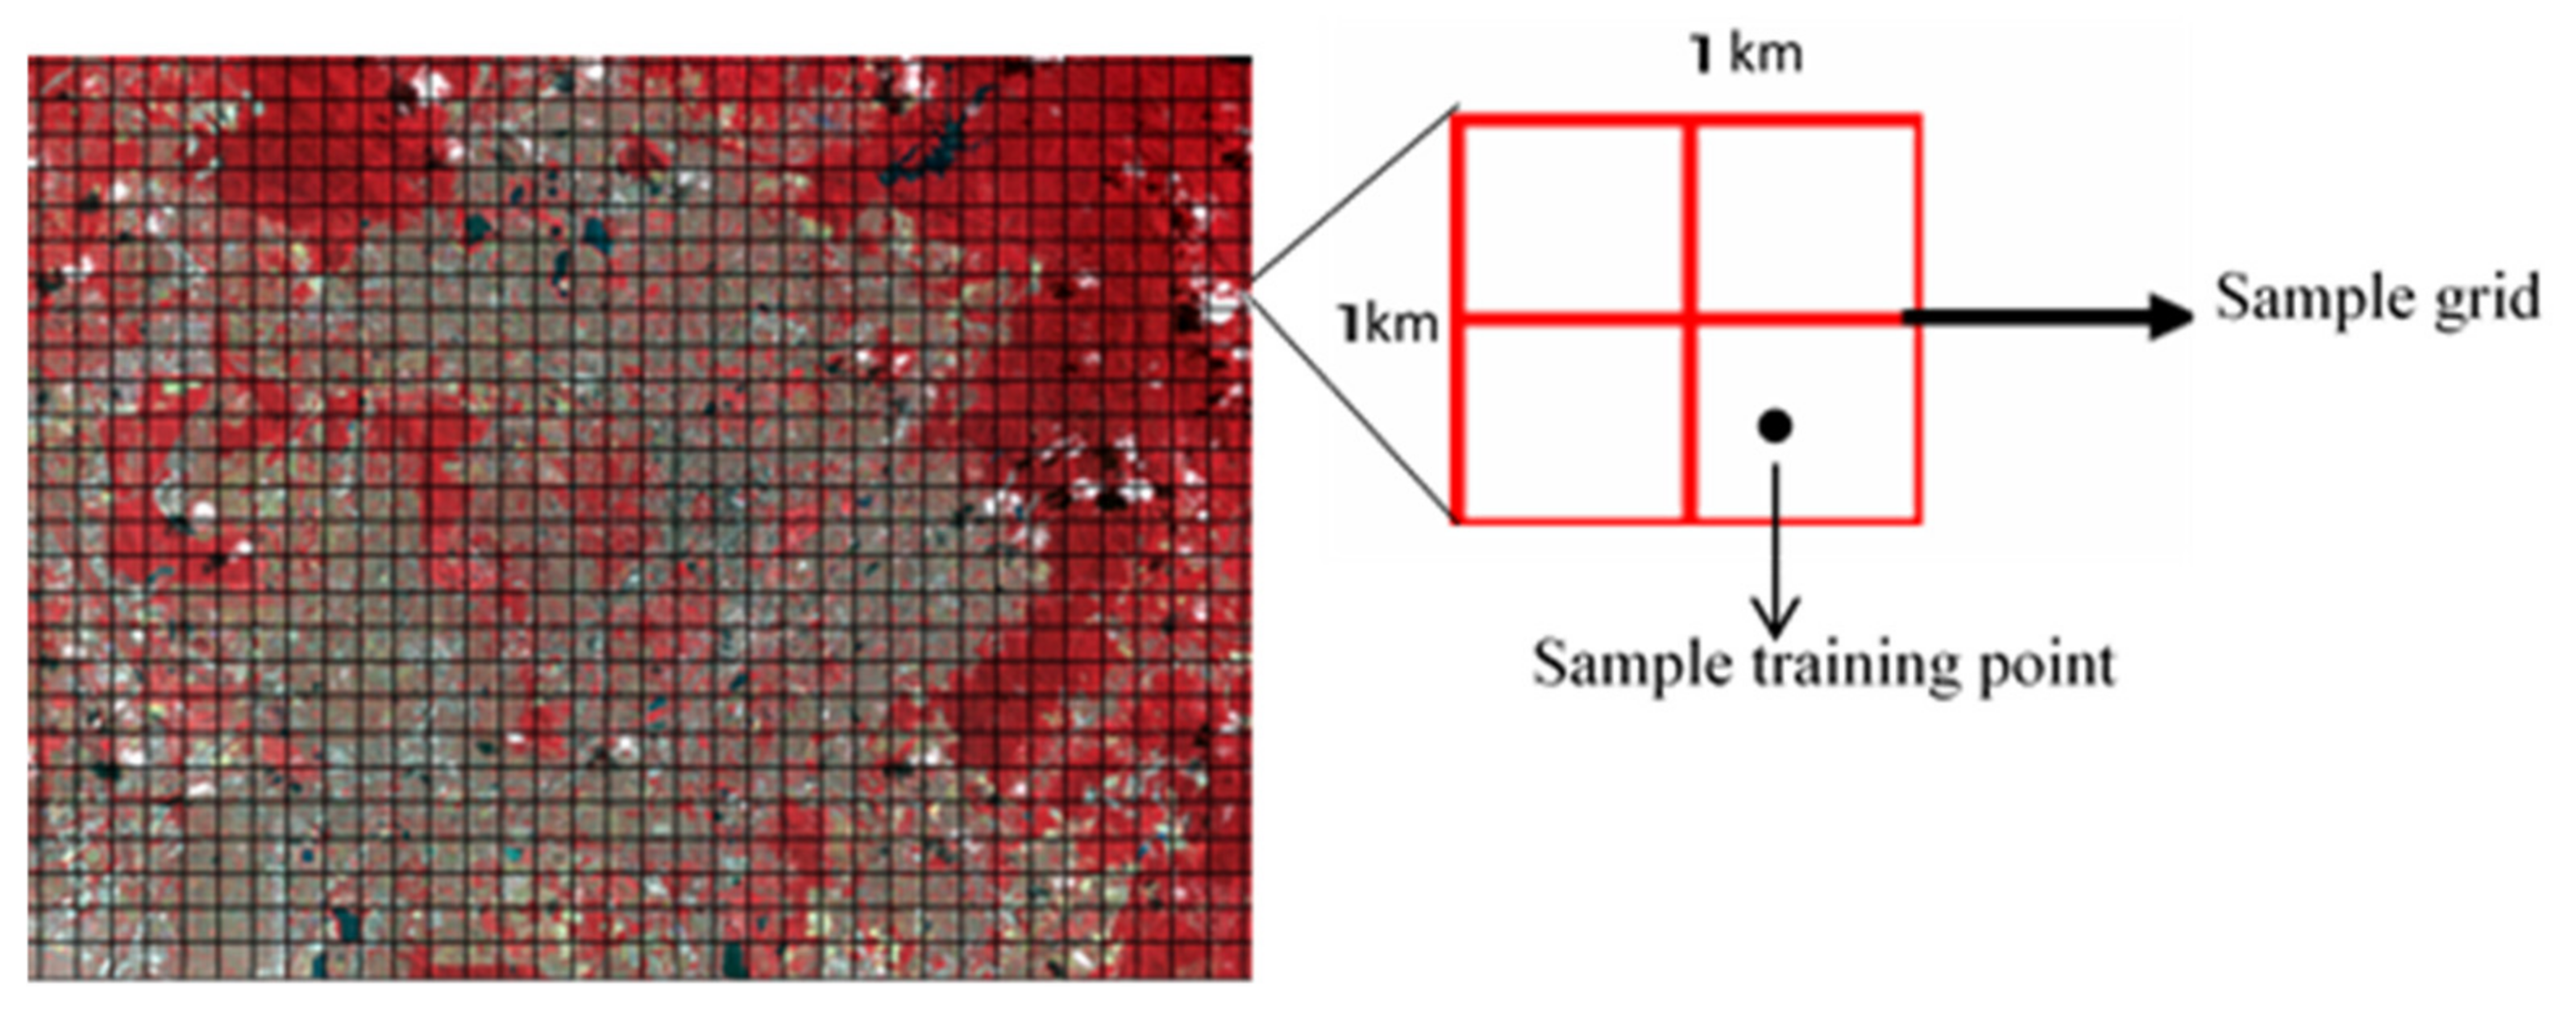
2.2. Data Acquisition and Processing

Satellite imagery was used to obtain land use land cover (LULC) information for the study areas. Kuala Lumpur Landsat-5 Thematic Mapper 30-m imagery was acquired from the Malaysian Remote Sensing Agency (MRSA) between 1988 and 1999, and Jakarta and Metro Manila Landsat-5 Thematic Mapper 30-m imagery was retrieved from the Global Land Cover Facility (http://glcf.umd.edu/, accessed 20 December 2016) between 1989 and 1999. For all selected cities, Landsat-8 Enhanced Thematic Mapper 30-m imagery from 2014 were downloaded from the United States Geological Survey (http://www.usgs.gov/, accessed on 23 December 2016) [24].
Nine images were processed using ERDAS Imagine 2014 (Intergraph Corporation, Madison, AL, USA) and ArcGIS 10.2 (ESRI, Redlands, CA, USA) to produce LULC maps for Kuala Lumpur, Jakarta and Metro Manila. We extracted the area of interest from the imagery using city boundaries derived from Global Administrative Areas (http://www.gadm.org/, accessed on 25 December 2016). For each year, we classified the LULC classes (built-up area, green space, cleared land and waterbody) applying maximum likelihood supervised classification (ERDAS Imagine, Hexagon Inc., Stockholm, Sweden) [26] (Table 1, adopted from Nor et al., 2017 [24]. Green space is defined here as any portion of land covered in vegetation within the built-up matrix of urban areas that is large enough to be recorded by the sensor’s 30-m resolution [24]. Systematic sampling was used to collect training points from sample grids (1 km2) created in ArcGIS (Figure 2), ensuring an even distribution across the study area. In the classification process the LULC maps, topographic maps and Google Earth were used as reference. Accuracy assessment produced statistical outputs to check the quality of the classification results [27]. Validation samples for each class were identified in a stratified random sampling approach [13] in which 100 points were assigned to each LULC. The overall accuracy and kappa statistic were calculated to explain differences and improvements in the classification of images [28]. The accuracy of images in Kuala Lumpur was 88% in all three years. Validation samples were identified for each class using a stratified random sampling technique [13] in which each LULC was allocated 100 points. To account for discrepancies and improvements in imagery classification, the overall accuracy and kappa statistic were calculated [24,28]. In Kuala Lumpur, image accuracy averaged 88% during a three-year period. In 1989, 1999 and 2014, the image accuracy in Jakarta was 87%, 88% and 85%, respectively. In Metro Manila, the accuracy for 1989, 1999 and 2014 was 88%, 87% and 88%, respectively. Raster data were converted to vector format using ArcGIS. Finally, the LULC maps were analysed in order to study the spatial pattern evolution of green space.

2.3. Landscape Change Analysis

Change detection analysis was used to determine the amount of green space converted to urban areas and other land uses between 1988/1989 and 1999 and between 1999 and 2014 for each city. In this analysis, maps from two different years were overlaid, and a table containing the conversion of LULC was produced. We calculated the proportionate rate of change for each LULC using the following formula [10,24]:
C = A j A i A i
where C is the proportional change in LULC, and Ai and Aj denote the area of the land type in years I and j, respectively. We then used the given formula to determine the annual changes in each LULC (Nor et al., 2017):
D = 1 n j n i × A j A i A i
where D denotes the annual change in each LULC, and ni and nj denote the years I and j, respectively.

2.4. Landscape Structure Analysis

Landscape structure of the cities over the three periods (1988/1989, 1999 and 2014) was analysed at landscape, class and patch levels to quantify changes in the spatial structure of green space [29]. Landscape-level metrics are effective for quantifying the entire landscape while class-level metrics analyse landscape patterns of each LULC individually [30]. Class-level metrics provide more specific information about landscape spatial patterns, variations at the local level and the distribution of LULC [31]. Patch-level metrics are critical in understanding the mechanisms of landscape change [32] and important in determining significant differences between patches within a LULC class. Choices for appropriate landscape metrics are dependent upon the scale of analysis and objectives of the study [31]. Six metrics for analysing landscape structure were chosen in this study where the similar metrics also used in the work by Nor et al., 2017 [24]: percentage of area (PAREA; %), patch density (PD; number of patches per 100 ha), mean patch area (MPA; ha), largest patch index (LPI; %), landscape shape index (LSI; m/ha) and Euclidean nearest neighbour distance (MNN; m) (Table 2, [24]). The metrics were calculated using FRAGSTATS (Version 4.2, University of Massachusetts, Amherst, MA, USA) [29]. Green space fragmentation in response to urban expansion was quantified using PAREA, PD and MPA; high values of PD and low values of MPA indicate a fragmented landscape composed of many small patches [33]. At the patch level, three metrics (MPA, LSI and MNN) were derived to describe the structural connectedness between patches due to their size, shape and inter-patch distance (Table 2; [24]). Tian et al. 2014 [34] employed these landscape measures to depict variations in green space landscape properties such as size, shape and patch isolation. Based on these metrics, we compared significant changes at the landscape level for each city in between 1988/1989 and 1999 and between 1999 and 2014 using a Kruskal–Wallis test (significance level 0.05). We also compared the significant changes in LULC patterns at class level between 1988/1989 and 1999 and between 1999 and 2014 for each city. Data were log-transformed due to non-normal distributions. Associations between population density (calculated by dividing the population by the size of the urban area), urban expansion and changes in built-up area and green space were illustrated using a correlation graph.

3. Results

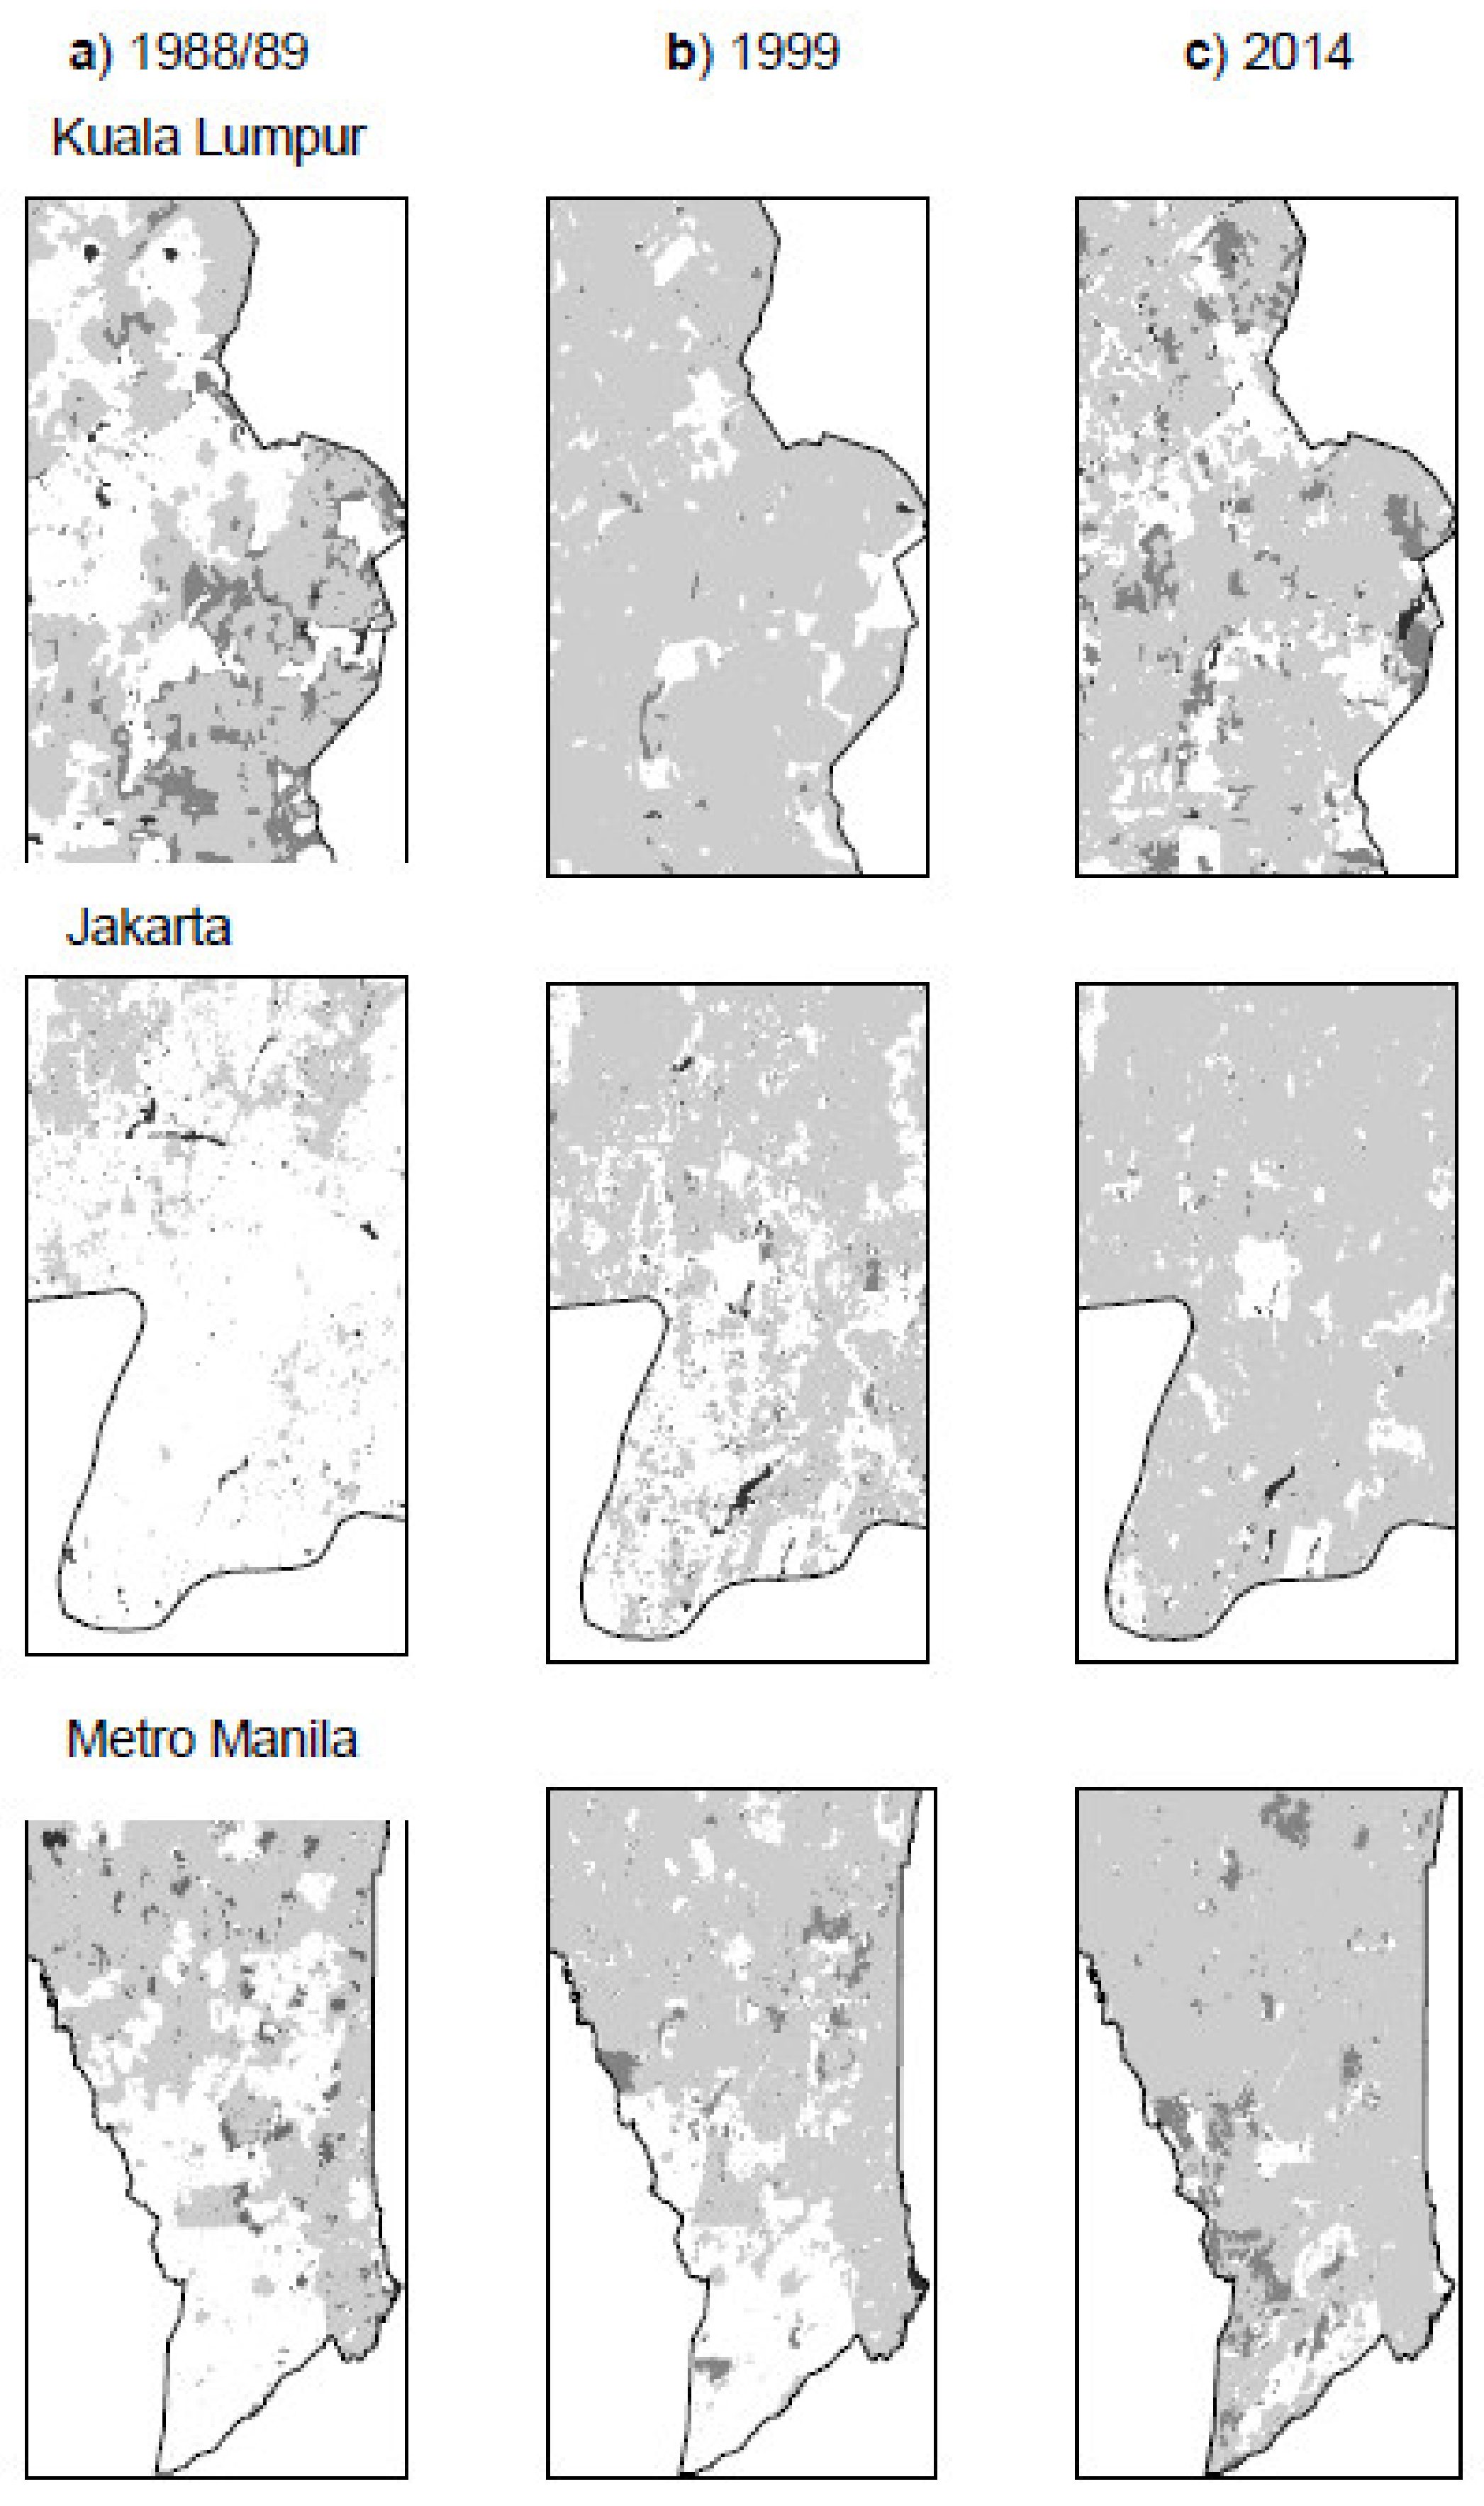
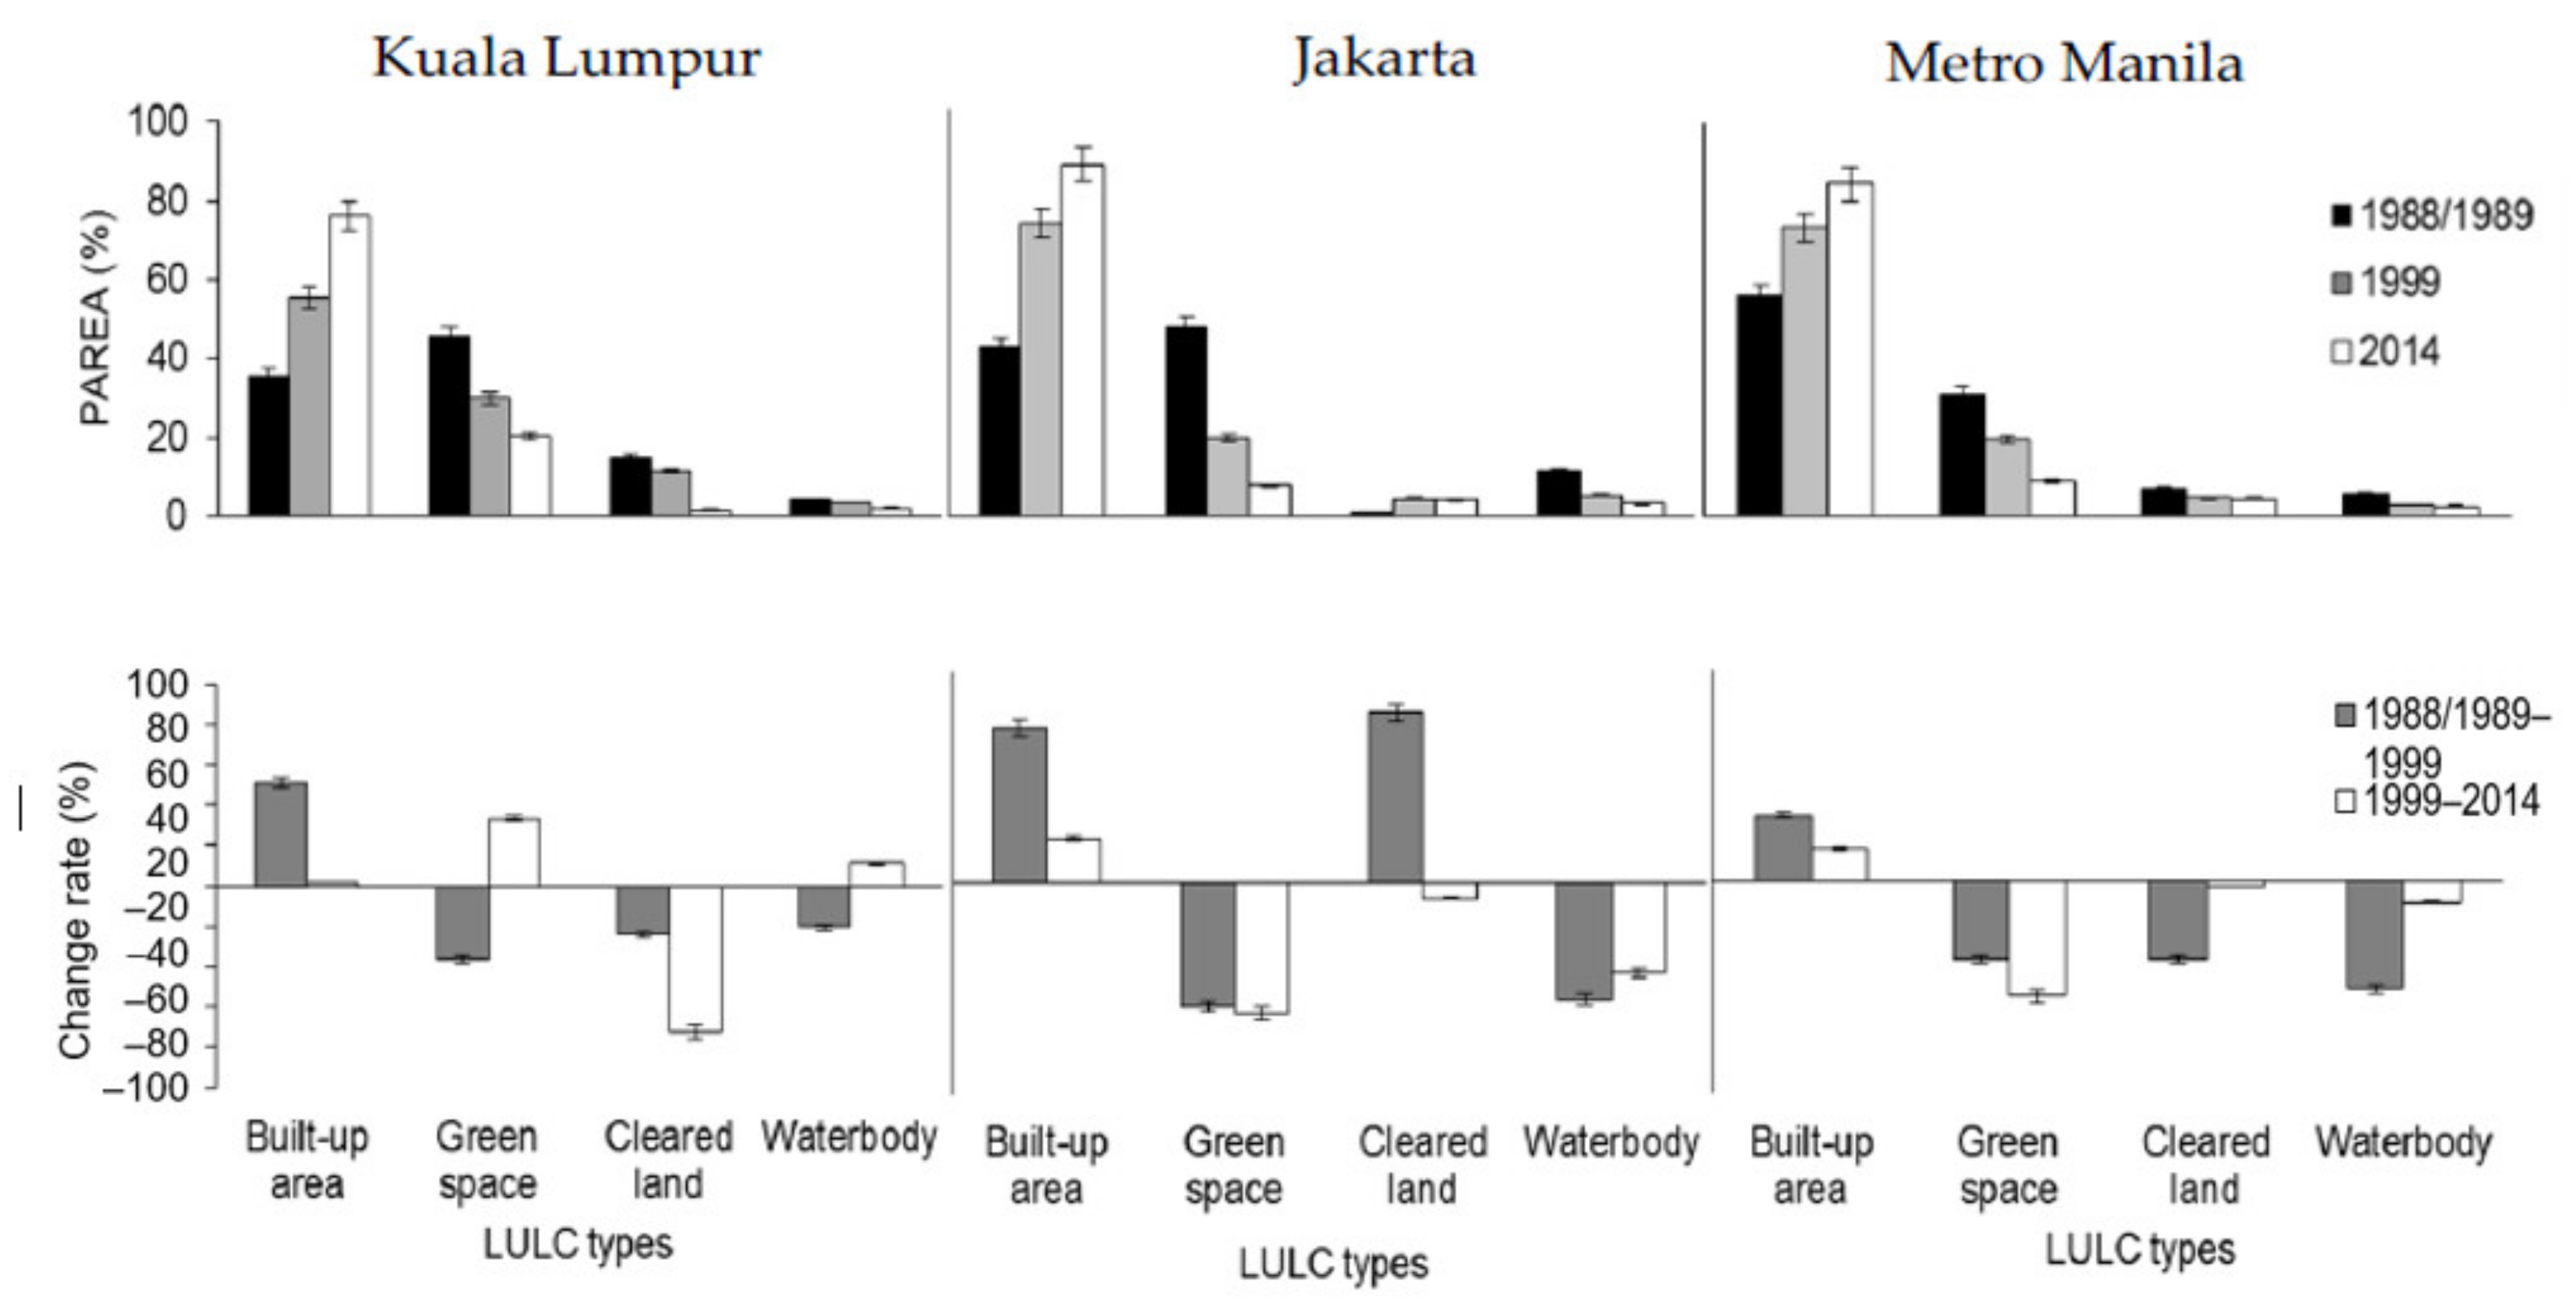
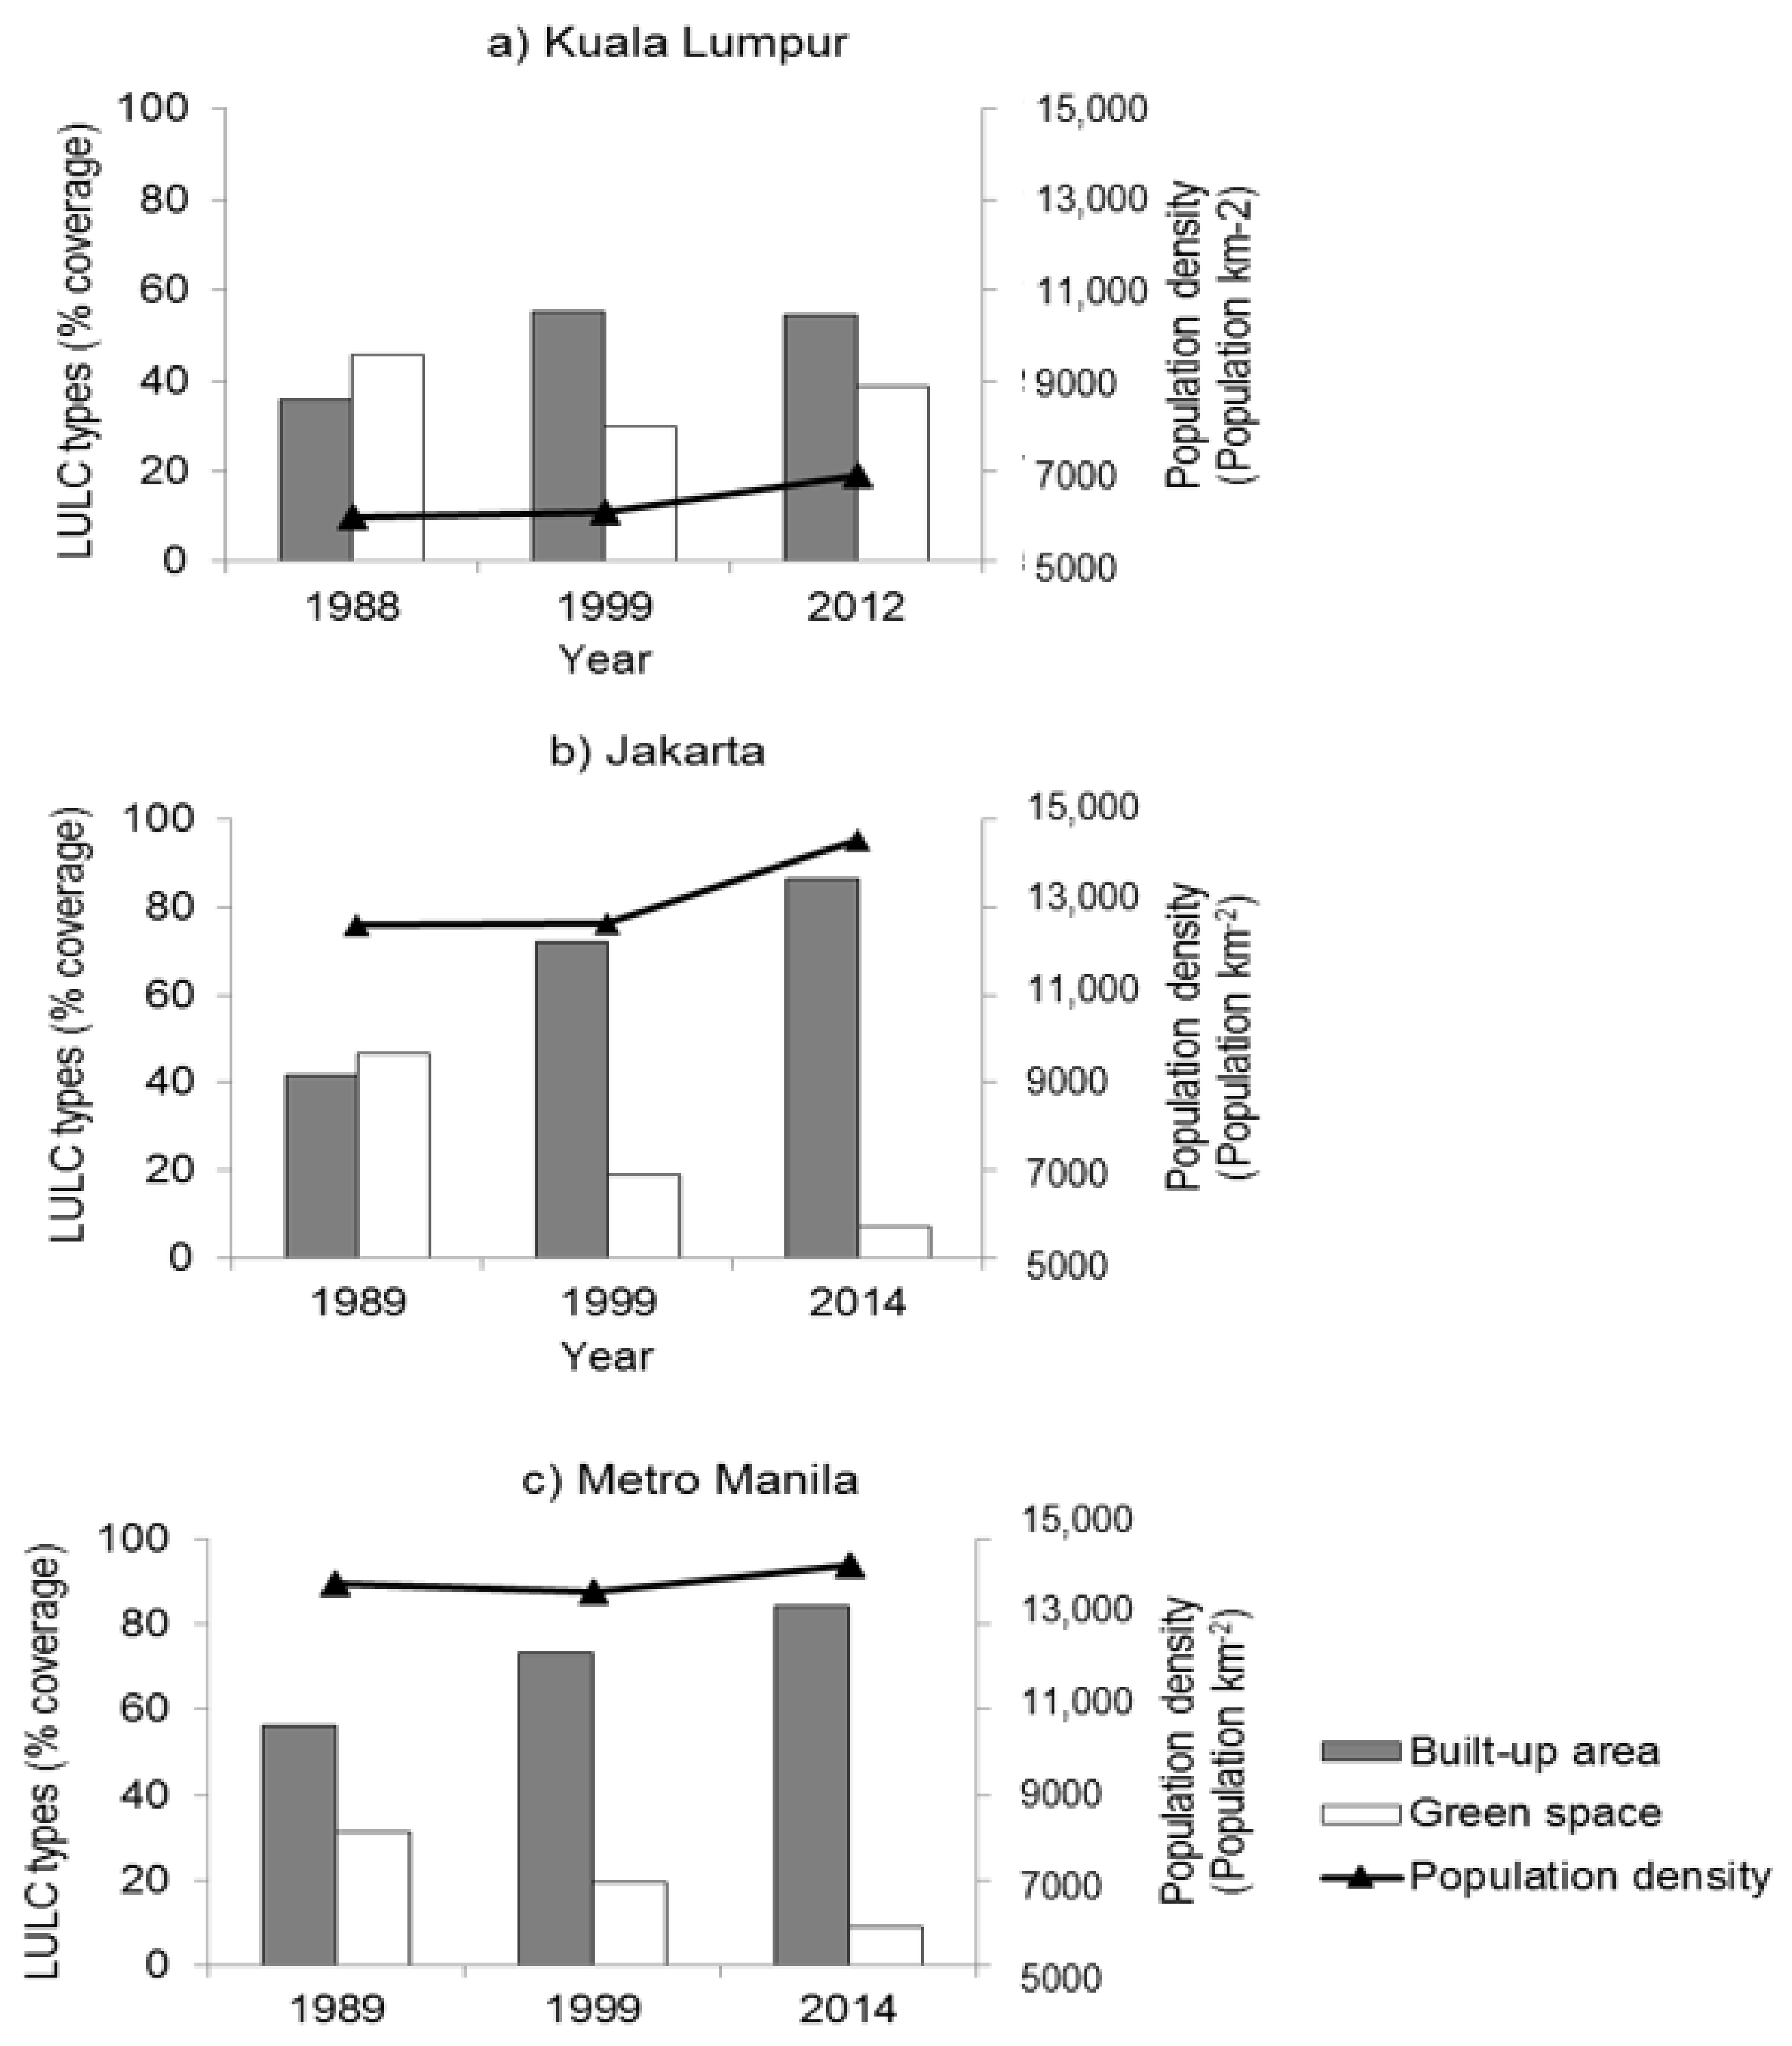
3.1. Landscape Change Analysis

In 1989, the highest percentage of built-up area was in Metro Manila (56%) followed by Jakarta (41%) and Kuala Lumpur (35%; Figure 3). Metro Manila had the smallest percentage of green space (31%), with similar values for Jakarta (46%) and Kuala Lumpur (45%). By 2014, the total urbanized area was almost double that of 1989, and the built-up area in Jakarta and Metro Manila (86% and 84%, respectively) exceeded Kuala Lumpur (76%). Green space in Jakarta and Metro Manila was <10%, and it was 20% for Kuala Lumpur.
The total urbanized area increased by 31 to 73% in the period from 1988 to 1999 in all three cities: a higher rate of expansion than the latter 1999 to 2014 period (15 to 41%; Figure 4 and Figure 5). Over the same period, the green space area was reduced by more than 30% in all three cities. The change rate of the green space in Kuala Lumpur was smaller than in Jakarta and Metro Manila. In Kuala Lumpur, the decrease in green space was greater in 1988 to 1999 (36%) compared to 1999 to 2014 (30%). In Metro Manila and Jakarta, green space decreased by 62% and 54%, respectively, between 1999 and 2014 (Figure 4 and Figure 5). From 1988 to 2014, the cleared land in Kuala Lumpur and Metro Manila decreased by 72% and 38%, respectively. However, in Jakarta, the cleared land increased by 70% between 1989 and 1999 and decreased by 7% from 1999 to 2014. Waterbodies in Kuala Lumpur, Jakarta and Metro Manila decreased by 31%, 42% and 59%, respectively between 1988 and 2014.
From 1988 to 1999, more than 10% of green space was converted to built-up areas in the three cities (Table 3, Appendix A). The highest conversion of green space to built-up areas was in Jakarta (25%) compared with Kuala Lumpur (17%) and Metro Manila (12%) (Table 3). Built-up areas converted to green space were the highest in Kuala Lumpur (4%), followed by Metro Manila (1.8%) and Jakarta (0.8%) (Table 3). Built-up areas showed great persistence (i.e., no conversion or changes to another LULC over time) of 26% to 53% and were only approached by green space, with a persistence of 15% to 22% in the cities (Table 3).
In the period from 1999 to 2014, the conversion of green space to built-up areas were smaller in Jakarta (12%) and Metro Manila (10%) when compared with Kuala Lumpur (19%) (Table 3). Despite this, the remaining green space in Kuala Lumpur was still highest (11%) compared to Jakarta (5.7%) and Metro Manila (6.6%). However, the conversion of built-up areas to green space showed a different transformation pattern in Kuala Lumpur as the percentage of this change is substantially larger (6%) when compared to Jakarta (0.7%) and Metro Manila (1.3%; Table 3). This conversion was the main contribution to the remaining green space in Kuala Lumpur.

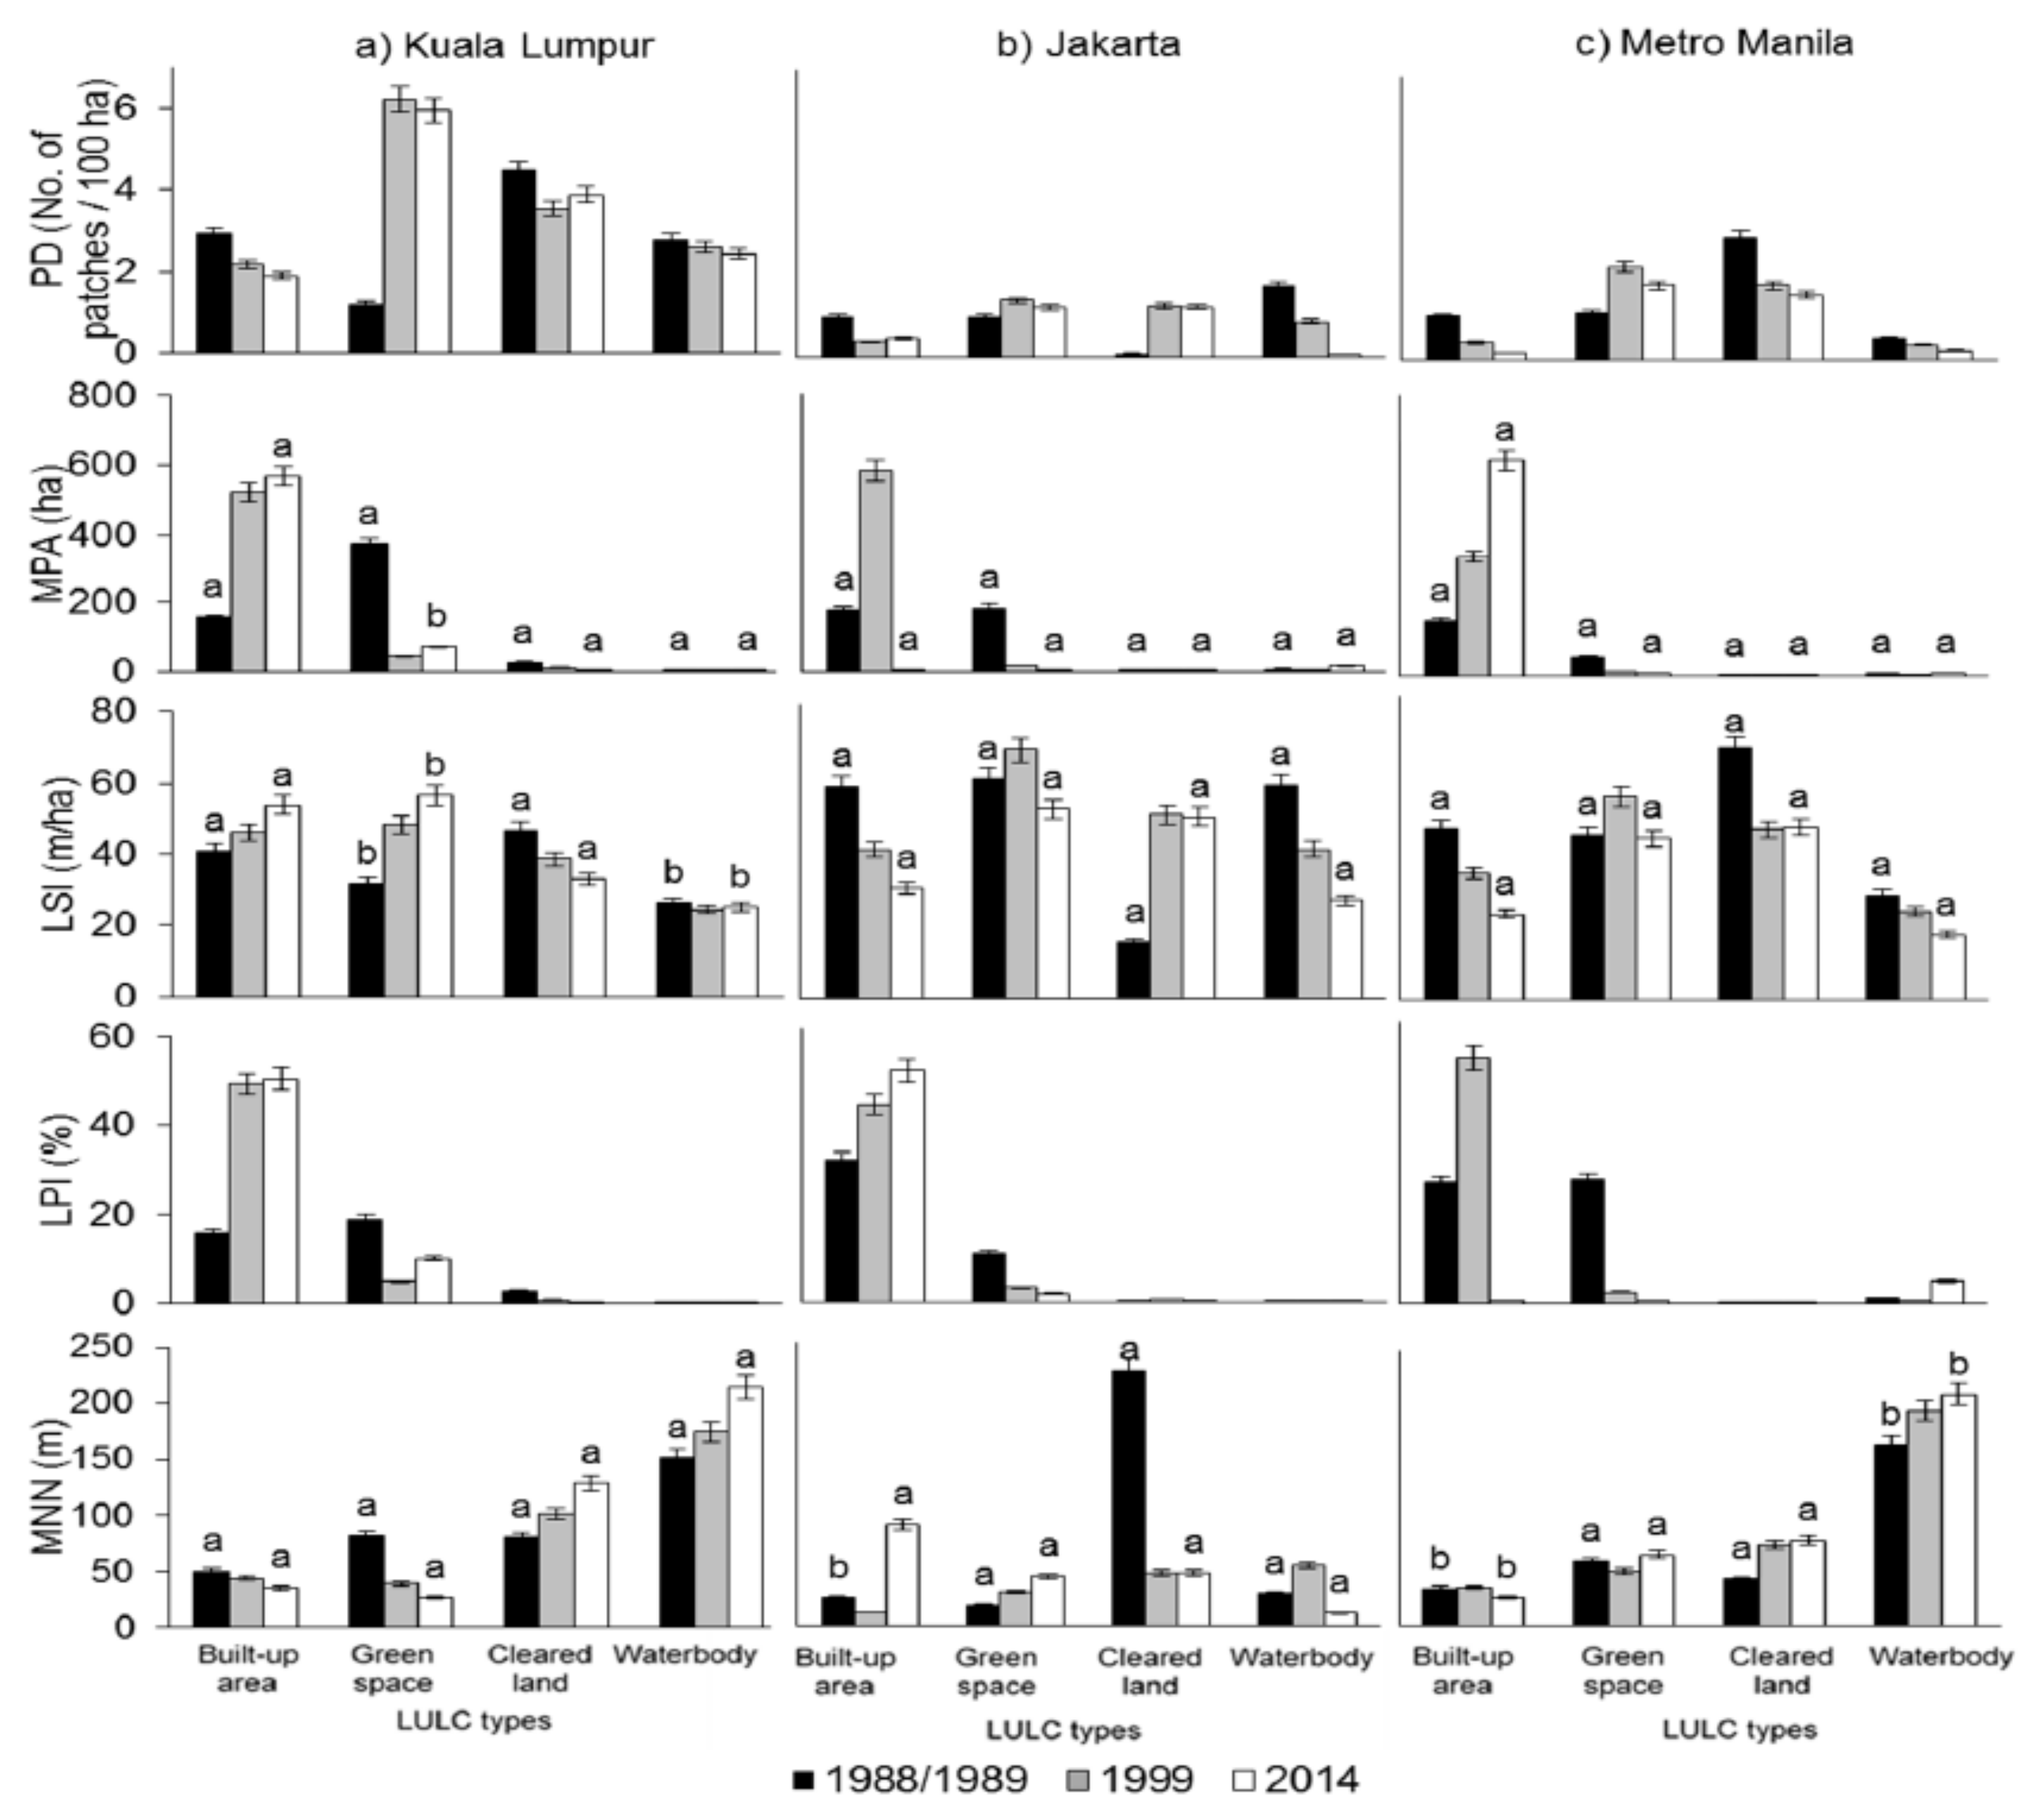
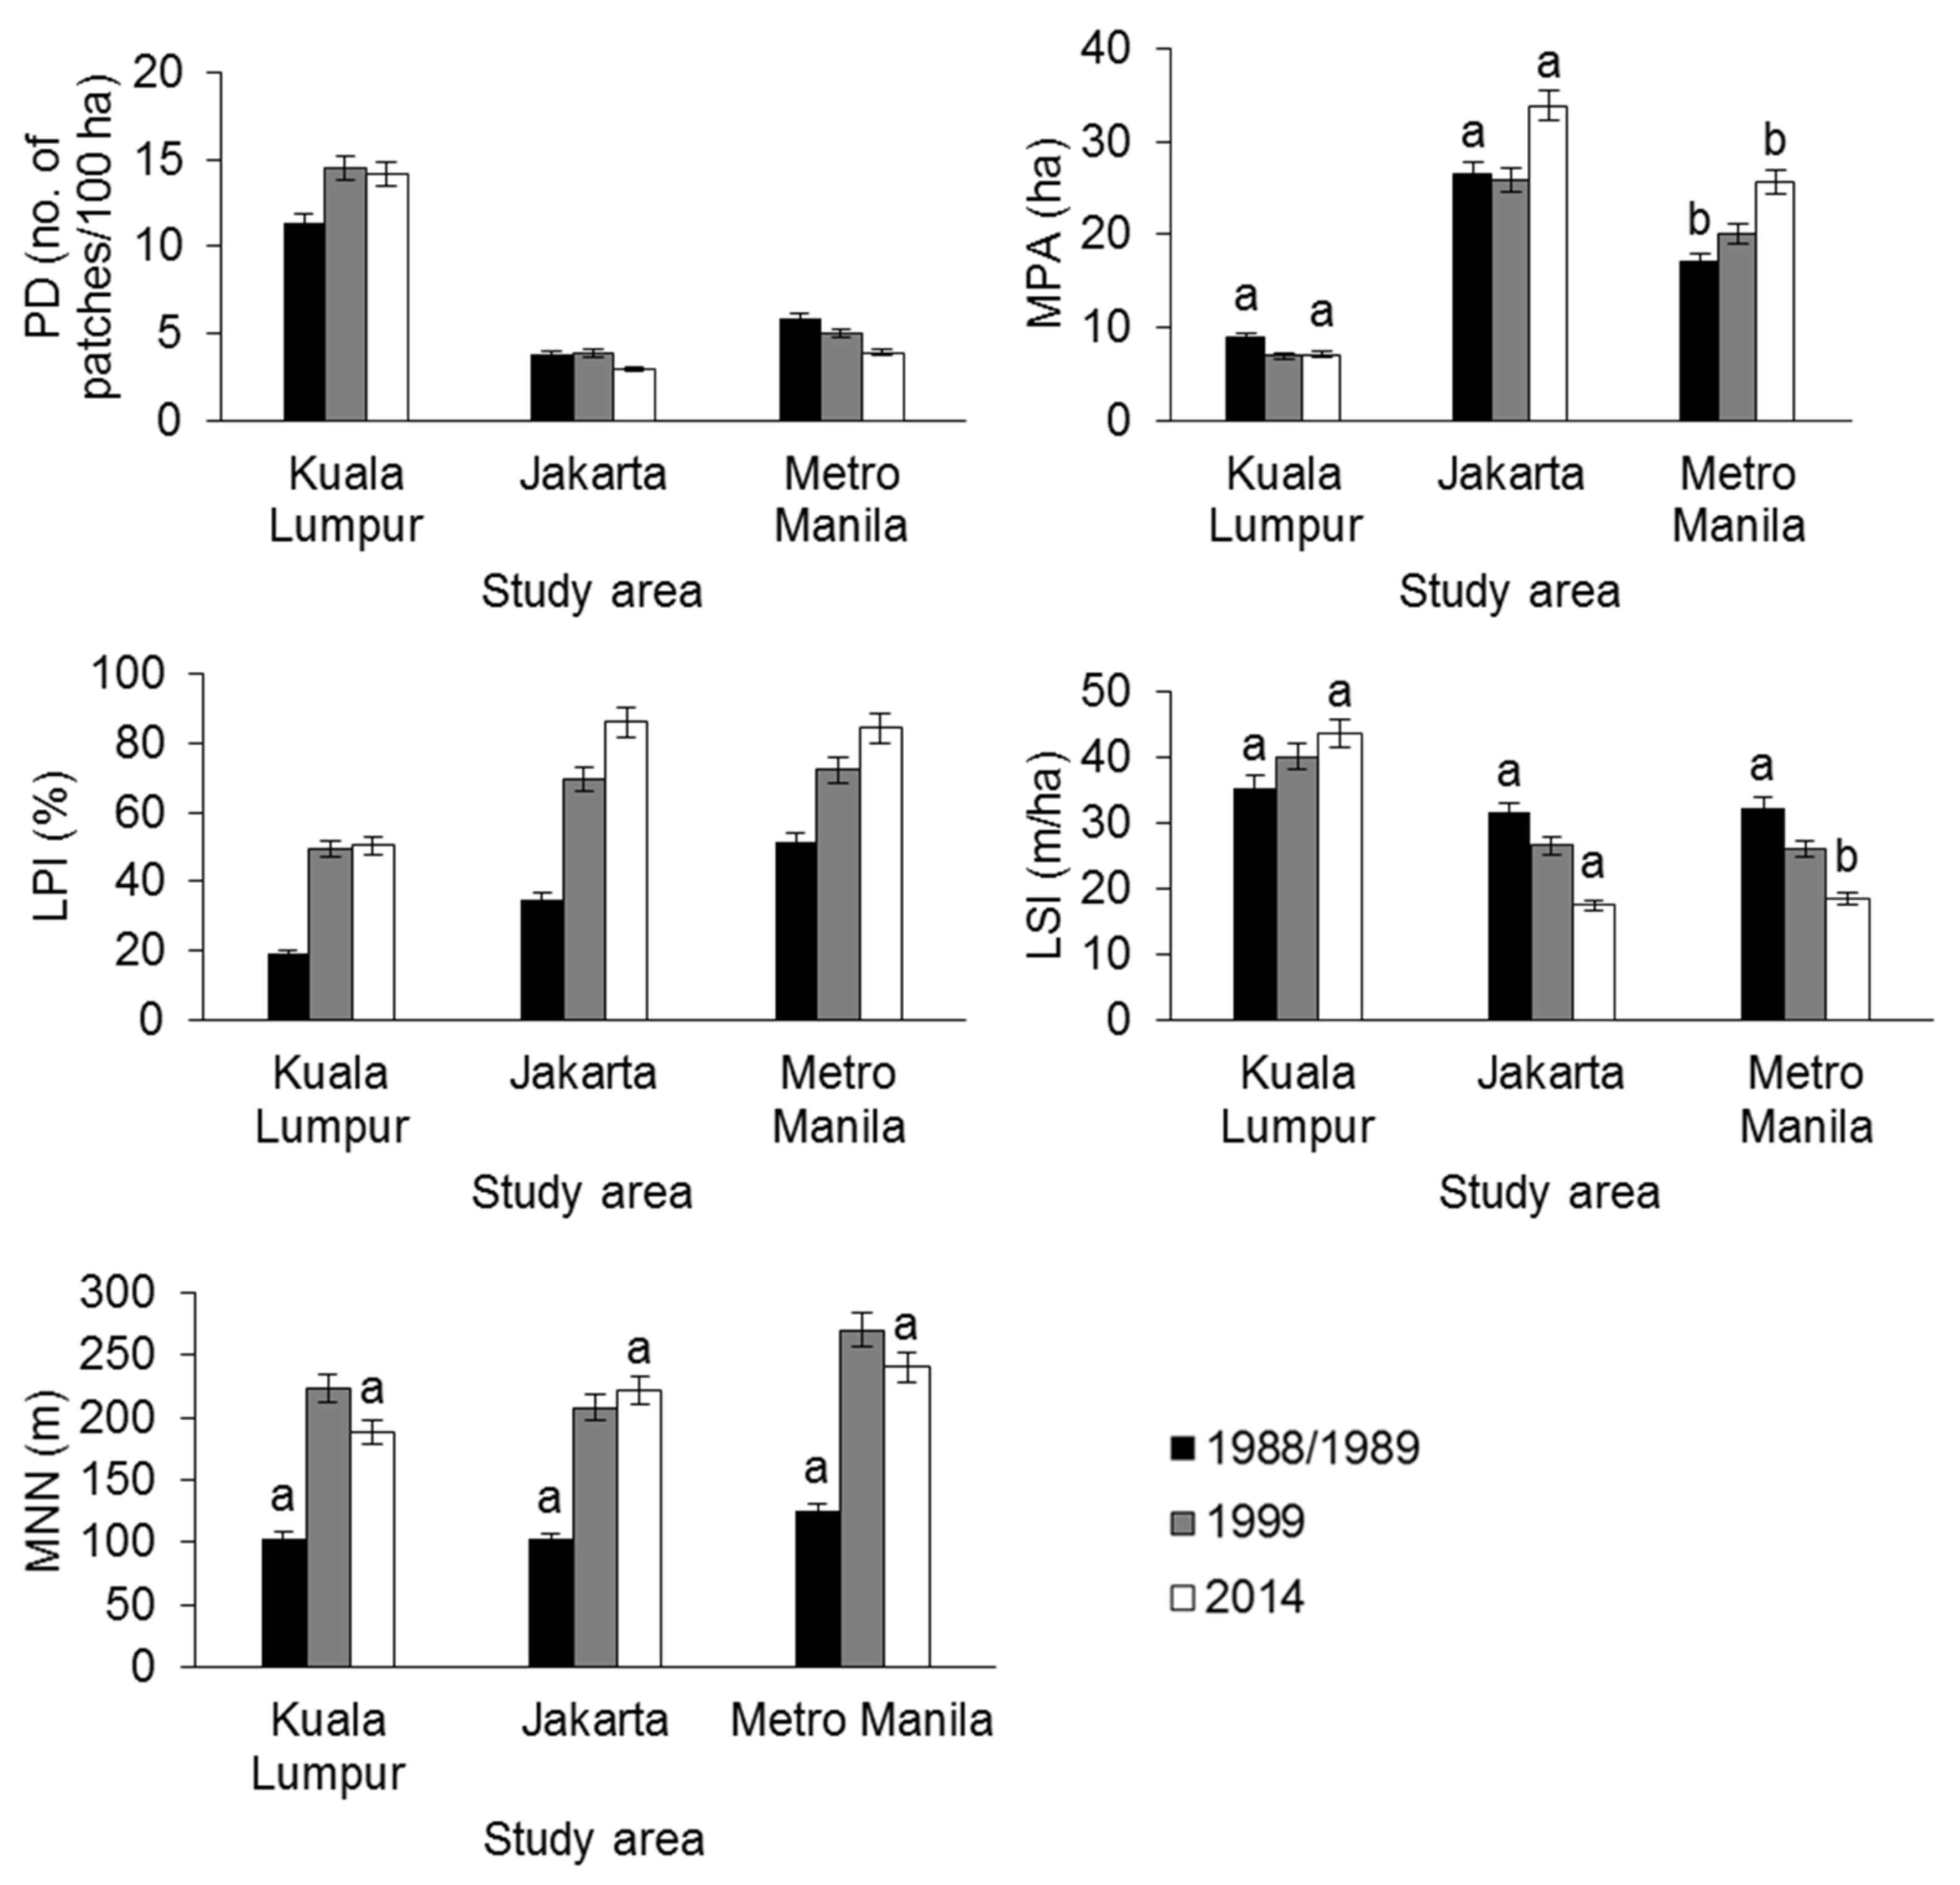
3.2. Landscape Structure Analysis

At the landscape level, the PD (p < 0.05) increased from 11 to 14 patches/100 ha and the MPA significantly (p < 0.05) decreased from 9 to 6 patches/100 ha in Kuala Lumpur between 1988 and 1999; however, between 1999 and 2014, the PD decreased (14 to 13 patches/100 ha) and the MPA increased (6 ha to 7 ha) significantly (p < 0.05; Figure 6). The pattern was similar in Jakarta: the PD increased (3 to 4 patches/100 ha) and the MPA decreased (26 ha to 25 ha) significantly (p < 0.05) between 1989 and 1999; however, between 1999 and 2014, the PD decreased (4 to 3 patches/100 ha) and the MPA increased (25 ha to 33 ha) significantly (p < 0.05; Figure 6). By contrast, the PD decreased and no significant changes (p > 0.05) in the MPA were observed in Metro Manila over the study period. The LPI increased over the study period in all three cities. Similar significant changes in the MNN were seen in Jakarta (102 m to 221 m), Kuala Lumpur (102 m to 223 m) and Metro Manila (124 m to 269 m) from 1988 to 1999. Conversely, values decreased significantly between 1999 and 2014 in Kuala Lumpur (223 m to 188 m) and Metro Manila (296 m to 240 m). The LSI decreased in Jakarta and Metro Manila but increased significantly (p < 0.05) in Kuala Lumpur over the study period (Figure 6).
At the class level, changes in green space structure were similar for Metro Manila and Jakarta and different for Kuala Lumpur. In all three cities, the PD increased (Kuala Lumpur, 1 to 6 patches/100 ha; Jakarta, 1 to 2 patches/100 ha; Metro Manila, 1 to 3 patches/100 ha) and the MPA decreased (Kuala Lumpur, 38 ha to 5 ha; Jakarta, 48 ha to 13 ha; Metro Manila, 26 ha to 8 ha) from 1988 to 1999, indicating that the green space was fragmented (Figure 7). The decline in the MPA has been significant in all three cities from 1988 to 1999. However, the PD decreases (6 to 5 patches/100 ha) and the MPA increases (5 to 6 ha) in Kuala Lumpur from 1999 to 2014 were not statistically significant (p > 0.05; Figure 6). The PD and MPA values decreased in Jakarta (1.3 to 1.2 patches/100 ha) (2 to 1 ha) and Metro Manila (13 to 5 patches/100 ha) (8 to 4 patches/100 ha) from 1999 to 2014, respectively, indicating the disappearance of green spaces. The LSI increased (p > 0.05) from 1988 to 2014 in Kuala Lumpur. Compared to Jakarta and Metro Manila, the LSI increased significantly (p < 0.05) from 1989 to 1999 and decreased from 1999 to 2014 (Figure 7). The patch size was smaller (LPI decreased) from 1988 to 1999 but slightly increased from 1999 to 2014 in Kuala Lumpur. However, in Jakarta and Metro Manila, the patch size also became smaller (LPI decreased) from 1989 to 2014. In Jakarta, the increase in the MNN (306 to 393 m) between 1989 and 2014 indicates that the green inter-patch distance increased. By contrast, the MNN decreased in Kuala Lumpur (81 to 39 m) and Metro Manila (161 to 135 m) (p < 0.05) from 1988/1989 to 1999 and increased from 39 m to 67 m and 135 m to 179 m from 1999 to 2014, respectively (Figure 7).
In Kuala Lumpur and Metro Manila, the built-up PD values decreased and the MPA values increased significantly (p < 0.05) from 1988/1989 to 2014, indicating a coalescence of built-up patches due to increases in built up area cover (Figure 7). In Jakarta, built-up areas were expanded more in the period 1989 to 1999 than 1999 to 2014. In all three cities, the increases in the LPI and MPA showed that built-up patches coalesced owing to gains made from adjacent green space areas. In Kuala Lumpur, the LSI increased significantly (p < 0.05) from 1988 to 2014 indicating greater variation among shapes at the edges of built-up areas. Compared to Jakarta and Metro Manila, the LSI decreased for the same period (Figure 7). In Kuala Lumpur, the distance between built-up patches to the nearest patch (MNN) decreased from 1988 to 2014. In Jakarta, the MNN decreased (p > 0.05) from 1989 to 1999 but increased from 1999 to 2014, in contrast to Metro Manila, where the MNN increased from 1989 to 1999 and then decreased from 1999 to 2014. Concurrently, the population in Jakarta and Metro Manila increased substantially along with the corresponding spatial urban extension trends (Figure 8). The results show that connections exist between population and urban expansion, due to the similarity in trends of population density and the spatial structure of built-up areas in Jakarta and Metro Manila.

4. Discussion

In the three cities of Metro Manila, Jakarta and Kuala Lumpur, the built-up areas expanded and encroached on green space, reducing green space by more than 30% over the 25-year period. Metro Manila saw the greatest reduction in green space over the study period, followed by Jakarta and Kuala Lumpur (Figure 5). This is comparable to other Asian countries: For example, the trends of urban green space between 1990 and 2010 in 30 major Chinese cities showed that 46.9% of original vegetation cover was converted to other land cover types [13]. Similar results occurred in Greater Dhaka, Bangladesh [36]; Sapporo, Japan [37]; Mumbai, India [38]; and Hong Kong [8], with green space losses ranging from 10% to 50%. The results from these studies suggest that economic growth, population increase, urbanization and weakness in planning, controlling and managing urban development are factors in green space loss [36]. While the exact definitions of ‘green space’ varied between studies, they are largely comparable in the above examples in referring to vegetated areas within the urban matrix [39]. There are also studies that defined urban built-up boundaries separately in different years (e.g., [40,41]). In this kind of study, some cities became greener in their built-up areas. [40] found that the availability of urban green spaces increased by 4.11% between 2005 and 2015 in 28 megacities. This pattern may reflect the fact that cities worldwide are increasingly, paying attention to create and preserve urban green spaces during development. Despite the importance of green space, urban growth and urban densification are contributing to the reduction and isolation of green space structure in our study areas. Although urban green spaces are considered important in Asian cities, there is a potential that green spaces may become encroached and therefore too small and isolated to maintain their environmental and social effectiveness [8,11].
Our research interprets various patterns of green space change and sequences of changes in rapidly expanding cities. These observations can lead to an increased understanding of green space dynamics and their relation to ecological processes. In all three cities, green spaces have fragmented, shrunk, complicated and dissected as indicated by the increased PD (due to the presence of many smaller patches) and LSI but the reduced MPA and LPI between patches in the period 1988 to 1999. The distance between green patches increased in Jakarta but decreased in Kuala Lumpur and Metro Manila. Small patches then disappeared in Jakarta and Metro Manila but not in Kuala Lumpur. The MNN increased and the PD declined in all three cities in the later period from 1999 to 2014. These results demonstrate the ecological processes of attrition (loss of habitat patch) and isolation [42] of green space in the cities.
Spatially, green space loss was not random and appeared to take place primarily on the urban fringes in Jakarta and Metro Manila (Figure 3). Sharifi et al., 2014 [3] found that migration of people from rural to urban areas increased the population density in the urban fringe and caused rapid development there. Based on visual observation (Figure 3) in Kuala Lumpur and Jakarta, the changes in the green space spatial patterns mostly occur at the west and south boundaries of the cities. According to Kuala Lumpur City Hall, 2005 [23], industrial and economic development took place in the west of Kuala Lumpur as it is a conurbation with the growing state of Selangor, and the new administration centre of Putrajaya was developed at the South of Kuala Lumpur. A new town development initiated by the early 1990s called Bukit Jonggol Asri (Beautiful Jonggol Hills) has reinforced spatial segregation in the south of Jakarta [43] and might influence spatial pattern changes. In Metro Manila, rapid land use conversions took place in the urban fringe particularly in the north, which started in the 1990s, because of the development of residential sub-division lots and agricultural lands [44] resulting in green space loss. The observed changes in the cities correspond to increasing population density, indicating a relationship between urban expansion, population density and green space change (Figure 8). The population increased more than 20% in Jakarta and Metro Manila from 1989 to 2014, which is the main driving force of the urbanization process [25]. Our observations would therefore suggest that both rapid urban development and increasing population density accounted for the process of green space change in the urban boundaries, similar to the results observed by Zhou and Wang, 2011 [17]. In these types of cities, urban planning therefore needs to pay particular attention to the urban fringe where the impact of increasing population density on land cover change may be the most drastic.
When comparing the three cities, different patterns of changes in the overall landscape structure were found at different scales, cities and years in response to rapid urban expansion, policies and population density. Fragmentation in Jakarta was evidenced by larger PD and smaller MPA values in 1988 than in 1999, suggesting rapid expansion during this period (Figure 6). This coincides with policies for the integrated metropolitan-level development initiated in the mid-1970s and early 1980s by the Local Preparation Bureau for Development in Jabodetabek Metropolitan Area, the Presidential Decree on Development of the Jabodetabek Area and the construction of new road infrastructure [45]. In 2008, new green open spaces policies were developed but with a stronger focus on natural areas than urban green space [46]. The Kuala Lumpur Structure Plan 1984 resulted in a similar transformation of the landscape structure: green space was highly fragmented between 1988 and 1999; however, between 1999 and 2014, the patches were aggregated, coinciding with an increase in population density from 1988 to 1999 and stabilized from 1999 to 2014. These trends in population change are theorized to have driven rapid urban expansion and development in the city during the earlier period (Figure 8). By contrast, lower fragmentation and increasing inter-patch distance in Metro Manila over the study period suggests that patches were aggregated or eliminated, and the population density was decreased in 1999 (Figure 8) due to the later establishment of development plans (Development Framework Plan for Metropolitan Manila (1996 to 2016). This would suggest that the different sizes, fragmentation degree, densities of landscape features and population density found in the three cities are related to the establishment of master planning and policies in the cities.
The changes in green space structure were observed differently in each city at the class level as well. Generally, green space structure has gradually fragmented, and become more unevenly distributed and recent conversions to green space from other LULC in Jakarta may result from planning regulations enacted in 2007. Spatial planning laws 26/2007 and 174/2007 relate to the planting and maintaining trees for 2010 to 2030 [47] and involve the development and maintenance of urban forests, interactive parks, agricultural areas and green belt areas [48]. Metro Manila also saw a slower conversion of green spaces to built-up areas in the recent period. There, planning policies starting in 1996, such as the Physical Development Framework Plan for Metropolitan Manila (1996 to 2016) and Metro Manila Green Print 2030, were established to provide a framework and recommendations for the use of land and other resources [49]. However, the continued green space decline, which almost doubled from 1999 to 2014 (Figure 5), suggests that the policies are currently inadequate; despite these planning efforts, urban expansion continues at the expense of green space [15]. In contrast, the Kuala Lumpur Structural Plan 1984 began earlier than the other cities and with a greater emphasis on providing green space [23]. As a result, some of the area and distribution of green space structure in this city has increased between 1999 and 2014 (Figure 7). In 2000, Kuala Lumpur City Hall launched a programme to plant trees along major roads and develop more parks and play areas to further increase the amount of green space (Figure 4) [23]. Nevertheless, built-up areas in Kuala Lumpur have expanded at greater rates than green space structure resulting in the dislocation and continued isolation of green space (Figure 7). According to Haq, 2011 [50], the municipalities in Kuala Lumpur tend to focus on the beautification of green spaces and landscaping that increase property values and financial returns for land developers and thereby attract foreign investments that have contributed to the rapid economic growth. However, a wider recognition of the environmental and social value of connected green space is needed by policy makers to maintain biodiversity and secure ecological and cultural benefits [51]. The correlations between the observed landscape trends and the policy history of each city suggest that differentiated policies should be formulated to guide the reasonable expansion of urban land. This study, therefore, has regional policy relevance and practical planning implications for the current management of green space structures in urban landscapes. Such research can help us better understand the driving mechanisms of urban land expansion in compact cities with high-density, mixed-use development within a restrictive geographical area [52,53], thus having important implications for the policy, urban planning and management of green spaces in Southeast Asia and similar countries. Examining this connection from a policy viewpoint may be beneficial for gaining a more complete understanding of the realised and detailed effects of planning regulations on the development of green space pattern in rapidly developing cities.
The dramatic changes in the three cities’ green space structures have profound consequences for the cities’ ecological and social functioning [24]). The increased size of built-up area affects the ecological function of individual patches of green space through its effects on edge and core habitat [54], producing a poor-quality landscape with irregular patches and an uneven distribution of green space in the cities. A significant increase in the LSIs of built-up area and green space was observed from 1988 to 2014, creating a more complicated landscape in Kuala Lumpur relative to Jakarta and Metro Manila (Figure 8). The landscape shape index is an important metric to characterize landscape change, being a standardized measure of the total edge, which increases without limit as patches become more disaggregated and is essentially a descriptor of connectivity and spatial heterogeneity in the landscape [29]. The complexity of shapes is a dimension for both ecological function and visual character [54]. For example, boundary shape influences ecological processes, and hence species composition and relative abundances [55] and also affects the spatial distribution of edge species and interior species [56]. Pattern complexity is a term that refers to the spatial interactions between patches and is critical for ecological activities including species movement across landscapes [42,54]. Previous research indicates that these changes are increasing the vulnerability of the cities to natural hazards such as flooding [32], the destruction of ecosystems and vital species [16], degraded ecosystem functioning and effects on the cities’ climate, as well as going to contribute to atmospheric pollution and demeaning the provision of ecosystem services (e.g., climate regulation and cooling effect) [30]. This would exacerbate the urban heat island effect, pose a significant public health risk and degrade the quality of environmental health and life of urban people [24,57,58].
Conversely, the increases in shape variation and patch size of green space in Kuala Lumpur may attract more people to use those spaces, as residents have been found to prefer large parks and attractive design [59]. Size is also critical to ensure the conservation effectiveness of ecosystems. It has a structural connectedness that can also reveal the functional connectivity between patches in order to maintain the sustainability of long-term conservation. Proponents of maintaining and adding small size green spaces to the urban landscape help to maintain the connectivity of isolated green space [60,61,62]. Green spaces with complicated shapes could bring people closer to nature, improve their physical and mental health and provide diverse visual and amenity resources [34]. Several previous studies conducted in Asia indicated that factors such as the size, distance and shape of structures, their diversity and variation and their location in the green network all contribute to their perception and use, resulting in improved physical and cognitive performance, as well as improved well-being for city dwellers [11,24,34]. [63] found that the lower land value districts had more vegetation coverage with a higher vegetation density, mainly due to a large quantity of unmanaged greenery. It is worth noting that small green spaces may provide less extensive opportunities for recreation so contribute less health benefits than large-size green spaces [40]. However, the increase in distance between green space patches in all three cities from 1999 to 2014 implies that green space patches are becoming isolated. If these trends continue, Metro Manila and Jakarta may both be at risk of losing green space function through decreased accessibility to green space for amenity, leisure and recreation as demonstrated by [8] in Hong Kong. It is important to provide residents with more access to green space near their homes and localized patterns of use in municipal and neighbourhood parks [64] for leisure and recreation [65]. Thus, it is clear that the size, connectedness, structure, form and shape of green space patches are fundamental components of the urban green network and important indicators to characterize the need for green space. This study illustrates the usefulness of spatial structure and pattern metrics of city development for green space planning and design to the use and value placed on green space, especially for Southeast Asian people and other related developing countries.
Strategies for future studies should focus on optimizing the configuration of green space structure (shape, density and connectivity) in ways which increase their amount and improve their spatial distribution for conservation and rehabilitation of ecological functions and networks in urban areas. An appropriate green space may help to reduce the urban heat island and urban warming. A recent study identified that population density, infrastructure and urban structure were important factors in reducing urban warming in tropical cities and were more important than total population size [66]. Additionally, the impacts of planning policies on urban green space development patterns could be valuable to explore from a dedicated policy perspective as discussed above. Planning policies may have had mixed influences on the development of green space structure and understanding their dynamics at regional or city-wide scales in the different time periods is important to the improvement of policies to plan, monitor and manage green space. A more developed understanding of linkages between policy drivers and landscape change could potentially enable the use of these metrics as an early warning system for the degradation of urban ecosystems.

5. Conclusions

This study sought to (i) quantify changes in the spatial distribution of urban green space in three Southeast Asian cities over the past two decades, (ii) evaluate the impact of changes to green space structure, and (iii) explore the impact of urban expansion, population density and management policy on changes to green space structure. This work has shown how landscape metrics that have been widely applied in landscape ecology but hitherto not widely applied to urban areas in Southeast Asia have a significant capability to quantify urban green space dynamics and assess its spatial and temporal dynamics. This new information could be potentially used to assess current policies and inform new policies for the development and maintenance of green space structure and its network in urban areas. This could contribute to maintaining or improving current ecological functions and networks for the provision of ecosystem services in rapidly developing cities such as the ones in our study. This work has shown that built-up areas expanded and encroached on green space in all three cities studied here, reducing green space by more than 30% over the past 25 years. These changes have affected the green space structure differently in each city. Jakarta and Metro Manila exhibited the highest percent coverage of built-up areas and a greater impact of urbanization on green space structure than Kuala Lumpur, with green space structure gradually fragmenting to become less connected and more unevenly distributed. Relationships between urban development and spatial structure in Southeast Asian cities are believed to be heavily driven by management and policy. Additional drivers of change such as population density and socioeconomic factors should be emphasized in future studies to solidify our understanding of the driving relationships between society, policy, and landscape change. Similar studies in other cities, regions and cultural realms would also be valuable for exploring the diversity of urban landscape dynamics and relationships around the world and informing sustainable policy and planning.
An understanding of historical green space changes and the policy contexts surrounding them can inform future policy and thus serve as early warning systems for ecological degradation in urban areas. Temporal patterns of change, in turn provide empirical support for urban design for human and ecological well-being. However, it is clear from our results that, in the absence of sustainable planning and without adequate regulatory control, green spaces have been encroached upon by urban development and sprawl, have decreased in size and have become increasingly fragmented. Southeast Asia’s urban green areas require more attention, especially near the urban boundaries, and are critically important for improving ecosystem function and residential quality of life within the urban landscape.

Author Contributions

Conceptualization, methodology, software, validation, formal analysis, investigation, resources, data curation, A.N.M.N., H.A.A., S.A.N., R.M.J., M.A.A., A.H.Y., N.I. and N.H.R.; writing—original draft preparation, A.N.M.N.; writing—review and editing, A.N.M.N. and K.A.H.; visualization, supervision, R.C., J.H., D.G. and H.L.P.-B.; project administration, A.N.M.N.; funding acquisition, A.N.M.N. All authors have read and agreed to the published version of the manuscript.

Funding

This research was funded by UMK Matching Grant (R/MTCH/A1300/00692A/003/2021/00947), UMK Rising Star 2021 (R/STA/A0800/00793A/004/2021/00939), Skim Geran Penyelidikan UMK COVID-19 Special Grant (UMK-C19SG) (R/C19/A0800/00793a/003-/2020/00779), Fragments, Functions and Flows in Urban Ecosystem Services (F3UES) project as part of the larger Biodiversity and Ecosystem Service Sustainability (BESS) framework (NE/J015067/1). BESS is a six-year programme (2011–2017) funded by the UK Natural Environment Research Council (NERC) and the Biotechnology and Biological Sciences Research Council (BBSRC) as part of the UK’s Living with Environmental Change (LWEC) programme.

Institutional Review Board Statement

Not applicable.

Informed Consent Statement

Not applicable.

Data Availability Statement

Not applicable.

Acknowledgments

We would like to thank Universiti Malaysia Kelantan (UMK), Biodiversity and Ecosystem Service Sustainability (BESS), the UK Natural Environment Research Council (NERC) and the Biotechnology and Biological Sciences Research Council (BBSRC) for providing support in terms of funds and the views expressed are those of the authors and not necessarily those of the BESS Directorate or NERC. Finally, constructive suggestions from six anonymous referees are gratefully acknowledged, as they helped us to substantially improve this manuscript.

Conflicts of Interest

The authors declare no conflict of interest.

Appendix A

Conversion of land use land cover types from 1988/1989 to 1999 and from 1999 to 2014 in (a) Kuala Lumpur, (b) Jakarta (c) Metro Manila (Bolded values indicate no change).
Table A1. (a) Kuala Lumpur.
1988 1999 (%)
Green SpaceBuilt-Up AreaCleared Land WaterbodyTotal
Green space22.117.15.41.045.6
Built-up area4.026.83.80.635.6
Cleared land 4.28.61.70.314.8
Waterbody1.11.20.41.34
Total 31.453.711.23.2100.00
1999 2014 (%)
Green SpaceBuilt-Up AreaCleared LandWaterbodyTotal
Green space11.719.10.70.531.9
Built-up area6.146.50.60.653.8
Cleared land 1.79.10.30.211.2
Waterbody0.91.50.00.83.2
Total 20.276.11.62.04100.00
Table A2. (b) Jakarta.
1989 1999 (%)
Green SpaceBuilt-Up AreaCleared Land WaterbodyTotal
Green space16.525.12.82.346.6
Built-up area0.9400.50.341.6
Cleared land 0.10.60.00.00.8
Waterbody1.76.40.62.311.0
Total 19.172.013.94.9100.00
1999 2014 (%)
Green SpaceBuilt-Up AreaCleared Land WaterbodyTotal
Green space5.711.91.10.419.1
Built-up area0.769.81.30.472.0
Cleared land 0.32.41.10.13.9
Waterbody0.62.30.124.9
Total 7.286.43.62.8100.00
Table A3. (c) Metro Manila.
1989 1999 (%)
Green SpaceBuilt-Up AreaCleared Land WaterbodyTotal
Green space15.412.92.60.231.1
Built-up area1.852.71.40.156.0
Cleared land 1.55.10.40.17.1
Waterbody0.82.60.12.35.7
Total 19.673.24.52.7100.00
1999 2014 (%)
Green SpaceBuilt-Up AreaCleared Land WaterbodyTotal
Green space6.610.02.80.119.5
Built-up area1.370.41.10.473.2
Cleared land 0.13.90.50.04.5
Waterbody0.50.40.11.82.8
Total 8.4984.734.372.40100.00

References

  1. Angel, S.; Parent, J.; Civco, D.L.; Blei, A.; Potere, D. The dimensions of global urban expansion: Estimates and projections for all countries, 2000–2050. Prog. Plan. 2011, 75, 53–107. [Google Scholar] [CrossRef]
  2. United Nations Population Fund [UNFPA]. State of World Population 2007. Unleashing the Potential of Urban Growth. POPLINE Document Number: 313671; UNFPA: New York, NY, USA, 2007. [Google Scholar]
  3. Sharifi, A.; Chiba, Y.; Okamoto, K.; Yokoyama, S.; Murayama, A. Can master planning control and regulate urban growth in Vientiane, Laos? Landsc. Urban Plan. 2014, 131, 1–13. [Google Scholar] [CrossRef]
  4. United Nations Department of Economic and Social Affairs [UNDESA]. World Urbanization Prospects: The 2011 Revision; United Nations Department of Economic and Social Affairs/Population Division: New York, NY, USA, 2012. [Google Scholar]
  5. Carrus, G.; Scopelliti, M.; Lafortezza, R.; Colangelo, G.; Ferrini, F.; Salbitano, F.; Agrimi, M.; Portoghesi, L.; Semenzato, P.; Sanesi, G. Go greener, feel better? The positive effects of biodiversity on the well-being of individuals visiting urban and peri-urban green areas. Landsc. Urban Plan. 2015, 134, 221–228. [Google Scholar] [CrossRef]
  6. Ward, C.D.; Parker, C.M.; Shackleton, C. The use and appreciation of botanical gardens as urban green spaces in South Africa. Urban For. Urban Green. 2010, 9, 49–55. [Google Scholar] [CrossRef] [Green Version]
  7. Xu, X.; Duan, X.; Sun, H.; Sun, Q. Green Space Changes and Planning in the Capital Region of China. Environ. Manag. 2011, 47, 456–467. [Google Scholar] [CrossRef]
  8. Tian, Y.; Jim, C.; Tao, Y.; Shi, T. Landscape ecological assessment of green space fragmentation in Hong Kong. Urban For. Urban Green. 2011, 10, 79–86. [Google Scholar] [CrossRef]
  9. Seburanga, J.; Kaplin, B.; Zhang, Q.-X.; Gatesire, T. Amenity trees and green space structure in urban settlements of Kigali, Rwanda. Urban For. Urban Green. 2014, 13, 84–93. [Google Scholar] [CrossRef]
  10. Li, F.; Ye, Y.; Song, B.; Wang, R.; Tao, Y. Assessing the changes in land use and ecosystem services in Changzhou municipality, Peoples’ Republic of China, 1991–2006. Ecol. Indic. 2014, 42, 95–103. [Google Scholar] [CrossRef]
  11. Lo, A.Y.; Jim, C. Citizen attitude and expectation towards greenspace provision in compact urban milieu. Land Use Policy 2011, 29, 577–586. [Google Scholar] [CrossRef] [Green Version]
  12. Li, Z.; Zhong, J.; Sun, Z.; Yang, W. Spatial Pattern of Carbon Sequestration and Urban Sustainability: Analysis of Land-Use and Carbon Emission in Guang’an, China. Sustainability 2017, 9, 1951. [Google Scholar] [CrossRef] [Green Version]
  13. Yang, J.; Huang, C.; Zhang, Z.; Wang, L. The temporal trend of urban green coverage in major Chinese cities between 1990 and 2010. Urban For. Urban Green. 2013, 13, 19–27. [Google Scholar] [CrossRef]
  14. Yang, J.; Li, S.; Lu, H. Quantitative Influence of Land-Use Changes and Urban Expansion Intensity on Landscape Pattern in Qingdao, China: Implications for Urban Sustainability. Sustainability 2019, 11, 6174. [Google Scholar] [CrossRef] [Green Version]
  15. Estoque, R.C.; Murayama, Y. Intensity and spatial pattern of urban land changes in the megacities of Southeast Asia. Land Use Policy 2015, 48, 213–222. [Google Scholar] [CrossRef]
  16. Sodhi, N.S.; Posa, M.R.C.; Lee, T.M.; Bickford, D.; Koh, L.P.; Brook, B. The state and conservation of Southeast Asian biodiversity. Biodivers. Conserv. 2009, 19, 317–328. [Google Scholar] [CrossRef]
  17. Zhou, X.; Wang, Y.-C. Spatial–temporal dynamics of urban green space in response to rapid urbanization and greening policies. Landsc. Urban Plan. 2011, 100, 268–277. [Google Scholar] [CrossRef]
  18. Chen, W.Y.; Hu, F.Z.Y. Producing nature for public: Land-based urbanization and provision of public green space in China. Appl. Geogr. 2015, 58, 32–40. [Google Scholar] [CrossRef]
  19. Marcotullio, P.J.; Grant, J. (Eds.) Towards Sustainable Cities, East Asian, North American and European Perspectives on Managing Urban Regions, Aldershot; Ashgate Publishing Limited: Farnham, UK; pp. 38–58.
  20. Kowarik, I. Novel urban ecosystems, biodiversity, and conservation. Environ. Pollut. 2011, 159, 1974–1983. [Google Scholar] [CrossRef]
  21. Msofe, N.; Sheng, L.; Lyimo, J. Land Use Change Trends and Their Driving Forces in the Kilombero Valley Floodplain, Southeastern Tanzania. Sustainability 2019, 11, 505. [Google Scholar] [CrossRef] [Green Version]
  22. Dahiya, B. Cities in Asia, 2012: Demographics, economics, poverty, environment and governance. Cities 2012, 29, S44–S61. [Google Scholar] [CrossRef]
  23. Kuala Lumpur City Hall. Kuala Lumpur Structural Plan 2020; Kuala Lumpur Press: Kuala Lumpur, Malaysia, 2005. [Google Scholar]
  24. Nor, A.N.M.; Corstanje, R.; Harris, J.; Brewer, T. Impact of rapid urban expansion on green space structure. Ecol. Indic. 2017, 81, 274–284. [Google Scholar] [CrossRef]
  25. Murakami, A.; Zain, A.M.; Takeuchi, K.; Tsunekawa, A.; Yokota, S. Trends in urbanization and patterns of land use in the Asian mega cities Jakarta, Bangkok, and Metro Manila. Landsc. Urban Plan. 2005, 70, 251–259. [Google Scholar] [CrossRef]
  26. Jensen, J.R.; Lulla, K. Introductory digital image processing: A remote sensing perspective. Geocarto Int. 1987, 2, 65. [Google Scholar] [CrossRef]
  27. Tewolde, M.G.; Cabral, P. Urban Sprawl Analysis and Modeling in Asmara, Eritrea. Remote. Sens. 2011, 3, 2148–2165. [Google Scholar] [CrossRef] [Green Version]
  28. Rozenstein, O.; Karnieli, A. Comparison of methods for land-use classification incorporating remote sensing and GIS inputs. Appl. Geogr. 2011, 31, 533–544. [Google Scholar] [CrossRef]
  29. McGarigal, K.; Cushman, S.A.; Neel, M.C.; Ene, E. FRAGSTATS: Spatial Pattern Analysis Program for Categorical Maps. Computer Software Program Produced by the Authors at the University of Massachusetts, Amherst. 2002. Available online: http://www.umass.edu/landeco/research/fragstats/fragstats.html (accessed on 28 December 2016).
  30. Su, S.; Xiao, R.; Jiang, Z.; Zhang, Y. Characterizing landscape pattern and ecosystem service value changes for urbanization impacts at an eco-regional scale. Appl. Geogr. 2012, 34, 295–305. [Google Scholar] [CrossRef]
  31. Abdullah, S.A.; Nakagoshi, N. Changes in landscape spatial pattern in the highly developing state of Selangor, peninsular Malaysia. Landsc. Urban Plan. 2006, 77, 263–275. [Google Scholar] [CrossRef]
  32. Perotto-Baldivieso, H.; Wu, X.B.; Peterson, M.; Smeins, F.E.; Silvy, N.J.; Schwertner, T.W. Flooding-induced landscape changes along dendritic stream networks and implications for wildlife habitat. Landsc. Urban Plan. 2011, 99, 115–122. [Google Scholar] [CrossRef]
  33. Perotto-Baldivieso, H.L.; Meléndez-Ackerman, E.; García, M.A.; Leimgruber, P.; Cooper, S.M.; Martínez, A.; Calle, P.; Gonzáles, O.M.R.; Quiñones, M.; Christen, C.A.; et al. Spatial distribution, connectivity, and the influence of scale: Habitat availability for the endangered Mona Island rock iguana. Biodivers. Conserv. 2008, 18, 905–917. [Google Scholar] [CrossRef]
  34. Tian, Y.; Jim, C.; Wang, H. Assessing the landscape and ecological quality of urban green spaces in a compact city. Landsc. Urban Plan. 2014, 121, 97–108. [Google Scholar] [CrossRef]
  35. McGarigal, K. FRAGSTATS Help; University of Massachusetts: Amherst, MA, USA, 2015; p. 182. [Google Scholar]
  36. Byomkesh, T.; Nakagoshi, N.; Dewan, A. Urbanization and green space dynamics in Greater Dhaka, Bangladesh. Landsc. Ecol. Eng. 2011, 8, 45–58. [Google Scholar] [CrossRef]
  37. Rupprecht, C.; Byrne, J.; Lo, A. Memories of vacant lots: How and why residents used informal urban green space as children and teenagers in Brisbane, Australia, and Sapporo, Japan. Child. Geogr. 2015, 14, 340–355. [Google Scholar] [CrossRef] [Green Version]
  38. Moghadam, H.S.; Helbich, M. Spatiotemporal urbanization processes in the megacity of Mumbai, India: A Markov chains-cellular automata urban growth model. Appl. Geogr. 2013, 40, 140–149. [Google Scholar] [CrossRef]
  39. M’Ikiugu, M.M.; Kinoshita, I.; Tashiro, Y. Urban Green Space Analysis and Identification of its Potential Expansion Areas. Procedia Soc. Behav. Sci. 2012, 35, 449–458. [Google Scholar] [CrossRef] [Green Version]
  40. Huang, C.; Yang, J.; Lu, H.; Huang, H.; Yu, L. Green Spaces as an Indicator of Urban Health: Evaluating Its Changes in 28 Mega-Cities. Remote. Sens. 2017, 9, 1266. [Google Scholar] [CrossRef] [Green Version]
  41. Zheng, Q.; Yang, X.; Wang, K.; Huang, L.; Shahtahmassebi, A.R.; Gan, M.; Weston, M.V. Delimiting Urban Growth Boundary through Combining Land Suitability Evaluation and Cellular Automata. Sustainability 2017, 9, 2213. [Google Scholar] [CrossRef] [Green Version]
  42. Dytham, C.; Forman, R.T.T. Land Mosaics: The Ecology of Landscapes and Regions. J. Ecol. 1996, 84, 787. [Google Scholar] [CrossRef]
  43. Firman, T. 15. The dynamics of Jabodetabek development: The challenge of urban governance. In Regional Dynamics in a Decentralized Indonesia; ISEAS Publishing: Singapore, 2014. [Google Scholar]
  44. Malaque, I.I.R.; Yokohari, M. Urbanization process and the changing agricultural landscape pattern in the urban fringe of Metro Manila, Philippines. Environ. Urban. 2007, 19, 191–206. [Google Scholar] [CrossRef]
  45. Hudalah, D.; Firman, T. Beyond property: Industrial estates and post-suburban transformation in Jakarta Metropolitan Region. Cities 2012, 29, 40–48. [Google Scholar] [CrossRef]
  46. Pribadi, D.O.; Pauleit, S. The dynamics of peri-urban agriculture during rapid urbanization of Jabodetabek Metropolitan Area. Land Use Policy 2015, 48, 13–24. [Google Scholar] [CrossRef]
  47. Rukmana, D. The Change and Transformation of Indonesian Spatial Planning after Suharto’s New Order Regime: The Case of the Jakarta Metropolitan Area. Int. Plan. Stud. 2015, 20, 350–370. [Google Scholar] [CrossRef]
  48. Mutiara, S.; Isami, K. Characteristic of Public Small Park Usage in Asia Pacific Countries: Case Study in Jakarta and Yokohama City. Procedia Soc. Behav. Sci. 2012, 35, 412–419. [Google Scholar] [CrossRef] [Green Version]
  49. MMDA. Accomplishment Report; Metropolitan Manila Development Authority: Metro Manila, Philippines, 2012. [Google Scholar]
  50. Haq, S.M.A. Urban Green Spaces and an Integrative Approach to Sustainable Environment. J. Environ. Prot. 2011, 2, 601–608. [Google Scholar] [CrossRef] [Green Version]
  51. De la Barrera, F.; Rubio, P.; Banzhaf, E. The value of vegetation cover for ecosystem services in the suburban context. Urban For. Urban Green. 2016, 16, 110–122. [Google Scholar] [CrossRef]
  52. Kotharkar, R.; Bahadure, P.; Sarda, N. Measuring Compact Urban Form: A Case of Nagpur City, India. Sustainability 2014, 6, 4246–4272. [Google Scholar] [CrossRef] [Green Version]
  53. Yi, Y.; Ma, S.; Guan, W.; Li, K. An Empirical Study on the Relationship between Urban Spatial Form and CO2 in Chinese Cities. Sustainability 2017, 9, 672. [Google Scholar] [CrossRef] [Green Version]
  54. Fry, G.; Tveit, M.; Ode, Å.; Velarde, M. The ecology of visual landscapes: Exploring the conceptual common ground of visual and ecological landscape indicators. Ecol. Indic. 2009, 9, 933–947. [Google Scholar] [CrossRef]
  55. Turner, M.G.; Gardner, R.H.; O’Neill, R.V. Landscape Ecology in Theory and Practice: Pattern and Process; Springer: New York, NY, USA, 2001. [Google Scholar]
  56. Forman, R.T.T.; Godron, M. Landscape Ecology; Wiley: New York, NY, USA, 1986. [Google Scholar]
  57. Lee, A.C.K.; Maheswaran, R. The health benefits of urban green spaces: A review of the evidence. J. Public Health 2010, 33, 212–222. [Google Scholar] [CrossRef]
  58. Mukerjee, M.; Shaw, R. (Eds.) Ecosystem-Based Disaster and Climate Risk Resilience, Integration of Blue-Green Infrastructure in Sustainable Development; Springer: Berlin/Heidelberg, Germany, 2021. [Google Scholar]
  59. Peters, K.; Elands, B.; Buijs, A. Social interactions in urban parks: Stimulating social cohesion? Urban For. Urban Green. 2010, 9, 93–100. [Google Scholar] [CrossRef] [Green Version]
  60. Lee, W.H.; Abdullah, S.A. Framework to develop a consolidated index model to evaluate the conservation effectiveness of protect. Ecol. Indic. 2019, 102, 131–144. [Google Scholar] [CrossRef]
  61. Lepczyk, C.A.; Aronson, M.F.J.; Evans, K.L.; Goddard, M.; Lerman, S.B.; MacIvor, J.S. Biodiversity in the City: Fundamental Questions for Understanding the Ecology of Urban Green Spaces for Biodiversity Conservation. BioScience 2017, 67, 799–807. [Google Scholar] [CrossRef] [Green Version]
  62. Kityuttachai, K.; Tripathi, N.K.; Tipdecho, T.; Shrestha, R. CA-Markov Analysis of Constrained Coastal Urban Growth Modeling: Hua Hin Seaside City, Thailand. Sustainability 2013, 5, 1480–1500. [Google Scholar] [CrossRef] [Green Version]
  63. Hwang, Y.H.; Nasution, I.K.; Amonkar, D.; Hahs, A. Urban Green Space Distribution Related to Land Values in Fast-Growing Megacities, Mumbai and Jakarta–Unexploited Opportunities to Increase Access to Greenery for the Poor. Sustainability 2020, 12, 4982. [Google Scholar] [CrossRef]
  64. Wendel, H.E.W.; Zarger, R.K.; Mihelcic, J.R. Accessibility and usability: Green space preferences, perceptions, and barriers in a rapidly urbanizing city in Latin America. Landsc. Urban Plan. 2012, 107, 272–282. [Google Scholar] [CrossRef]
  65. Sreetheran, M.; van den Bosch, C.C.K. A socio-ecological exploration of fear of crime in urban green spaces—A systematic review. Urban For. Urban Green. 2014, 13, 1–18. [Google Scholar] [CrossRef]
  66. Marcotullio, P.J.; Keßler, C.; Gonzalez, R.Q.; Schmeltz, M. Urban Growth and Heat in Tropical Climates. Front. Ecol. Evol. 2021, 9, 616626. [Google Scholar] [CrossRef]
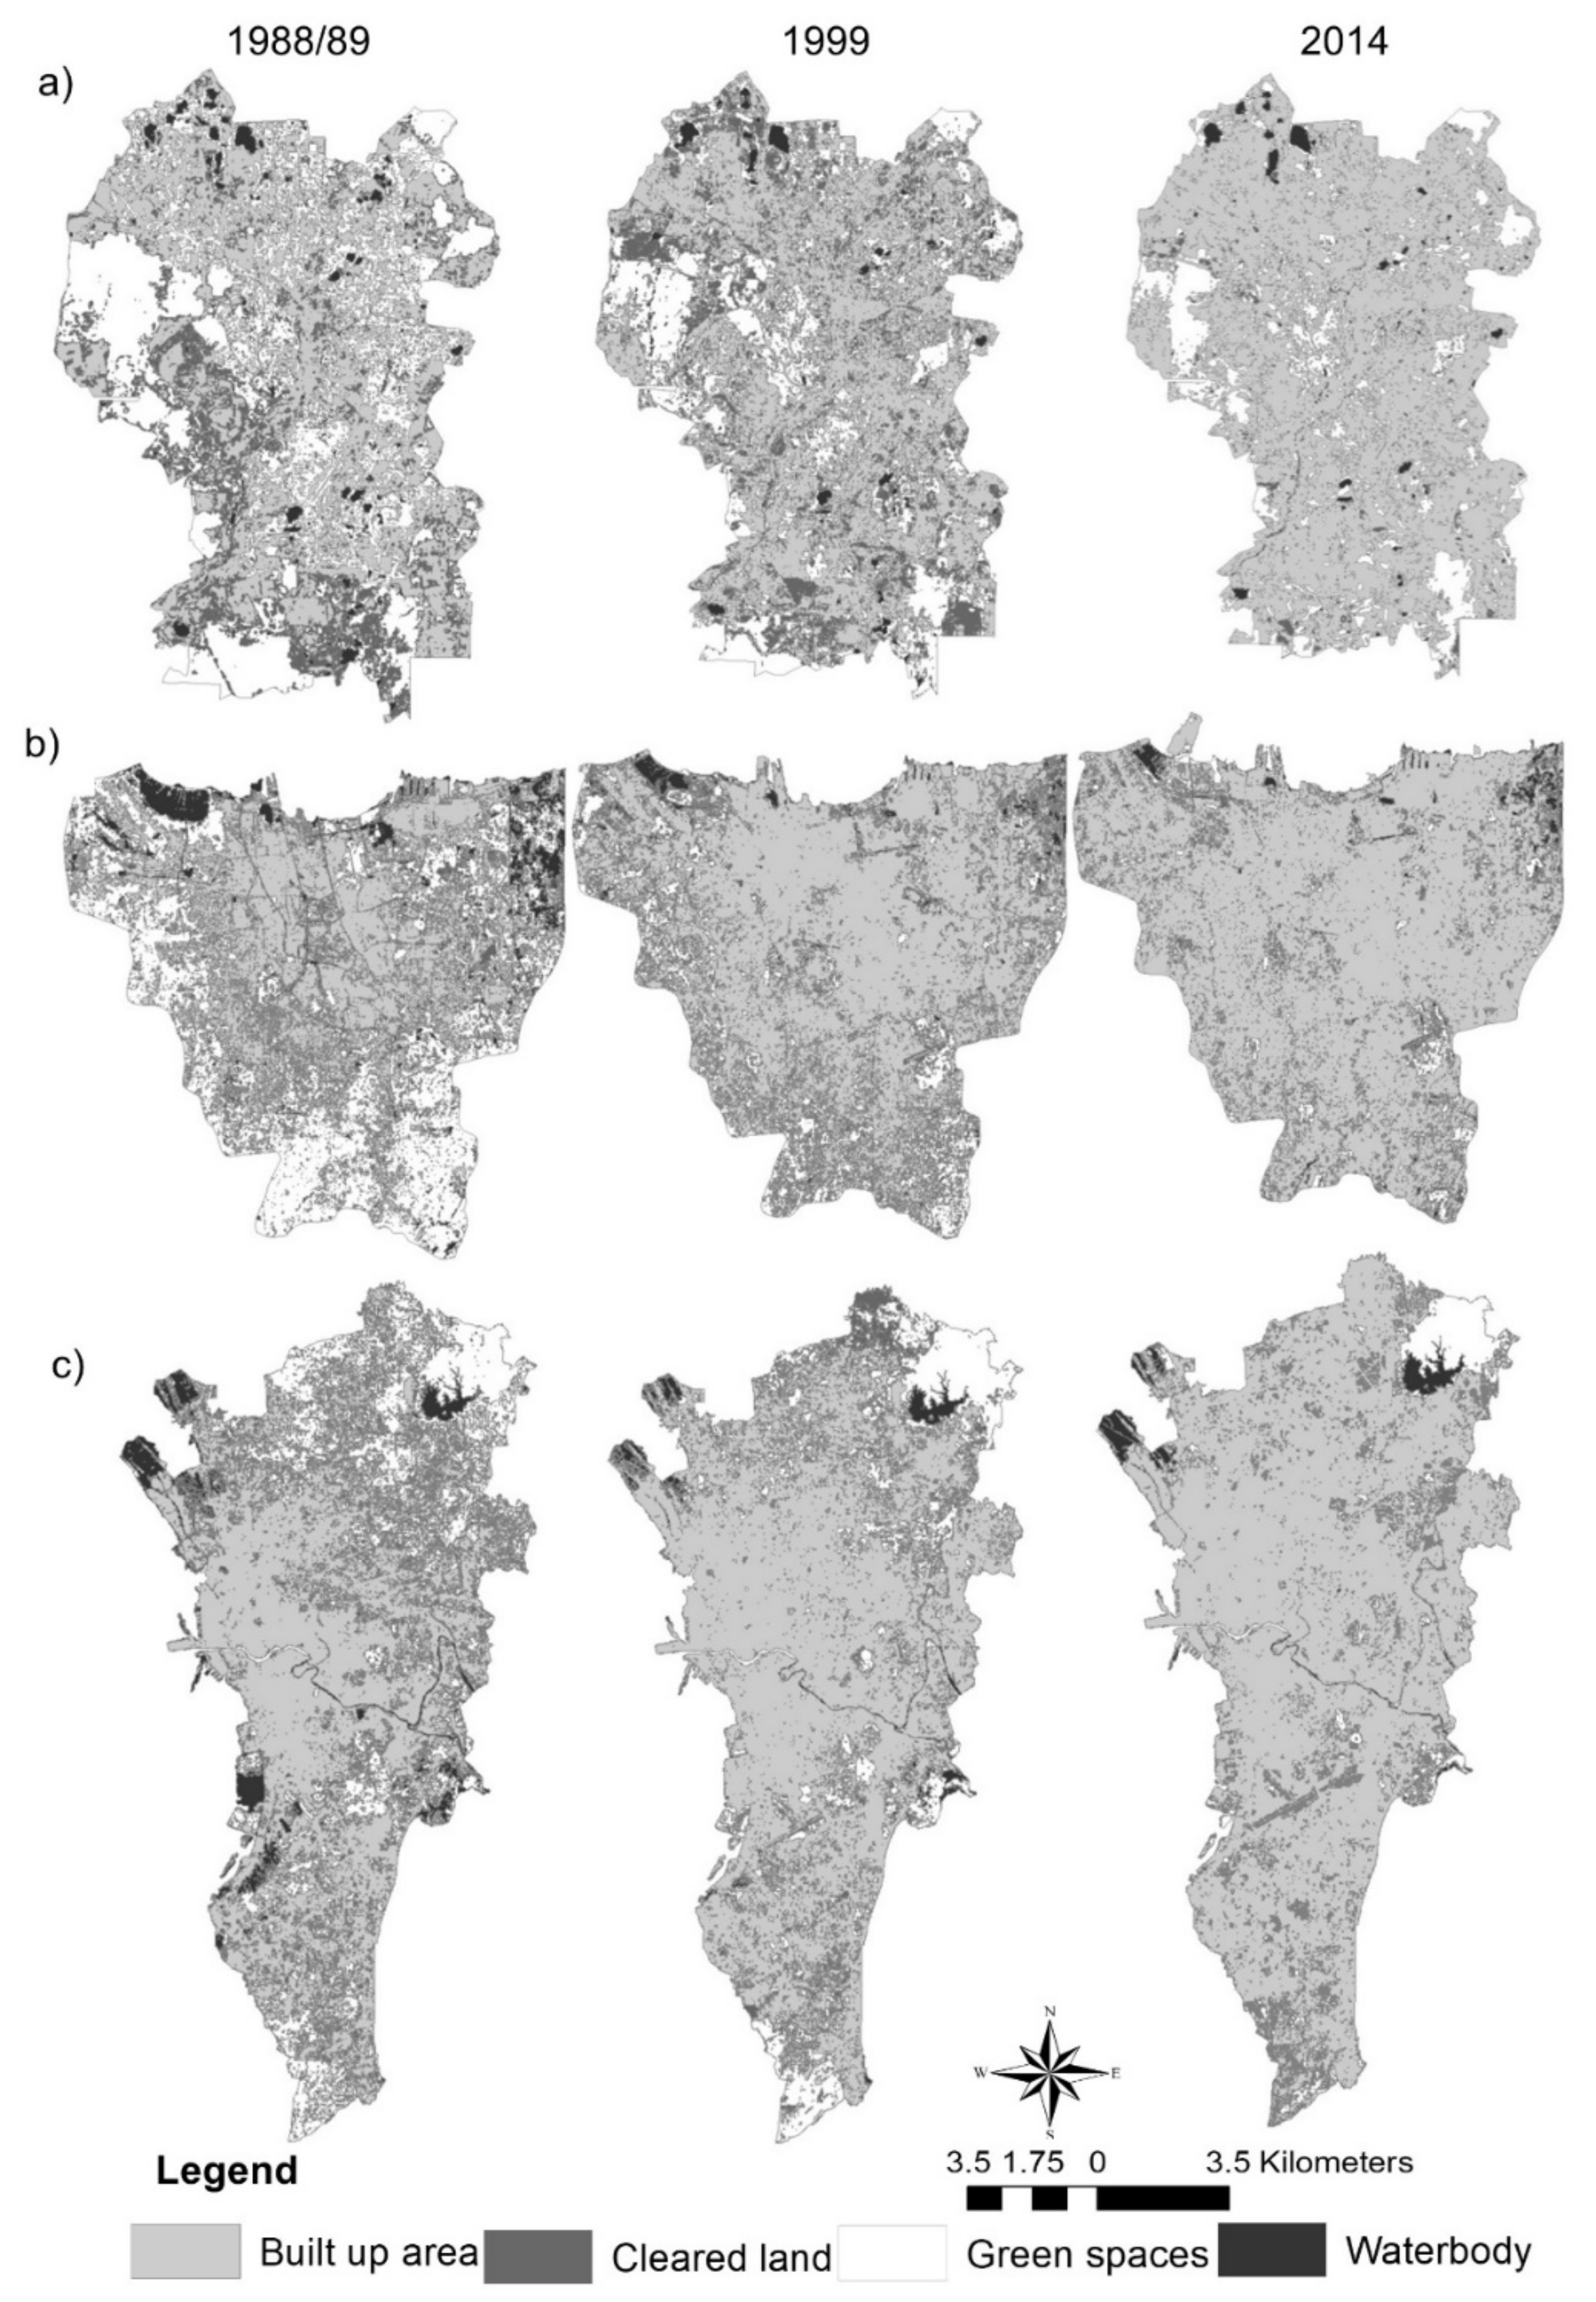
Figure 1. Location map of three cities in Southeast Asia.
Sustainability 13 12024 g001
Figure 2. Area frame sampling with systematic sampling (sample grid is the area sampling frame of 1 km × 1 km; sample training point is the point used for training signatures in supervised classification).
Sustainability 13 12024 g002
Figure 3. Land use land cover maps in three-year periods in (a) Kuala Lumpur, (b) Jakarta and (c) Metro Manila.
Sustainability 13 12024 g003
Figure 4. Detailed map of changes in green space patches in (a) 1988/1989, (b) 1999 and (c) 2014 in Kuala Lumpur, Jakarta and Metro Manila.
Sustainability 13 12024 g004
Figure 5. Percentage of area and change rate of land use land cover types (using formula C and D in landscape change analysis) in three cities in 1988/1989, 1999 and 2014.
Sustainability 13 12024 g005
Figure 6. Comparison of metrics at landscape level for each city (letters (a, b) indicate statistical differences with a significance level of 0.05 for MPA, LSI and MNN; the letter a above bars indicates the significant changes p < 0.05; the letters b above bars indicates no significant changes (p > 0.05) between patches in the period from 1988 to 1999 and 1999 to 2014). Patch density (PD); Mean patch area (MPA); Landscape shape index (LSI); Largest patch index (LPI); Euclidean nearest neighbour (MNN).
Sustainability 13 12024 g006
Figure 7. Comparison of metrics at class level for each city (letters (a, b) indicate statistical differences with a significance level of 0.05 for MPA, LSI and MNN; the letters a above bars indicate the significant changes p < 0.05; the letters b above bars indicate no significant changes (p > 0.05) between patches in landscape structure in the period from 1988 to 1999 and 1999 to 2014 [Patch density (PD); Mean patch area (MPA); Landscape shape index (LSI); Largest patch index (LPI); Euclidean nearest neighbour (MNN)].
Sustainability 13 12024 g007
Figure 8. Correlation between built-up area, population density and green space in three periods in (a) Kuala Lumpur, (b) Jakarta (c) Metro Manila.
Sustainability 13 12024 g008
Table 1. Land use/land cover classification scheme (Modified from Nor et al., 2017 [24,28].
CodeLand Use/Land
Cover Categories
Description
1.Built-up areaAreas with all types of artificial and impervious surfaces, including residential, commercial and industrial areas, as well as transportation infrastructure
2.Green spaceAll green area covered with forest trees, shrubs, grassland and cropland
3.Water bodyRiver, drain, reservoirs, lakes and ponds
4.Cleared landLand with bare soil, bare exposed rock, quarries and disturbed ground at building sites and dirt roads (cleared but not developed or colonized by vegetation)
Table 2. Landscape metrics used for landscape structure analysis (Modified from [29,35]).
MetricsAbbreviationDescription of Metric Level (Units)
Landscape-Level Metrics
(The Landscape as a Whole)
Class-Level Metrics (Each Patch Type (Class) in the Landscape)Patch-Level Metrics
(Individual Patch in the Given Class, Where Applicable)
Percentage of areaPAREA (%)n/aThe percentage
of each patch type in the landscape. Proportional abundance of class types in the landscape
n/a
Patch densityPDNumber of patches per 100 haNumber of patches per 100 ha in that class n/a
Mean patch areaMPA (ha)The area occupied by a particular patch type divided by the number of patches of that type. A function of the number of patches in the total areaA function of the number of patches in the class and total class areaA function of the difference in patch sizes among patches
Largest patch index LPI (%)Area (m2) of the largest patch of that type divided by total landscape area (m2), multiplied by 100 An indication of the dominance of the different land cover classesn/a
Landscape shape indexLSI (m/ha)SHAPE equals patch perimeter (m) divided by the minimum perimeter of the corresponding patch area in a landscape. A measure of the overall geometric complexity of the landscapeA measure of the overall geometric complexity of the landscape of a focal class. Can also be interpreted as a measure of landscape disaggregation—the greater the value of LSI, the more dispersed the patch typesLSI is one patch and any patch edges (or class edges) measured by the perimeter
Euclidean Nearest-Neighbour DistanceMNN(m)Distance (m) from a patch to nearest neighbouring patch in a landscape The distance between a patch and its nearest neighbour of the same class, based on the distance between cell centres of the two closest cells from the respective patchesMNN deals explicitly with the degree to which patches are spatially isolated from each other. The context of a patch is defined by the proximity and area of neighbouring habitat patches; variation in nearest-neighbour distance among patches
Table 3. Comparison of change detection in three cities.
Landscape ChangesKuala LumpurJakartaMetro Manila
1988–1999
Green space to built-up area17%25%12%
Built-up area to green space4%0.8%1.8%
Green space persistence22%16%15%
1999–2014
Green space to built-up area19%12%10%
Built-up area to green space6.0%0.7%1.3%
Green space persistence11%5.7%6.6%
Publisher’s Note: MDPI stays neutral with regard to jurisdictional claims in published maps and institutional affiliations.

