Article

Single Application of Biochar Increases Fertilizer Efficiency, C Sequestration, and pH over the Long-Term in Sandy Soils of Senegal

by
Aliou Faye
1,2,*,
Zachary P. Stewart
2,3,4,
Khady Diome
1,
Calys-Tagoe Edward
5,
Dioumacor Fall
6,
Désiré Komla Kyky Ganyo
7,
Tobi Moriaque Akplo
1,2 and
P. V. Vara Prasad
2,3
1
Regional Centre of Excellence on Dry Cereals and Associated Crop (CERAAS), Senegalese Agricultural Research Institute (ISRA), Thiès BP 3320, Senegal
2
Feed the Future Innovation Lab for Collaborative Research on Sustainable Intensification, Kansas State University, Manhattan, KS 66506, USA
3
Department of Agronomy, Kanas State University, Manhattan, KS 66506, USA
4
Center for Agriculture-Led Growth, Bureau for Resilience and Food Security, United States Agency for International Development, 1300 Pennsylvania Ave NW, Washington, DC 20004, USA
5
Academy Post Office, CSIR-Soil Research Institute, Kwadaso, Kumasi AK000-AK911, Ghana
6
Centre National de Recherches Agronomiques (CNRA), Senegalese Agricultural Research Institute (ISRA), Bambey BP 0053, Senegal
7
Direction des Laboratoire (ITRA/DL), Institut Togolais de Recherche Agronomique, Lomé BP 1163, Togo
*
Author to whom correspondence should be addressed.
Sustainability 2021, 13(21), 11817; https://doi.org/10.3390/su132111817
Submission received: 12 September 2021 / Revised: 14 October 2021 / Accepted: 23 October 2021 / Published: 26 October 2021
(This article belongs to the Special Issue Biochar Stability and Long-Term Carbon Storage)

Abstract

:
This study evaluated the long-term effects of a single application of different biochar types and quantities in combination with cow manure and annual inorganic fertilizer on soil properties and grain yield under millet monocropping and millet–peanut rotation in sandy soils of the peanut basin of Senegal. Results of over six years showed that a single application of 5–10 t ha−1 biochar (rice husk or Typha australis) and/or manure significantly increased soil pH (from 5.5 to 6.3) and total C (from 1.84% to an average of 2.69%). Soil available P increased due to all treatments. These improved soil properties were maintained for at least eight years following a single application of 5–10 t ha−1 biochar and/or manure. There was limited or slightly negative effects of biochar application on soil N and total soil microbial activity. Applications of either one-third or half of national recommended NPK rate, in combination with a single application of biochar or cow manure, increased millet grain yield up to four to five times (i.e., 100 to 450 kg ha−1), which was equivalent to the yield of treatments receiving the full national recommended fertilizer rate. Limited improvement was observed on peanut yield. This research clearly shows the synergistic benefits of applying single low rates of organic materials in combination with annual low levels of inorganic fertilizer. Treatments receiving the national recommended inorganic fertilizer rates (150 kg ha−1 NPK 15-15-15 and 100 kg ha−1 of urea four weeks after planting) did not produce more than 400 kg ha−1. Biochar application alone did not increase millet yields. With a recommended biochar application rate of 5 t ha−1, we calculate that Senegal has enough biomass available for biochar to cover all of its cropland every 4.4 to 5.5 years. Of particular importance, the 0.85% increase in stable total C has the potential to sequester 27.2 tons C ha−1 and if scaled across Senegal’s 1.6–2.0 million ha of peanut and millet cropland, this practice could sequester 43.52 to 54.4 million tons of C having mutual benefits on crop productivity and climate change mitigation.

1. Introduction

The biophysical context of the Senegalese Peanut Basin (SPB) is characterized by high rates of soil degradation with low levels of soil organic matter (SOM) and mineralizable nutrients. This is primarily due to high erosion rates, low fertilizer or nutrient inputs, near to complete removal of crop residues, soil acidification which directly impact soil biodiversity [1], and use of continuous mono-cropping systems [2]. Most crop production in the SPB is rain-fed [3,4,5] with recurrent drought stress [6,7] exacerbated by limited soil water holding capacity as a consequence of low SOM [8,9], resulting in lower crop productivity, ultimately leading to food insecurity and lack of resilience [10]. As food demand has increased due to increasing population, traditional fallow periods have been reduced and the rate of crop residue removal has increased for use as animal feed, fuel, and construction, without adequate biomass restitution to croplands. Consequently, the productivity of major food grain crop is low and has stagnated over many years due to poor soil fertility [5,11]. Though food production demand has increased, this has not kept pace with population growth of 2.7% yr−1 [12]; thus, per capita food demand and food insecurity is increasing [13]. Regenerative agricultural practices and technologies are urgently needed to lift smallholder farmers out of this poverty [14].
Pearl millet (Pennisetum glaucum L. R. Br.; referred to as millet here after) and peanut or groundnut (Arachis hypogaea L.) are two of the major cereal and legume crops for food security in Senegal, particularly in the SPB. Millet production in the SPB has stagnated at around 0.8 t ha−1 [15,16]. Millet production near the household tends to be significantly more productive as a result of the application of household organic waste, manure, and the cattle parking system (from 4 to 20 t ha yr−1) [17]. In addition, cropping system diversity has reduced to primarily consisting of millet monocropping or millet–peanut rotation [18]. Continuous crop cultivation without sufficient organic restitution has led to soil degradation, often to levels that soils are “non-responsive” to inorganic fertilizers with low use efficiency of the applied nutrients and thus low economic return to its use [14,19,20]. The combinations of organic materials with inorganic fertilizers have been shown to have a synergistic effect on marginal cropland [21]. Similarly, combinations of inorganic fertilizers and organic inputs have been shown to replenish soil nitrogen (N) and phosphorus (P) nutrient stocks in Africa and restore soil properties to near original levels [22,23]. Generally, rotation of a cereal with a nitrogen-fixing legume is thought to contribute to the soil N pool [24]; however, with significant removal of these leguminous residues, the overall N contribution is likely minimal. In addition to the biophysical constraints, inorganic fertilizers are rarely applied to millet due to socioeconomic constraints such as limited economic return, high prices, limited availability, low quality control, and low market price for millet grain [25,26]. Practices that minimize tradeoffs and maximize synergies across productivity, economic, environmental, human, and social domains are urgently needed [25,27,28].
Though there is significant evidence of the importance of SOM amendments in this cropping system, the crop residues are not retained or returned to the soil due to other uses and demand (e.g., livestock feed; fuel source, fencing, and housing). Thus, there is need to find alternative sources of organic materials or carbon amendments or increase the efficiency of applied nutrients. Some biochar’s have shown evidence of having these advantageous traits [29,30]. Biochar is a carbonaceous residue produced through the thermal, anaerobic breakdown of organic materials [31]. Biochar applications in agricultural soils have received increasing attention as a possible means of improving productivity and sustainability of farming systems [31]. Past studies have shown that soils amended with biochar improve soil proprieties and increase plant nutrient availability and yield performance [32,33,34,35,36,37,38,39,40]. Biochar use is reported to be effective in tropical zones [29,41]. Cornelissen et al. [42] showed that 4 tons ha−1 biochar in combination with conservation farming can strongly increases maize yield and improve physical and chemical soil characteristics in sandy, acidic soils in Zambia. Asirifi et al. [43] observed that 20 t ha−1 rice husk biochar amendment with wastewater irrigation reduced microbial stress and facilitated more efficient use of carbon in the highly weathered savanna soil in Ghana. In Southern Africa, Nyambo et al. [44] reported that adding maize residue biochar significantly improved the soil physiochemical properties and microbial activities of an acidic Hutton soil where changes in bulk density, soil organic carbon, pH, microbial biomass carbon and mean weight diameter of soil aggregates were directly proportional to the increase in biochar application rate. Despite its potential advantages, its effects have been highly variable and dependent on soil properties and the raw material type [45,46,47,48,49].
So far, few studies have assessed the performance of Biochar in Senegal [39,50]. In Senegal, a Ministry of Energy and Biofuel study calculated Senegal’s annual production capacity of carbon sources [51]. This study projected the annual availability of over 8000 tons of rice hulls, 27,000 tons of peanut shells, 1,600,000 tons of cotton (Gossypium hirsutum), corn or maize (Zea mays), sorghum (Sorghum bicolor L. Moench) or millet stems, and over 65,000 tons from Typha australis, an aquatic plant widely present in fresh waters like in the Senegalese River [51]. These underutilized carbon sources have significant potential for incorporation into SPB production systems as biochar. Thus, an experiment was initiated in 2012 at the National Center for Agronomic Research (CNRA) of the Senegalese Agricultural Research Institute (ISRA) of Bambey. The primary objective of the study was to evaluate the long-term effects of a single application of biochar and/or manure and combinations with annual inorganic fertilizer on soil properties and grain yield under millet monocropping and millet–peanut rotation in sandy soils of Senegal. Our hypothesis was that biochar combined with minimal mineral fertilizer or organic manure will positively improve soil physical and chemical properties and consequently improve crop yield in both monocropping and crop rotation systems in sandy soils with low SOM.

2. Materials and Methods

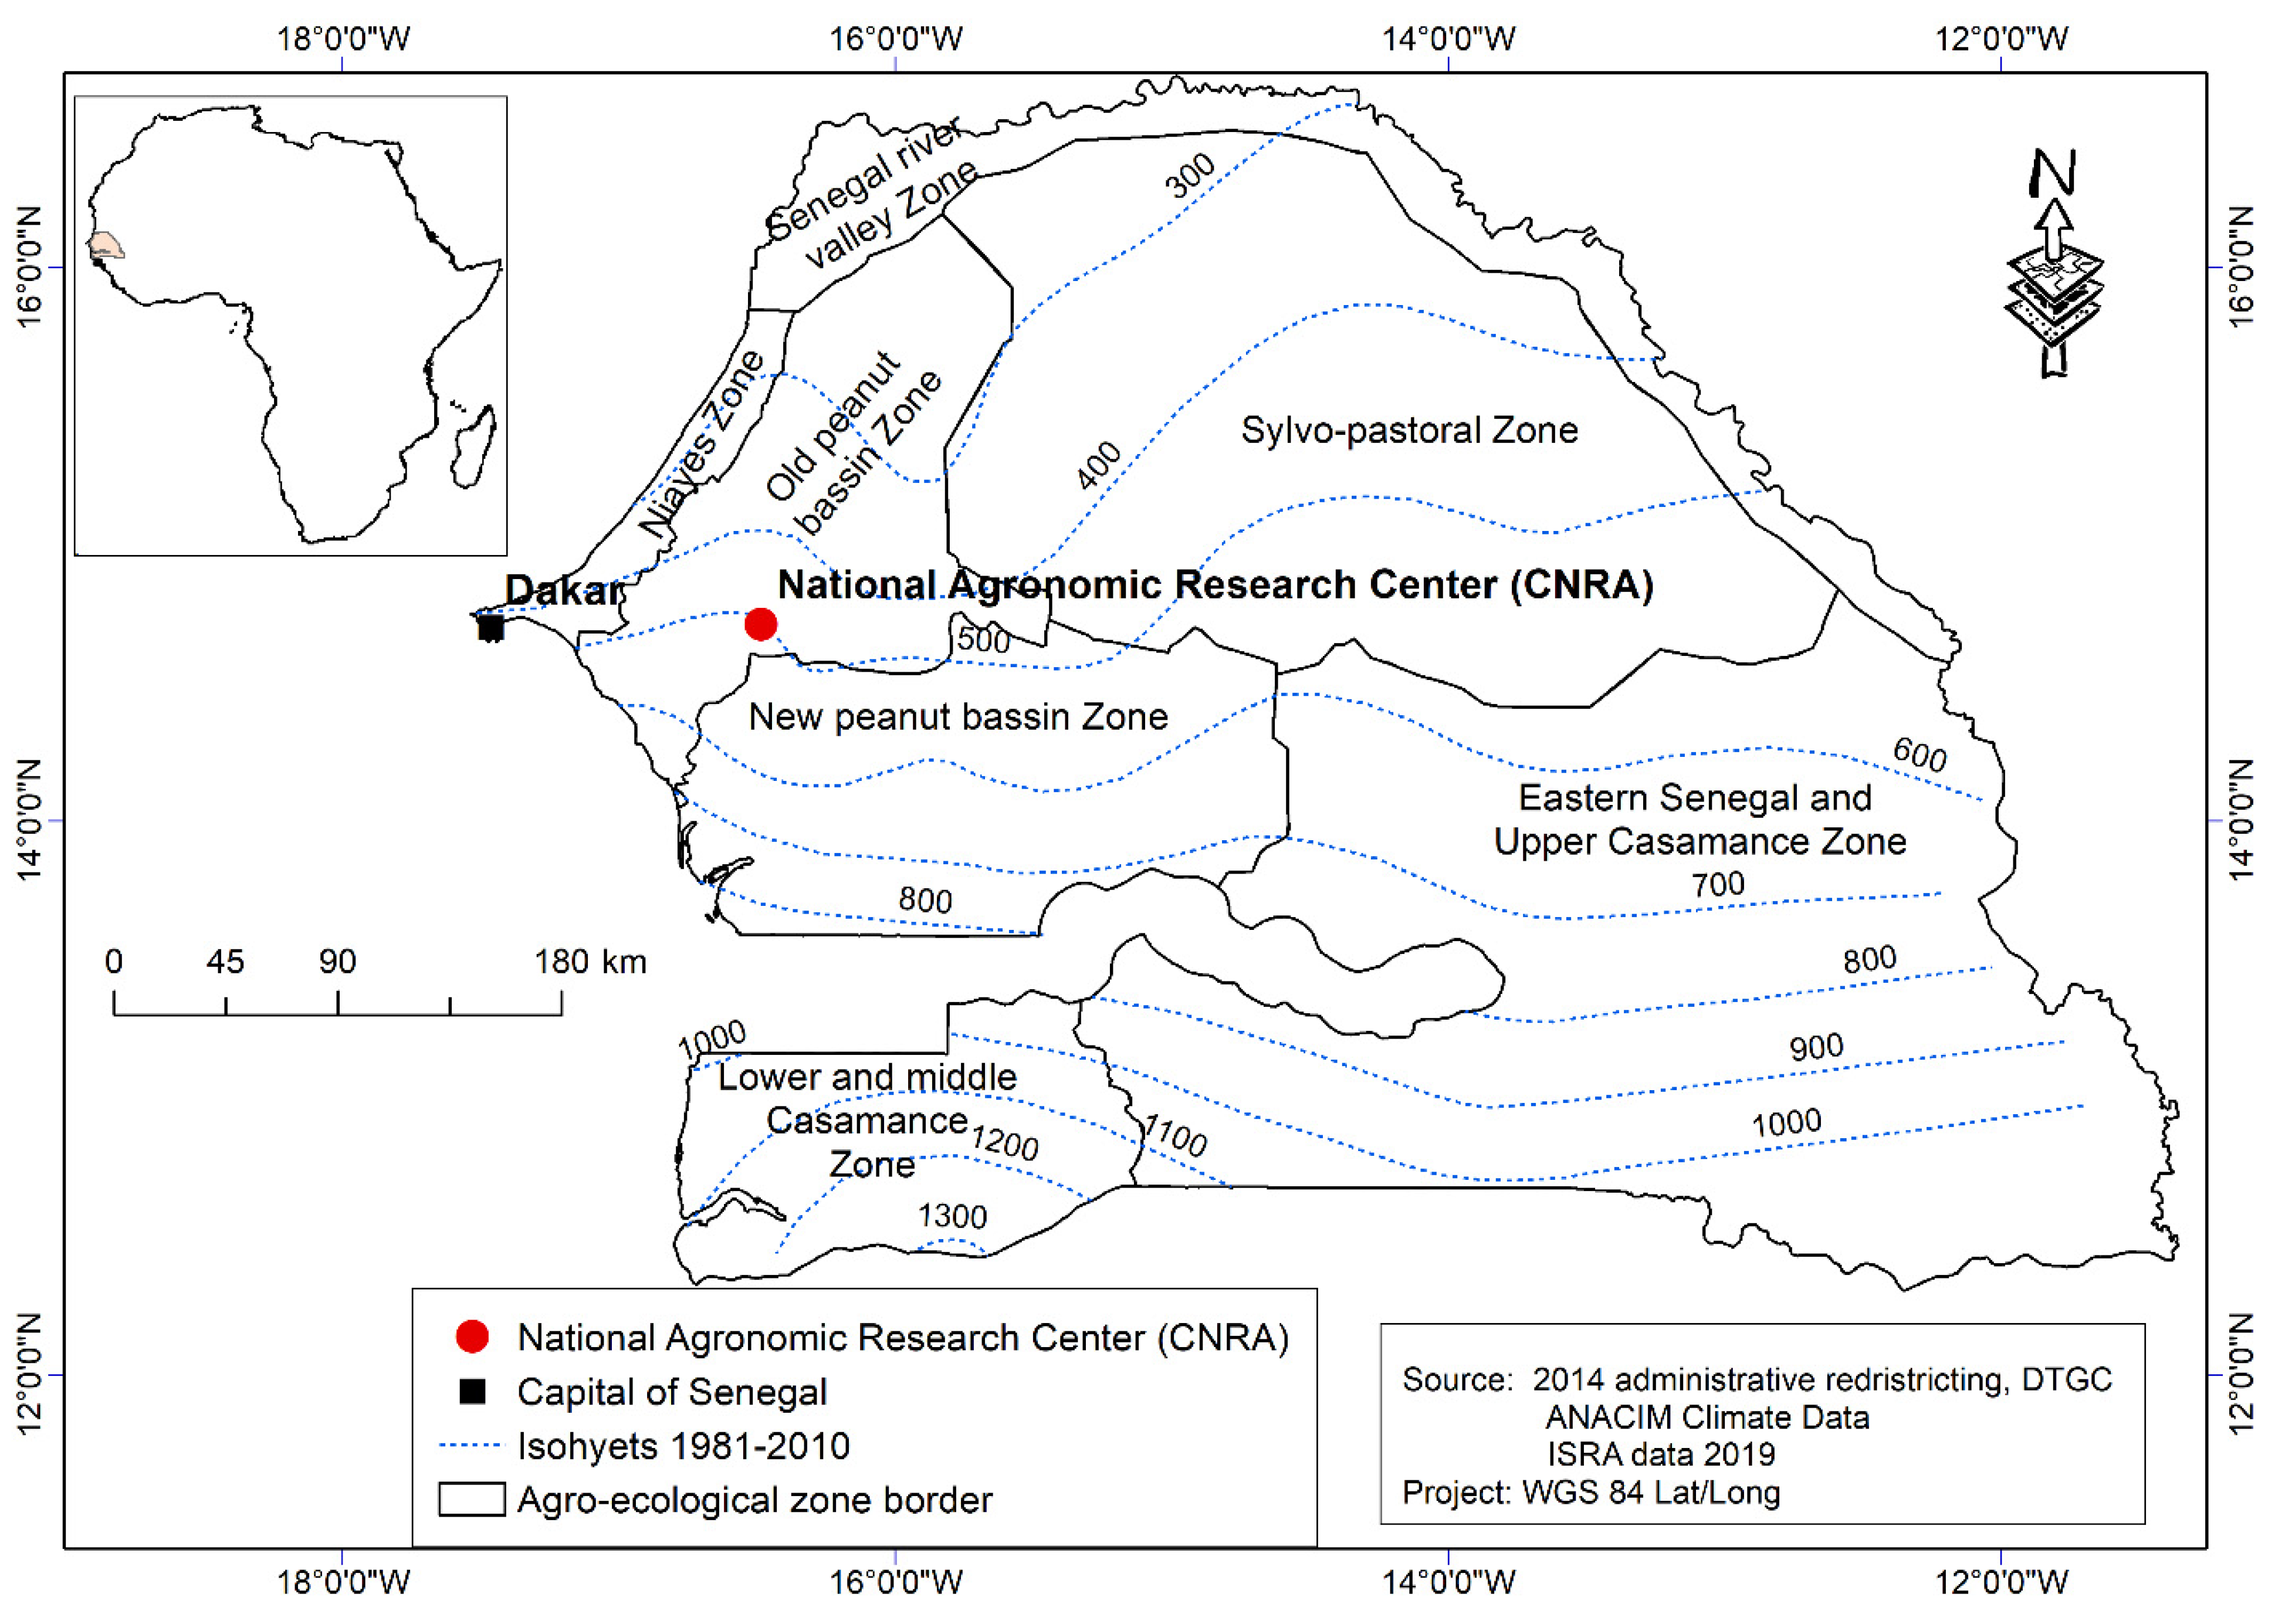
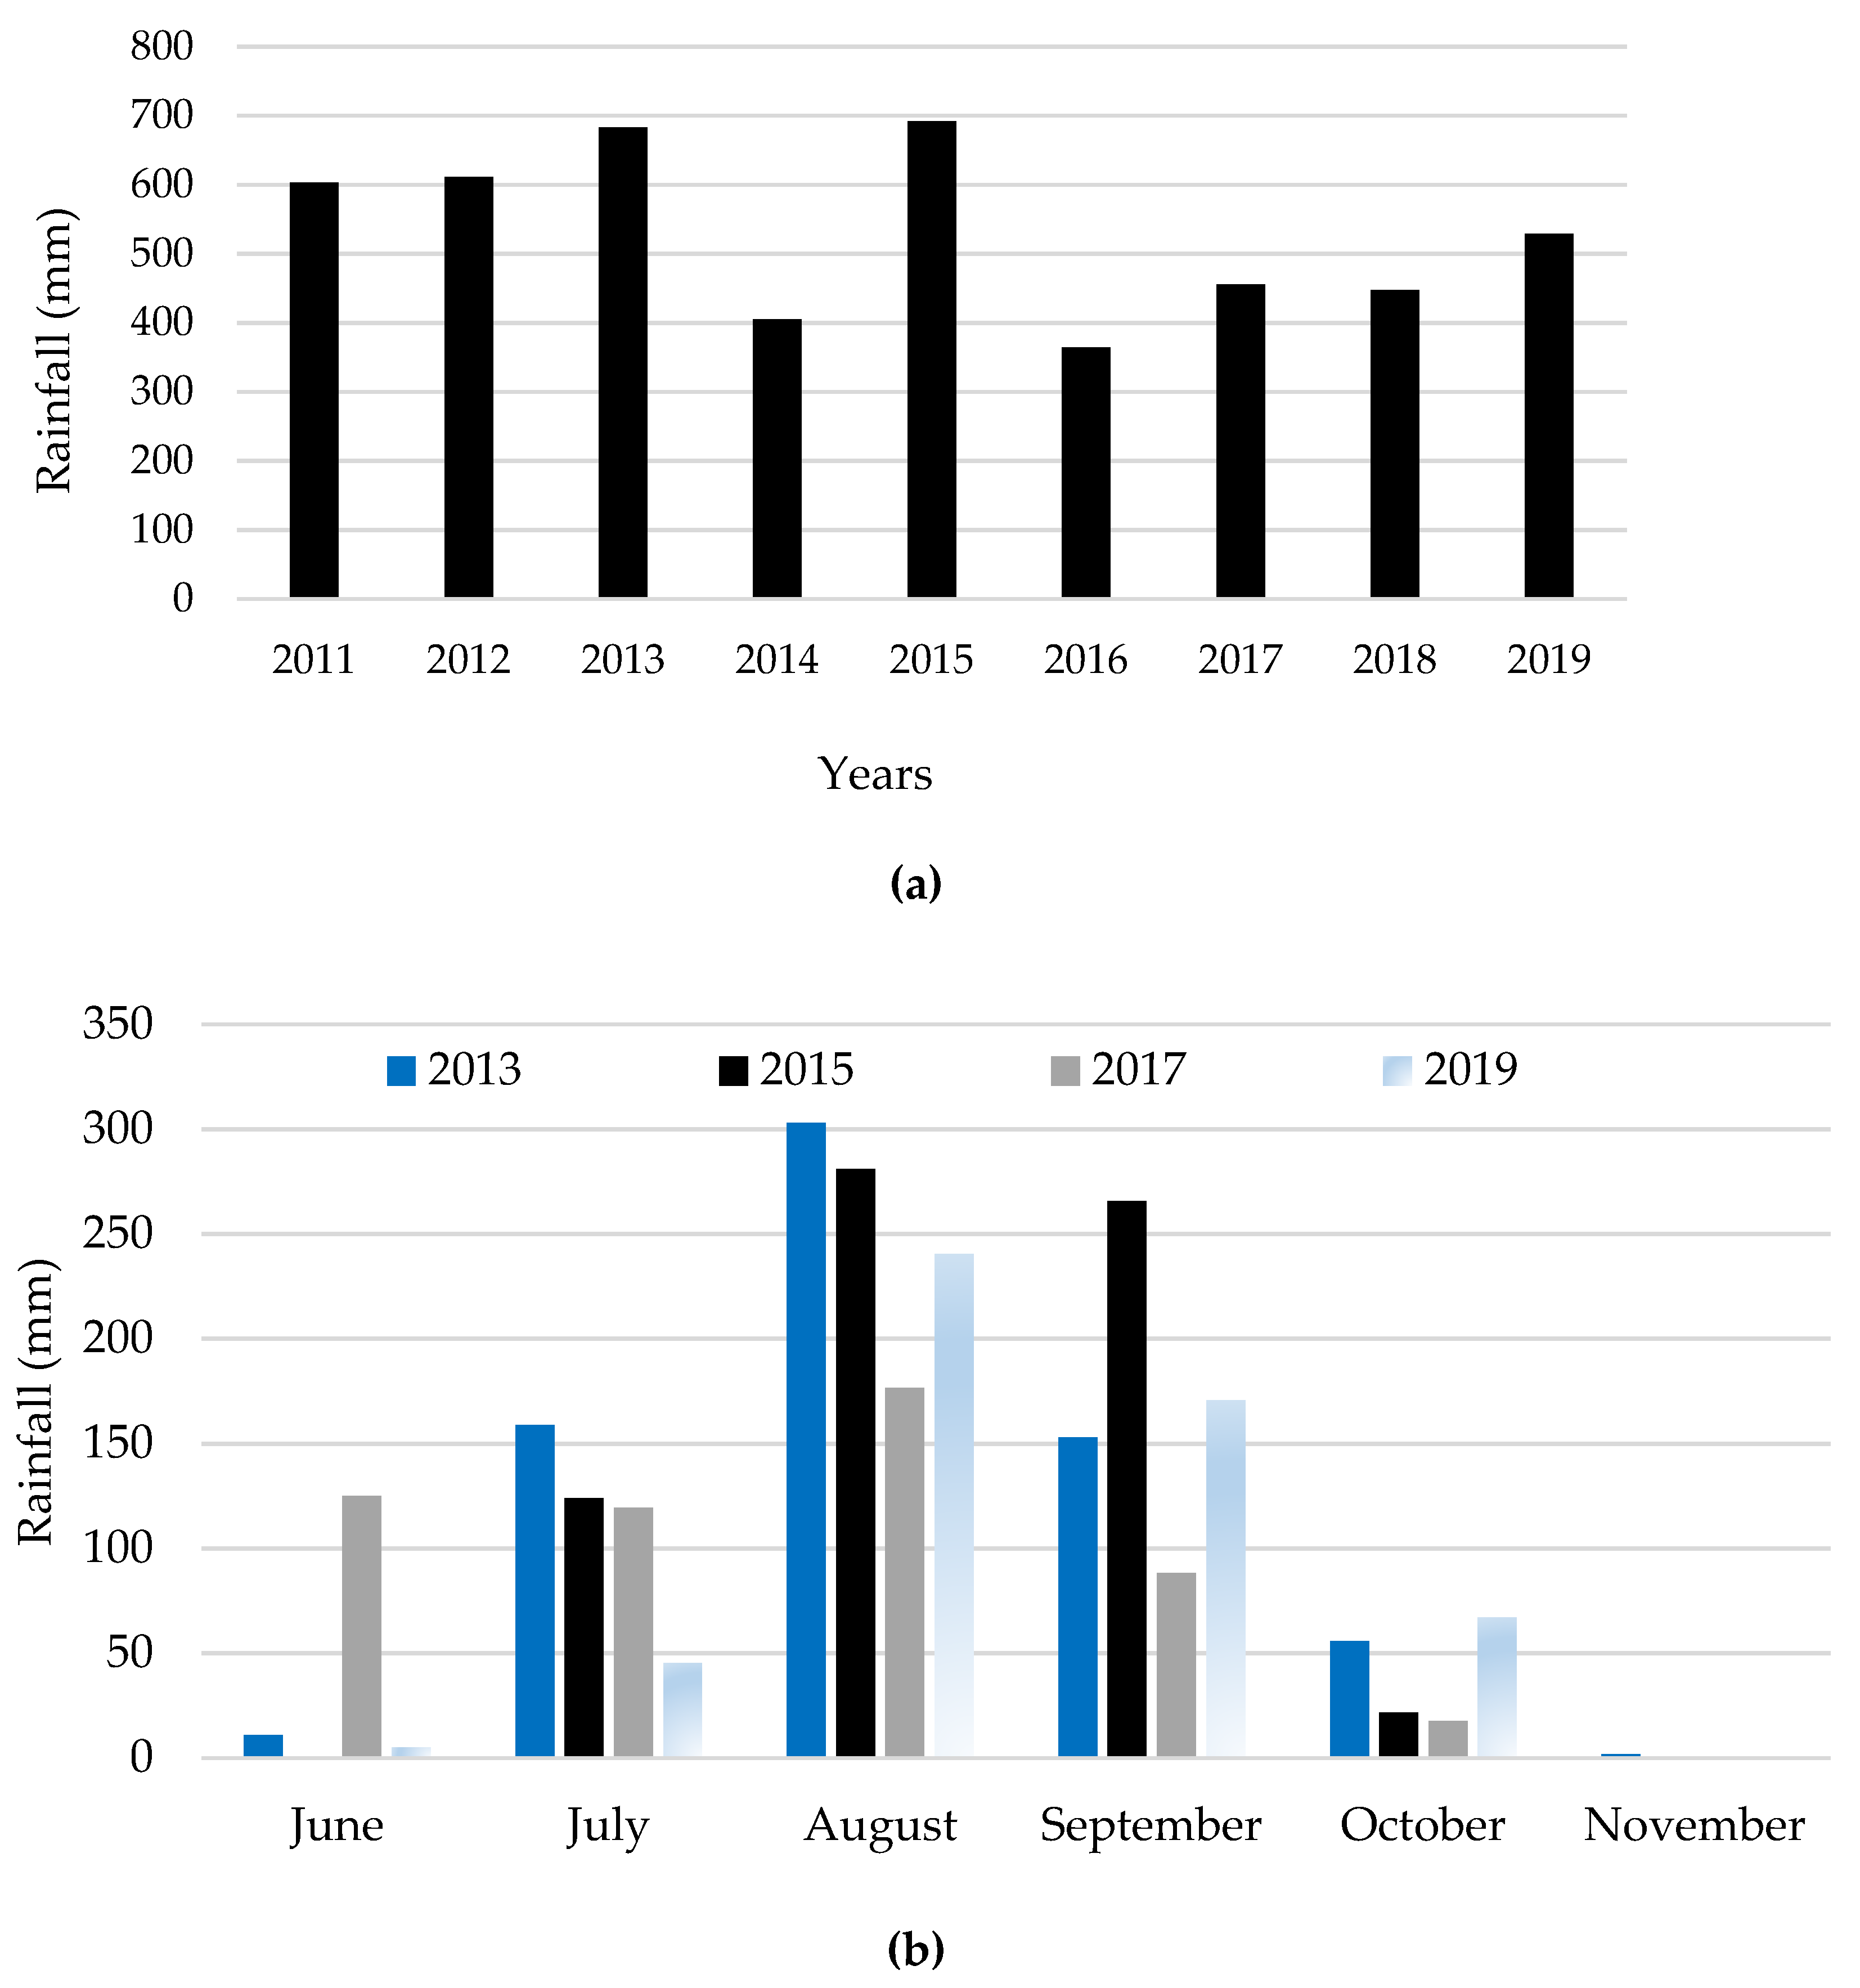
2.1. Experimental Site Description and Treatments

The study was conducted at the National Agronomic Research Center of the Senegalese Agricultural Research Institute (CNRA–ISRA) of Bambey in Senegal (16°28′ W; 14°42′ N) located in the Senegal Peanut Basin (SPB), which is one of the six agro-ecological zones of Senegal (Figure 1). The location has a bimodal, tropical climate with an average annual temperature around 28 °C and a dry season from November to June followed by a rainy season from July to October. The study site was on degraded soil following intensive peanut monocropping. A baseline soil fertility reference was collected along the diagonal of the field at a depth of 0–20 cm and analyzed at CNRA–ISRA Soil-Plant and Water Testing Laboratory at Bambey. The soil has 93% sand; pH of 5.5; total N of 0.21%; total carbon of 1.84%; and available P of 33.3 ppm. The trial site was divided into four main blocks each 27 m long and 7.2 m wide (194.4 m2) and separated from each other by 2 m alleys. Prior to initiating the trial in 2012, land preparation was carried out with surface plowing using a tractor before dividing each of the four main blocks into 10 sub-plots of 2.7 m × 7.2 m (19.44 m2) each representing the tested 10 treatments (T1 to T10; Table 1). T1 was absolute control with no amendments and no fertilizer applications and T2 was positive control (with full recommended fertilizer). The treatments T3 through T10 had different levels of biochar, manure, and fertilizers as shown in Table 1. The treatments were randomly assigned in each sub-plot. Treatments were applied manually and covered with rakes. In 2012 all plots were planted with millet. In 2013, each main block was split lengthwise into two sub-blocks and planted with peanut for the millet–peanut rotation. Thus, the sub-plot for treatments were halved to 2.7 m by 3.6 m (9.72 m2). The experimental design was a split plot with four replications. The main block was the cropping system and the sub-plot the treatments. Annual rainfall totals for the study site from 2011 to 2019 indicate high inter-annual variability. The annual rainfall ranged from 370 mm (2016) to 692 mm (2015). The years 2013 (683 mm) and 2015 were rainiest (Figure 2a) and in all years the highest rainfall amounts were recorded in August and September (Figure 2b).

2.2. Plant Materials and Agronomy

The plant materials used in this study were millet variety Souna 3 and peanut variety 55-435. Both varieties were developed by ISRA. Souna 3 millet and 55-435 peanut varieties have a short duration cycle (90 days) and are suitable for the SPB conditions with annual rainfall between 350 and 600 mm. In the millet monocropping system as well as in the millet–peanut rotation system, millet was sown at standard spacing of 90 cm on the row and 90 cm between the rows (with a sowing density of 12 seed hills per plot). Peanut in rotation with millet was sown at 50 cm between rows and 15 cm in rows (i.e., 115 pockets per plot) at the rate of two seeds per pocket. At seven days after planting (DAP), millet was thinned to three plants per seed hill and peanut at one plant per seed hill. For the positive control of millet crop, mineral fertilizer (NPK) application was made yearly according to the national millet recommended rate of 150 kg ha−1 of NPK (15-15-15) at thinning (i.e., seven DAP) and 100 kg ha−1 of Urea (46% N) at four weeks after planting. For peanut following millet, the NPK used was the national legume recommended rate of 150 kg ha−1 of NPK (6-20-10). For treatments receiving combinations of inorganic and organic amendments (i.e., T7-10; Table 1), the reduced inorganic fertilizer rates were also applied annually (Table 1). Treatments receiving 75 kg ha−1 and 50 kg ha−1 received proportional decreases in the Urea application at 50 kg ha−1 and 33 kg ha−1, respectively. Biochar and manure applications were only applied once in the initial cropping year in 2012 and were incorporated with rakes. Weeding was done annually by hand to avoid contamination between treatments; and plots were maintained and weed free.

2.3. Soil Analyses

From 2013 to 2017, soil samples were collected from each plot before the start of the rainy season for characterization of pH, total C, total N, and available P in all treatments. Analyses were conducted at the Soil-Plant and Water Testing Laboratory of CNRA–ISRA at Bambey. In 2019, soil biochemical proprieties were characterized including soil microbial community analyses. Soil pH was determined using the Mathieu and Pieltain [52] protocol by mixing in a 50 mL beaker, 10 g of ground and sieved soil (0.2 mm mesh) and 25 mL of demineralized water and stirring the solution (soil-water) using agitator for 30 min. The soil pH was measured using a pH meter (Inolab 720). Soil total C, total N, and available P were determined by Walkley and Black [53], Olsen [54], and Kjeldahl [55] modified methods, respectively. The soil organic matter (SOM) was calculated using the formula SOM = carbon content × 1.72 (with 1.72 being the stable coefficient of cultivated soils) [56]. C sequestration was calculated using the formula: Tons soil C ha−1 = 10,000 m2 × 0.2 m soil depth × 1.6 g/cm3 bulk density × change in % total C. Bulk density was determined for the study location by Chopart [57]. Soil total microbial activity was assessed using the Fluorescein Diacetate (FDA) hydrolysis protocol [58] at the Common Laboratory of Microbiology IRD-ISRA-UCAD in Dakar, Senegal. Two g soil was placed in a conical flask with 15 mL of 60 mM potassium phosphate buffer pH 7.6. Stock solution (0.2 mL 1000 mg FDA mL−1) was added to start the reaction. Controls were prepared without the addition of the FDA substrate along with a suitable number of sample replicates. The fluorescein released during the assay was extracted with chloroform/methanol (2:1 v/v) and measured at 490 nm using a spectrophotometer (Spectronic 401, Spectronic Instruments, France).

2.4. Biochar Types and Characterization Methods

Two biochar types were obtained from the private company Pronatura formerly located in Ross Bethio town in the Saint Louis region of Senegal. One of the biochar types was from rice husk and the second one was from Typha australis, an invasive aquatic plant naturally growing in freshwater that is common in the Senegalese river. The temperature of the pyrolysis was approximately 500 °C for the Typha australis material and 600 °C for the rice husk. Biochar types (Table 2) and cattle manure (Table 3) characterization was done at the Center for Biochar Research at the University of Edinburgh, U.K., in 2012.
Total N was assessed using the Kjeldahl [48] method, pH was assessed at 1:1 biochar with distilled water, organic C was assessed using the volumetric method [46], available P was assessed using Bray’s Method No. 1 [59], available K was assessed using one molar neutral ammonium acetate and estimated through a flame photometer [60], and Ca and Mg were determined by the flame photometer method of Toth and Prince [60].

2.5. Millet and Peanut Grain Yield

Millet and peanut yields were assessed at maturity by harvesting all the plants from each treatment. For millet, panicles were harvested, and plants were cut at the ground surface. All plant parts were dried in shade and weighed regularly until the weight was constant using an electronic precision scale of 0.001 g. Panicles were then manually threshed to separate grains and weighed in order to determine the yield of each sub-plot (9.72 m2). For peanut, plants were pulled from the soil and pods were separated from plant biomass. The separated components were shade dried, and periodically weighed until constant. For both crops, the yield was presented in kg ha−1.

2.6. Data Analysis

The experimental design was a split-plot design with four replicates. Statistical analysis was completed using R software version 3.2.4. For 1, 4, and 6 years after treatment application, one-way ANOVA was applied to assess treatment effects on soil sample chemical characteristics, while, to assess the effects of treatment on soil characteristics and crop yield according to the two cropping systems, we used a two-way ANOVA. For all experiments, a Tukey test at p < 0.05 was used for mean discrimination.

3. Results

There were significant main effects due to the soil amendment treatments for pH, available P, N, and C, whereas interactions were observed between treatments and cropping systems for P, microbial activity, and grain yield. Thus, the results are presented accordingly.

3.1. Treatment Effects on Soil Characteristics Independent of Cropping System

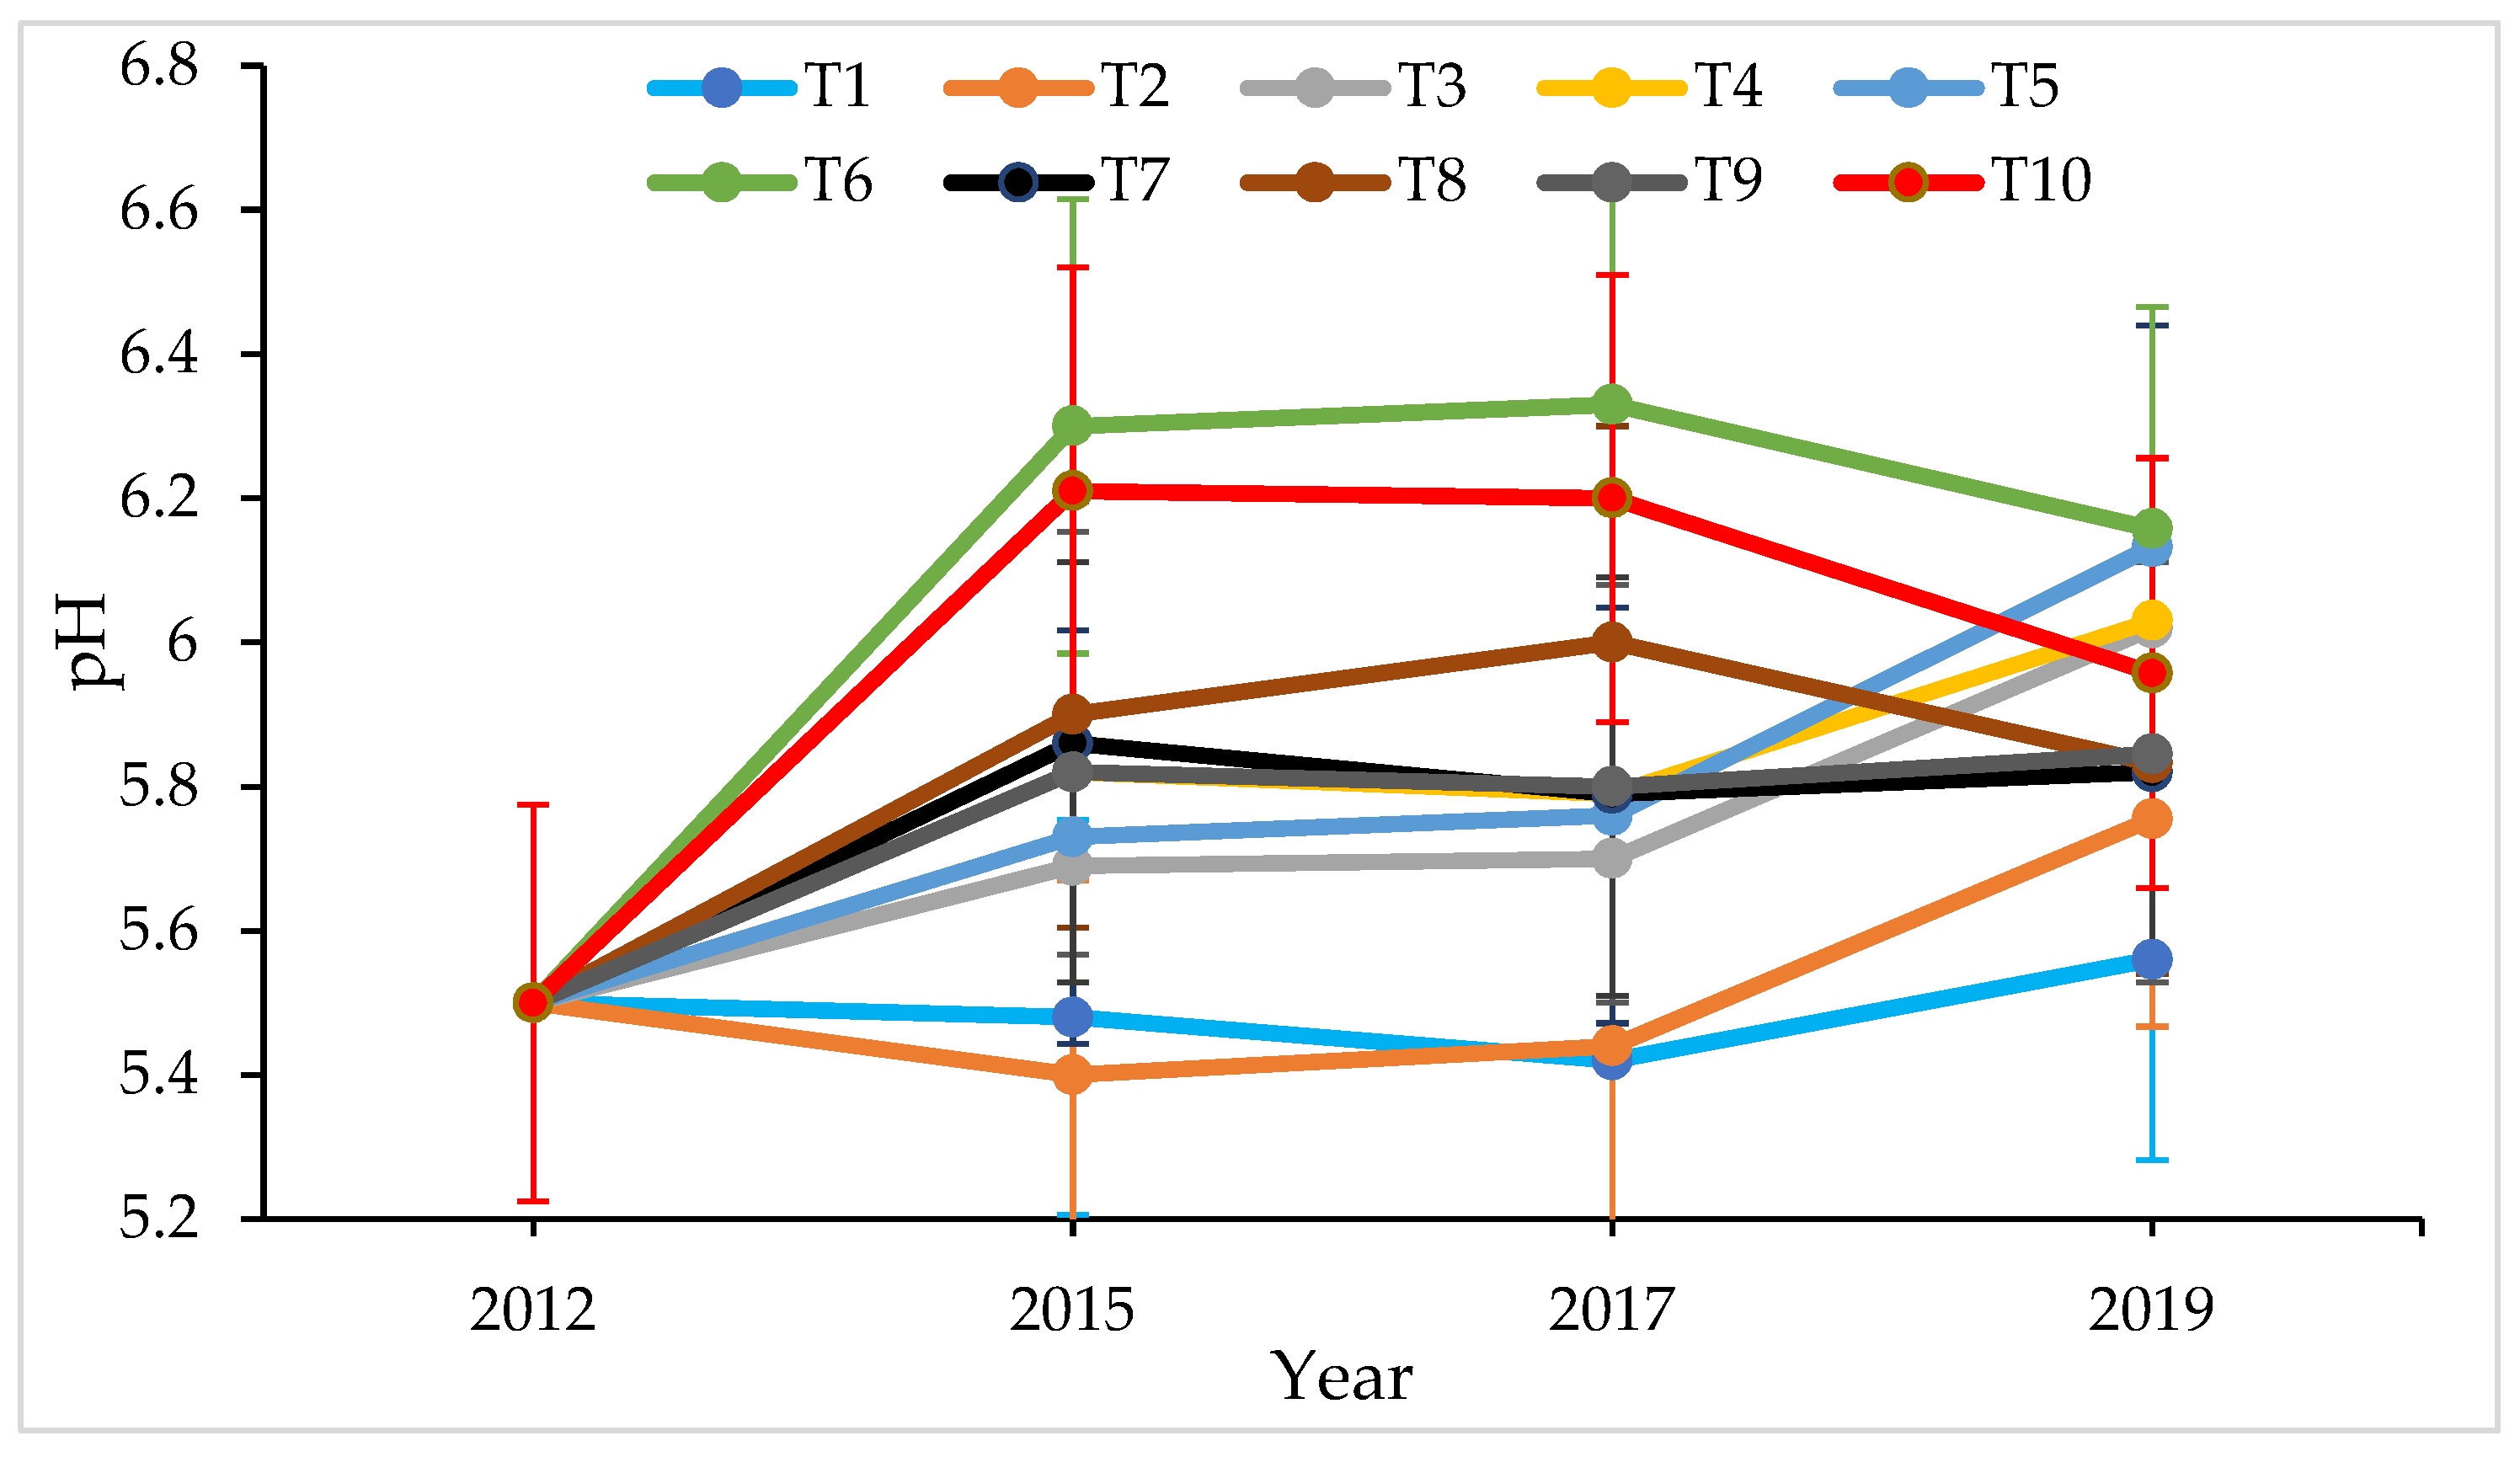
3.1.1. Effect on Soil pH

The effects of treatments on soil pH are shown in Figure 3. All treatments increased soil pH except treatment T2 (fertilizer recommended dose application only, i.e., positive control) which had fairly stable pH over the trial period with a slight increase in 2019. The best effects on improving soil pH were obtained under T6 (i.e., 10 t ha−1 Typha biochar + 5 t ha−1 manure) and T10 (i.e., 50 kg ha−1 NPK + 33 kg ha−1 Urea + 5 t ha−1 Typha biochar + 5 t ha−1 manure) treatments, where soil pH was significantly increased in 2015 by up to 0.9 units before stabilizing until 2017 and with a slight decline in 2019. Increases in pH due to biochar or manure application appear to be additive with those treatments receiving half rates as compared to T6 and T10 having half the level of increase in pH. Starting from 2017, five years after treatment application, soil pH under treatments T6, T10, and T8 (10 t ha−1 of biochar) started declining while under treatments T5, T4, and T3 (5 t ha−1 of biochar), soil pH started increasing. Under T7 and T9 (5 t ha−1 of biochar), pH remained stable.

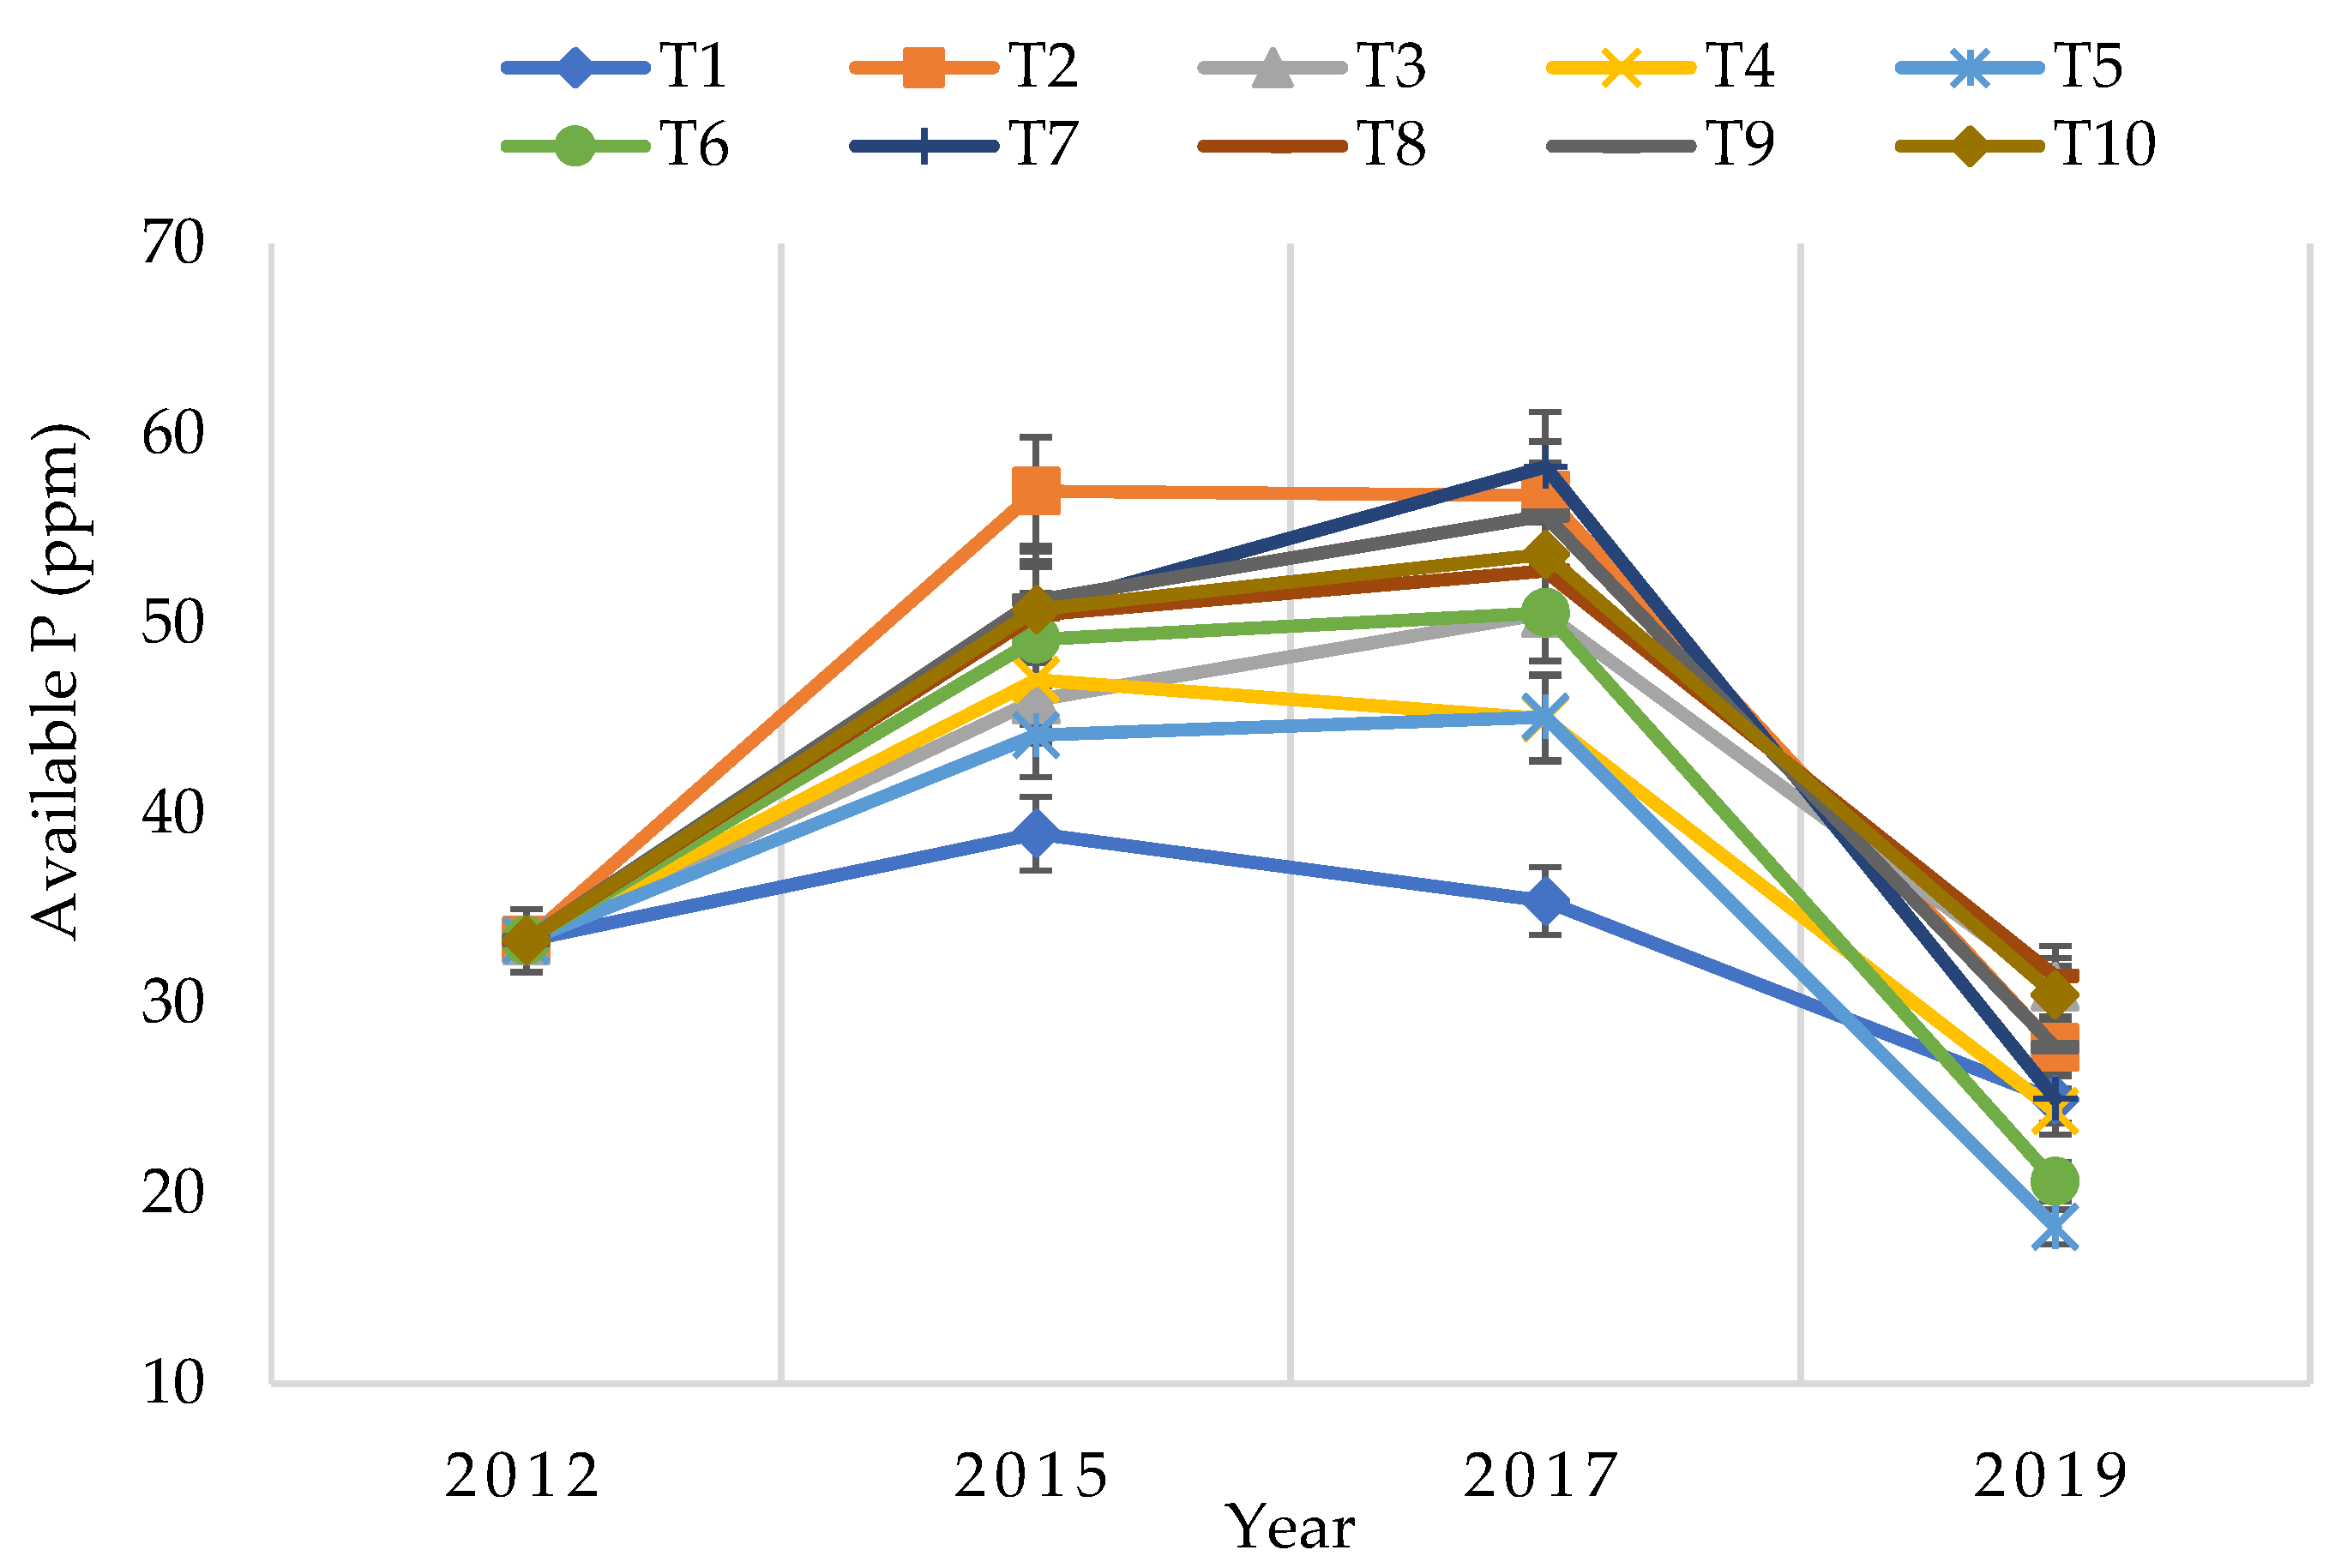
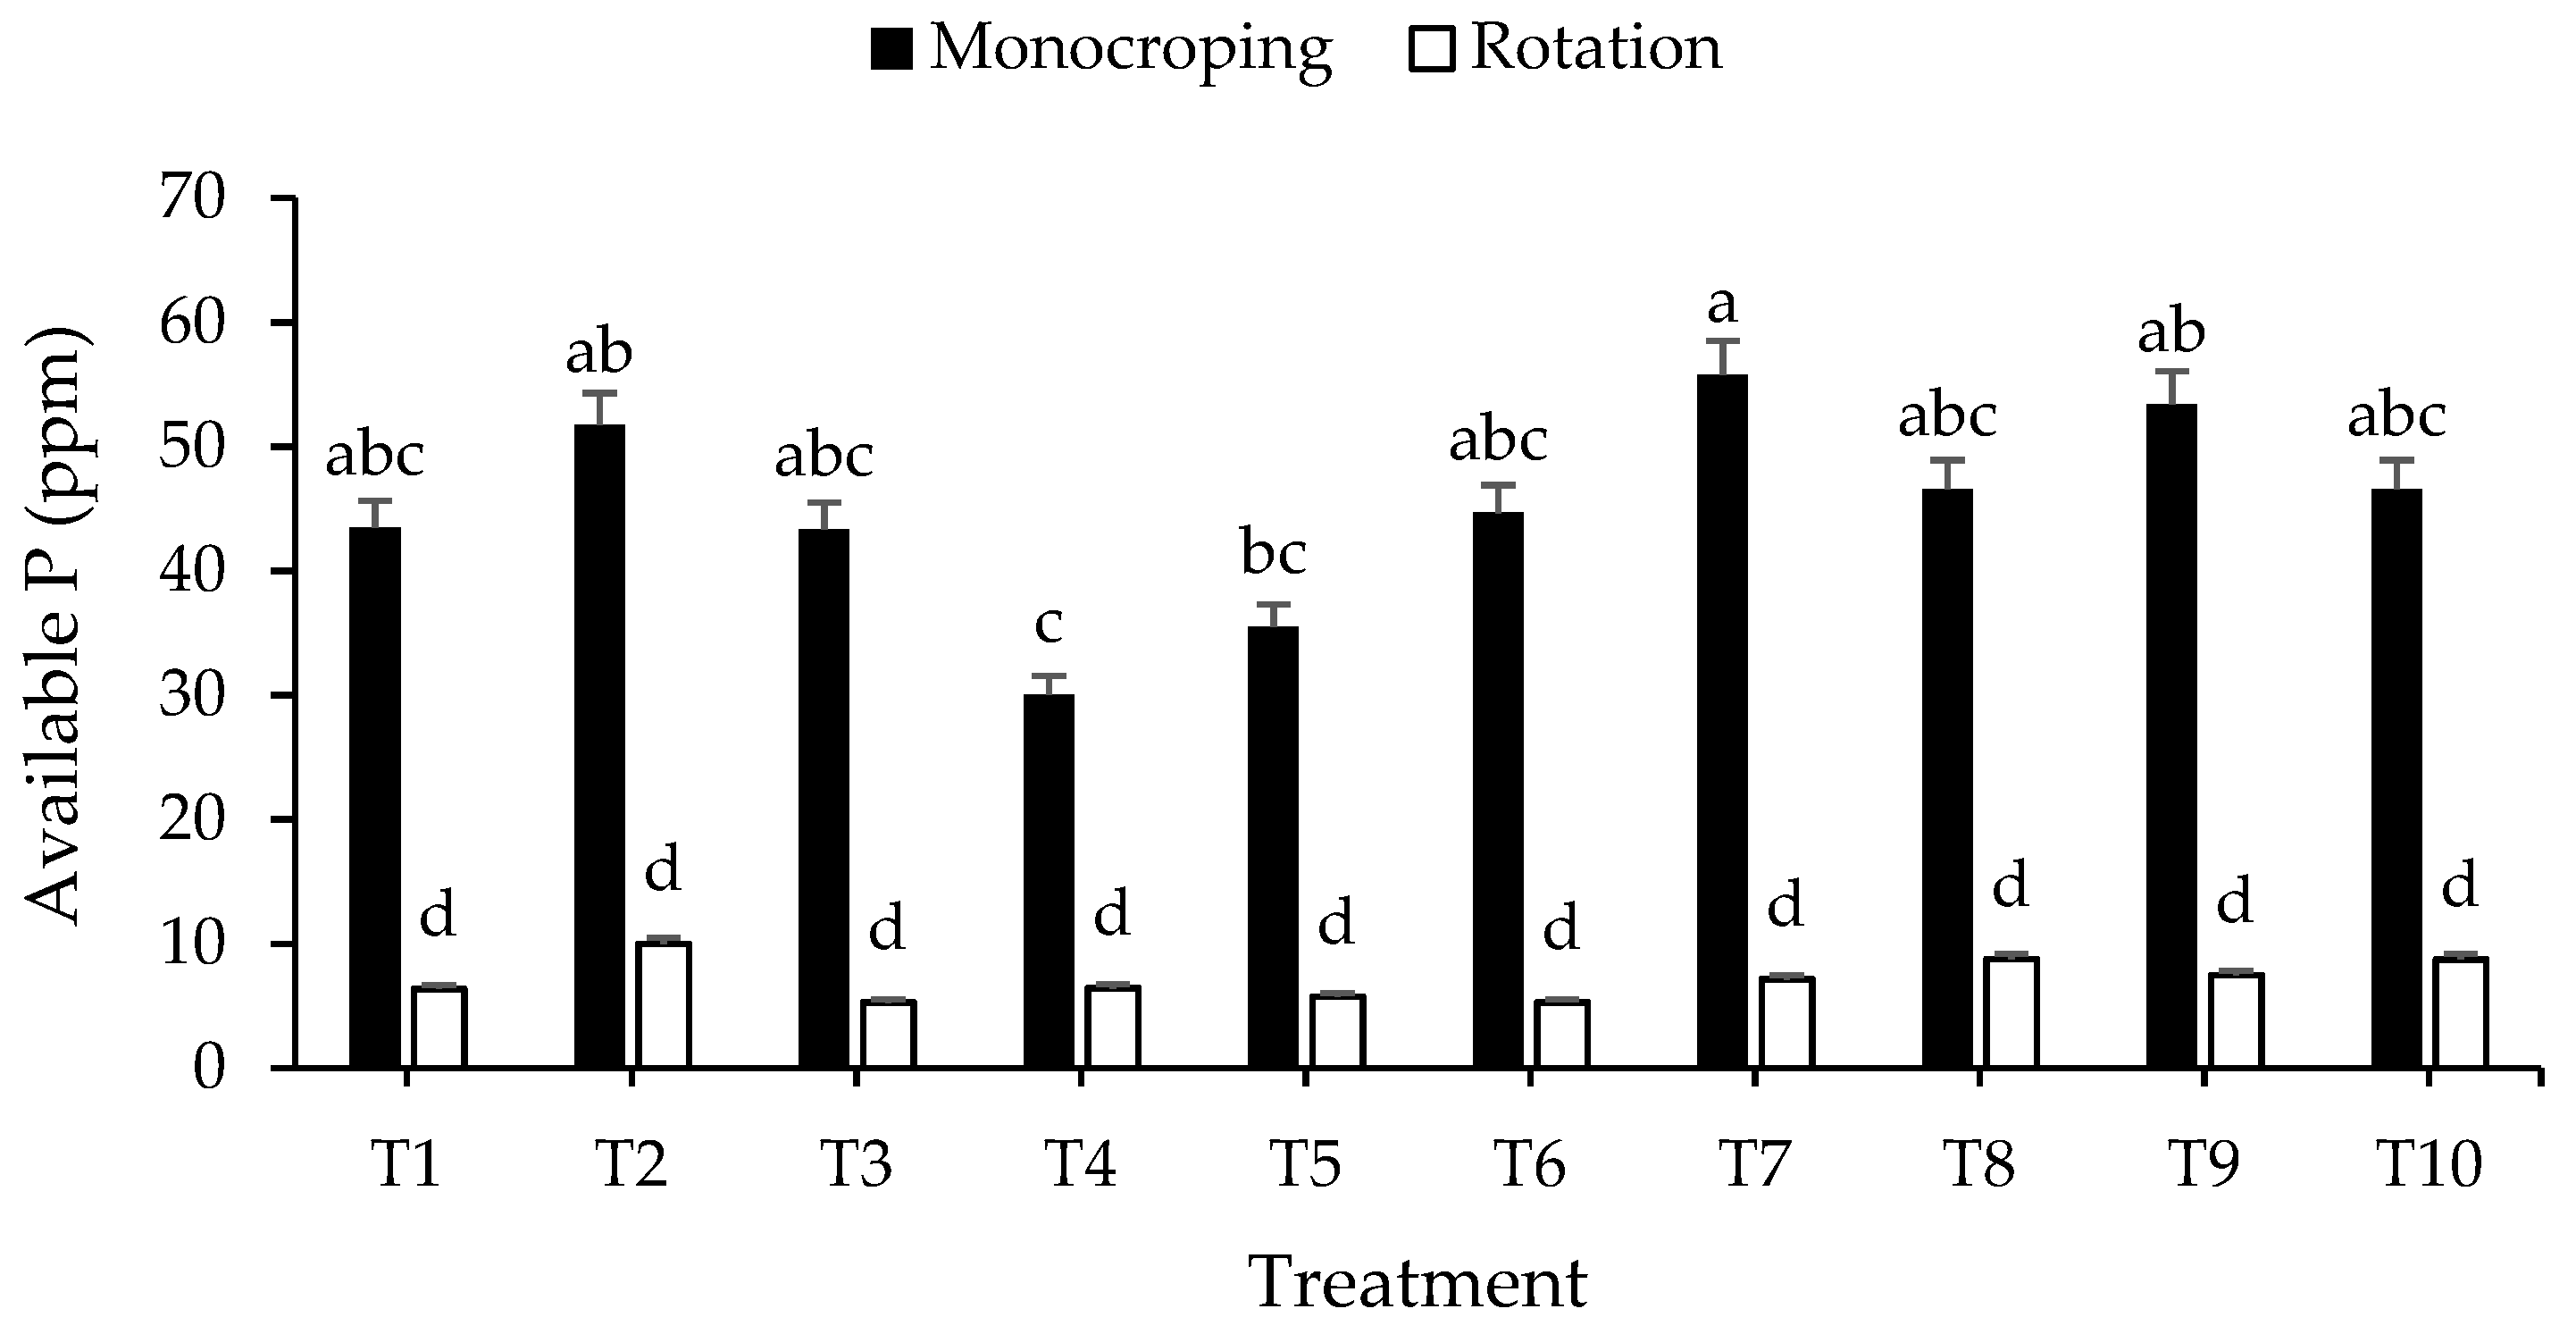
3.1.2. Effect on Soil Available P

The effects of treatments on available phosphorus are shown in Figure 4. Available P for all treatments increased as compared to T1 (absolute control with no amendments and no fertilizer) from 2012 to 2017. Treatments receiving inorganic fertilizer NPK application alone or in combination (i.e., T2, T7, T8, T9, and T10) had the greatest level of available P, with an increase up to 23.7 ppm. The positive control T2, with the highest level of inorganic fertilizer application alone, led to the greatest available P in 2015. In 2017 low levels of inorganic fertilizer, in combination with biochar and/or manure (T8, T9, T10), increased available P by the equivalent amount. From 2017 to 2019 plant removal and uptake surpassed supply for all treatments and available P declined substantially, even surpassing available P in the absolute control.

3.1.3. Effect on Soil Total N and C

In 2013, the first year after treatments were applied, only treatment T5 (5 t ha−1 of Typha biochar + 5 t ha−1 manure) significantly increased total N as compared to the controls and the reference (0.21%0)) sample (Table 4). In 2015, all treatments reduced total soil N as compared to the absolute control (T1) including the treatments with inorganic fertilizer alone (T2) or in combination with biochar and/or manure. Two years later in 2017, total N was similar to 2015 and was significantly lower than the absolute control.
In 2013, following the first year after application, all treatments except T10 significantly increased total C compared to the absolute control (T1), the positive control (T2) (high rate of inorganic fertilizer alone), and the 2012 reference sample. In 2015 and sustained through 2017, all treatments (T2–T10) led to significantly greater total C as compared to the absolute control (T1) and 2012 reference sample. Among the treatments that increased total C, there was no significant difference. For the treatments containing biochar, there was an average increase in total C to 2.69%, an increase of 0.85% from the 1.84% reference sample. This change in total C calculates to 27.2 tons of C sequestered ha−1.

3.2. Treatment Effects on Soil Characteristics and Yield under Different Cropping Systems

3.2.1. Interaction of Cropping Systems on Soil Chemical Characteristics

There was no significant interaction effect on soil N and C. However, soil available P was significantly different between the two cropping systems, but no treatments improved available P within cropping systems as compared to the absolute control (T1) (Figure 5).
In the millet monocropping system, the high biochar treatment (T4) had significantly lower available P than T7, which received the ½ rate of NPK in combination with rice husk biochar. In the millet–peanut rotation system, no significant difference was observed between the treatments and the controls. Of particular note, the millet–peanut rotation, led to available P below 10 ppm for all treatments including the absolute control. This decline is significantly lower than the reference collected in 2012 (i.e., 33.3 ppm) and P availability in the millet monocropping system (Figure 5).

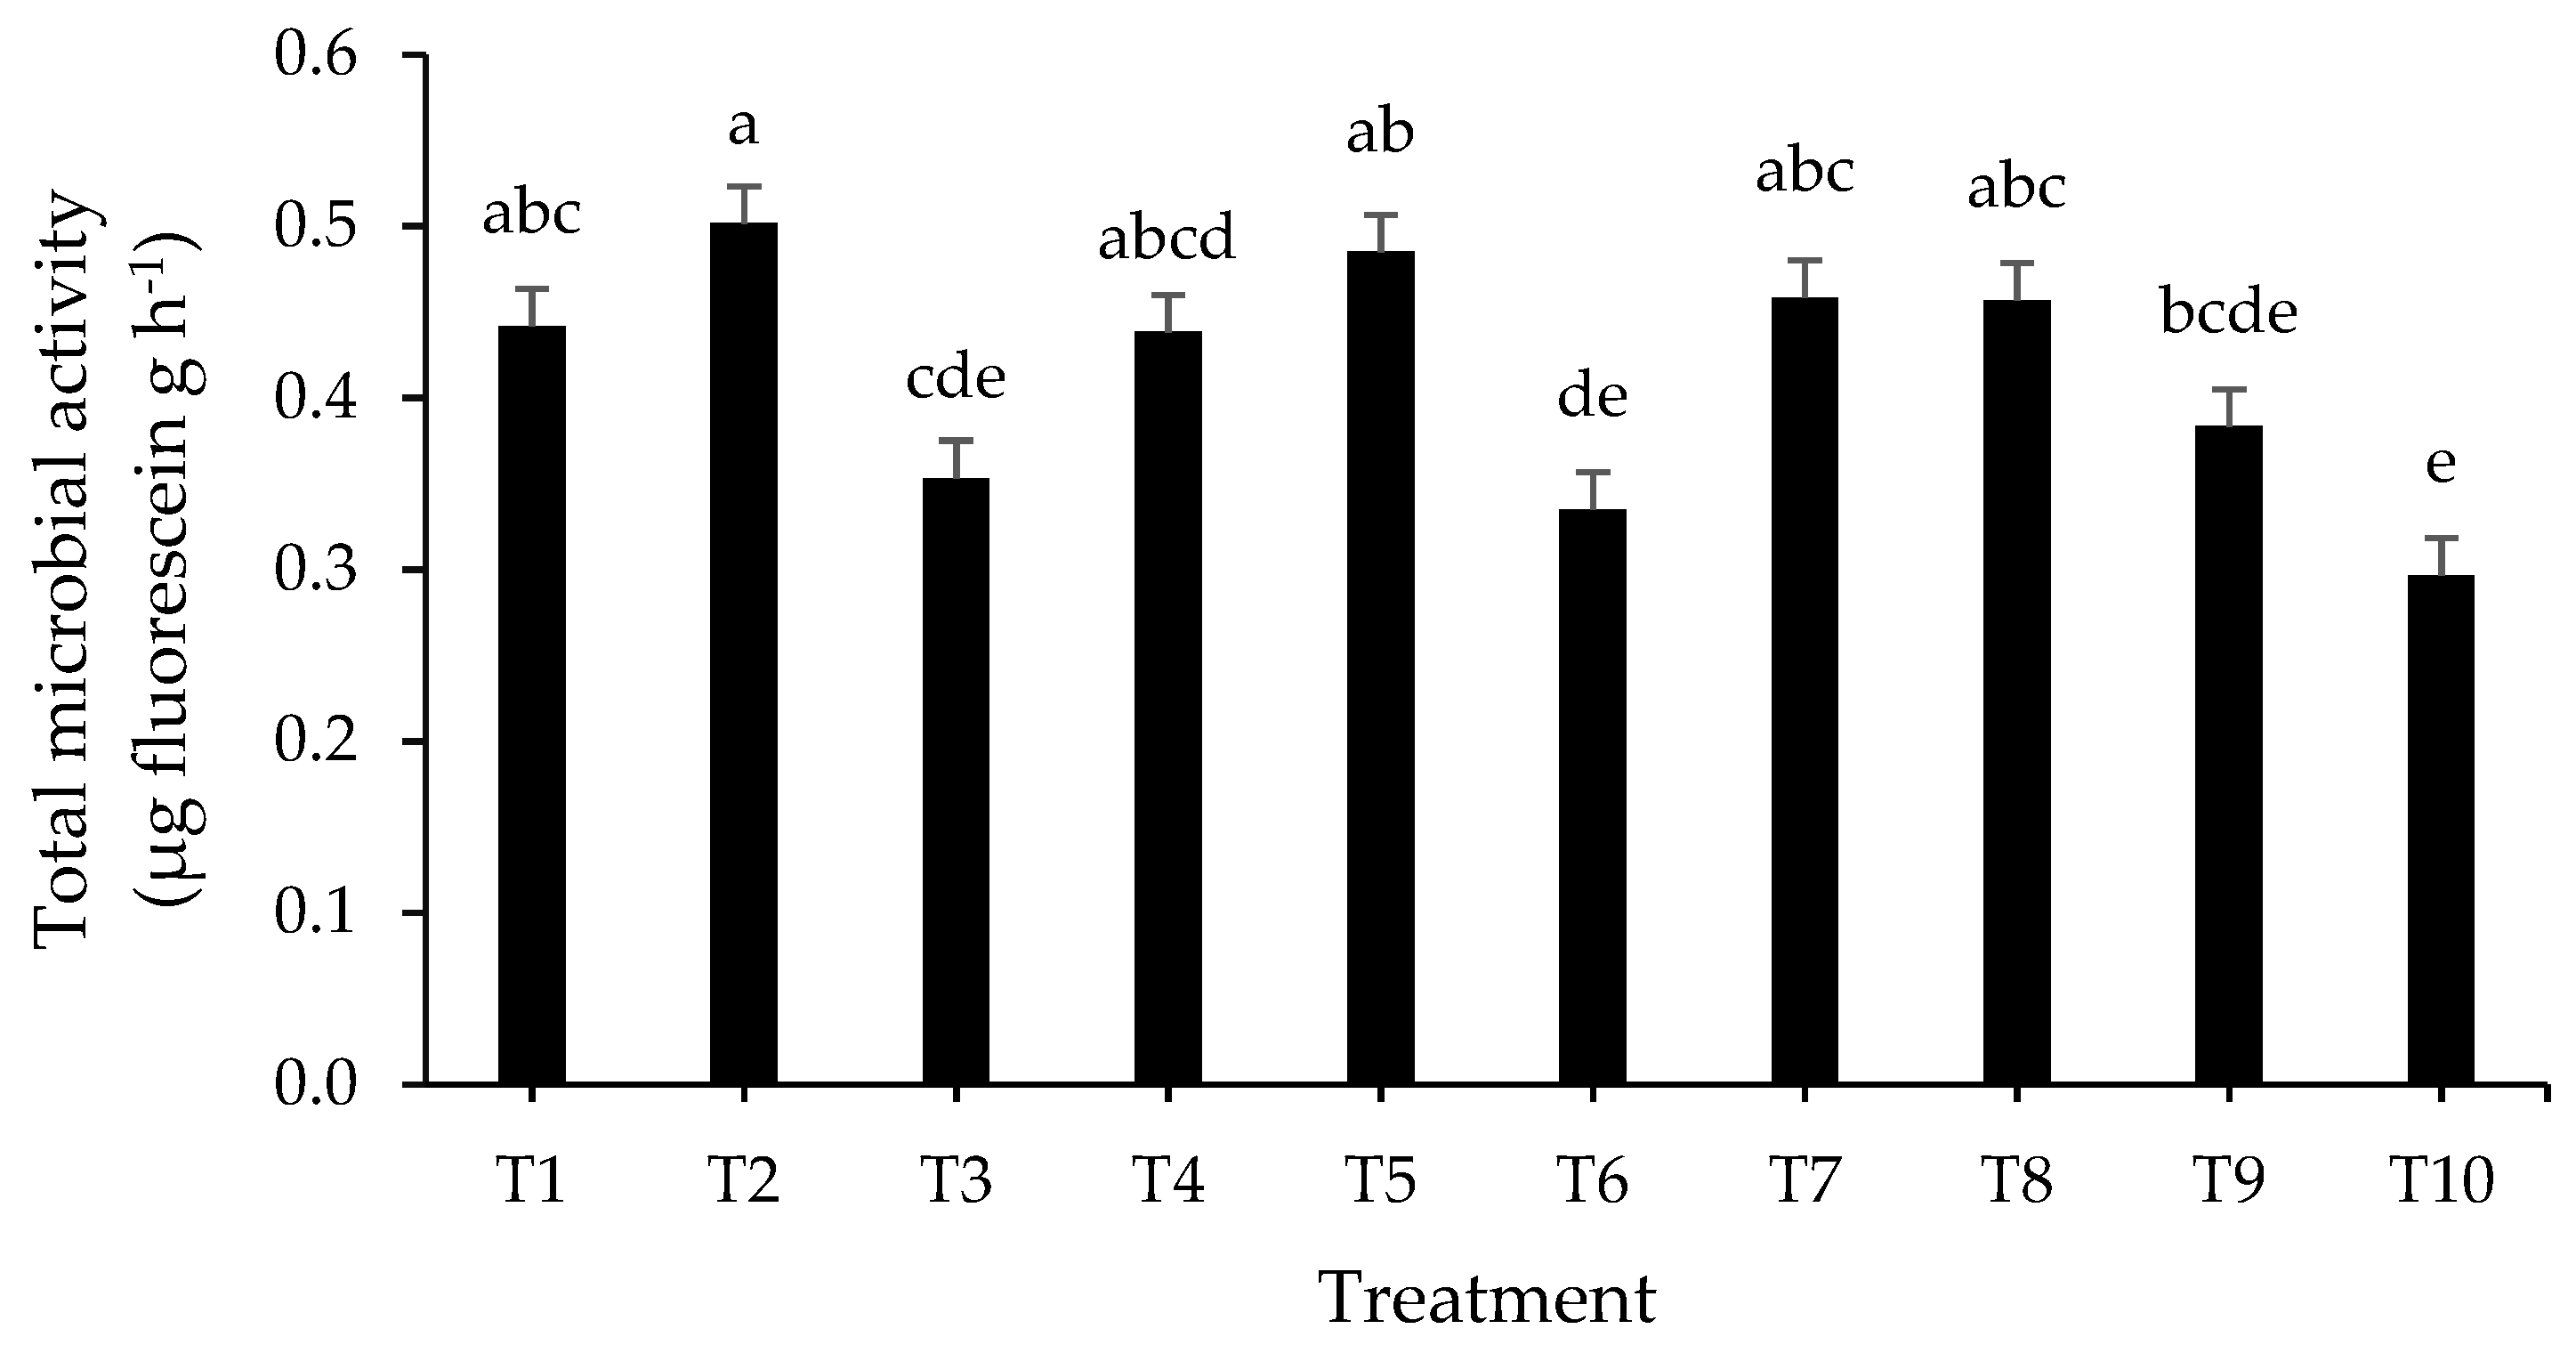
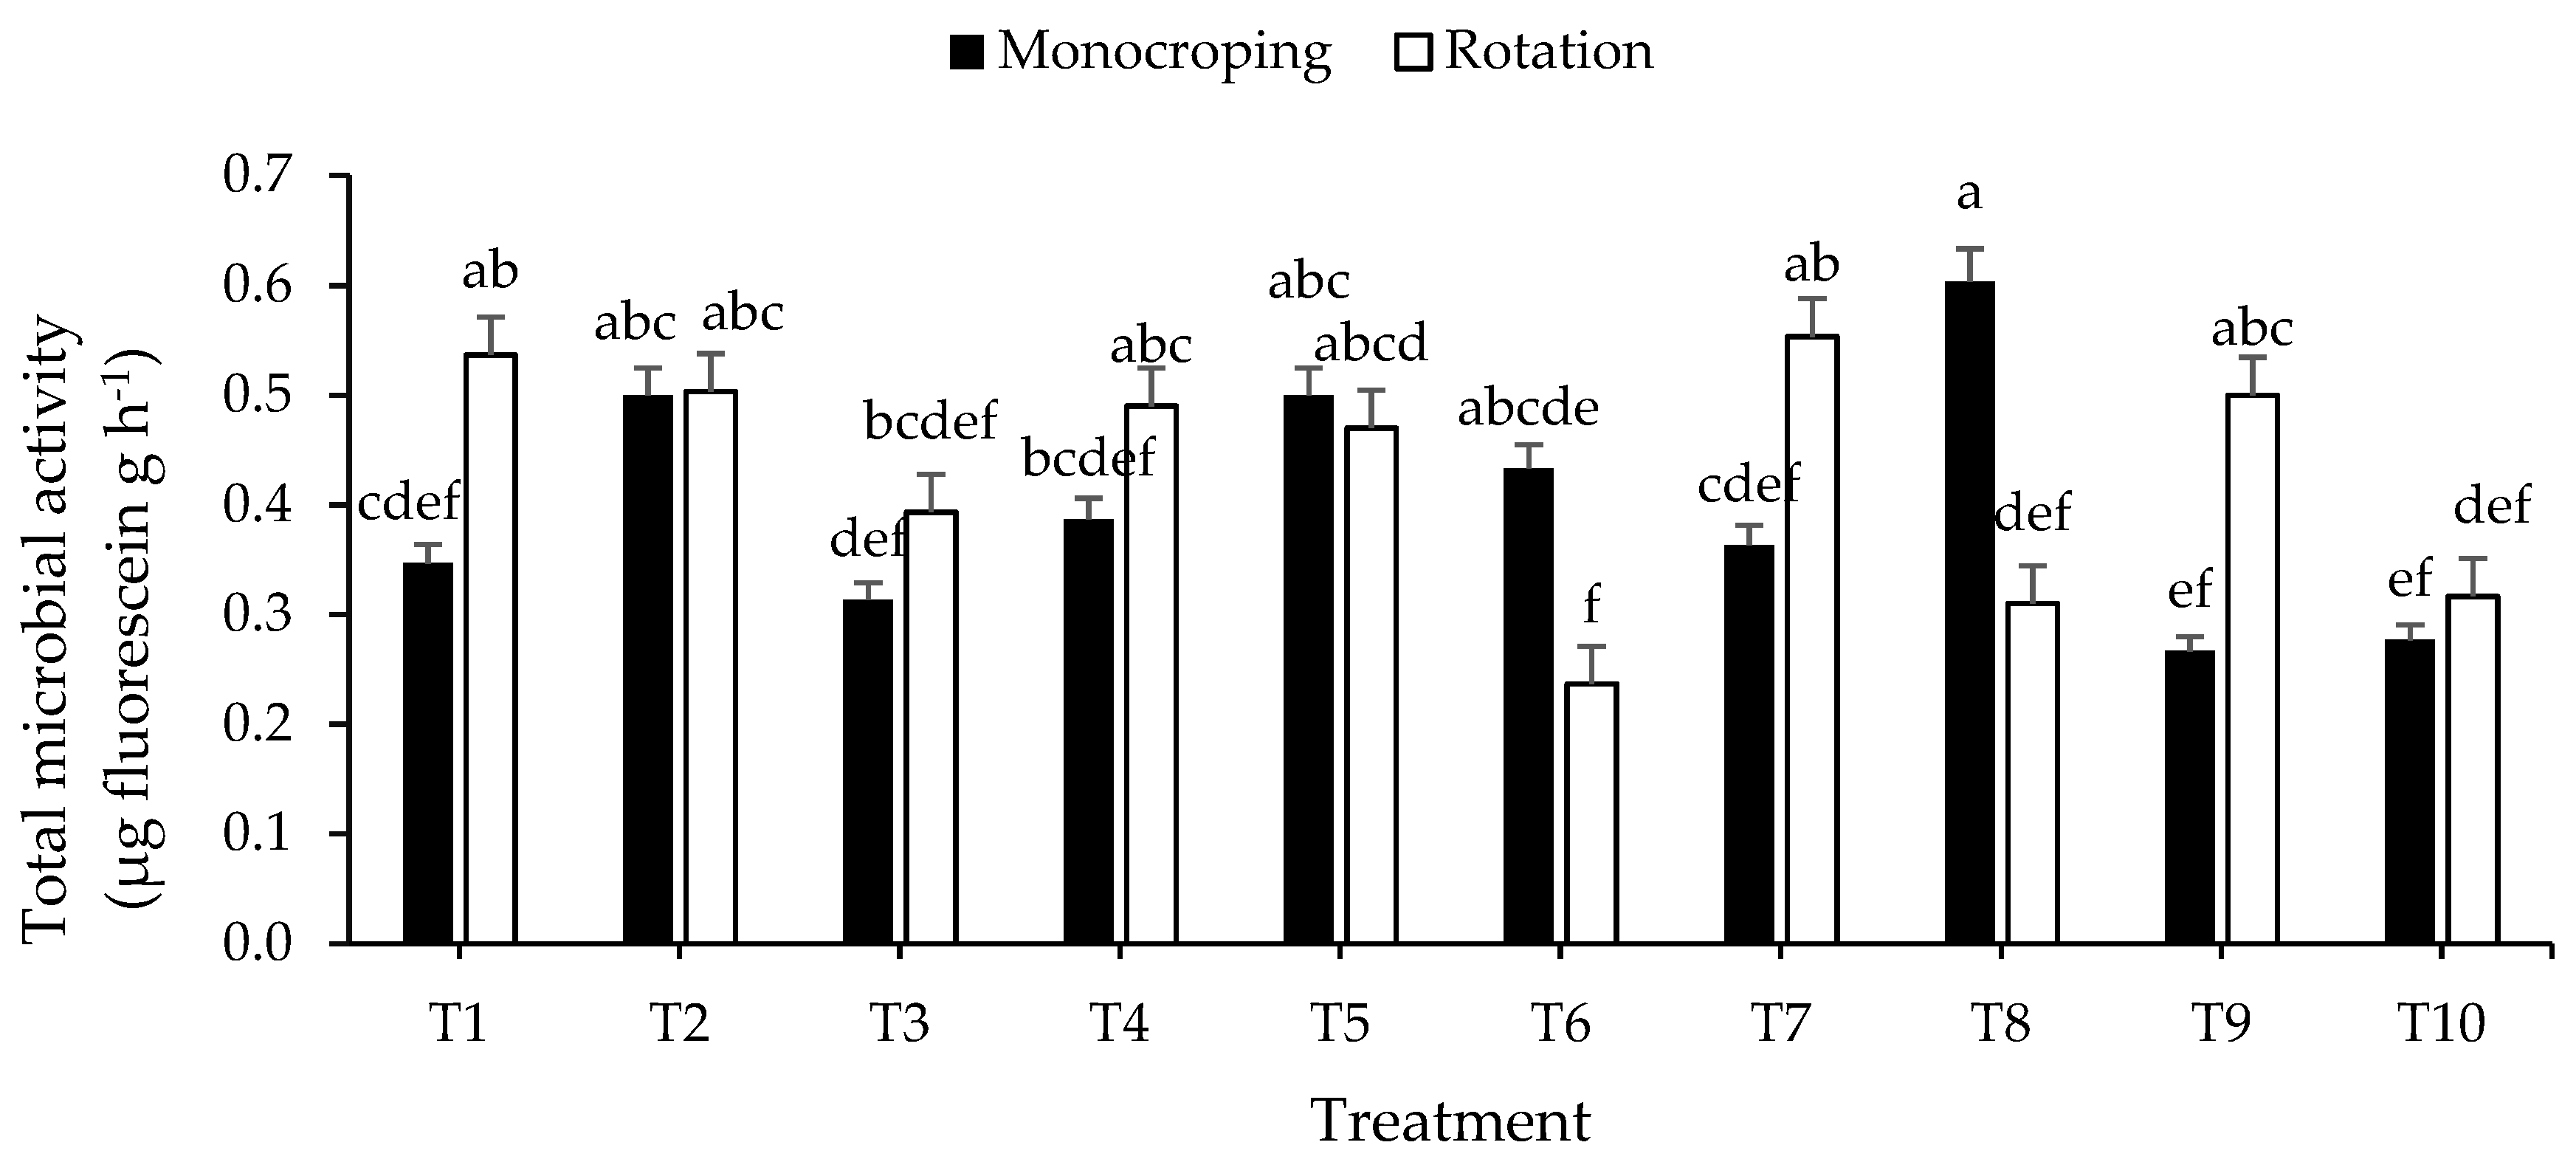
3.2.2. Soil Microbial Activity under Different Treatment and Cropping Systems

Treatment effects on soil total microbial activity reveal highly significant treatment effects (p = 3.314 × 10⁻⁷) classified into two main groups. Treatments T3, T6, and T10 significantly reduced microbial activity as compared to the controls and non-reduced treatments (Figure 6). Treatments that had reduced microbial activity corresponded with treatments that had greater application rates of biochar and/or manure combinations but varied in source and also included combinations of inorganic fertilizer and manure. A trend between the different treatments was not clear.
Treatment–cropping system interactions were highly significant (p = 1.526 × 10⁻⁹). The highest microbial activity occurred due to T8 (i.e., 0.6 µg fluorescein g h−1), which received 50 kg ha−1 NPK, 5 t ha−1 rice husk biochar and 5 t ha−1 cattle manure under millet monocropping (Figure 7).
The lowest microbial activity occurred due to T6 (i.e., 0.24 µg fluorescein g h−1), which received 10 t ha−1 of Typha australis biochar + 5 t ha−1 cattle manure under millet–peanut rotation. While there were many significant differences between treatments by cropping system combinations, few treatments were significantly different from the controls and across the treatments, there was not a consistent trend of one cropping system or the other having a greater effect on microbial activity. Comparing cropping systems alone, microbial activity under absolute control is significantly higher under millet–peanut rotation as compared to the millet monocropping system, while no significant difference in effects is noted between the positive controls between the two cropping systems, which received high levels of inorganic fertilizer.

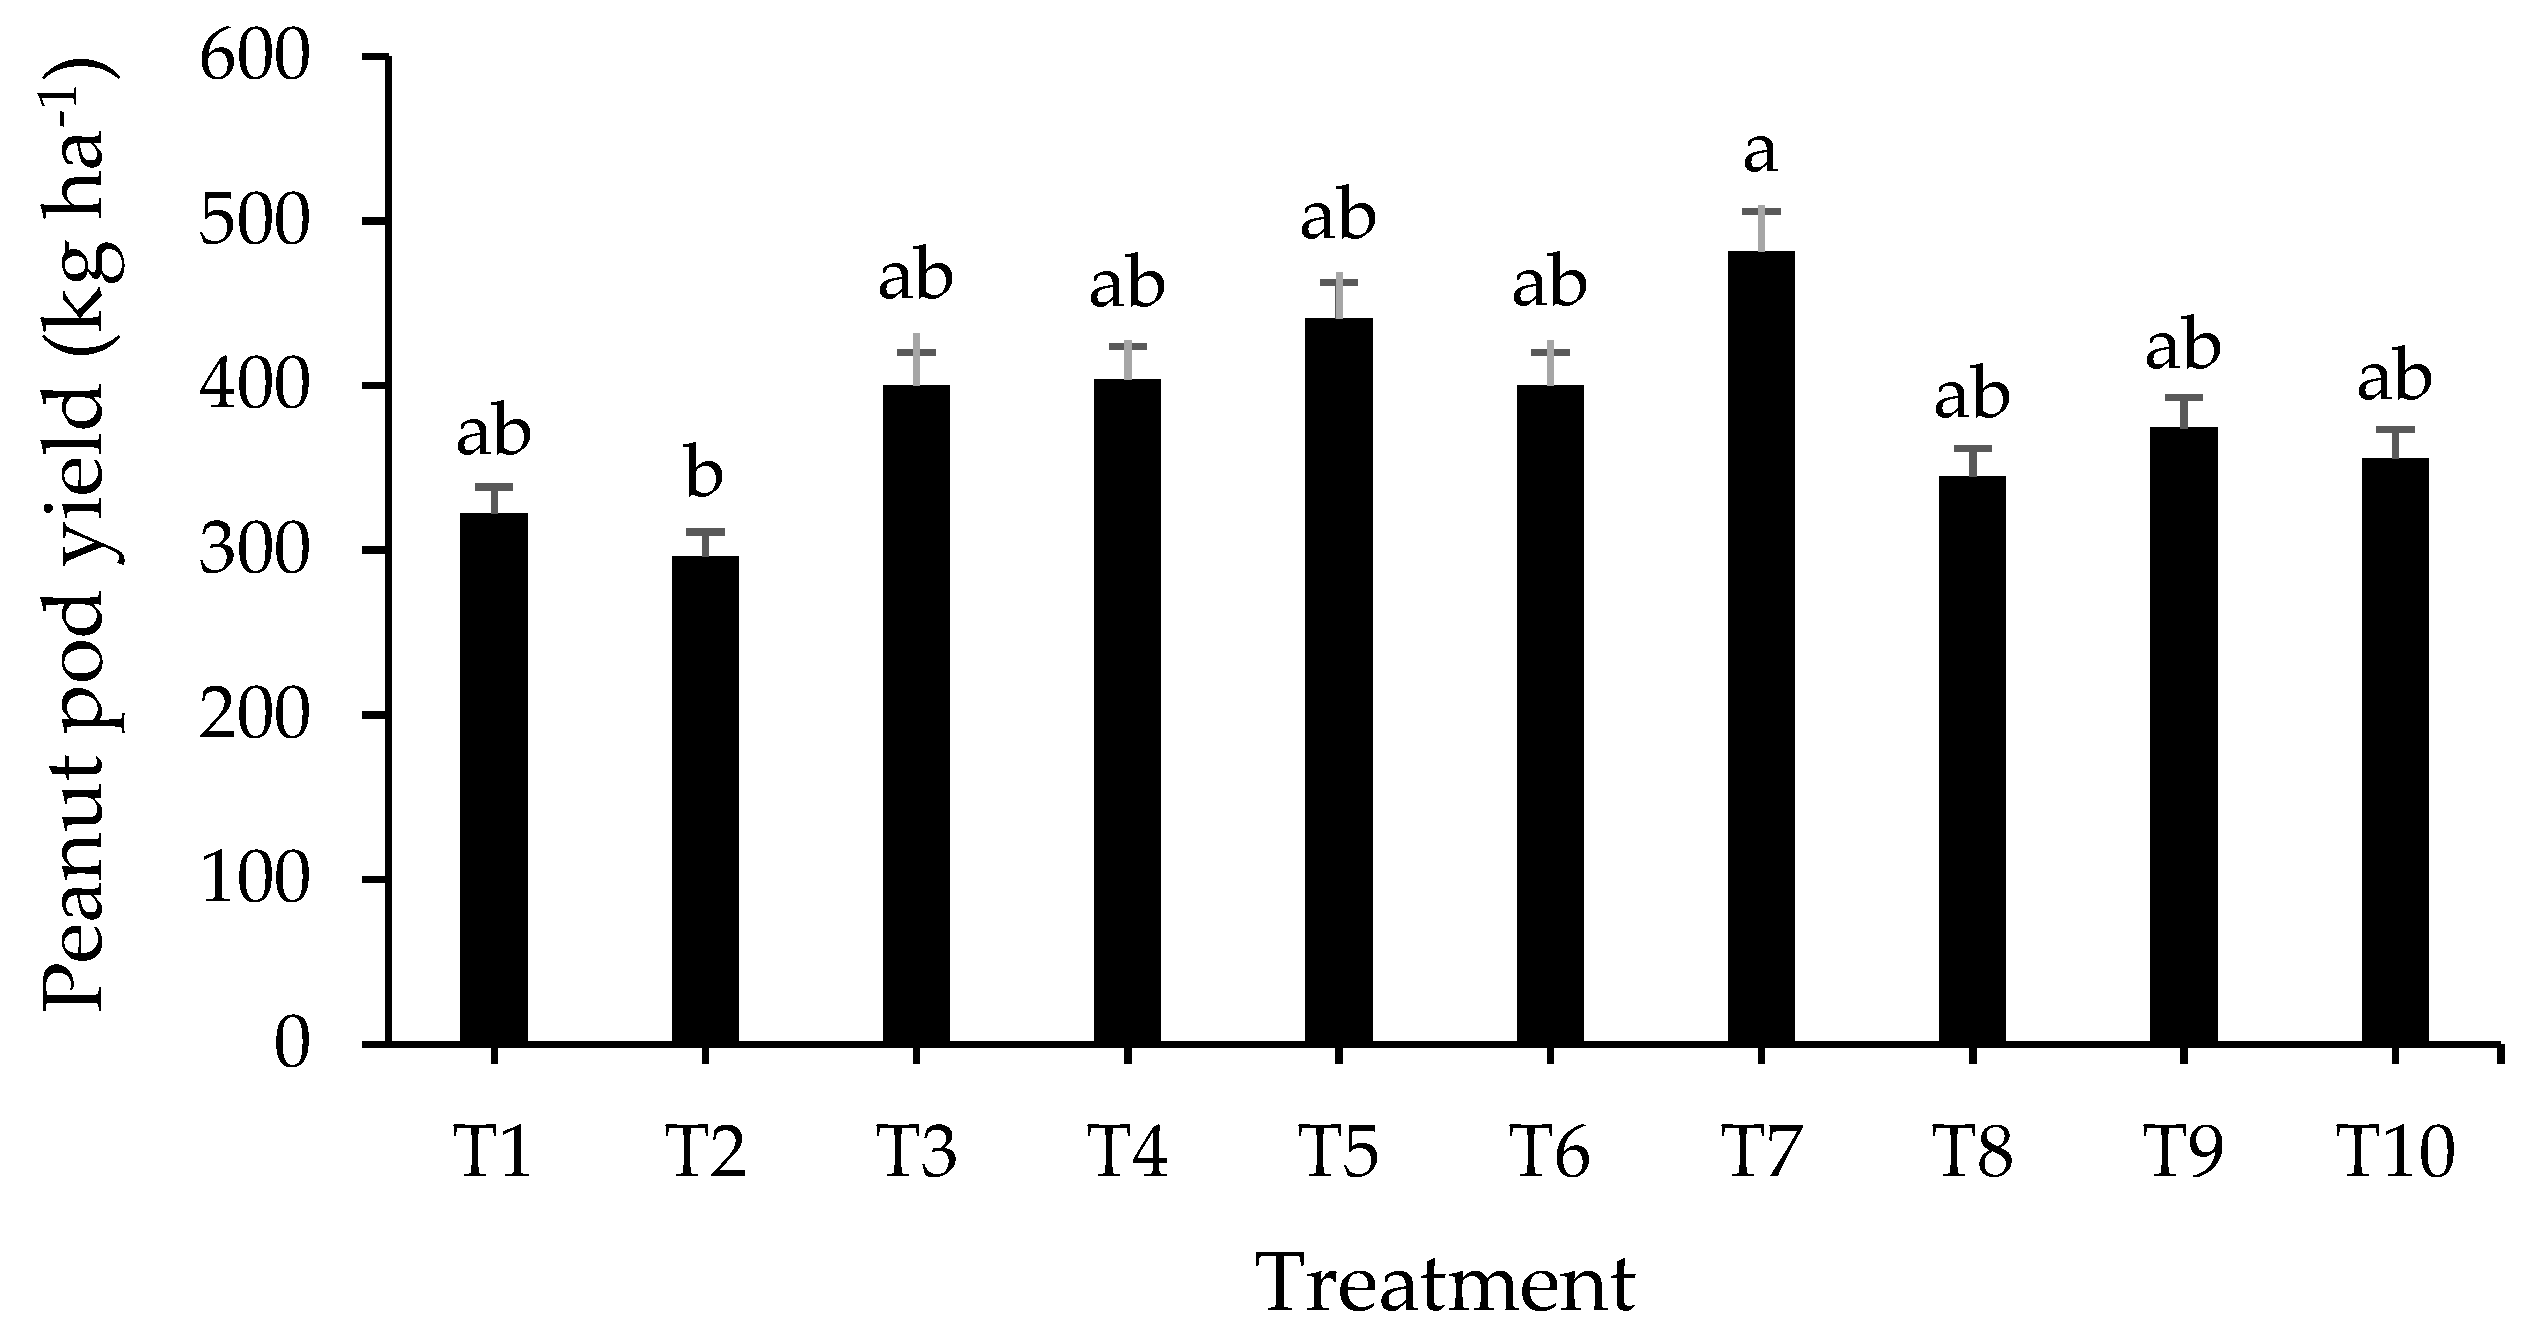
3.2.3. Peanut Pod Yield under the Millet–Peanut Rotation System

Eight years after treatment application, all treatments had non-significant yield increases as compared to the absolute control (Figure 8). Of note, T2, which received the recommended rate of NPK fertilizer alone (i.e., 150 kg ha−1 + 100 kg ha−1 Urea) was not significantly different from the control. However, T7, which received 75 kg ha−1 NPK + 5 t ha−1 of rice husk biochar, had significantly greater peanut pod yields as compared to the positive control, receiving the recommended rate of fertilizer (T2). By reducing the fertilizer rate by 75 kg ha−1 and adding 5 t ha−1 rice husk biochar, the yield increased by 185 kg ha−1, a 63% yield increase.

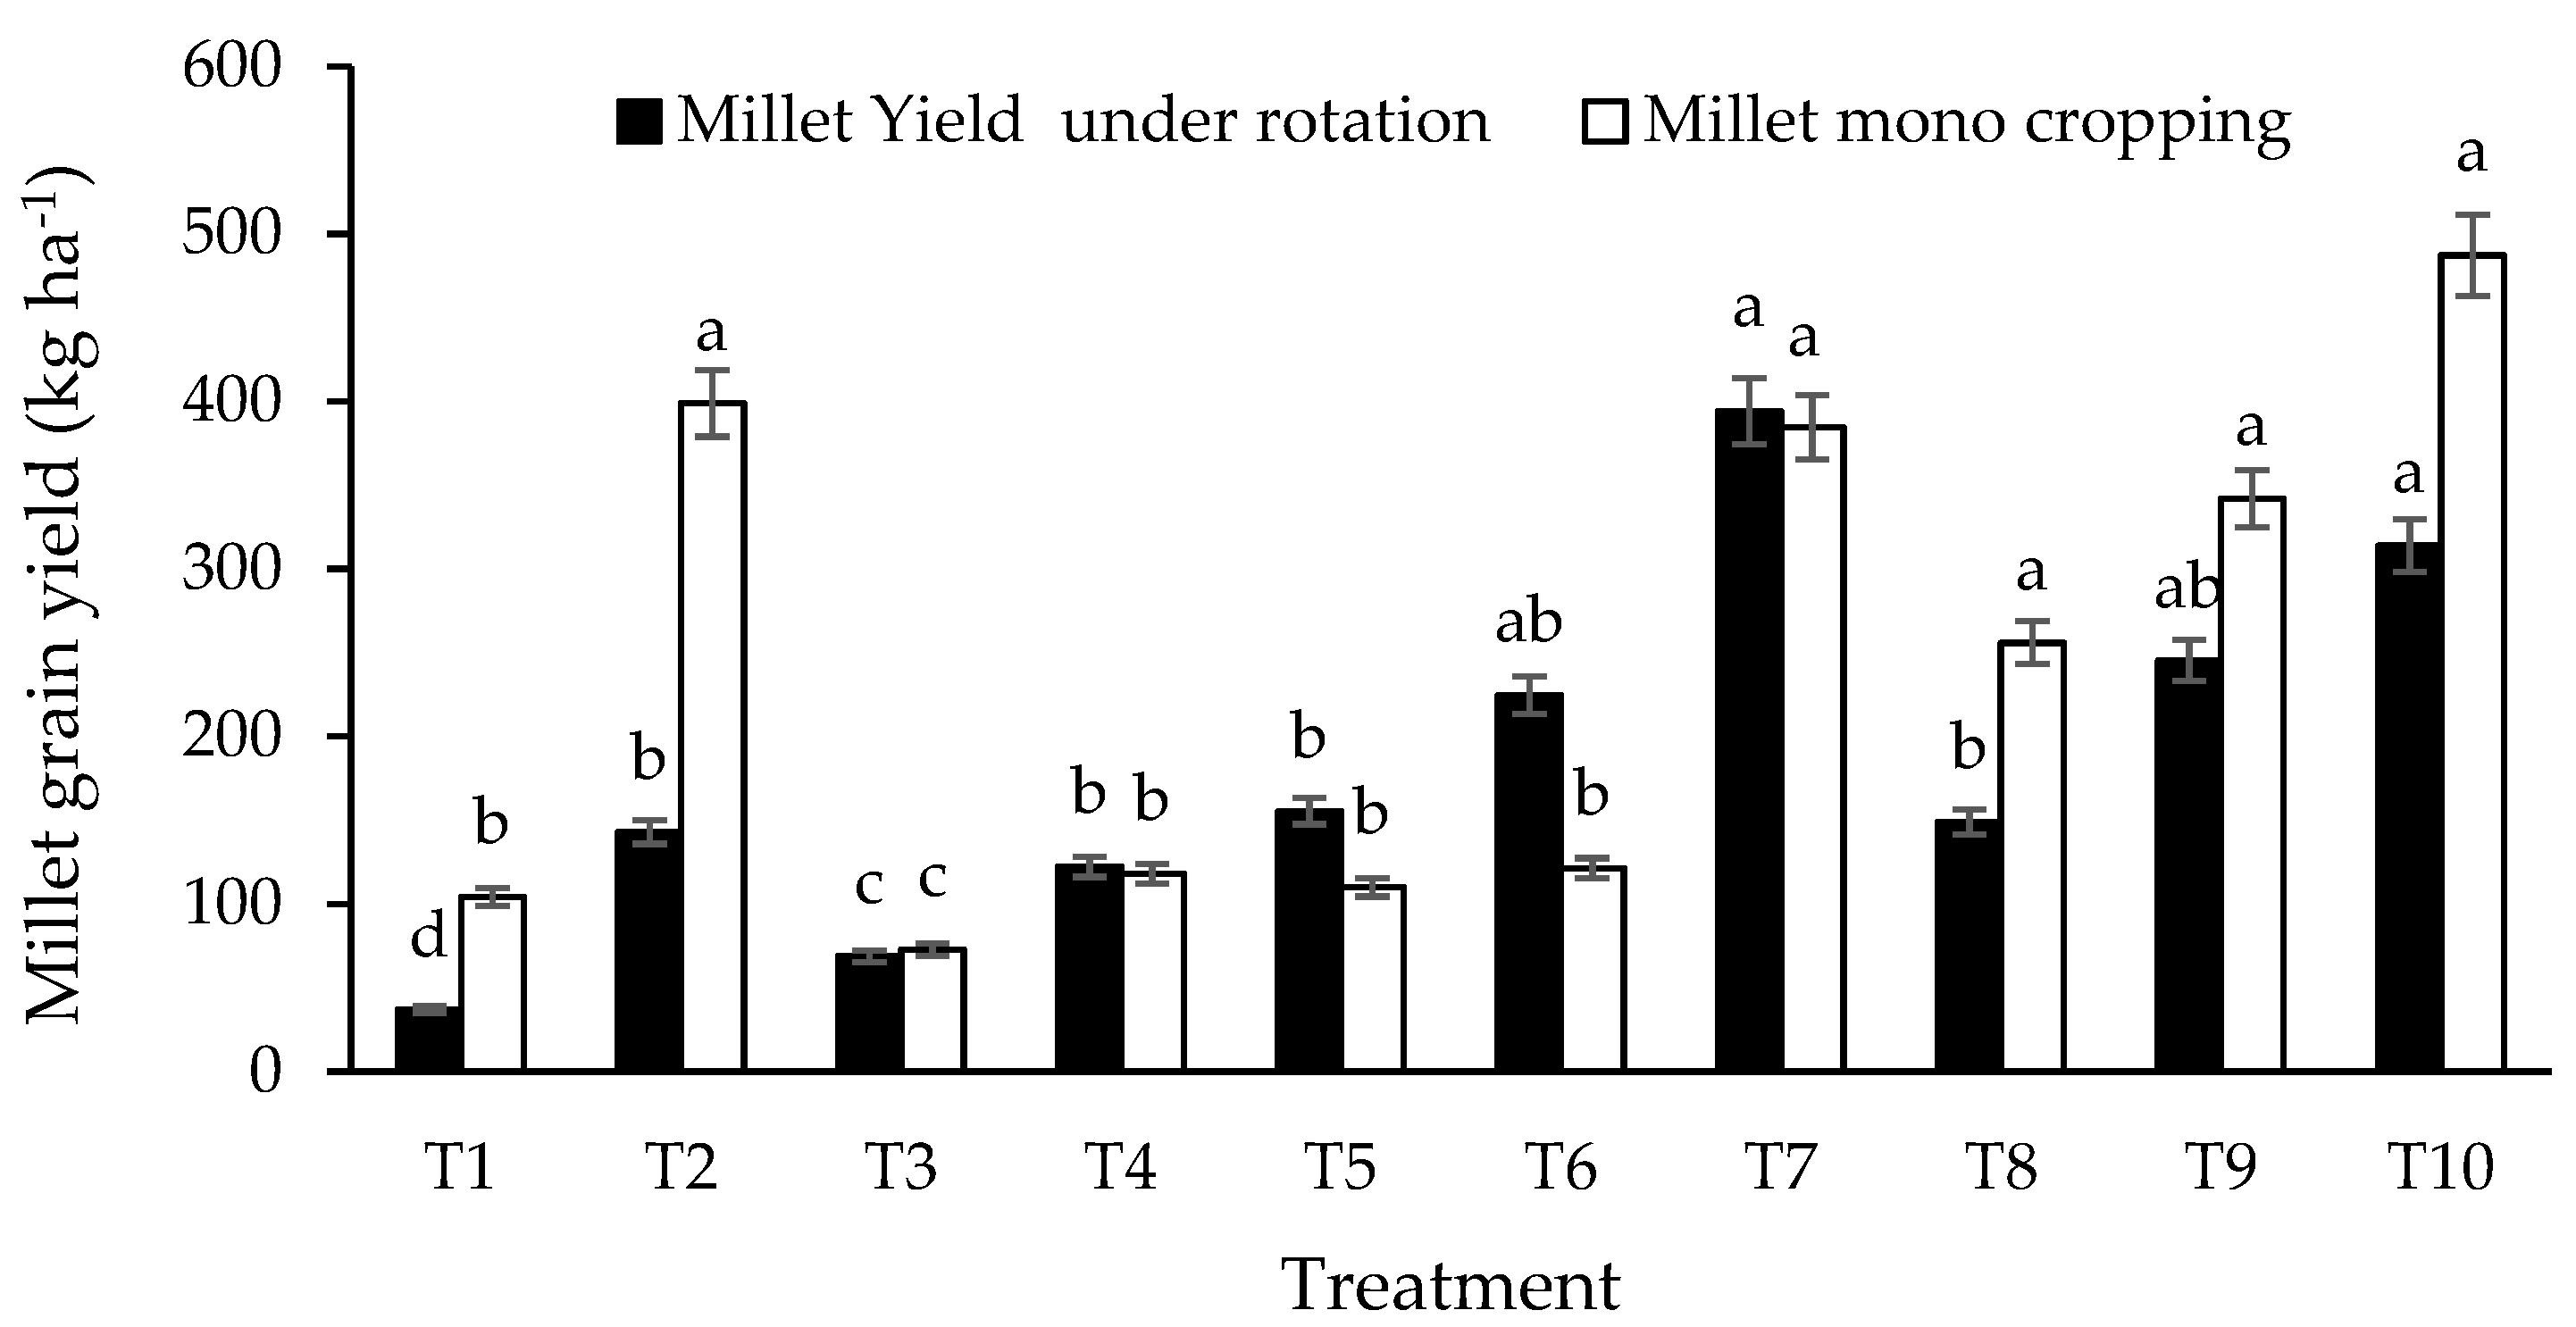
3.2.4. Millet Yield under the Millet Monocropping and Millet–Peanut Rotation Systems

Eight years after treatment application, there were highly significant effects on millet grain yield (p = 7.61 × 10⁻¹²) in the millet monocropping system, which separated into three main groups. Millet grain yield in the absolute control (T1) was 104 kg ha−1 (Figure 9). When biochar or cattle manure were applied on their own (i.e., T4, T5, T6), there was no effect on millet yield in this system and in one case (i.e., T3) there was a significant yield reduction. High rates of inorganic fertilizer application at the national recommended rate of 150 kg ha−1 NPK plus 100 kg ha−1 urea (T2) significantly increased millet grain yield to nearly 400 kg ha−1. Of particular note, this increased yield could be maintained with lower rates of inorganic fertilizer in combination with 5 t ha−1 biochar or 5 t ha−1 cattle manure (i.e., T7-10). Treatment effects on millet yield in rotation with peanut were significant (p ˂ 0.0001). The highest grain yield was obtained under T10 (i.e., 50 kg ha−1 NPK + 33 kg ha−1 Urea + 5 t ha−1 of T. australis Biochar + 5 t ha−1 cattle manure), while the lowest yield was observed under the control (T1). Treatments T4, T5, and T8 gave a similar grain yield, which is significantly lower by 82.54 kg ha−1 than T6 (i.e., 10 t ha−1 of T. australis biochar + 5 t ha−1 cattle manure).

4. Discussion

There was significant impact of various treatments on physical and chemical composition and yield of crops. A single application of biochar at the beginning of experimentation in 2012 significantly increased soil pH up to 6.3 and maintained this increase until 2017 (5 years) before pH began to decline for some treatments (i.e., T6, T10, T8) (Figure 4). Control treatments (i.e., T1 with no fertilizer or organic matter and T2 with full NPK rate alone) maintained the same pH around 5.5. In general, increased application rates of the biochar and/or cattle manure led to increased improvement in pH (pH increased by up to 0.8). There does not appear to be any difference between the sources of biochar material and its effect on soil pH. Both performed well. This reduction in soil acidity is likely due to biochar’s negative surface charge, which buffers acidity in the soil. It is not clear how far increased biochar rates could continue to improve pH in this context, especially without causing tradeoffs with changes in other soil properties. Though rates less than 5 t ha−1 were not tested, it could be assumed that even modest rates of biochar application would incrementally increase pH, especially if applied on a more regular basis; however, singular rates (as applied in this study) of less than 5 t ha−1 would likely not induce a strong enough change in pH to improve crop production. Thus, we believe application rates should not go below 5 t ha−1 to have their intended yield impact when applied in a single application covering at least eight years. Annual applications of less than 5 t ha−1 biochar containing treatments could lead to similar increases in pH; however, this was not tested in this study. Benefits of such application rates could have lasting benefits for at least eight years. This is especially important in the Sudano-Sahelian region of Africa where availability of improved organic materials is limited, in high demand for other uses such as animal feed and open grazing, and is not accessible to all and not able to cover all croplands.
Soil available P was improved by all treatments as compared to the absolute control until 2017 (Figure 4). As expected, annual application of 150 kg ha−1 NPK + 100 kg ha−1 urea led to the greatest improvement in available P in the initial years from 2012 to 2015, but, of particular note, the application of one-third or half of NPK rates in combination with a single application of biochar or manure in 2012 led to similar available P in 2015 and no difference by 2017. The long-term benefit of single applications of biochar or manure treatments are particularly important for resource-constrained farmers who otherwise cannot afford productivity optimized fertilizer recommended rates. Such low levels of organic material amendments in combination with low levels of inorganic fertilizer are more accessible and affordable nutrient management recommendations than high levels of inorganic fertilizer rates alone. This result also highlights that biochar or manure applications may not be needed annually but may still be of equivalent value when applied every six or more years. This is especially important in this region where improved organic materials are limited and are not accessible to cover all crop lands. By 2019, all treatments led to similar declines in P availability even declining past the absolute control especially for treatment with high Thypha australis biochar quantities, which is the consequence of low P in the Typha australis biochar base (Table 2). The overall decline of available P at eight years after application in this study also could be a consequence of the sandy and acid soil, which progressively exacerbates soil P fixation. Biochar is negatively charged and over time the biochar could have fixed more P, making it unavailable.
There was significant impact of cropping systems on available P (Figure 5), where, across all treatment, crop rotation with peanut showed much lower available P. Legumes such as peanut have high protein and oil content in the seeds and require high amounts of P for biological nitrogen fixation, establishment of gynophores, podding, and yield as compared to millet. Therefore, the millet–peanut rotations had low available P in all treatments. This contradicts results of Uzoh et al. [24] and Cissé [23] where increased available P was observed in rotation. This difference could be due to initial P levels [61], soil type, or hot environmental conditions of the SPB that accelerate rapid organic matter mineralization [62].
Soil N was largely unaffected by any of the treatments one year after application in 2013 (Table 4). Only the combination of 5 t ha−1 of Typha australis biochar with 5 t ha−1 cattle manure (T5) improved total soil N in 2013 but was non-significant by 2015. In years 2015 and 2017, a significant decline in soil N was observed for most treatments in years 2015 and 2017, even in the treatments receiving 150 kg ha−1 NPK + 100 kg ha−1 urea. Adding mineral NPK or cattle manure (N content: ~0.2%) to either rice husk or Typha australis biochar reduced total N. A possible explanation for this decline could be linked to mineral N being quickly used by plants or retained by biochar as documented by Häring et al. [63] who found that rice husk particularly may retain N. This assumption also aligns with Herrmann et al. [64] who observed declining N under rubber trees in Thailand in contrast to the other nutrients due to biochar amendments. N content has also been shown to decrease with biochar application as N is retained on biochar due to its sorption properties [65]. However, since the high mineral fertilizer treatments also reduced soil N, this decline does not appear to be driven by biochar.
Deforestation led to a sharp reduction in soil organic matter and land degradation in Sub-Saharan Africa (SSA) [1]. Soil organic C is the top priority for (SSA) soil fertility restoration [25] and is a good indicator for soil health. Its depletion results in reduced nutrient-use efficiency and water-holding capacity [66]. Long-term approaches that build organic matter (OM) and organic nutrient pools, in addition to inorganic fertilizer applications, will likely be an essential component to achieving sustainable soil fertility in SSA [67]. Total soil C increased due to all treatments including organic materials the first year after application in 2013 and maintained such increases due to a single organic material application through 2017 (Table 4). The treatments that included organic materials (i.e., T3-10) increased total C from 1.84% to on average 2.69%, an increase of 0.85% that was sustained over six years. The increase in total C was likely largely due to the addition of C from the rice husk biochar (0.1% C; 2% OM), Thypha australis biochar (0.9% C; 3% OM), and cattle manure (13% C). The increase in total C was relatively stable over the study period and did not decline after six years after application. This is consistent with Pieri [68]. Additionally, the positive control T2, which received the high inorganic fertilizer rate alone, did not increase total C in 2013 but did lead to significant increases in total C in 2015 and 2017. This may have been due to greater crop production and the corresponding greater root biomass due to T2 drawing in more total C to the soil over time [69]. These results highlight that inorganic fertilizer can contribute to increasing soil C and soil health, especially when applied in combination with organic materials. Of particular importance, this 0.85% increase in total C, which is stable for at least six years, has the potential to sequester 27.2 tons C ha−1. If scaled across Senegal’s 1.6 to 2.0 ha of groundnut and millet cropland, this practice could sequester 43.52 to 54.4 million tons of C, having mutual benefits on crop productivity and climate change mitigation.
The treatment effects on soil microbial activity were mixed and there was no clear trend (Figure 6 and Figure 7). In general, treatments that had greater application rates of biochar and/or manure combinations corresponded with lower soil microbial activity (T6, T3, T10). However, the sources varied. Of particular note, microbial activity for the absolute control is significantly higher under millet–peanut rotation as compared to the millet monocropping system. When inorganic fertilizer was applied at the national recommended rate alone (T2) there was no significant difference between the two cropping systems. Increased species diversity in the cropping system had greater soil microbial activity. The suppression of microbial activity due to the application of organic materials, as observed in this study, contradicts many others [70,71,72,73], which conclude there is a beneficial effect of combining organic and mineral fertilizer on soil microbial activity. These differential responses may be due to extremely poor physical and chemical properties of the soils and the initial or baseline microbial diversity and quantities (which were not measured in the study). Further targeted studies are required to understand the impact of various organic and inorganic amendments on such poor soil.
This study highlights the extremely low yields of millet production in Senegal even when high rates of inorganic fertilizer are applied. Under no nutrient management treatment did yields cross 500 kg ha−1 (Figure 9). Though grain yields increased nearly five times as compared to the absolute control, the profit–cost ratio does not justify application of high rates of inorganic fertilizer alone. Millet grain yields were significantly and positively impacted by the treatments. After eight years, moderate levels of application of biochar or manure along with moderate application of inorganic fertilizer still had benefits on crop yields. However, the application of organic materials alone, either biochar alone or biochar in combination with manure, did not have lasting improvement on grain yield. This result highlights the importance of combining both inorganic and organic materials for nutrient management in West Africa [74,75,76,77], especially in order to obtain economically viable returns to inorganic fertilizer application [78]. Organic materials are in low supply in Sudano-Sahelian cropping systems and have high demand for their use for other purposes. Thus, approaches that increase the efficiency of organic materials concerning sustaining their benefits in cropping systems are most pressing. Peanut yields were relatively unchanged due to any treatment including the high rates of inorganic fertilizer application. There is need for further evaluation of other yield-limiting factors for peanut production as peanut pod production had limited response to nutrient management approaches.

5. Conclusions

This study clearly shows that the long-term benefits of organic amendments is much more than additive in such systems and is critical to the efficiency and economic returns of nutrient management for resource-constrained farmers. Singular, low-rate organic materials in combination with low levels of inorganic fertilizer can have sustained benefits for at least eight years. While inorganic applications alone could induce significant increases in grain yield, it was not efficient and would not be considered suitable for resource-constrained farmers. Though few would argue against the benefit of utilizing organic materials in such systems, organic materials in West Africa are in low supply and are in high demand for other uses, especially livestock feed. Thus, methods that improve their efficiency in combination with inorganic fertilizer application are urgently needed. Even low levels of organic material amendments applied once every six or more years can still provide long lasting benefits for at least eight years. While biochar appears to be a suitable organic material to incorporate with inorganic fertilizer, there is still a need to consider the feedstock materials’ quality and determine if the biochar process itself increased the efficiency of the source material. For example, would there be any difference between the application of the rice husk or Typha australis residues at the rates equivalent to what was used to produce the biochar? Moreover, of particular importance, the average 0.85% increase in total C due to the biochar treatments, has the potential to sequester 27.2 tons C ha−1, which we show to be stable in the soil for at least six years. In the 1.6 to 2.0 million ha of groundnut and millet cropland of Senegal, this practice could sequester 43.52 to 54.4 million tons of C, having mutual benefits on crop productivity and climate change mitigation. Though it would be assumed that not all of this material would be utilized for biochar production as there are other uses, this quick calculation shows that biochar is a feasible and scalable approach to valorize low value residues produced in Senegal.

Author Contributions

Conceptualization: A.F., C.-T.E., K.D. and D.K.K.G.; methodology: A.F., C.-T.E., K.D. and D.K.K.G.; formal analysis: A.F., K.D., T.M.A., D.K.K.G. and Z.P.S.; data curation: A.F., K.D., T.M.A., D.K.K.G., D.F. and Z.P.S.; writing—original draft preparation: A.F.; writing—review and editing: A.F., Z.P.S. and P.V.V.P.; supervision: P.V.V.P. and Z.P.S.; project administration: A.F.; and funding acquisition: A.F., Z.P.S. and P.V.V.P. All authors have read and agreed to the published version of the manuscript.

Funding

Initial implementation and following up was funded by the West Africa Agricultural Programme (WAAPP 2 2011_2016) Manuscript preparation was made possible with the support of the American People provided to the Feed the Future Innovation Lab for Sustainable Intensification through the United States Agency for International Development (USAID) under Cooperative Agreement No. AID-OAA-L-14-00006. The contents are the sole responsibility of the authors and do not necessarily reflect the views of USAID or the United States Government or Kansas State University or other Organizations who funded or supported this research.

Institutional Review Board Statement

Not applicable.

Informed Consent Statement

Not applicable.

Data Availability Statement

Data available upon request from the corresponding author.

Acknowledgments

Contribution number 22-106-J Kansas Agricultural Experiment Station.

Conflicts of Interest

The authors declare no conflict of interest. The funders had no role in the design of the study; in the collection, analyses, or interpretation of data; in the writing of the manuscript, or in the decision to publish the results.

References

  1. Affholder, F.; Poeydebat, C.; Corbeels, M.; Scopel, E.; Tittonell, P. The yield gap of major food crops in family agriculture in the tropics: Assessment and analysis through field surveys and modelling. Field Crop. Res. 2013, 143, 106–118. [Google Scholar] [CrossRef] [Green Version]
  2. Diagana, B.; Mankor, A.; Fall, C.S.; Guèye, A. Agriculture Durable et Réduction de la Pauvreté dans le Bassin Arachidier du Sénégal: Résultats du Modèle Analyse Tradeoffs; ISRA: Dakar, Senegal, 2008; p. 43. ISSN 0850-0711. [Google Scholar]
  3. Diangar, S.; Fofana, A.; Diagne, M.; Yamoah, C.F.; Dick, R.P. Pearl millet-based intercropping systems in the semiarid areas of Senegal. Afric. Crop Sci. J. 2004, 12, 133–139. [Google Scholar] [CrossRef]
  4. Fall, A.; Lo, M. Etude de Référence sur les Céréales: Mil, Sorgho, Maìs, et Fonio au Sénégal; CORAF/WECARD: Sénégal, 2009. [Google Scholar]
  5. Gaudreau, K.; Gibson, R.B. Sustainability assessment of the agricultural and energy systems of Senegal. Energies 2015, 8, 3503–3528. [Google Scholar] [CrossRef] [Green Version]
  6. Manley, R. Etude de la Dynamique de Quelques Compartiments Organiques sur un Terroir Agropastoral de Haute CASAMANCE, Sénégal. Rapport D’avancement de Première Année de Thèse; ORSTOM: Paris, France, 1997; p. 52. [Google Scholar]
  7. Vayssières, J.; Thévenot, A.; Vigne, M.; Cano, M.; Broc, A.; Bellino, R.; Diacono, E.; De Laburthe, B.; Bochu, J.L.; Tillard, E.; et al. Evaluation des inefficiences zootechnique et environnementale pour intensifier écologiquement les systèmes d’élevage tropicaux. Revue Élev. Méd. Vét. Pays Trop. 2012, 64, 73–79. [Google Scholar] [CrossRef] [Green Version]
  8. Manlay, R.J.; Cadet, P.; Thioulouse, J.; Chotte, J.-L. Relationships between abiotic and biotic soil properties during fal- low periods in the sudanian zone of Senegal. Appl. Soil Ecol. 2000, 14, 89–101. [Google Scholar] [CrossRef]
  9. Sarr, M.; Agbogba, C.E.; Russell-Smith, A.; Masse, D. Effects of soil faunal activity and woody shrubs on water infiltration rates in a semi-arid fallow of Senegal. Appl. Soil Ecol. 2001, 16, 283–290. [Google Scholar] [CrossRef]
  10. Traoré, H.; Barro, A.; Yonli, D.; Stewart, Z.P.; Prasad, P.V.V. Water conservation methods and cropping systems for increased productivity and economic resilience in Burkina Faso. Water 2020, 12, 976. [Google Scholar] [CrossRef] [Green Version]
  11. Diatta, A.A.; Ndour, N.; Manga, A.; Sambou, B.; Faye, C.S.; Diatta, L.; Dieng, S.D. Ecosystem services of Cordyla pinnata (Lepr. ex A. Rich.) Milne-Redh agroforestry parkland of Senegal’s South Peanut Basin. Int. J. Biol. Chem. Sci. 2016, 10, 2511–2525. [Google Scholar] [CrossRef] [Green Version]
  12. The World Bank. Population Growth (Annual %). 2018. Available online: https://data.worldbank.org/indicator/SP.POP.GROW?locations=SN (accessed on 24 January 2019).
  13. FAOSTAT. Food and Agriculture Organization-Crop Statistics. 2021. Available online: http://www.fao.org/faostat/en/#data/QC (accessed on 15 August 2021).
  14. Tittonell, P.; Giller, K.E. When yield gaps are poverty traps: The paradigm of ecological intensification in African smallholder agriculture. Field Crops Res. 2013, 143, 76–90. [Google Scholar] [CrossRef] [Green Version]
  15. Faye, A. Présentation de la Chaine de Valeur Arachide; CEPOD: Dakar, Sénégal, 2009; p. 8. [Google Scholar]
  16. MAE. La Culture et la Production du mil et du Sorgho au Sénégal: Bilan-Diagnostic et Perspectives; Ministere De L’agriculture Et De L’elevag: Dakar, Senegal, 2001; 130p.
  17. Tounkara, A.; Clermont-Dauphin, C.; Affholder, F.; Ndiaye, S.; Masse, D.; Cournac, L. Inorganic fertilizer use efficiency of millet crop increased with organic fertilizer application in rainfed agriculture on smallholdings in central Senegal. Agric. Ecosyst. Environ. 2020, 294, 106878. [Google Scholar] [CrossRef]
  18. Lericollais, A.; Warniez, P. Les terroirs africains, approche renouvelée par l’emploi du SIG. MappeMonde 1993, 2, 31–36. [Google Scholar]
  19. Wortmann, C.S.; Sones, K. (Eds.) Fertilizer Use Optimization in Sub-Saharan Africa; CABI: London, UK, 2017. [Google Scholar] [CrossRef] [Green Version]
  20. Vanlauwe, B.; Kihara, J.; Chivenge, P.; Pypers, P.; Coe, R.; Six, J. Agronomic use efficiency of N fertilizer in maize-based systems in sub-Saharan Africa within the context of integrated soil fertility management. Plant Soil 2011, 339, 35–50. [Google Scholar] [CrossRef]
  21. Garba, M.; Serme, I.; Maman, N.; Ouattara, K.; Gonda, A.; Wortmann, C.S.; Mason, S.C. Crop response to manure plus fertilizer in Burkina Faso and Niger. Nutr. Cycl. Agroecosyst. 2018, 111, 175–188. [Google Scholar] [CrossRef]
  22. Sanchez, P.; Shepherd, K.D.; Soule, M.J.; Place, F.M.; Buresh, R.J.; Izac, A.-M.N.; Mokwunye, A.U.; Kwesiga, F.R.; Ndiritu, C.G.; Woomer, P.L. Soil Fertility Replenishment in Africa: An Investment in Natural Resource Capital. In Replenishing Soil Fertility in Africa; Soil Science Society of America: Madison, WI, USA; American Society of Agronomy: Madison, WI, USA, 1997; Volume 51, pp. 1–46. [Google Scholar] [CrossRef]
  23. Cissé, L. Etude des Effets d’apport de Matière Organique sur les Bilans Hydriques et Minéraux et la Production du mil et de l’arachide sur un sol Sableux Dégradé du Centre-Nord du Sénégal. Ph.D. Thesis, Université INPL, Nancy, France, 1986; 184p. [Google Scholar]
  24. Uzoh, I.M.; Igwe, C.A.; Okebalama, C.B.; Babalola, O.O. Legume-maize rotation effect on maize productivity and soil fertility parameters under selected agronomic practices in a sandy loam soil. Sci. Rep. 2019, 9, 8539. [Google Scholar] [CrossRef] [Green Version]
  25. Stewart, Z.P.; Pierzynski, G.M.; Middendorf, B.J.; Prasad, P.V.V. Approaches to improve soil fertility in sub-Saharan Africa. J. Exp. Bot. 2020, 71, 632–641. [Google Scholar] [CrossRef] [Green Version]
  26. Sultan, B.; Lalou, R.; Amadou Sanni, M.; Oumarou, A.; Soumaré, M.A. (Eds.) Les Sociétés Rurales Face aux Changements Climatiques et Environnementaux en Afrique de L’Ouest; IRD: Marseille, France, 2015; pp. 403–427. ISBN 978-2-7099-2146-6. [Google Scholar]
  27. Stewart, Z.P.; Middendorf, B.J.; Musumba, M.; Grabowski, P.; Palm, C.; Snapp, S.; Prasad, P.V.V. Feed the Future Innovation Lab for Collaborative Research on Sustainable Intensification; Kansas State University: Manhattan, KS, USA, 2018; Available online: https://www.sitoolkit.com (accessed on 21 January 2021).
  28. Wortmann, C.; Amede, T.; Bekunda, M.; Kome, C.; Masikati, P.; Ndungu-Magiroi, K.; Snapp, S.; Stewart, Z.P.; Westgate, M.E.; Zida, Z. Improvement of smallholder farming systems in Africa. Agron. J. 2020, 112, 5325–5333. [Google Scholar] [CrossRef]
  29. Malyan, S.K.; Kumar, S.S.; Fagodiya, R.K.; Ghosh, P.; Kumar, A.; Singh, R.; Singh, L. Biochar for environmental sustainability in the energy-water-agroecosystem nexus. Renew. Sustain. Energy Rev. 2021, 149, 111379. [Google Scholar] [CrossRef]
  30. Mona, S.; Malyan, S.K.; Saini, N.; Deepak, B.; Pugazhendhi, A.; Kumar, S.S. Towards sustainable agriculture with carbon sequestration, and greenhouse gas mitigation using algal biochar. Chemosphere 2021, 275, 129856. [Google Scholar] [CrossRef]
  31. Khaled, A.; Schoenau, R. Addition of biochar to a sandy desert soil: Effect on crop growth, water retention and selected properties. Agronomy 2019, 9, 327. [Google Scholar] [CrossRef] [Green Version]
  32. Atkinson, C.J.; Fitzgerald, J.D.; Hipps, N.A. Potential mechanisms for achieving agricultural benefits from biochar application to temperate soils: A review. Plant Soil 2010, 337, 1–18. [Google Scholar] [CrossRef]
  33. Lehmann, J.; Rillig, M.C.; Thies, J.; Masiello, C.A.; Hockaday, W.C.; Crowley, D. Biochar effects on soil biota—A review. Soil Biol. Biochem. 2011, 43, 1812–1836. [Google Scholar] [CrossRef]
  34. Husk, B.; Major, J. Le biochar comme amendement du sol au Québec: Résultats agronomiques de quatre ans d’essais terrain. CRAAQ J. Inf. Sci. 2012, 30–31. Available online: https://www.agrireseau.net/agroenvironnement/documents/Major.pdf (accessed on 14 August 2021).
  35. Mukherjee, A.; Lal, R. Biochar impacts on soil physical properties and greenhouse gas emissions. Agronomy 2013, 3, 313–339. [Google Scholar] [CrossRef] [Green Version]
  36. Sohi, S.P.; Krull, E.; Lopez-Capel, E.; Bol, R. A review of biochar and its use and function in soil. Adv. Agron. 2010, 105, 47–82. [Google Scholar] [CrossRef]
  37. Biederman, L.A.; Harpole, S.W. Biochar and Managed Perennial Ecosystems: Testing for Synergy in Ecosystem Function and Biodiversity. Iowa State Research Farm Progress Reports. 2013. Available online: http://lib.dr.iastate.edu/farms_reports/1990 (accessed on 15 August 2021).
  38. Jeffery, S.; Verheijen, F.; Velde, M.; Bastos, A. A quantitative review of the effects of biochar application to soils on crop productivity using meta-analysis. Agric. Ecosyst. Environ. 2011, 144, 175–187. [Google Scholar] [CrossRef]
  39. Spokas, K.A.; Cantrell, K.B.; Novak, J.M.; Archer, D.W.; Ippolito, J.A.; Collins, H.P.; Boateng, A.A.; Lima, I.M.; Lamb, M.C.; McAloon, A.J.; et al. Biochar: A synthesis of its agronomic impact beyond carbon sequestration. J. Environ. Qual. 2011, 41, 973–989. [Google Scholar] [CrossRef]
  40. Akolgo, G.A.; Kemausuor, F.; Awafo, E.A.; Amankwah, E.; Atta-Darkwa, T.; Essandoh, E.O.; Bart-Plange, A.; Branco de Freitas Maia, C.M. Biochar a soil amendment tool: Effects on soil properties and yield of maize and cabbage in Brong-Ahafo Region Ghana. Open J. Soil Sci. 2020, 10, 91–108. [Google Scholar] [CrossRef] [Green Version]
  41. Jeffery, S.; Abalos, D.; Prodana, M.; Bastos, A.C.; Van Groenigen, J.W.; Hungate, B.A.; Verheijen, F. Biochar boosts tropical but not temperate crop yields. Environ. Res. Lett. 2017, 12, 053001. [Google Scholar] [CrossRef]
  42. Cornelissen, G.; Martinsen, V.; Shitumbanuma, V.; Alling, V.; Breedveld, G.D.; Rutherford, D.W.; Sparrevik, M.; Hale, S.E.; Obia, A.; Mulder, J. Biochar effect on maize yield and soil characteristics in five conservation farming sites in Zambia. Agronomy 2013, 3, 256–274. [Google Scholar] [CrossRef] [Green Version]
  43. Asirifi, I.; Werner, S.; Heinze, S.; Saba, C.K.; Lawson, I.Y.; Marschner, B. Short-term effect of biochar on microbial biomass, respiration and enzymatic activities in wastewater irrigated soils in urban agroecosystems of the West African savannah. Agronomy 2021, 11, 271. [Google Scholar] [CrossRef]
  44. Nyambo, P.; Taeni, T.; Chiduza, C.; Araya, T. Effects of maize residue biochar amendments on soil properties and soil loss on acidic Hutton soil. Agronomy 2018, 8, 256. [Google Scholar] [CrossRef] [Green Version]
  45. Tyron, E.H. Effect of charcoal on certain physical, chemical and biological properties of forest soils. Ecol. Monogr. 1948, 18, 81–115. [Google Scholar] [CrossRef]
  46. Shneour, E.A. Oxidation of graphitic carbon in certain soils. Science 1966, 151, 991–992. [Google Scholar] [CrossRef] [PubMed]
  47. Spokas, K.; Reicosky, D. Impacts of sixteen different biochars on soil greenhouse gas production. Ann. Environ. Sci. 2009, 3, 179–193. [Google Scholar]
  48. Ousmane, A.; Goudiaby, K.; Diedhiou, S.; Diatta, Y.; Adiane, A.; Diouf, P.; Fall, S.; Dalanda, M.; Ndoye, I. Soil properties and groundnut (Arachis hypogea L.) responses to intercropping with Eucalyptus camaldulensis Dehn and amendment with its biochar. J. Mater. Environ. Sci. 2020, 11, 220–229. [Google Scholar]
  49. Diatta, A.A. Effects of Biochar Application on Soil Fertility and Pearl Millet (Pennisetum glaucum L.) Yield. Master’ Thesis, Virginia Polytechnic Institute and State University, Blacksburg, VA, USA, 2016; p. 147. Available online: http://hdl.handle.net/10919/80944 (accessed on 8 October 2021).
  50. Van Zwieten, L.; Kimber, S.; Morris, S.; Chan, K.Y.; Downie, A.; Rust, J.; Joseph, S.; Cowie, A. Effects of biochar from slow pyrolysis of papermill waste on agronomic performance and soil fertility. Plant Soil 2010, 327, 235–246. [Google Scholar] [CrossRef]
  51. MEB. Le Biocharbon, Quelles Opportunités Pour le Sénégal. Rapport d’étude du Ministère de l’Energie et des Biocarburants; BTG Biomass Technology Group BV: Durgerdamstraat, The Netherlands, 2009; p. 12. [Google Scholar]
  52. Mathieu, C.; Pieltain, F. Analyse Chimique des Sols: Méthodes Choisies; Edition Tec & Doc: Montpellier, France, 2003; 387p. [Google Scholar]
  53. Walkley, A.; Black, I.A. An examination of Degtjareff method for determining soil organic matter and a proposed modification of the chromic acid titration method. Soil Sci. 1934, 37, 29–37. [Google Scholar] [CrossRef]
  54. Olsen, S.R.; Sommers, L.E. Phosphorus. In Methods of Soil Analysis, 2nd ed.; Part 2; Page, A.L., Miller, R.H., Eds.; American Society of Agronomy: Madison, WI, USA, 1982; pp. 403–430. [Google Scholar]
  55. Kjeldahl, J.A. New method for the determination of nitrogen in organic matter. Z. Anal. Chem. 1883, 22, 366–382. [Google Scholar] [CrossRef] [Green Version]
  56. Nelson, D.W.; Sommers, L.E. Total carbon, organic carbon, and organic matter. In Methods of Soil Analysis: Part 3 Chemical Methods; American Society of Agronomy: Madison, WI, USA, 1996; Volume 5, pp. 961–1010. [Google Scholar] [CrossRef]
  57. Chopart, J.L. Etude au Champ des Systèmes Racinaires des Principales Cultures Pluviales au Sénégal (Arachide Mil-Sorgho-Riz Pluvial); Thèse I.N.P.: Toulouse, France, 1980; p. 162. [Google Scholar]
  58. Adam, G.; Duncan, H. Development of a sensitive and rapid method for the measurement of total microbial activity using fluorescein diacetate (FDA) in a range of soils. Soil Biol. Biochem. 2001, 33, 943–951. [Google Scholar] [CrossRef] [Green Version]
  59. Bray, R.H.; Kurtz, L.T. Determination of total organic and available forms of phosphorus in soils. Soil Sci. 1945, 59, 39–45. [Google Scholar] [CrossRef]
  60. Toth, S.J.; Prince, A.L. Estimation of cation-exchange capacity and exchangeable Ca, K, and Na contents of soils by flame photometer techniques. Soil Sci. 1949, 67, 439–446. [Google Scholar] [CrossRef]
  61. Guppy, C.N.; Menzies, N.W.; Moody, P.W.; Blamey, F.P.C. Competitive sorption reactions between phosphorus organic matter in soil: A review. Aust. J. Soil Res. 2005, 43, 189–202. [Google Scholar] [CrossRef]
  62. Ndour, Y.B. Statut Organique et Microbiologique des sols dans des Systèmes Agroforestiers et à Jachère du Sénégal. Mémoire de Diplôme d’Etudes Approfondies en Sciences de l’Environnement; Faculté des Sciences et Techniques, Institut des Sciences de l’Environnement, Université Cheikh Anta Diop de Dakar: Dakar, Sénégal, 1998; p. 63. [Google Scholar]
  63. Häring, V.; Manka’abusi, D.; Akoto-Danso, E.K.; Werner, S.; Atiah, K.; Steiner, C.; Lompo, D.J.P.; Adiku, S.; Buerkert, A.; Marschn, B. Effects of biochar, waste water irrigation and fertilization on soil properties in West African urban agriculture. Sci. Rep. 2017, 7, 10738. [Google Scholar] [CrossRef] [Green Version]
  64. Herrmann, L.; Lesueur, D.; Robin, A.; Robain, H.; Wiriyakitnateekul, W.; Bräu, L. Impact of biochar application dose on soil microbial communities associated with rubber trees in North East Thailand. Sci. Total Environ. 2019, 689, 970–979. [Google Scholar] [CrossRef] [Green Version]
  65. Brassard, P.; Godbout, S.; Raghavan, V. Soil biochar amendment as a climate change mitigation tool: Key parameters and mechanisms involved. J. Environ. Manag. 2016, 181, 484–497. [Google Scholar] [CrossRef] [PubMed]
  66. Lal, R. Soil carbon sequestration impacts on global climate change and food security. Science 2004, 304, 1623–1627. [Google Scholar] [CrossRef] [Green Version]
  67. Vanlauwe, B.; Descheemaeker, K.; Giller, K.E.; Huising, J.; Merckx, R.; Nziguheba, G.; Wendt, J.; Zingore, S. Integrated soil fertility management in sub-Saharan Africa: Unravelling local adaptation. Soil 2015, 491–508. [Google Scholar] [CrossRef] [Green Version]
  68. Pieri, C. Fertilité des Terres de Savanes. Bilan de Trente ans de Recherche et de Développement Agricoles au Sud du Sahara; CIRAD-IRAT: Montpellier, France, 1989; p. 444. Available online: https://agritrop.cirad.fr/375686/ (accessed on 14 August 2021).
  69. Zhao, Z.; Zhang, C.; Li, F.; Gao, S.; Zhang, J. Effect of compost and inorganic fertilizer on organic carbon and activities of carbon cycle enzymes in aggregates of an intensively cultivated Vertisol. PLoS ONE 2020, 15, e0229644. [Google Scholar] [CrossRef] [PubMed]
  70. Rasool, R.; Kukal, S.S.; Hira, G.S. Soil organic carbon and physical properties as affected by long-term application of FYM and inorganic fertilizers in maize–wheat system. Soil Tillage Res. 2008, 101, 31–36. [Google Scholar] [CrossRef]
  71. Thuita, M.; Pieter, P.; Herrmann, L.; Okalebo, R.J.; Othieno, C.; Muema, E.; Lesueur, D. Commercial rhizobial inoculants significantly enhance growth and nitrogen fixation of a promiscuous soybean variety in Kenyan soils. Biol. Fertil. Soil. 2011, 48, 87–96. [Google Scholar] [CrossRef]
  72. Alikhani, H.A.; Saleh-Rastin, N.; Antoun, H. Phosphate solubilization activity of rhizobia native to Iranian soils. In First International Meeting on Microbial Phosphate Solubilization; Velázquez, E., Rodríguez-Barrueco, C., Eds.; Springer: Dordrecht, The Netherlands, 2007; pp. 35–41. [Google Scholar]
  73. Faye, A.; Dalpé, Y.; Ndung’u-Magiroi, K.; Jefwa, J.; Ndoye, I.; Diouf, M.; Lesueur, D. Evaluation of commercial arbuscular mycorrhizal inoculants. Can. J. Plant. Sci. 2013, 93, 1201–1208. [Google Scholar] [CrossRef]
  74. Faye, A.; Stewart, Z.P.; Ndung’u-Magiroi, K.; Diouf, M.; Ndoye, I.; Diop, T.; Dalpé, Y.; Prasad, P.V.V.; Lesueur, D. Testing of commercial inoculants to enhance P uptake and grain yield of promiscuous soybean in Kenya. Sustainability 2020, 12, 3803. [Google Scholar] [CrossRef]
  75. Stewart, Z.P.; Pierzynski, G.M.; Middendorf, B.J.; Prasad, P.V.V. Sub-Saharan Africa Soil Fertility Prioritization Report: III. Combined Summary. Feed the Future Innovation Lab for Collaborative Research on Sustainable Intensification; Kansas State University: Manhattan, KS, USA, 2017; Available online: https://www.k-state.edu/siil/resources/soilfertility/index.html (accessed on 7 October 2021).
  76. Pierzynski, G.M.; Middendorf, B.J.; Stewart, Z.P.; Prasad, P.V.V. Sub-Saharan Africa Soil Fertility Prioritization Report: I. Survey Results. Feed the Future Innovation Lab for Collaborative Research on Sustainable Intensification; Kansas State University: Manhattan, KS, USA, 2017; Available online: https://www.k-state.edu/siil/resources/soilfertility/index.html (accessed on 7 October 2021).
  77. Middendorf, B.J.; Pierzynski, G.M.; Stewart, Z.P.; Prasad, P.V.V. Sub-Saharan Africa Soil Fertility Prioritization Report. II. Summit Results. Feed the Future Innovation Lab for Collaborative Research on Sustainable Intensification; Kansas State University: Manhattan, KS, USA, 2017; Available online: https://www.k-state.edu/siil/resources/soilfertility/index.html (accessed on 7 October 2021).
  78. Wortmann, C.; Stewart, Z.P. Nutrient management for sustainable food crop intensification in the tropical savannas in Africa. Agron. J. 2021. [Google Scholar] [CrossRef]
Figure 1. Agro-ecological zones of Senegal and location of ISRA–CNRA Bambey research station.
Sustainability 13 11817 g001
Figure 2. (a) Annual rainfall from 2011 to 2019 at Bambey research station in Senegal. (b) Monthly rainfall during 2013, 2015, 2017, and 2019 at Bambey research station in Senegal.
Sustainability 13 11817 g002
Figure 3. Changes in soil pH over years under different treatments (T1 to T10). See Table 1 for treatment details.
Sustainability 13 11817 g003
Figure 4. Changes in available phosphorus (P) over years under different treatments (T1 to T10). See Table 1 for treatment details.
Sustainability 13 11817 g004
Figure 5. Soil available P under millet monocropping or millet–peanut rotation under different treatment (T1 to T10) in 2019. See Table 1 for treatment details. Letters compare treatment effects on peanut pod production in the millet–peanut rotation system. Values with a common letter are not different at p < 0.05 according to the Tukey test.
Sustainability 13 11817 g005
Figure 6. Soil total microbial activity at eight years after biochar and manure application in different treatments (T1 to T10). See Table 1 for treatment details. Letters compare treatment effects in the millet–peanut rotation system. Values with a common letter are not different at p < 0.05 according to the Tukey test.
Sustainability 13 11817 g006
Figure 7. Soil total microbial activity under millet monocropping or millet–peanut rotation at eight years after biochar and manure application in different treatments (T1 to T10). See Table 1 for treatment details. Letters compare treatment effects in different cropping systems. Values with a common letter are not different at p < 0.05 according to the Tukey test.
Sustainability 13 11817 g007
Figure 8. Peanut pod yield under the millet–peanut rotation system at eight years after biochar and different manure application treatments (T1 to T10). See Table 1 for treatment details. Letters compare treatment effects on peanut pod production in the millet–peanut rotation system. Values with a common letter are not different at p < 0.05 according to the Tukey test.
Sustainability 13 11817 g008
Figure 9. Millet grain yield response under millet monocropping and millet–peanut rotation systems at eight years after biochar or manure application under different treatments (T1 to T10). See Table 1 for treatment details. Letters compare treatment effects on peanut pod production in the millet–peanut rotation system. Values with a common letter are not different at p < 0.05 according to the Tukey test.
Sustainability 13 11817 g009
Table 1. Details of various treatments tested in this field research conducted at Bambey research station in Senegal.
TreatmentsCompositionkg N ha−1 Applied
T1Absolute control (no amendment, no fertilizer)0
T2Positive control (Recommended 150 kg ha−1 NPK + 100 kg ha−1 Urea)68.5
T35 t ha−1 of rice husk biochar alone10
T410 t ha−1 rice husk biochar alone20
T55 t ha−1 of Typha australis biochar + 5 t ha−1 cattle manure75
T610 t ha−1 of Typha australis biochar + 5 t ha−1 cattle manure85
T775 kg ha−1 NPK + 50 kg ha−1 Urea + 5 t ha−1 of rice husk biochar44.25
T850 kg ha−1 NPK + 33 kg ha−1 Urea + 5 t ha−1 rice husk biochar + 5 t ha−1 cattle manure97.68
T950 kg ha−1 NPK + 33 kg ha−1 Urea + 5 t ha−1 rice husk biochar32.68
T1050 kg ha−1 NPK + 33 kg ha−1 Urea + 5 t ha−1 of Typha australis Biochar + 5 t ha−1 cattle manure97.68
Table 2. Chemical properties of the two biochar sources used in this field research conducted at Bambey research station in Senegal.
ParametersRice HuskTypha australis
pH8.910.9
Organic C (%)0.10.9
Total N (%)0.20.2
Organic Matter (%)23
Ca (cmol kg−1) 19.822.9
Mg (cmol kg−1) 6.87.4
K (cmol kg−1) 2.63.1
Na (cmol kg−1) 1.81.5
Total Exchangeable Basis (T.E.B.)3134.9
Available P (ppm)4.13.2
Available K (ppm)107.4268.8
Table 3. Properties of the manure in this field research conducted at Bambey research station in Senegal.
NutrientsAvailability
N (NO3) (mg kg−1)499.4
N (NH4) (mg kg−1)100.5
Total N (%)1.3
Total C (%)13.0
C:N ratio10.2
Total P (g kg−1)6.5
Available P (g kg−1)1.4
Ash (%)74.2
Ca (g kg−1)17.0
Mg (g kg−1)2.6
Na (g kg−1)1.5
K (g kg−1)2.1
Table 4. Evolution of soil total N and C regardless of cropping system under different treatments (T1 to T10). See Table 1 for treatment details.
Total N Reference (2012): 0.21b (%0) Total C Reference (2012): 1.84e (%)
201320152017
TreatmentsN (%0)C (%)N (%0)C (%)N (%0)C (%)
T10.14b1.9e0.3a1.81e0.34a1.74e
T20.26b2.11e0.19bc2.73d0.19bc2.83d
T30.36ab2.98ab0.19bc2.65d0.21bc2.68d
T40.31ab2.79bc0.19bc2.66d0.20bc2.61d
T50.4a3.4a0.23bc2.71d0.25bc2.89d
T60.23b2.55bcd0.22b2.71d0.21b2.81d
T70.31b2.65bcd0.17c2.60d0.20b2.3d
T80.15b2.59bcd0.19bc2.73d0.21b2.83d
T90.23ab2.73bc0.19bc2.68d0.22b2.72d
T100.12b2.3cde0.16c2.68d0.17b2.7d
Letters compare treatment effects on peanut pod production in the millet–peanut rotation system. Values with common letter are not different at p < 0.05 according to Tukey test.
Publisher’s Note: MDPI stays neutral with regard to jurisdictional claims in published maps and institutional affiliations.

