Article

Woodland Extraction Rate Estimation in the Savanna Ecosystem (Case Study of Foley and Makomoto in Central-East Botswana)

by
Gaositwe Lillian Pelane
*,
Mulalu Innocent Mulalu
,
Gagoitseope Mmopelwa
and
Moren Tibabo Stone
Department of Environmental Science, Faculty of Science, University of Botswana, Private Bag UB 00704 Gaborone, Botswana
*
Author to whom correspondence should be addressed.
Sustainability 2021, 13(20), 11316; https://doi.org/10.3390/su132011316
Submission received: 25 August 2021 / Revised: 2 October 2021 / Accepted: 6 October 2021 / Published: 13 October 2021
(This article belongs to the Section Resources and Sustainable Utilization)

Abstract

:
Savanna woodlands make a significant contribution to rural households’ livelihoods, providing a wide range of resources as well as generating income. However, the sustainability of the woodland ecosystem is generally affected by the human harvesting intensities. This study aimed at quantifying the woodland resource extraction rates and its effects on woodland structure and density. Data were collected from households using a semi-structured questionnaire, key informant interviews, and from 128 rectangular plots measuring 30 m × 30 m. Vegetation parameters, such as tree density, tree height, diameter at breast height, species, stump density, and stump diameter, were recorded. The results of the study revealed that a total of 649 woody stumps were recorded, with an average of 56 trees removed per hectare. The findings showed that the intensities of stumps varied widely, with a high number of stumps recorded at a distance of 10–15 km from the settlements, where major land-use activities are fuelwood extraction, cultivation, and livestock farming. The results also showed that the increased commercial fuelwood production led to cutting of large mopane trees, which is an indicator of unsustainable harvesting. Based on the harvest rates provided by the respondents, results showed that large quantities of fuelwood were harvested for trading, which could put pressure on the woodland ecosystem, consequently resulting in woodland degradation. This study provides forest and range resource managers with valuable information on the quantities of stumps as an indication of tree removals and could be useful in developing effective monitoring strategies and promoting sustainable forest and woodland management.

1. Introduction

Woodlands serve as a major component of biodiversity and ecosystem services, providing ecological services, such as soil quality maintenance, regulation of water flow systems, carbon sequestration, and microclimate regulation [1,2,3], and economic services in sustaining local livelihoods [1,4,5]. Despite these services and benefits, previous studies [6,7,8] have revealed that woodlands are under immense pressure, as rural communities depend significantly on them for household utilization. With increasing demand for timber production, fuelwood, and charcoal, these ecosystems are particularly subjected to degradation [9,10,11], which includes negative changes in woodland structure, regeneration, as well as diversity [12]. Consequently, this results in biodiversity loss [13] and threatens the provision of ecosystem services [14,15], which are vital for sustainable rural livelihoods [16]. Sustainable management of woodlands requires a balance between growth rates and removals [17]. In a situation where removals surpass the growth rate, unsustainability occurs [17]. Therefore, knowledge on the level of woodland resource extraction is important for the successful management and conservation of woodlands.
The semi-arid savanna woodlands found in communal areas of Sub-Saharan Africa are under pressure [18,19], as they are crucial for meeting increased demands of a rapidly growing human population [15], which leads to their utilization being far beyond their regenerative capacity [20,21]. This has resulted in a significant decrease in forest cover over the past few decades [22,23], and the Southern African region lost approximately 3246 km² of forest per year from 2000 to 2012 [24]. In trying to achieve sustainability of forest and woodland resources, Southern African countries, including Botswana, introduced policies that were meant to ensure sustainable utilization of forest resources [18,25,26]. These countries came up with several regulations, policies, and initiatives, such as the Community-Based Natural Resource Management on natural resources [27,28,29], which led to the inventory and monitoring of forest and rangeland resources countrywide. However, these forest inventory approaches and initiatives do not yield better results due to the independent nature of their operations and subtle competition between the implementing institutions, which are mostly at national level [26,30,31]. The Community-Based Natural Resource Management (CBNRM) initiative has already made substantial efforts in improving the livelihoods of rural communities, strengthening local institutions, and empowering local communities in wildlife management areas [28]. It has also brought positive changes in attitude among the communities towards wildlife [32]. Therefore, it could be utilized in monitoring woodland resources; for example, management of quotas being devolved to local communities, local capacity development, and giving traditional authorities the power to monitor the use and management of open access wood resources where there are no community trusts could help achieve sustainability.
Savanna woodlands are an important biome covering about 119,210 km² of Botswana’s land, equating to 20% of the total land area [33]. The semi-arid savanna woodlands, with Colophospermum mopane as a dominant tree species, are mostly found in the northern and eastern parts of Botswana [34], and this species can be resilient to a wide range of climatic and edaphic conditions [35]. Savanna woodland resources have a significant contribution in the country’s economy by providing energy, livelihood support [36], and livestock grazing resources [37], government revenues, and business opportunities. For example, mopane tree hosts mopane worm, which are consumed and traded for cash income. The mopane worm harvested in Botswana in a good year has been estimated to be worth U.S. $3.3 million, providing employment to 10,000 people [38]. However, there has been a wide concern that local communities are engaged in unsustainable harvest of resources for commercial purposes, such as harvesting of live trees for commercial fuelwood, causing a decline on woodland resources and triggering changes in the ecosystem [39]. Moreover, rural communities are heavily dependent on the ecosystem, which is under increasing threat due to climate change [40]. Botswana, just like other countries, experiences effects of climate change on her natural resources and agricultural activities. The country is prone to frequent droughts [41], with a recurrence interval of two years, which will likely affect natural resources. Hence, the sustainability of the woodlands remains a concern.
Woodland cover loss and degradation in Botswana is widely acknowledged [42,43,44,45]. However, there is dearth of quantitative information regarding the rate at which the resource is being harvested. Therefore, it remains unknown whether woodland resource extraction in Botswana is sustainable. This is mostly due to data collection constraints [16]. Generating highly accurate measurements is mainly through manual and field based approach, but due to its associated high costs (in time and fiscal terms) and labor intensity [46,47], the quantification of the level of resource extraction becomes difficult. Although field-based measurement is costly, this information can provide insights on woodland use, which is vital in decision making to ensure sustainability. Previous studies [20,42,44,45] conducted in Botswana identified fire and wildlife disturbances together with human activities, such as cultivation and cattle grazing, as major drivers of changes in woody structure and composition; however, the synergy between woodland resource harvesting and sustainability is poorly understood. Studies that assess the level of woodland resources extraction and the influence of the resource utilization patterns on the woodland ecosystem are necessary for the development of sustainable ecosystem management decisions. In addition, with increasing demand for fuelwood as a livelihood strategy, forestry managers are faced with various challenges to devise an effective monitoring system to control unsustainable harvesting.
To bridge this knowledge gap, this study aimed at quantifying the resource extraction rate using field-based and socio-economic data in Foley and Makomoto areas in the Central District of Botswana. The specific objectives were: (i) to estimate the resource off-take in the study area; (ii) to assess the effect of wood resource extraction on woodland density and structure; and (iii) to analyze the woodland resource extraction variance along the observed extraction gradient.

2. Materials and Methods
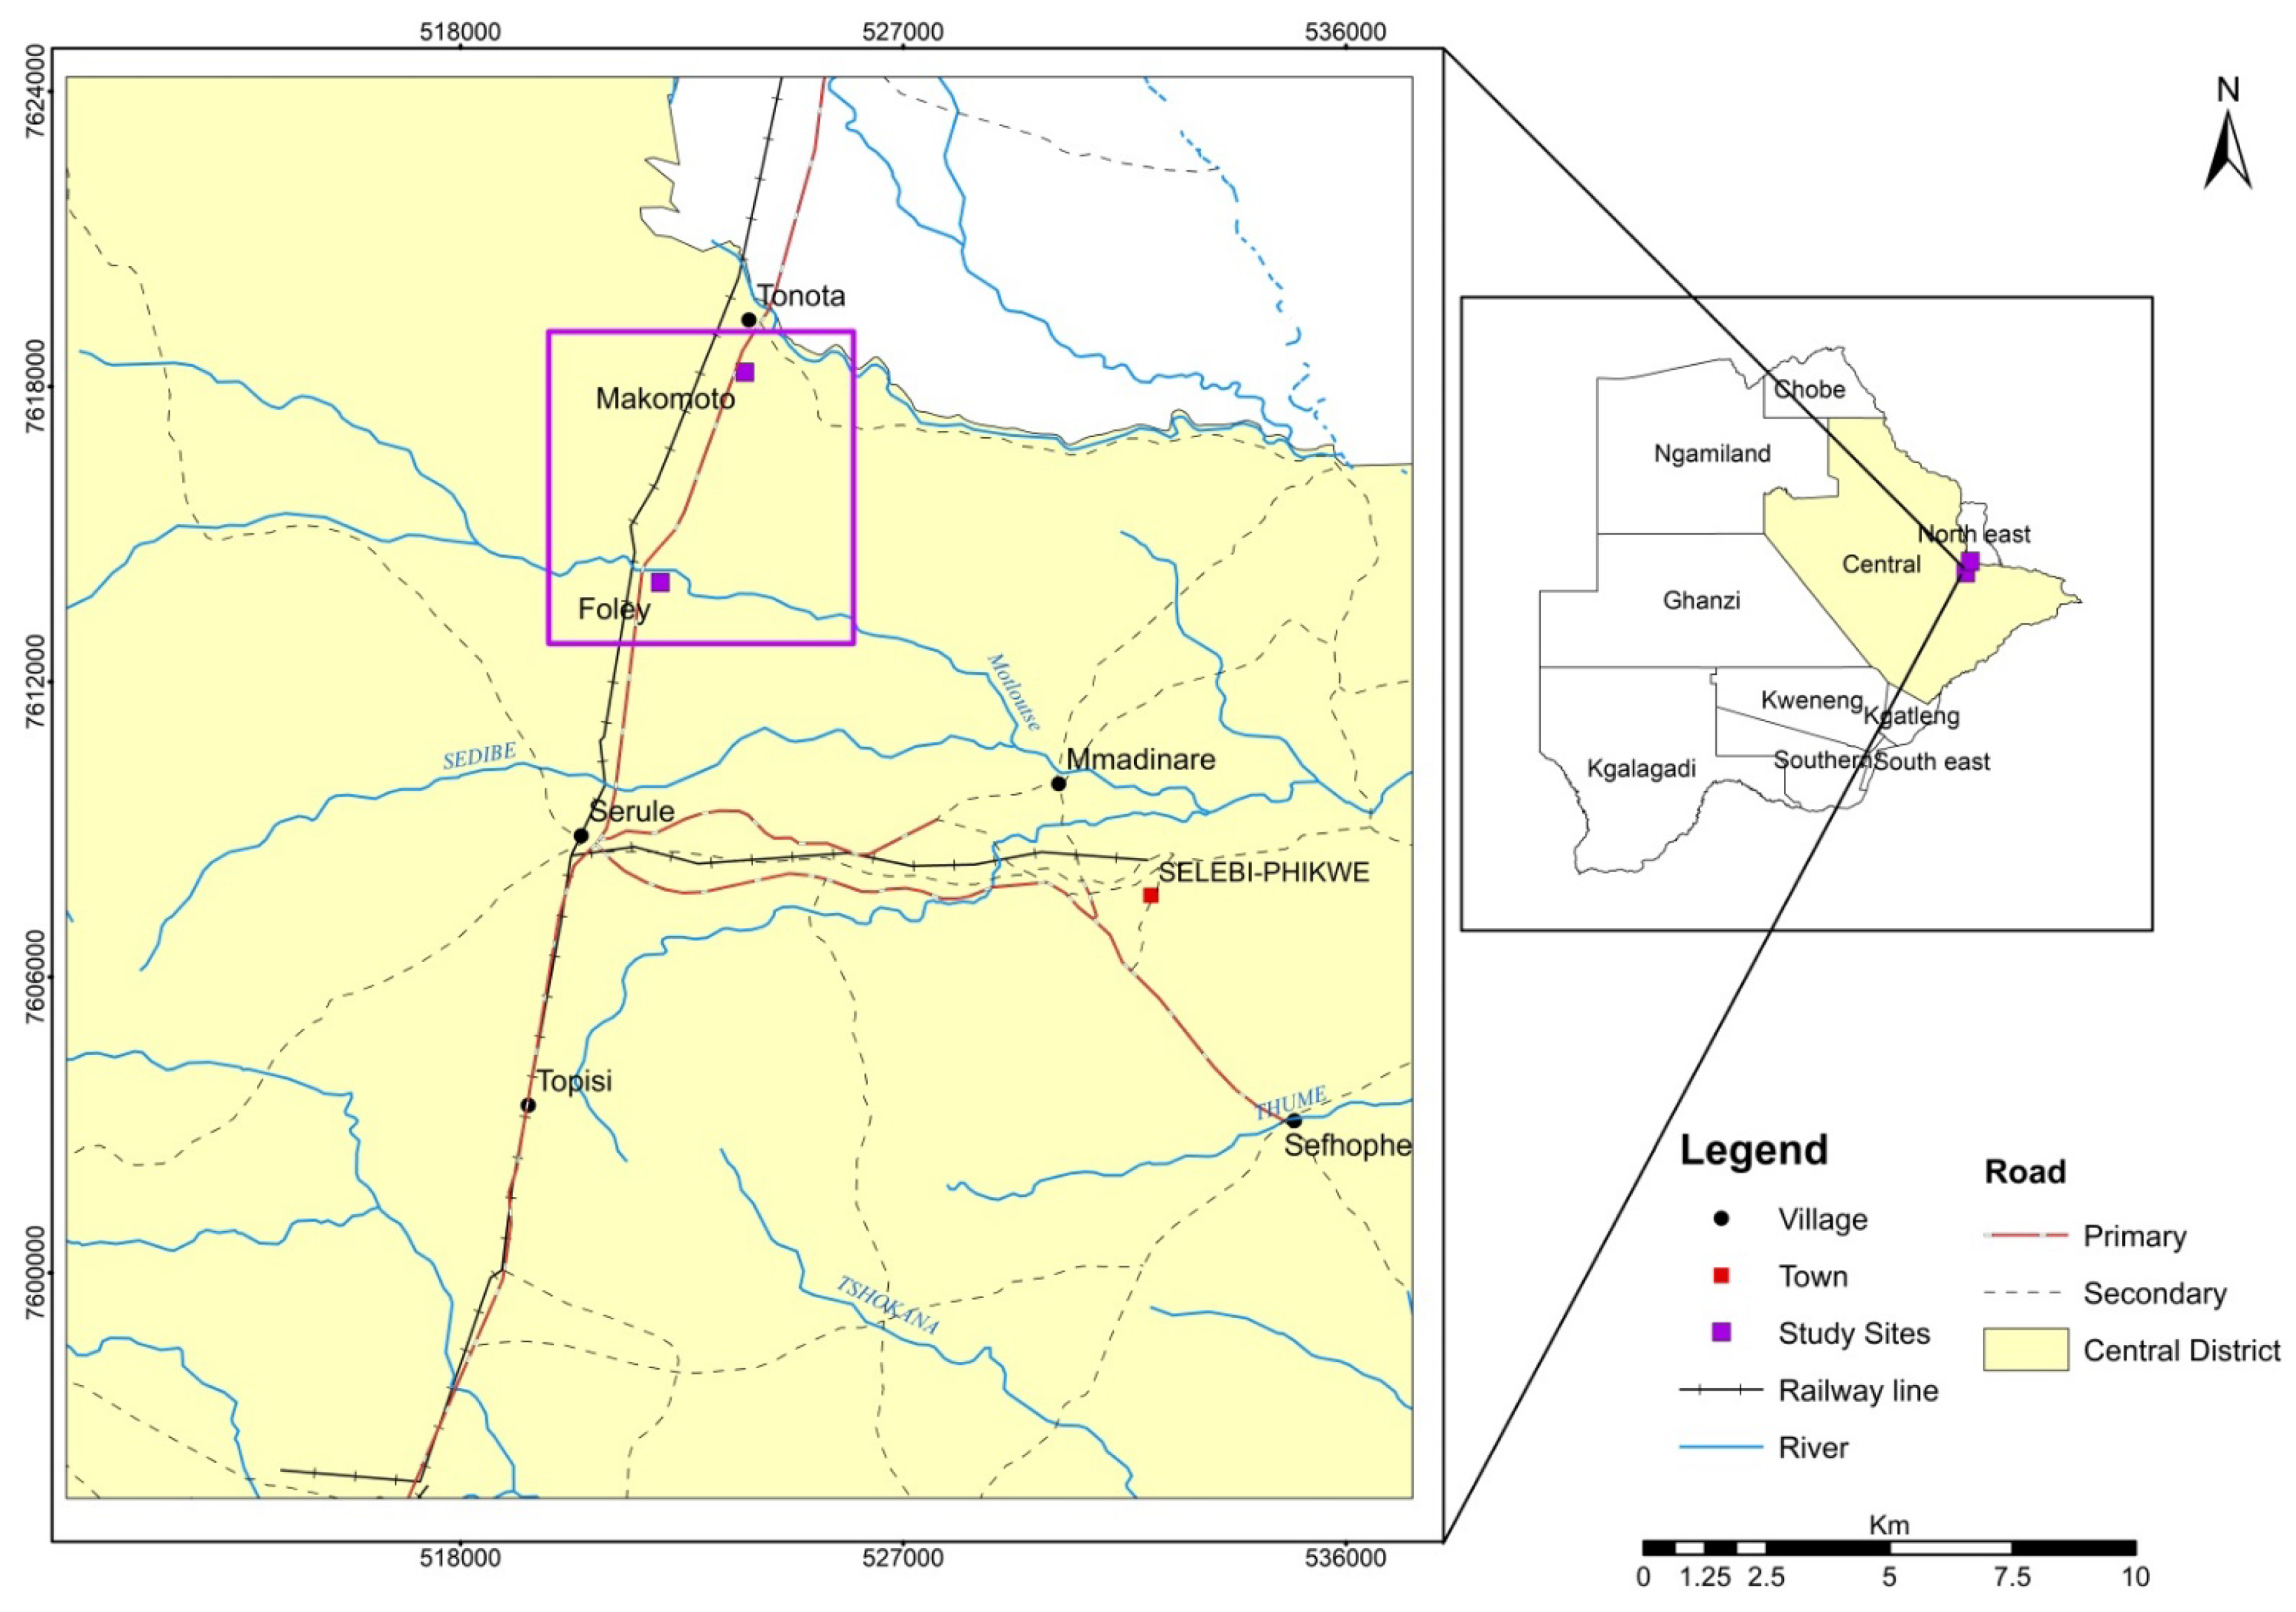
2.1. Study Area

The study was conducted in Makomoto and Foley settlements located in the Central District of Botswana (as shown in Figure 1). The area is located towards the eastern margin of the Central District between 27°21 and 27°23 E and 21°32 and 21°40 S. The area experiences a semi-arid climate, as does most parts of the country, with high temperatures ranging between 32 °C and 39 °C in summer and minimum temperatures ranging between 4 °C and 19 °C in winter. It receives an average annual precipitation of about 600 mm [48]. It is dominated by Colophospermum mopane tree species interspersed by other species, such as Acacia tortilis, Acacia nigrescens, Commiphora mossambicensis, Peltophorum africanum, and Combretum apiculatum [49].
The area was chosen based on the reason that it is one area in the country that has experienced large-scale commercial utilization of woodland resources for fuelwood production with past and recent incidences of cutting live trees [50]. Secondly, this area is located along the main road that connects two cities (Gaborone and Francistown), which is convenient for people to access fuelwood, resulting in high demand for the resource, consequently leading to unsustainable harvesting. The majority of the people in this area are engaged in small-scale, subsistence, rain-fed agriculture. They grow crops such as sorghum, maize, beans, melons, and sweet-reed. The two communities have adapted diverse economic activities, such as fuelwood production, small enterprises, informal employment, crop farming, livestock farming, and wage employment.

2.2. Data Collection

2.2.1. Vegetation Survey

A vegetation survey was conducted from January to February 2020 to collect vegetation parameters. A square plot of 30 m × 30 m was used. The 30 m × 30 m plot was considered large enough to represent the woody plant properties in the surrounding area. This plot size has been widely used in previous savanna vegetation studies [51,52]. Furthermore, the study boundary was determined using the veterinary fence on the south of Foley village, and arable drift fence was used on Makomoto side. This was done to focus on an area that has been exposed to harvesting practices. A design sampling tool built in ArcGIS 10.5 [53] was used to generate the sample points using a stratified random sampling procedure. A total of 32 sample points were generated in the study area, and each one of the 32 sample points consisted of 4 cluster plots, resulting in a total of 128 cluster plots.
Sample points were located in the study area, and a total of 128 sample plots were designed. Vegetation parameters were recorded in a data sheet. The estimated variables (trees and shrubs) of the wood vegetation were density, structure, species, height, and diameter at breast height. Trees and shrubs were classified based on height and diameter at breast height. Tree-structured objects with a height ranging between 2–4 m were classified as shrubs, while those with heights greater than 4 m were classified as trees [54]. Trees and shrubs were classified based on height and diameter at breast height. Trees with self-supporting stem with a diameter at breast height equal or greater than 10 cm were classified as trees. Trees that were self-supporting and multi-stemmed or single-stemmed greater than 1 m but less than 5 m height were classified as shrubs [55]. A total number of trees in each plot was recorded. Trees with self-supporting stem with a diameter at breast height equal or greater than 10 cm were classified as trees; trees that were self-supporting and multi-stemmed or single-stemmed were classified as shrubs. Density per plot was recorded by counting all the trees that fell within a plot.
Numbers of stumps were recorded including the resprout within a plot. Harvested stumps encountered in each plot were measured at ankle height (15 cm from ground level). In addition, there was determination of fresh and old stumps. This included color and the freshness of the stump but not the numeric value, which is used to determine the age of the stump. The names of the harvested species were also recorded. This was done to find out which species was the most harvested. The condition of the plot was assessed by counting the number of dead trees (both standing and fallen). This was done in order to estimate the availability of firewood. The vertex height finder was used to measure tree height, whereas caliper and diameter tape were used for measuring diameter at breast height, measured at 1.3 m height for standing trees and stumps at ankle height.

2.2.2. Household Survey

The social survey provided data that was used to estimate household consumption levels. This was part of the data that was used to calculate offtake. The sample size of the study was derived using the population of each settlement, and the average rural household size was used to get the estimate of households per settlement. A Yamane (1967) formula was used to determine the sample size in this study. This formula is suited for different population proportion levels and confidence levels [56,57]. Therefore, it was considered suitable for determining an optimum sample size that is a representative of the population under investigation. A 90% confidence level was used with a marginal error of 0.1. According to Botswana Statistics [58], the total population of Foley and Makomoto are 534 and 174, respectively. The average rural household size is 3.5. Yamane’s (1967) formula was applied to estimate the required sample size for the study area at 90% confidence level and 0.1 sampling error:
n = N 1 + N ( e ) 2
where n = sample size, N = population size, and e = error of sampling, which in this case, was (0.1).
The total number of households selected from Foley was 60, and Makomoto was 32, giving a sample size of 92 households. A Google Earth image (high resolution) was used as a basemap in ArcMap version 10.5 software to identify and digitize all households. Each household was assigned a number, and simple computerized random sampling was done in Microsoft Excel [59] to select 92 households. A digitized map with all household numbers in the study area was used to find the selected households at the study sites. In case of a selected but abandoned household or unavailable household owners during the data collection period, the adjacent household was selected.
A semi-structured questionnaire was developed in English and then translated to Setswana (a local language). For this section, closed questions were used and triangulated to gather the quantitative as well as qualitative data. Cross-sectional data were collected to assess the consumption patterns and rates in the study area. The consumption rates were measured through frequency of harvesting and quantity of resources harvested per selected household. Two research assistants from the local communities were selected and trained for data collection. The training involved explaining the objectives of the study, the meaning and implication of each question, conducting face to face interviews before the actual survey started, and ethical issues related to the survey. This was done to improve consistency in interviewing and minimize errors by the interviewers. Pre-testing of the questionnaire was conducted in the Sese village. The village has a similar environment involving the use patterns of woodland resources as the study area. The response to questionnaire pre-testing aided in revision of some questions and deletion in case of irrelevance or repetition. It also helped the reader to summarize the sections or issues in the questionnaire. The survey was then conducted as structural interviews to the 92 selected households.
Additionally, in-depth interviews were conducted with key informants to get information on rules and regulations about woodland resource use. Purposive sampling was used to select key informants. The aim of using this method was to identify individuals who are knowledgeable about the woodland resources. The information acquired also included the local institutions and structures that regulated the use of these resources over the past 20 years. This study sampled approximately nine key informants, comprised of two officials from the Department of Forestry and Range Resources, two local chiefs, one Village Development Committee member, and four village elders.

2.3. Data Analysis

The intent of the study was to estimate tree removal and density per hectare; hence, the measured variables, such as number of stumps and number of dead wood, were pooled for each plot. Woody stem diameter measured at breast height for all trees was averaged for each plot. Total numbers of stumps were summed up for each plot (30 m × 30 m). The plot size was then converted to a hectare in order to estimate number of stumps per hectare. The converted plot size was 0.09 ha. Since this study used four clustered plots to collect data within a radius of 250 m, the 0.09 ha plot was then multiplied by 4 and made 0.36 ha. Total number of stumps in a 0.36 ha, which is the total area of the four clustered sample plots, were then extrapolated to per hectare using the formula adopted from Etigale et al. [60].
N = h/a × c
where N = estimated number of stumps per hectare; h = one hectare; a = area of plot in hectare, and c = number of stump counted in the plot.
Stumps were also categorized into different diameter classes. This was done to assess the most harvested diameter class. Furthermore, stumps were also divided into categories, namely fresh and old. This was done to determine the number of fresh cuts. Since it was considered difficult to determine the age of the stump, the age category was not included in the study. Therefore, the annual resource off-take was not quantified.

2.3.1. Spatial Statistical (Geostatistics) Technique

The Ordinary Kriging geostatistical spatial interpolation technique in ESRI ArcMap 10.5 was used for the spatial estimation of woodland resources in the study area. Ordinary Kriging is an interpolation method for spatial estimation based on the regionalized variable at selected points that predicts values from interpolation with minimum error [61,62]. In this study, data from quadrants were assembled into A point-based dataset for input in geostatistical analysis for the recorded wood density per plot. The woody tree density was analyzed using the basic geostatistical visualization construct known as semi-variogram. The semi-variances were calculated for each pair of sampling plot, and the mean values were plotted for increasing distance intervals to produce the experimental semi-variogram. The coefficient of determination (r²) resulting from the least-squares fitting of models was used as a criteria to select the best model. The spherical model, among others (Gaussian and exponential), was applied to produce the empirical semi-variogram. The spherical model is regarded as the best model for woody plants spatial modeling since it reaches the maximum variance between pairs of points [63]. The maximum lag selected was 500 m. This distance was long enough to capture the spatial autocorrelation of the woodland density.
The semi-variogram plots semi-variance γ as a function of the distance between samples, known as lag distance h, and is defined as follows:
γ ( h ) = 1 2 n ( h ) i = 1 n ( h ) [ Ȥ ( x i ) Ȥ u ( x i + h ) ] ²
where γ (h) is variogram, h is lag distance, n(h) is the number of data pairs separated by h, and z is the value at location xi and (xi + h) [61].

2.3.2. Quantities Harvested Per Household

Quantitative data gathered from the questionnaires during household survey was compiled and managed using Statistical Package for Social Sciences (SPSS, version 25). Data were analyzed to attain accurate findings using descriptive statistics in the form of frequencies, mean, proportions, and percentage distribution. The quantities of harvested woodland resources were categorized as commercial or household usage. The amounts harvested were then calculated per household as well as for commercial purposes on an annual basis. The reported quantities harvested by each household per annum were estimated by the number of back loads per household multiplied by the frequency of harvesting. The same estimations were done for commercial purposes. Poles harvested for different construction purposes were estimated. Their diameter and length were measured. Data were analyzed quantitatively using descriptive statistics. To assess woodland conservation efforts in contributing to its sustainability, key informant data in relation to forest management and interventions in Botswana from the Department of Forestry, Range, and Resources (DFRR) official were analyzed qualitatively using inductive approach.

3. Results

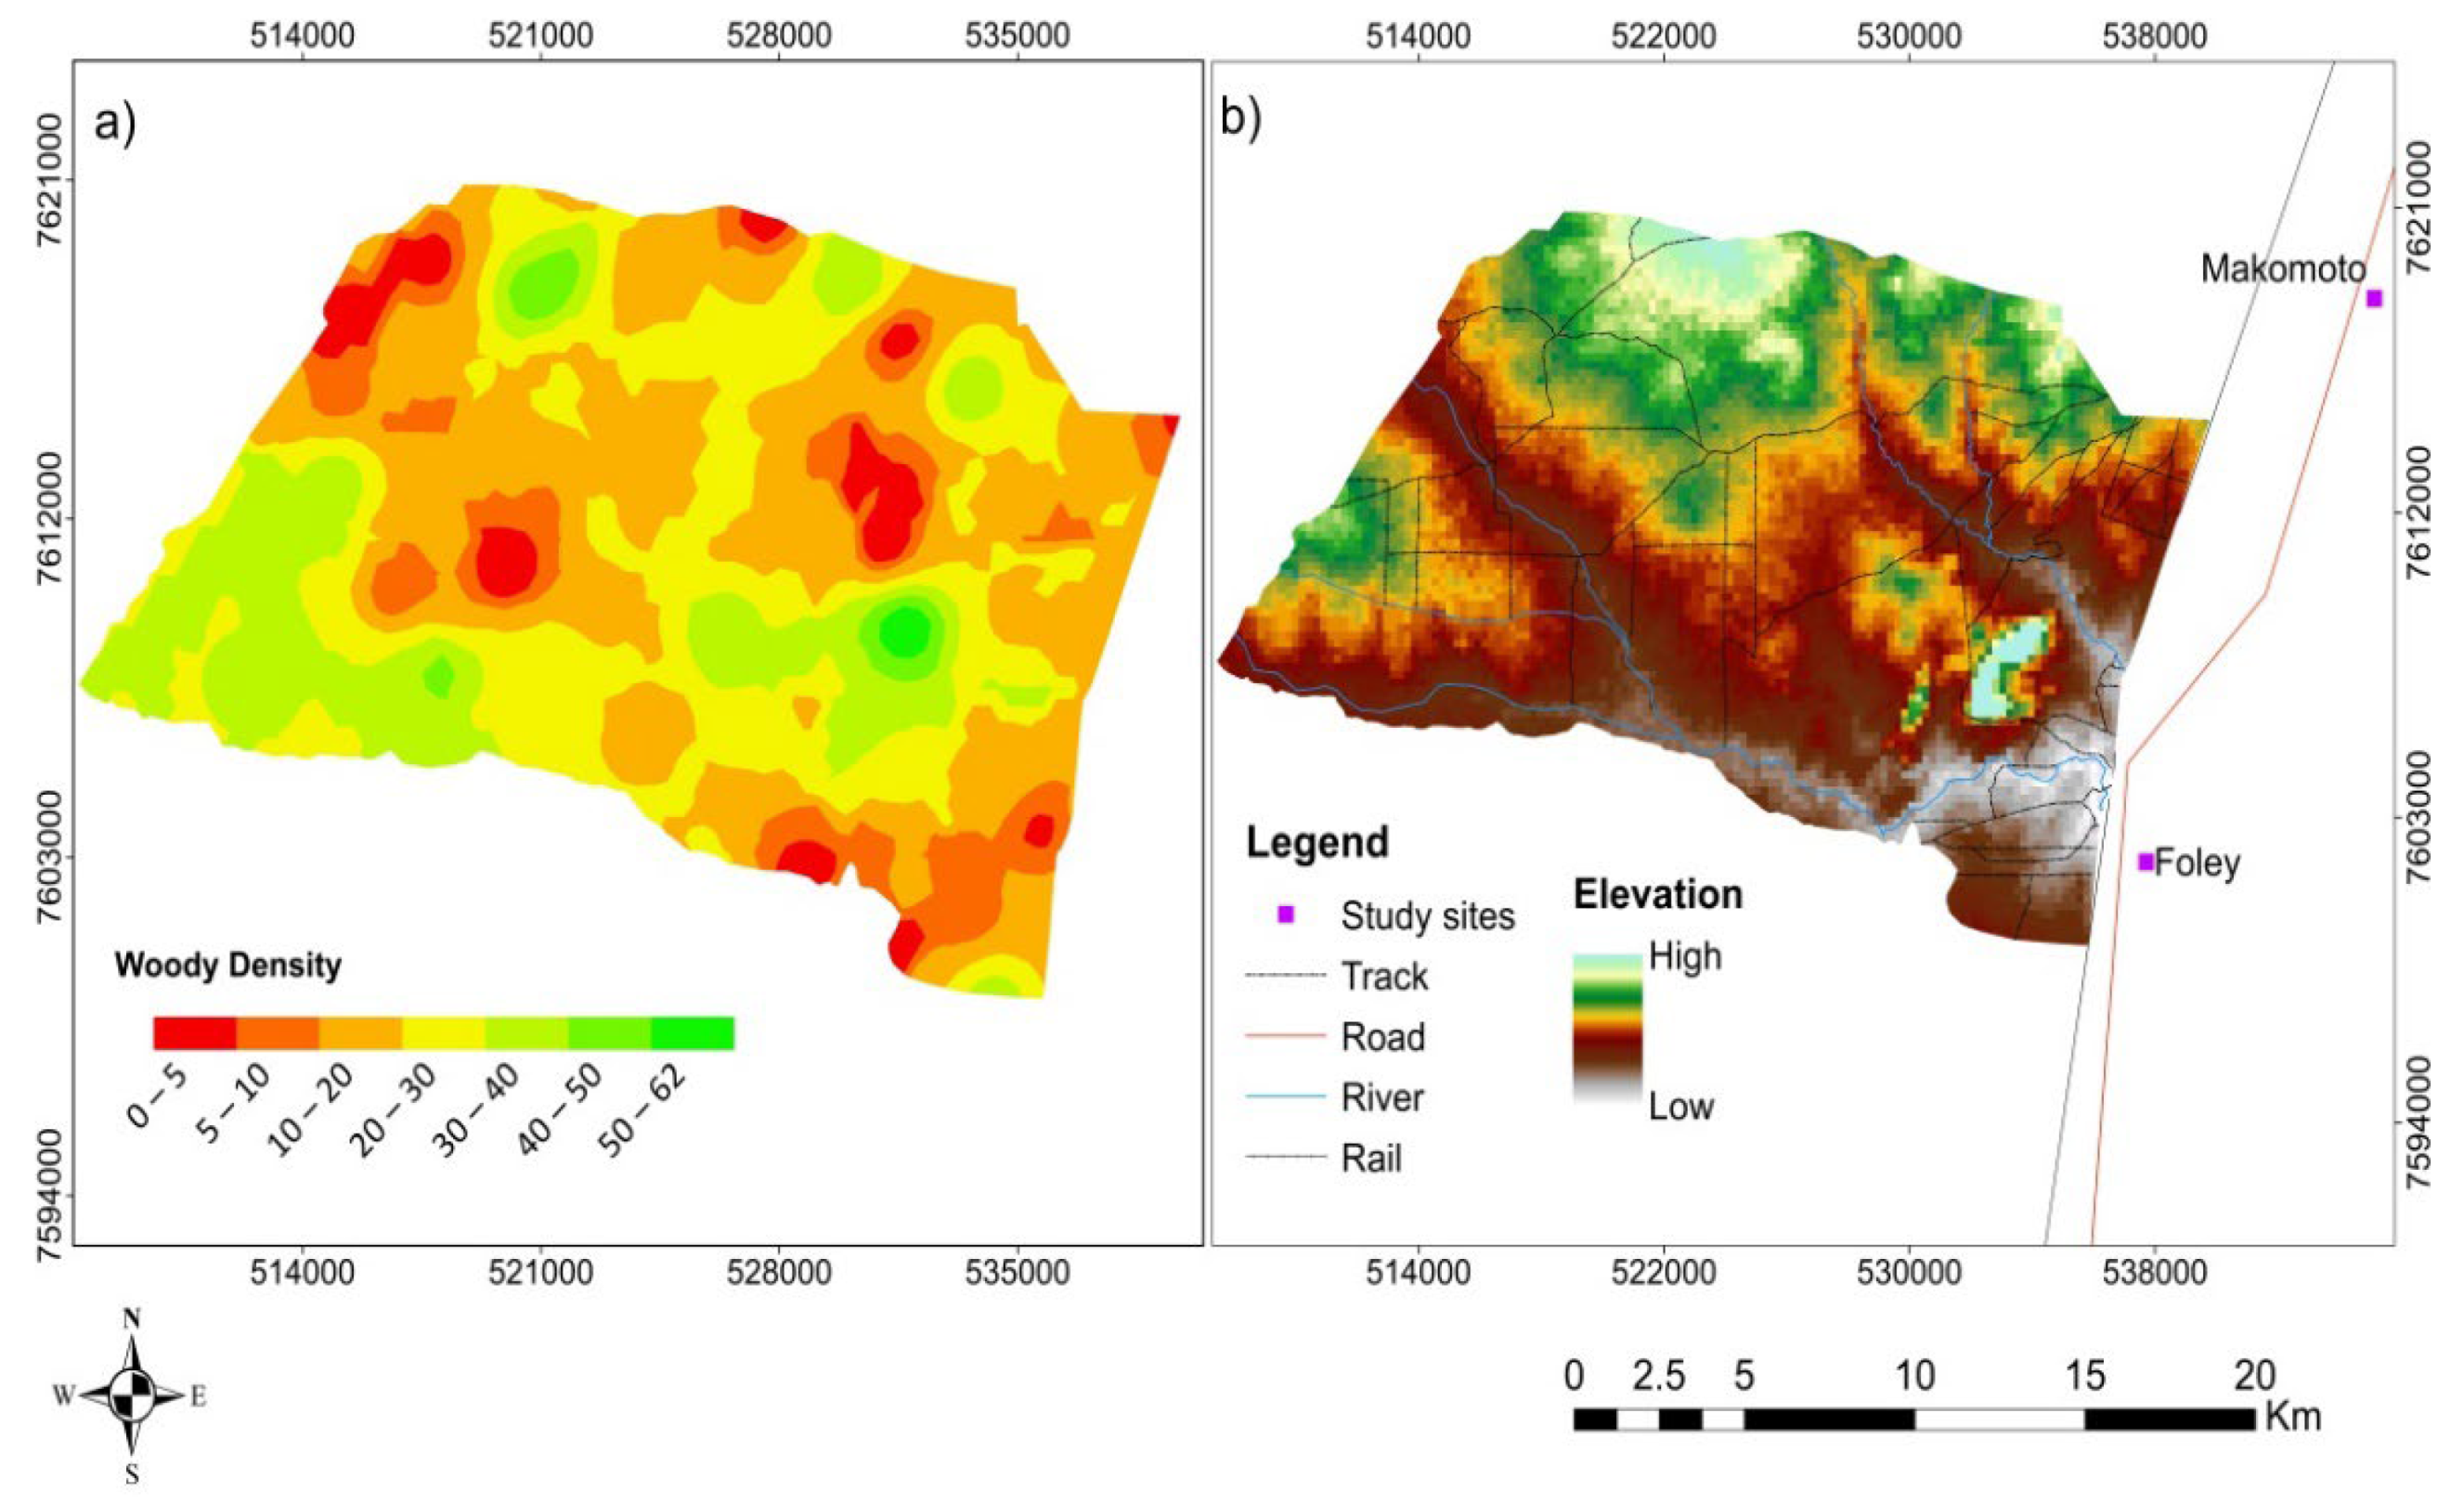
3.1. Spatial Availability and Distribution of Woodland Resources

The findings showed that there was a total of 4928 live trees identified from all the 128 sampled plots. A total of 32 different tree species were observed within the study site. The results of the study showed all tree species of different diameter classes, ranging from 4.9 cm to greater than 30 cm. The most common families identified were the Fabaceae (12), Combretaceae (5), and Tiliaceae (3). The dominating species were Acacia (8), Combretum (3), and Grewia (3), with the rest being represented by one to two species. The dominant species were the Colophospermum mopane, with a total number of 2171 (44%), Acacia erubescens (8.7%), Combretum apiculatum (8%), Acacia tortilis (6%), and Acacia Karoo (7.4%). Other species found in this area accounted for less than 5%. The results also indicated that mopane trees were the most frequent species found in 98 plots out of 128 plots (76% of plots), followed by the Combretum apiculatum (35%) and Acacia erubescens (24%). Table 1 shows the record of all species found in the sample plots.
The information on standing trees with diameter at breast height (DBH) of greater than 20 cm was important in determining if the area has more mature trees. A total number of trees with a DBH greater than 20 cm was recorded in each sample plot. Data were converted to a 0.36 ha and extrapolated to find the spatial distribution of big trees. Results showed that there were few big trees (≥30 cm), with an estimated number per hectare standing at 6/ha. The majority of trees had a diameter less than 30 cm. Most of the sampled trees fell within the range of 5–14.9 cm DBH class, hence regarded as shrub and not recorded here. The density of big-stemmed trees was great in areas where there were fewer human activities. The results revealed that the areas with high tree density are mostly located on an area of high elevation (hill side), stretching from the center of the study area to as far as south west (along the river) as well as the north west of the study area. Figure 2 shows the distribution of tree density. Thick and dense tree distribution varied with increasing distance from settlements. There were few large trees (0–5 trees) per sample plot in areas closer to settlements.

3.2. Estimated Number of Trees Removed

An analysis was performed to estimate trees removed by counting the number of stumps and the total estimated stumps per hectare in the area. Results showed that a total number of stumps were 649 with an average of 56 trees removed per hectare in the study area. The results showed that stump density varies widely from 3 to 236 stumps per density. A total of 85 stumps was recorded in sample point 4, which is the highest number recorded in the area, followed by sample point 1, with a total of 38 stumps. Sample points 3 and 20 had 33 stumps each, and points 15 and 17 had a total of 30 stumps each. The lowest recorded number of stumps was found in sample point 9, which had only 1 stump. Of the 649 stumps, 527 (81.2%) were freshly cut, and 122 (18.8%) were old stumps cut from a long time ago. A total of 428 (87.9%) resprouted, and 59 (12%) did not resprout and were considered as dead. The most harvested woody species were Colophospermum mopane (399 stumps), Combretum Apiculatum (126), and Acacia tortilis (79). The other 36 stumps fell in other woody species, while nine stumps were difficult to determine their species because they were severely damaged and very old. The observed method of harvesting was primarily through the use of an axe, and most of the trees were selectively harvested, with only particular trees having been removed. Table 2 shows the frequency of stump density/0.036 ha.

3.3. Variations in Stump Densities along the Observed Extraction Gradient

The results indicated that there were fewer stumps within a radius of 0–5 km; 79 stumps were recorded within this radius, and this was the lowest number of stumps recorded. Generally, the stump distribution varied with increasing distance from the settlements. The number of stumps increased linearly with distance from the settlements. However, the density slightly declined at 15 km and increased at ≥20 km. A high density of stumps was observed within a radius of 10 to 15 km. A total of 149 stumps were recorded within this radius. The results also revealed that most of the trees removed were from lower Diameter at Ankle Height (DAH) classes (5.1–10 cm), as shown in Figure 3a. The mean DAH of stump was 12.74 cm. This was basically because there were few trees with larger stems. The results also revealed that there was an extensive localized harvesting, which targeted mainly fuelwood, poles, and saplings. Poles and saplings/droppers were harvested for kraals, fields, and homesteads, while large trees were harvested for fuelwood. Figure 3b shows how stump density varied with increasing distance from the settlements.

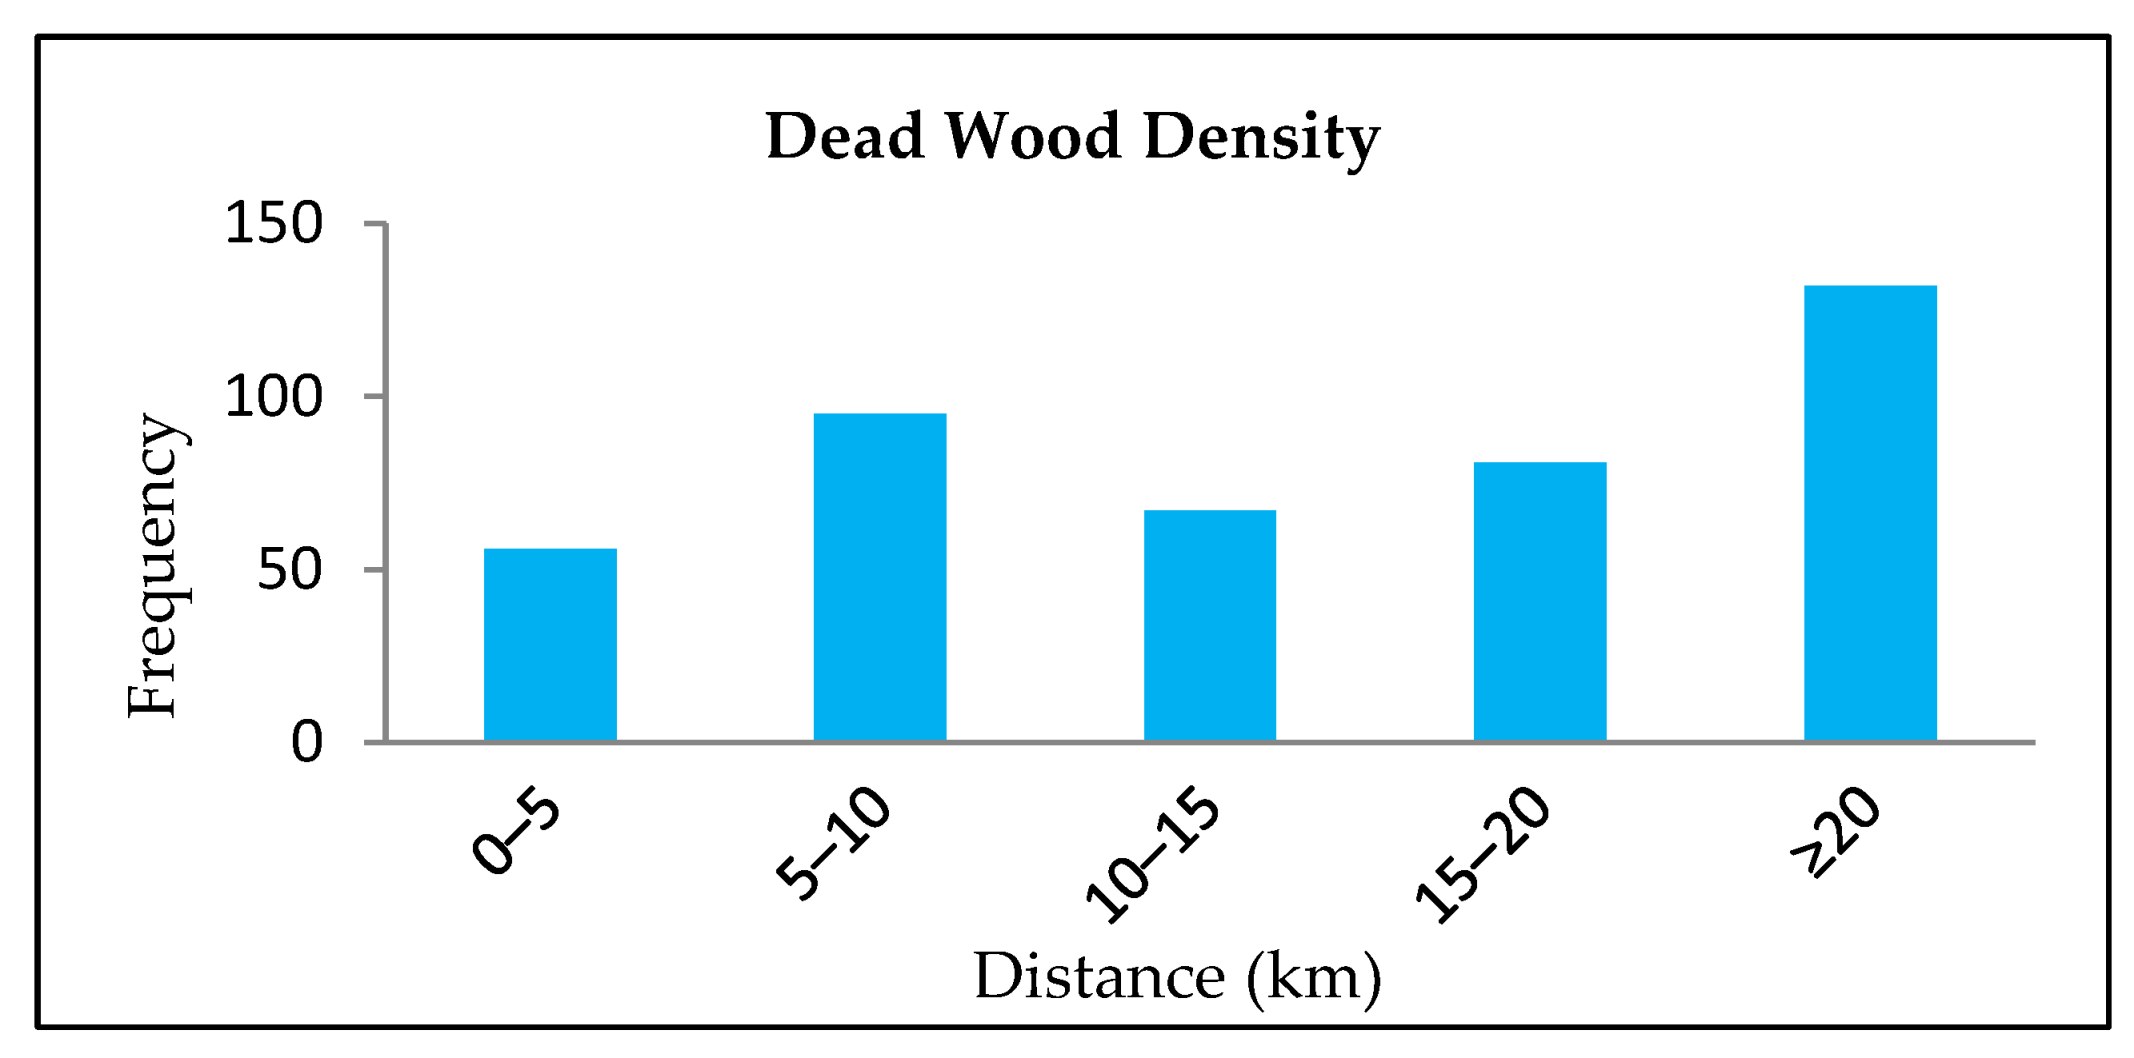
3.4. Availability of Dead Wood

The presence of dead trees was regarded as another crucial vegetation parameter for this study. This parameter was used to determine the availability of fuelwood with the assumption that it has to be collected only from dead wood. The total number of dead trees (both standing and fallen) observed in each sample plot was pooled. The results revealed that there were few dead trees, with a total of 431 of dead trees recorded in the study area. The majority of dead trees were observed to be of different species, with very few examples of Colophospermum mopane. Some observations were also made where the presence of dead trees were a result of human cuttings though the use of an axe. The density of dead wood per plot generally increased as the distance from the settlements increased, as shown by Figure 4. The results also indicated that most of the dead trees were in the lower DBH class. The available dead wood observed cannot provide enough fuelwood if the communities were to engage in commercial harvesting using only dead trees.

3.5. Harvested Volumes from Household Data

Fuelwood is the most collected woodland resource in the two communities. Each household consumed an average of 10,289.63 kg for subsistence and an average of 40,380 kg for commercial purposes per annum. The frequency of harvesting was divided into two categories: those households who collect or buy fuelwood for home consumption and those who use fuelwood for commercial purposes. The results of the household consumption indicated that about 4.35% of households reported that they harvested fuelwood daily, 20.65% harvested and collected fuelwood on weekly basis, 3% collected only twice in a month, 70.65% collected on monthly basis, and only 1% collected occasionally. Moreover, other resources collected in the last 12 months (January to December 2019) were fencing poles (13%), kraal poles (8%), and serala poles (7%). Moreover, the results of the study revealed that households that were involved in trading harvest more frequently than those who only harvest wood resources for home consumption. The trading of wood resources in the study area was mainly focused on selling fuelwood throughout the year. Some of the respondents showed that extraction of fuelwood is done more in winter than in summer. One of the respondents was recorded as saying:
“You came at a time when business is low/slow, business is good in winter so much that sometimes I’m forced to collect fuelwood everyday while customers queue waiting for me.”
The respondent meant that the time at which the researcher came was not good since business was low. He further explained that business is good in winter, as the demand for fuelwood is high during that time. Therefore, he collects more fuelwood in winter than he does during summer season. A total of 27 commercial harvesters were interviewed. The results showed that 7% harvest fuelwood twice in a week. Forty-one (41%) harvest fuelwood on weekly basis, and 15% harvest twice in a week. About 37% of the respondents harvest fuelwood on a monthly basis. Additionally, to avoid underestimation or overestimation of quantity harvested, the commercial harvesters were asked to state the frequency of harvesting fuelwood during winter. The results showed that about 15% of the respondents collect fuelwood daily in winter. About 33% and 41% of the respondents harvest twice in a week and on a weekly basis, respectively, whilst 11% of the respondents harvest fuelwood twice in a month.
The quantities harvested were measured using headload, wheelbarrow, bicycle load, two-wheeled donkey cart, and four-wheeled donkey cart as well as a van and truck load. The cart and van loads were measured in tons then later converted to kilograms. The head, wheelbarrow, and bicycle loads were measured using a scale in kilograms. The quantities collected were divided into household use and commercial purposes. The findings of the study revealed that about 13% of the sampled households used wheelbarrows and headloads to collect fuelwood, and 3% and 10% of the sampled population used bicycles and a van, respectively. About 15% and 46% used a two-wheeled donkey cart and four-wheeled cart, respectively. Furthermore, 19% of the respondents who were engaged in selling fuelwood indicated that they used a two-wheeled cart to collect fuelwood. About 63% of the respondents used a four-wheeled cart, while 15% and 4% used a van and a truck, respectively. The findings of the study show that only fuelwood was collected throughout the year while poles were only harvested when required.
Quantities of fuelwood harvested were estimated for household use. The results of the analysis showed that households who collected by bicycle and their heads harvested less fuelwood than those who used donkey carts and cars. They collected an average of 369.6 ± 139.70 kg and 1488.83 ± 484.23 kg, respectively. Those who use two- and four-wheeled carts collected an average of 4821.43 ± 321.70 kg and 13178.44 ± 494.72 kg, respectively. Moreover, the findings showed that households who were engaged in fuelwood trading collected more than those who used it for household consumption. Poles were normally harvested for different purposes (kraal, house construction, fencing of yards or fields). The average quantities collected were also divided into two categories: home consumption and trading. Results revealed that an average of 498 poles were collected for home use, such as fencing yards, kraal, serala, etc., with an average length of 2.8 m and an average diameter of 9.73 cm. The analysis results for commercial purpose showed that an average of 323 were harvested. The extent of use of different resources is shown in Table 3.

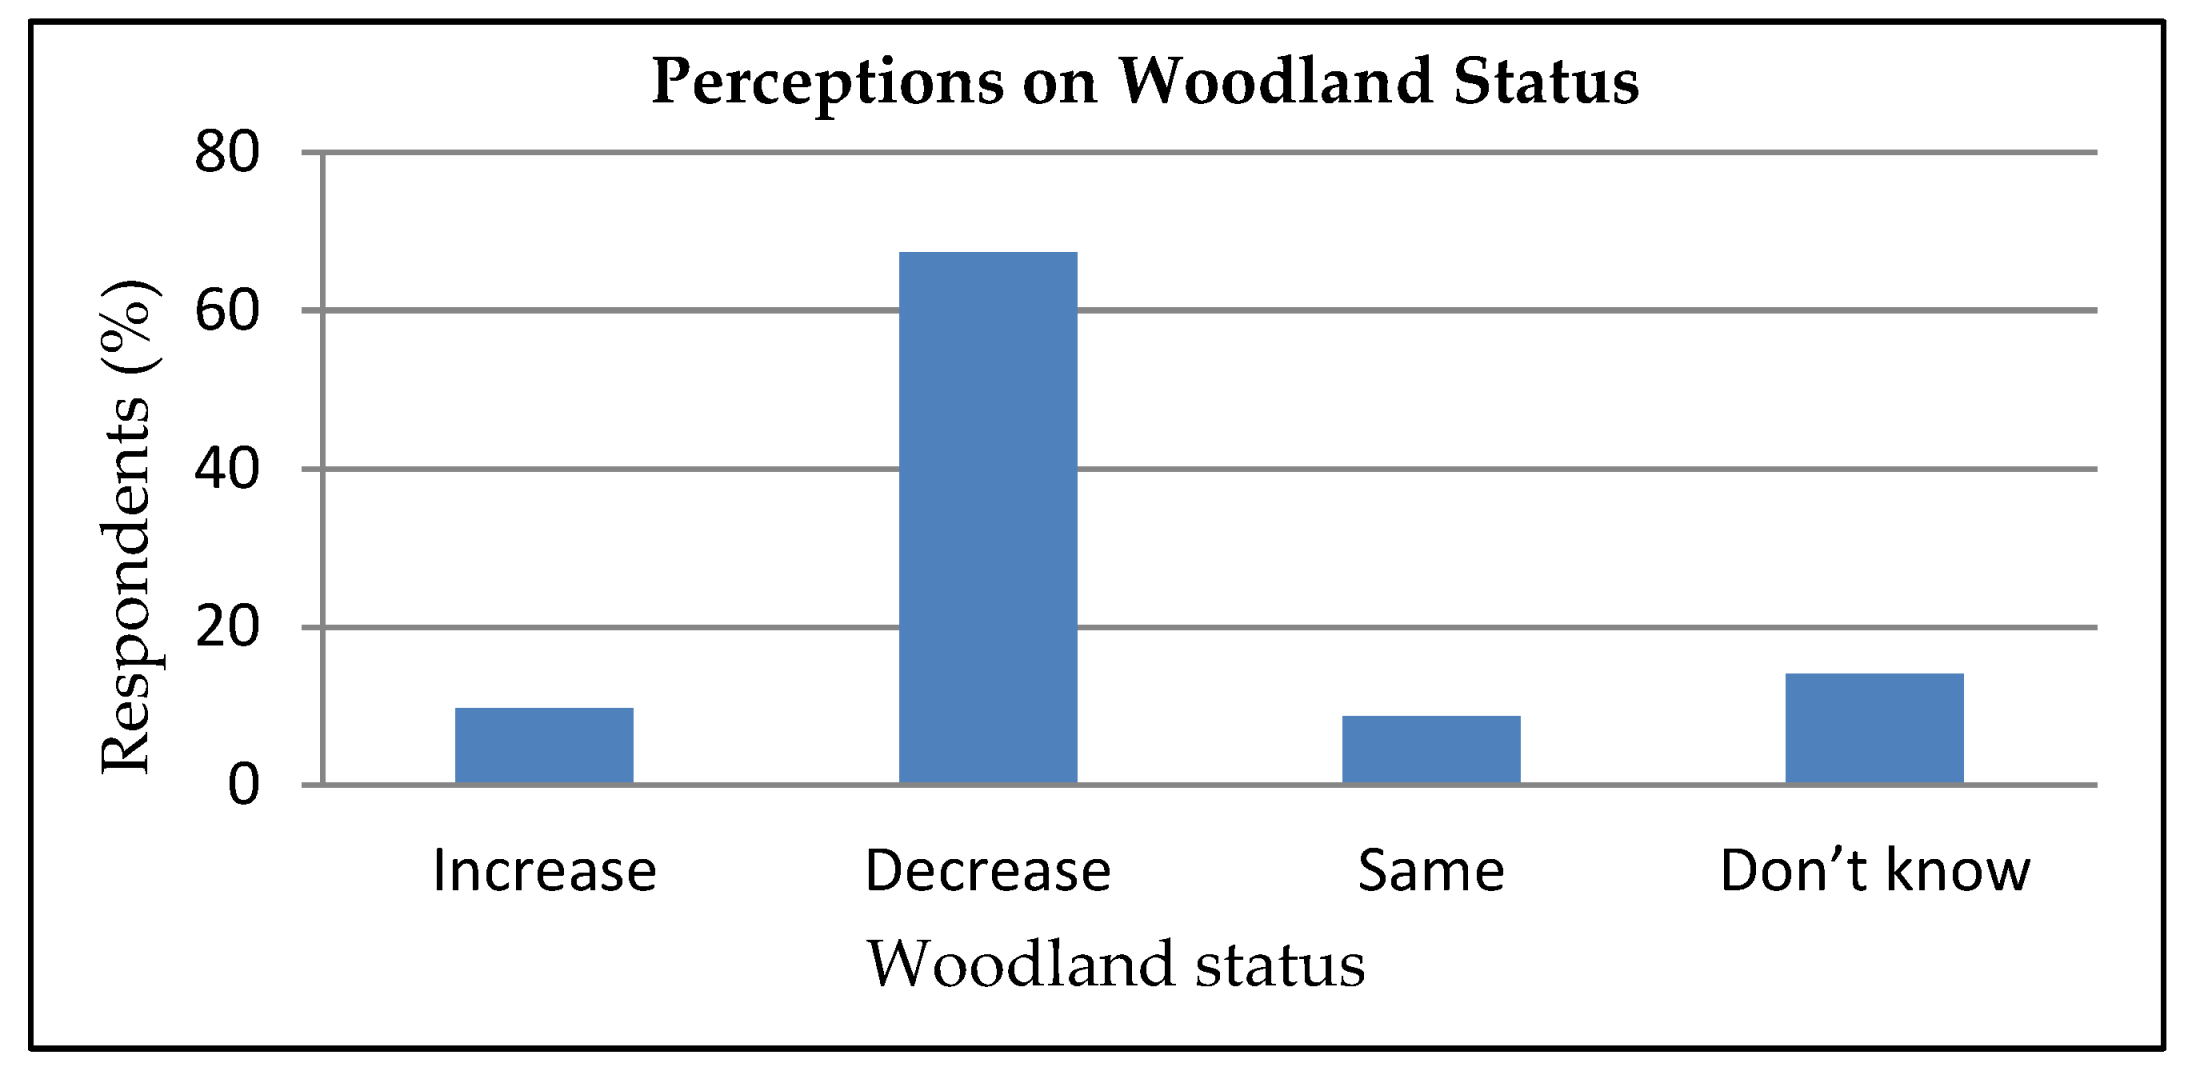
3.6. Household’s Perception on Woodland Status

The results of the study revealed that out of 92 sampled household, 62 (67%) of the respondents indicated that woodland cover has decreased over time, 9 (10%) indicated that it has increased, 8 (9%) respondents believed that wood cover has been the same, while 13 (14%) respondents have no idea about the status of the woodlands (see Figure 5). Respondents who indicated that woodland cover is decreasing stated conversion of woodland areas to farms in the area as the reason behind the decrease.

3.7. Households’ Perceptions on Distance Travelled to Access Woodland Resources

To get a clear picture of the availability of woodland resources in relation to the distance from the two settlements, the sampled households were asked to comment on the distance they travelled to access wood resources when comparing it to the time they started collecting the resources. The results were then corroborated with field data on the availability of wood resources within the study area. Out of the 92 respondents, 75% of the respondents indicated that the distance they travelled to collect resources has increased from the time they started harvesting, 14% of the respondents showed that the distance they travel was still the same, and 10% of the respondents did not know, as shown in Figure 6.

3.8. Forest/Woodland Management, Regulation, and Enforcement

3.8.1. Drivers of Woodland Change

The results indicated that factors such as high demand of resources in urban areas, unemployment, as well as poverty have caused high dependency on wood resources in the study area. Commercialization of fuelwood is threatening wood resources, as more people have ventured into clear-cutting of live trees, especially in this epoch of high unemployment rate and high poverty in rural communities. Key informants revealed that the status of the woodland was deteriorating over time due to overexploitation of woody species for firewood and other services. However, efforts were being made to reduce overexploitation through the issuance of harvesting dealers and harvester’s permits for various veld products. On the major challenges to woodland resource use, the results of the study showed that although people were aware that harvesting or trading without a permit is illegal, there were some concerns that, in most cases, people who were involved in fuelwood trading either used permits that had expired or did not have permits at all. Other constraints faced by the Department of Forestry, Range, and Resources in managing the forest and range resources were the frequent outbreak of wildfires affecting the woodland resources.

3.8.2. Rules and Law Enforcement

The results of the study showed that local people were aware of the rules and regulations regarding the use of the woodlands. An interview with an official from the Department of Forestry, Range, and Resources (DFRR) revealed that forest and range resource management was done by the state in protected forest reserves, and management was lacking in communal areas. Sustainable management of forests and woodlands were governed by the Forest Act of 1968, Forest Policy of 2011, and the Agricultural Resource Conservation Act of 2006. The Conservation Act of 2006 mainly focuses on the utilization of veld products. The key informant from the Department of Forestry, Range, and Resources further revealed that in conserving and managing forests resources, efforts were being made to reduce land degradation by promoting tree planting and fire management practices. They also promote public awareness, community-based forest and range resource management, and conduct national forest inventory and rangeland ecology reports in monitoring harvesting. To enforce the law, the DFRR officer stated that the available legislative instruments allow the government to prosecute those who break the law; however, no legal prosecution has been pursued so far.

4. Discussion

The findings of the study have indicated that fuelwood is a vital resource in Makomoto and Foley communities, as it improves their socio-economic status. The estimated annual fuelwood collection for household consumption was 7633.68 kg and 40,457.08 kg for commercial purposes. The results confirmed that much of the collected fuelwood was occurring at a commercial scale driven by the demand from various localities. In this area, there has been a great increase in commercial fuelwood production, indicating that fuelwood collection is a significant rural household activity. This was corroborated by key informants who indicated that fuelwood trading had increased significantly in the area over the years. Hence, this increase is likely to affect resource sustainability and woodland ecosystem. Recent studies [1,64] revealed that fuelwood extraction has the potential to cause woodland degradation. The study results revealed that fuelwood utilization is largely driven by socio-economic factors. The two communities in the study area were more focused on improving their standard of living and hence harvested higher quantities of fuelwood for commercial purposes compared to subsistence utilization. The challenging economic circumstances coupled with effects of climate variability resulting in poor crop yields drives local people to resort to woodland resource use as an alternative source of income, hence increasing dependency on the resources [65,66]. This may cause woodland degradation and loss of ecosystem services.
Based on the vegetation survey, the findings of the study indicated that, on average, there were 56 tree stumps per hectare. The obtained average number of stumps per hectare was very low as compared to other studies conducted in Miombo woodland, Tanzania [17,67]. However, these studies covered a bigger area with many sampled plots. The studies also revealed that the majority of the stumps were new, an indication of regular and ongoing presence of human harvesting practices. This is contrary to other studies whereby the majority of the recorded stumps were old [68]. The results of the study found that Colophospermum mopane had the highest density of stumps. Colophospermum mopane was the most preferred species for fuelwood and other construction uses due to its good wood quality. It was also observed that it was a preferred species because it is a strong heart-wood, which in most cases, is resistant to termite attack even when untreated poles are used for construction purposes [69,70]. On the other hand, it was observed that there were too few dead trees to provide enough fuelwood for commercialization if the communities were to use only dead wood. High-density deadwood recorded between 5 to 10 km from settlements was mostly of not-preferred species.
The results revealed that past and present harvesting activities observed in the study area had a significant impact on the woodland structure. The predominance of high stump density (85 stumps per sample plot) in certain sites and at varying distances with visible tracks leading to harvested sites were indicators of human activities in the area. The findings were similar to the observations made by Fashing et al. [12] in Kenya. Their study revealed that there is a relationship between tracks and human activities, where tracks provided access to pole cutting sites in Kakamega, Kenya. A similar trend of road networks reflecting harvesting activities was recorded in communal Miombo woodlands of eastern Tanzania where the tracks were used for vehicular access to collect forest products. Moreover, there is evidence of extensive localized harvesting as well as selective removal of certain tree stems in some areas. This was probably due to varying local species preferences, land use practices, demands, and the availability of the woodland resources. This is similar to a conclusion made by Sassen and Sheil [71] on the patterns and the extent of human impact subject to the demand and availability of the resource. The incidence of harvesting activities observed in the study area creates pressure on the woodlands, causing greater changes in tree-size class structure. In accordance with this study’s results, Hennenberg et al. [72] highlighted that savannas with fewer species experience more severe impacts of disturbance than forests.
Furthermore, the results indicated that there is a relatively low proportion of large, standing trees (stem diameter ≥30 cm), as majority of trees had a stem diameter less than 30 cm, and more than 70% were less than 5 m in height. These results could be an indication that large trees were removed during the harvesting activities, leaving small saplings for survival. Similar findings were observed by Hennenberg et al. [72] that persistent removals of large trees leave small-sized plants. In general, the higher density of larger trees were observed at higher altitudes and increased with distance from the settlements due to less human impact on high-elevated areas [73]. Furthermore, the results revealed high tree numbers of smaller stem sizes showing a sign of progression from savanna woodland to scrubland. The observed large proportion of mopane scrubland can be a result of the intensity and extent of the removal of mature trees for commercial fuelwood and construction purposes, hence affecting the woodland structure. Studies [74,75] have reported anthropogenic activities to be contributing factors in altering tree composition from mature forest to savanna types. Sassen and Sheil [71] and Mwampamba [76] also noted that commercial fuelwood extraction has a greater impact on the forest since it involves the removal of an entire tree. It also reduces tree productivity and regeneration capacity [77].
Interestingly, the study found that most harvested trees were of the small stem-diameter classes, predominantly in the 5.1–10 cm diameter class, and this tree size was mostly cut for fencing poles or droppers. Trees in the study areas rarely grow big, as they are continuously harvested. The harvesting of poles has been reported to have a negative impact on tree stems [15,78]. Harvesting of small-stem-sized trees was also influenced by the local harvester preferences, such as using round logs for construction purposes rather than splitting logs. The choice of harvesting small-stemmed poles may be due to a reported decline of big trees in area since the area is dominated by small-sized trees. The long-term resource extraction has an impact on the woodland cover where an area becomes more homogenous due to the disappearance of big trees and an increase in the growth of saplings or young trees [79].
Field-based data indicated that the intensity of stump densities varied widely across the study area. There was an upward rise in the harvesting intensity with increasing distance from the settlements. Intensities of cutting were observed at different sites, with a high number of stumps recorded between 10 to 15 km distances from the settlements. This is contrary to Luonga et al. [80], who conducted a study in Miombo woodlands in Tanzania and found that harvesting intensity decreased with increasing distance from the village. The intensity of harvesting along the observed extraction gradient is attributed to the availability of woodland resources consisting of different tree sizes at the time of harvesting. Similar findings were ascertained from Ongoye Forest Reserve in South Africa, where harvesting intensity concentrated on the availability of the resource, which appeared to be adequate to sustain the existed harvesting rates [81]. The high recorded number of stumps were observed in areas near cultivation lands. The different land-use activities taking place at those sites led to cutting of trees, especially saplings and small poles. For example, people who are involved in livestock farming and/or crop farming cut live trees for fencing kraals and ploughing fields.
The results of this study revealed that Botswana’s goal of achieving sustainable forests and range resources is reinforced by the Forest Act of 1968, the Forest Policy of 2011, and also regulated by the Agricultural Resource Conservation Act of 1974. The Forest Act’s main focus is to regulate and protect forest and forest products in protected areas. This Act neglects the sustainability of forests in communal areas. In addition, local communities could not effectively partake in the decision making and sustainable management of the resources. Therefore, it is evident that the old policies and legislation do not adequately address some woodland issues due to the complex nature of woodland resources in terms of environmental, social, cultural, and significant economic contribution. This is similar to forest policies and regulation of mangrove forests in West Africa [82,83] and Miombo woodlands in Southern Africa [84]. Therefore, there is need to develop a comprehensive new national forest policy to sustainably manage woodland resources and protect them from depletion. The new national policy should adopt and implement a participatory approach in managing forest and range resources and decision making. These may include tradition leaders, non-governmental agencies, local community members, and political and private sectors. This will make the new national policy comprehensive and implementable in the sustainable management of natural resources and woodlands. Various participatory approaches have been practiced in many African and Southern African countries [85,86,87]. These approaches empower local communities as managers of community forests and recognize the contribution of forest and woodland resources to their livelihoods [88,89,90].
During the interviews, key informants cited the lack of an effective monitoring and evaluation system as one of the major challenges in the sustainable management of the woodlands. Local communities are provided with forest and range resource use permits for various products, but due to uncoordinated monitoring, people who are in commercial fuelwood production harvest more than the quantity prescribed on the permits, and some harvest without permits, which leads to overexploitation of the resources. Moreover, the role of the local people in woodland management is unclear. If local harvesting is to be effectively regulated and monitored, there is a need to decentralize sustainable management interventions and formulate a community-based monitoring system, such as the Management-Oriented Monitoring System, for the locals to take responsibility in monitoring the use of resources. The decentralization process and implementation of local monitoring system in some countries has provided local managers with sufficient information and knowledge to allow relevant management interventions targeting key issues to forests and woodlands functions [91,92], hence leading to improved forest and woodland management.

5. Conclusions

This study utilized vegetation and socio-economic data to quantify woodland resource extraction rates and its effects on woodland density and structure. Based on the vegetation data, this study reported low levels of tree removal per hectare in the study area. Although the average level of harvesting per hectare is relatively low, there were instances where high levels of harvesting were observed. In addition, findings revealed that high tree removals were observed near farm and cultivation lands. A great concern is that the mopane tree is the most harvested species, which exposes it to an increased risk of extinction if appropriate management strategies are not put in place to ensure sustainability of this ecosystem. Furthermore, variation in the intensity of harvesting within the study area was associated with the unavailability of woodland resources, especially Colophospermum mopane, which is the most preferred tree species in the area. On the other hand, household data showed that large quantities of fuelwood were consumed per annum due to the commercialization of woodland resources for fuelwood production. Due to the increasing demand of fuelwood arising from its commercialization, there is evidence of unsustainable harvesting of mopane tree species. Therefore, sustainable harvesting practices are required to curb overexploitation of the existing large trees in order to maintain the ecological balance within the savanna ecosystem. Cutting poles for different purposes and increased commercialization of fuelwood have been identified as main drivers of tree removals in the area, and this could be detrimental to the woodland ecosystem. Therefore, these drivers should properly be managed to reduce pressure on the woodlands.
Management and maintenance of savanna woodland ecosystem requires appropriate policies that are aimed at addressing environmental, social, and economic issues of forest and woodland resources. However, the absence of local people in woodland management systems, planning, and outdated national policies governing the sustainable utilization of woodland resources have led to unsustainable use and over exploitation of woodland resources. Therefore, an effective system of reinforcing conservation and management rules at community level through village chiefs or traditional leaders is essential. It is also important to introduce monitoring tools, such as the Management-Oriented Monitoring System, to rural communities for sustained management of woodland ecosystems. This tool empowers local communities to monitor and manage their natural resources. There is also a need to encourage formation of Community-Based Natural Resource Management (CBNRM) projects for forest and range resources.
Finally, this study was limited to quantifying woodland resource extraction rates using stump density and quantities of woodland resources collected by households. The use of both stump density and household data helped to assess the main drivers of tree removal in the study area. However, the study did not quantify the contribution of each driver to tree removal. Therefore, a similar study is recommended to quantify the contribution of each driver to tree removal and develop a methodology for quantifying the annual extraction rate contributed by each driver in the local settings.

Author Contributions

All authors were responsible for conceiving and designing the study. G.L.P. collected data, analyzed data, and wrote the paper. M.I.M., G.M. and M.T.S. revised and edited the paper. All authors have read and agreed to the published version of the manuscript.

Funding

This study was partially funded by the Office of Research and Development at the University of Botswana as part of PhD work.

Institutional Review Board Statement

The study was conducted according to the guidelines of the Declaration of Helsinki and approved by the University of Botswana Institutional Review Board (UBR/RES/IRB/SDC/070) on 18 October 2019.

Informed Consent Statement

Informed consent was obtained from all subjects involved in the study.

Acknowledgments

The authors would like to thank the Office of Research and Development for the financial support during data collection and the dissemination of the results. Additionally, we appreciate the valuable support and generosity of the residents of the two communities where the study was conducted.

Conflicts of Interest

The authors declare no conflict of interest.

References

  1. Kalema, V.N.; Witkowski, E.T.F.; Erasmus, B.F.N.; Mwavu, E.N. The Impacts of Changes in Land Use on Woodlands in an Equatorial African Savanna. Land Degrad. Dev. 2015, 26, 632–641. [Google Scholar] [CrossRef]
  2. Baumann, M.; Ozdogan, M.; Wolter, P.T.; Krylov, A.; Vladimirova, N.; Radeloff, V.C. Landsat remote sensing of forest windfall disturbance. Remote Sens. Environ. 2014, 143, 171–179. [Google Scholar] [CrossRef]
  3. Ni, J.; Luo, D.H.; Xia, J.; Zhang, Z.H.; Hu, G. Vegetation in karst terrain of southwestern China allocates more biomass to roots. Solid Earth 2015, 6, 799–810. [Google Scholar] [CrossRef] [Green Version]
  4. Bahuguna, V.K. Forests in the Economy of the Rural Poor: An Estimation of the Dependency Level. J. Hum. Environ. 2000, 29, 126. [Google Scholar] [CrossRef]
  5. Malimbwi, R.; Chidumayo, E.; Zahabu, E.; Kingazi, S.; Misana, S.; Luoga, E.; Nduwamungu, J. Woodfuel. In The Dry Forests and Woodlands of Africa; Routledge: London, UK, 2010; pp. 162–184. [Google Scholar]
  6. Hegde, R.; Enters, T. Forest products and household economy: A case study from Mudumalai Wildlife Sanctuary, Southern India. Environ. Conserv. 2000, 27, 250–259. [Google Scholar] [CrossRef]
  7. Pattanayak, S.K.; Sills, E.O.; Mehta, A.D.; Kramer, R.A. Local uses of parks: Uncovering patterns of household production from forests of Siberut, Indonesia. Conserv. Soc. 2003, 1, 209–222. [Google Scholar]
  8. Ouedraogo, I.; Tigabu, M.; Savadogo, P.; Compaoré, H.; Odén, P.; Ouadba, J. Land cover change and its relation with population dynamics in Burkina Faso, West Africa. Land Degrad. Dev. 2010, 21, 453–462. [Google Scholar] [CrossRef]
  9. Chirwa, P.; Larwanou, M.; Syampungani, S.; Babalola, F. Management and restoration practices in degraded landscapes of Southern Africa and requirements for up-scaling. Int. For. Rev. 2015, 17, 31–42. [Google Scholar] [CrossRef]
  10. Hafner, J.; Uckert, G.; Graef, F.; Hoffmann, H.; Kimaro, A.A.; Sererya, O.; Sieber, S. A quantitative performance assessment of improved cooking stoves and traditional three-stone-fire stoves using a two-pot test design in Chamwino, Dodoma, Tanzania. Environ. Res. Lett. 2017, 13, 025002. [Google Scholar] [CrossRef]
  11. Silva, J.A.; Sedano, F.; Flanagan, S.; Ombe, Z.A.; Machoco, R.; Meque, C.H.; Sitoe, A.; Ribeiro, N.; Anderson, K.; Baule, S.; et al. Charcoal-related forest degradation dynamics in dry African woodlands: Evidence from Mozambique. Appl. Geogr. 2019, 107, 72–81. [Google Scholar] [CrossRef]
  12. Fashing, P.J.; Forrestel, A.; Scully, C.; Cords, M. Long-term tree population dynamics and their implications for the conservation of the Kakamega Forest, Kenya. Biodivers. Conserv. 2004, 13, 753–771. [Google Scholar] [CrossRef]
  13. Butz, R. Changing land management: A case study of charcoal production among a group of pastoral women in northern Tanzania. Energy Sustain. Dev. 2013, 17, 138–145. [Google Scholar] [CrossRef]
  14. Zhang, J.J.; Fu, M.C.; Zeng, H.; Geng, Y.H.; Hassani, F. Variations in ecosystem service values and local economy in response to land use: A case study of Wu’an, China. Land Degrad. Dev. 2011, 24, 236–249. [Google Scholar] [CrossRef]
  15. Mwavu, E.N.; Witkowski, E.T.F. Land-use and cover changes (1988–2002) around budongo forest reserve, NW Uganda: Implications for forest and woodland sustainability. Land Degrad. Dev. 2008, 19, 606–622. [Google Scholar] [CrossRef]
  16. Chidumayo, E.N.; Gumbo, D.J. The Dry Forests and Woodlands of Africa: Managing for Products and Services; Earthscan: London, UK, 2010. [Google Scholar]
  17. Manyanda, B.J.; Nzunda, E.F.; Mugasha, W.A.; Malimbwi, R.E. Estimates of Volume and Carbon Stock Removals in Miombo Woodlands of Mainland Tanzania. Int. J. For. Res. 2020, 2020, 1–10. [Google Scholar] [CrossRef] [Green Version]
  18. Chidumayo, E.N. Changes in miombo woodland structure under different land tenure and use systems in central Zambia. J. Biogeogr. 2002, 29, 1619–1626. [Google Scholar] [CrossRef]
  19. Musvoto, C.; Mapaure, I.; Gondo, T.; Ndeinoma, A.; Mujawo, T. Reality and preferences in community mopane (Colophospermum mopane) woodland management in Zimbabwe and Namibia. Int. J. Soc. Sci. 2007, 1, 173–177. [Google Scholar]
  20. Neelo, J.; Teketay, D.; Kashe, K.; Masamba, W. Stand Structure, Diversity and Regeneration Status of Woody Species in Open and Exclosed Dry Woodland Sites around Molapo Farming Areas of the Okavango Delta, Northeastern Botswana. Open J. For. 2015, 5, 313–328. [Google Scholar] [CrossRef] [Green Version]
  21. Loucks, C.; Ricketts, T.H.; Naidoo, R.; Lamoreux, J.; Hoekstra, J. Explaining the global pattern of protected area coverage: Relative importance of vertebrate biodiversity, human activities and agricultural suitability. J. Biogeogr. 2008, 35, 1337–1348. [Google Scholar] [CrossRef]
  22. Keenan, R.J.; Reams, G.A.; Achard, F.; de Freitas, J.V.; Grainger, A.; Lindquist, E. Dynamics of global forest area: Results from the FAO Global Forest Resources Assessment 2015. For. Ecol. Manag. 2015, 352, 9–20. [Google Scholar] [CrossRef]
  23. Moon, H.; Solomon, T. Forest decline in Africa: Trends and impacts of foreign direct investment: A review. Int. J. Curr. Adv. Res. 2018, 7, 16356–16361. [Google Scholar]
  24. Revermann, R.; Krewenka, K.M.; Schmiedel, U.; Olwoch, J.M.; Helmschrot, J.; Jürgens, N. Climate Change and Adaptive Land Management in Southern Africa: Assessments, Changes, Challenges, and Solutions; Klaus Hess Publishers: Göttingen, Germany, 2018. [Google Scholar]
  25. Oduol, P.; Ajayi, O.C.; Matakala, P.; Akinnifesi, F.K. Indigenous fruit trees in the tropics: Domestication, utilization and commercialization. In The Role of Institutional Arrangements and Policy on the Conservation, Utilization and Commercialization of Indigenous Fruits in Southern Africa; CABI: Wallingford, UK, 2008; pp. 310–321. [Google Scholar]
  26. Kowero, G.; Kaoneka, A.S.; Nhantumbo, I.; Gondo, P.; Jumbe, C.B.; Selänniemi, M. Forest policies in Malawi, Mozambique, Tanzania and Zimbabwe. In World Forests, Markets and Policies; Springer: Dordrecht, The Netherlands, 2001; pp. 311–328. [Google Scholar]
  27. Gujadhur, T. Organisations and Their Approaches in Community Based Natural Resources Management in Botswana, Namibia, Zambia and Zimbabwe; Iucn: Gland, Switzerland, 2000. [Google Scholar]
  28. Mbaiwa, J.E. Community-Based Natural Resource Management in Botswana. In Institutional Arrangements for Conservation, Development and Tourism in Eastern and Southern Africa; Gabler: Wiesbaden, Germany, 2015; pp. 59–80. [Google Scholar]
  29. Sunderlin, W.D.; Dewi, S.; Puntodewo, A.; Müller, D.; Angelsen, A.; Epprecht, M. Why Forests Are Important for Global Poverty Alleviation: A Spatial Explanation. Ecol. Soc. 2008, 13, 13. [Google Scholar] [CrossRef] [Green Version]
  30. Adelabu, S.; Dube, T. Employing ground and satellite-based QuickBird data and random forest to discriminate five tree species in a Southern African Woodland. Geocarto Int. 2015, 30, 457–471. [Google Scholar] [CrossRef]
  31. Benjamin, C.E. Legal pluralism and decentralization: Natural resource management in Mali. World Dev. 2008, 36, 2255–2276. [Google Scholar] [CrossRef]
  32. Arntzen, J.W. An Economic View on Wildlife Management Areas in Botswana; IUCN/SNV CBNRM Support Programme: Gaborone, Botswana, 2003. [Google Scholar]
  33. Botswana Government. Botswana Forest Distribution Map; FAO: Rome, Italy, 2016. [Google Scholar]
  34. Timberlake, W.J.; Chidumayo, E.; Sawadogo, L. Distribution and Characteristics of African Dry Forests and Woodlands: Jonathan Timberlake, Emmanuel Chidumayo and Louis Sawadogo. In The Dry Forests and Woodlands of Africa; Routledge: London, UK, 2010; pp. 23–53. [Google Scholar]
  35. Geldenhuys, C.; Ham, C.; Ham, H. Sustainable Forest Management in Africa: Some Solutions to Natural Forest Management Problems in Africa; Stellenbosch University: Stellenbosch, South Africa, 2008. [Google Scholar]
  36. Garekae, H.; Lepetu, J.; Thakadu, O.T. Forest resource utilisation and rural livelihoods: Insights from Chobe enclave, Botswana. South. Afr. Geogr. J. 2020, 102, 22–40. [Google Scholar] [CrossRef]
  37. Dambe, L.; Mogotsi, K.; Odubeng, M.; Kgosikoma, O. Nutritive value of some important indigenous livestock browse species in semi-arid mixed Mopane bushveld, Botswana. Livest. Res. Rural. Dev. 2015, 27, 1–10. [Google Scholar]
  38. Ghazoul, J. Mopane Woodlands and the Mopane Worm: Enhancing Rural Livelihoods and Resource Sustainability; Final Technical Report; FAO: Rome, Italy, 2006. [Google Scholar]
  39. Statistics Botswana. Botswana Environment Statistics: Natural Disasters Digest 2015; Ministry of Finance and. Development Planning: Gaborone, Botswana, 2016. [Google Scholar]
  40. Hambira, W.L. Screening for climate change vulnerability in Botswana’s tourism sector in a bid to explore suitable adaptation measures and policy implications: A case study of the Okavango Delta. Int. J. Tour. Policy 2011, 4, 51–65. [Google Scholar] [CrossRef]
  41. Byakatonda, J.; Parida, B.; Kenabatho, P.K. Relating the dynamics of climatological and hydrological droughts in semiarid Botswana. Phys. Chem. Earth Parts A/B/C 2018, 105, 12–24. [Google Scholar] [CrossRef]
  42. Fox, J.T.; Vandewalle, M.E.; Alexander, K.A. Land Cover Change in Northern Botswana: The Influence of Climate, Fire, and Elephants on Semi-Arid Savanna Woodlands. Land 2017, 6, 73. [Google Scholar] [CrossRef] [Green Version]
  43. Sebego, R.; Atlhopheng, J.; Chanda, R.; Mulale, K.; Mphinyane, W. Land use intensification and implications on land degradation in the Boteti area: Botswana. Afr. Geogr. Rev. 2019, 38, 32–47. [Google Scholar] [CrossRef]
  44. Teketay, D.; Kashe, K.; Madome, J.; Kabelo, M.; Neelo, J.; Mmusi, M.; Masamba, W. Enhancement of diversity, stand structure and regeneration of woody species through area exclosure: The case of a mopane woodland in northern Botswana. Ecol. Process. 2018, 7, 5. [Google Scholar] [CrossRef]
  45. Akinyemi, F.O.; Kgomo, M.O. Vegetation dynamics in African drylands: An assessment based on the Vegetation Degradation Index in an agro-pastoral region of Botswana. Reg. Environ. Chang. 2019, 19, 2027–2039. [Google Scholar] [CrossRef]
  46. Sah, J.; Ross, M.; Koptur, S.; Snyder, J. Estimating aboveground biomass of broadleaved woody plants in the understory of Florida Keys pine forests. For. Ecol. Manag. 2004, 203, 319–329. [Google Scholar] [CrossRef]
  47. Hansen, M.; DeFries, R.; Townshend, J.; Marufu, L.; Sohlberg, R. Development of a MODIS tree cover validation data set for Western Province, Zambia. Remote Sens. Environ. 2002, 83, 320–335. [Google Scholar] [CrossRef]
  48. Botswana Statistics. Botswana Environment Statistics Water & Climate Digest 2015; Unit, E.S., Ed.; Botswana Statistics: Gaborone, Botswana, 2015. [Google Scholar]
  49. Weare, P.; Yalala, A. Provisional vegetation map of Botswana. Botsw. Notes Rec. 1971, 3, 131–147. [Google Scholar]
  50. Botswana Government. Makomoto Forest Invetory Report; Department of Forestry and Range Resources, M.o.E., Natural Resources Conservation and Tourism: Gaborone, Botswana, 2008. [Google Scholar]
  51. Adjorlolo, C. Estimating Woody Vegetation Cover in an African Savanna Using Remote Sensing and Geostatistics. Ph.D. Thesis, University of KwaZulu-Natal, Pietermaritzburg, South Africa, 2008. [Google Scholar]
  52. Wessels, K.J.; Prince, S.D.; Zambatis, N.; MacFadyen, S.; Frost, P.E.; Van Zyl, D. Relationship between herbaceous biomass and 1-km2 Advanced Very High Resolution Radiometer (AVHRR) NDVI in Kruger National Park, South Africa. Int. J. Remote Sens. 2006, 27, 951–973. [Google Scholar] [CrossRef]
  53. Buja, K.; Menza, C. Sampling Design Tool for ArcGIS: Instruction Manual.[for ESRI ArcGIS 10.0 Service Pack 3 or Higher]; NOAA/National Centers for Coastal Ocean Science: Silver Spring, MD, USA, 2013.
  54. Setshogo, M.; Fenter, F. Trees of Botswana: Names and Distribution; University of Botswana Herbarium: Gaborone, Botswana, 2003. [Google Scholar]
  55. Demisse, G.; Hussin, Y.; van Duren, I.; Lubczynski, M.; Obakeng, O. Remote Sensing and Geostatistics for the Assessment of Spatial Distribution of Savannah Woody Species Biodiversity for Upscaling Transpiration in Serowe, Botswana. In Proceedings of the 6th AARSE International Conference on Earth Observation and Geoinformation Sciences in Support of Africa’s Development, Cairo, Egypt, 30 October–2 November 2006; The National Authority for Remote Sensing and Space Science (NARSS): Cairo, Egypt, 2006. ISBN 1-920-01710-0. [Google Scholar]
  56. Adam, A.M. Sample Size Determination in Survey Research. J. Sci. Res. Rep. 2020, 90–97. [Google Scholar] [CrossRef]
  57. Sarmah, H.K.; Hazarika, B.B. Importance of the size of Sample and its determination in the context of data related to the schools of greater Guwahati. Bull. Gauhati Univ. Math. Assoc. 2012, 12, 55–76. [Google Scholar]
  58. Botswana Statistics. Botswana population and housing census. Dep. Printing Pub. Serv. Gaborone 2011, 211, 143. [Google Scholar]
  59. Gentle, J.E. Random Number Generation and Monte Carlo Methods; Springer: New York, NY, USA, 2003; Volume 381. [Google Scholar]
  60. Etigale, E.; Ajayi, S.; Udofia, S.; Moses, M. Assessment of stand density and growth rate of three tree species in an arboretum within the University of Uyo, Nigeria. J. Res. For. Wildl. Environ. 2014, 6, 8–16. [Google Scholar]
  61. Mutanga, O.; Rugege, D. Integrating remote sensing and spatial statistics to model herbaceous biomass distribution in a tropical savanna. Int. J. Remote Sens. 2006, 27, 3499–3514. [Google Scholar] [CrossRef]
  62. Hudak, A.T.; Lefsky, M.A.; Cohen, W.B.; Berterretche, M. Integration of lidar and Landsat ETM+ data for estimating and mapping forest canopy height. Remote Sens. Environ. 2002, 82, 397–416. [Google Scholar] [CrossRef] [Green Version]
  63. Wallace, C.S.; Watts, J.M.; Yool, S.R. Characterizing the spatial structure of vegetation communities in the Mojave Desert using geostatistical techniques. Comput. Geosci. 2000, 26, 397–410. [Google Scholar] [CrossRef]
  64. Kiruki, H.M.; van der Zanden, E.H.; Malek, Ž.; Verburg, P.H. Land cover change and woodland degradation in a charcoal producing semi-arid area in Kenya. Land Degrad. Dev. 2017, 28, 472–481. [Google Scholar] [CrossRef] [Green Version]
  65. Belcher, B.; Ruíz-Pérez, M.; Achdiawan, R. Global patterns and trends in the use and management of commercial NTFPs: Implications for livelihoods and conservation. World Dev. 2005, 33, 1435–1452. [Google Scholar] [CrossRef]
  66. Kamanga, P.; Vedeld, P.; Sjaastad, E. Forest incomes and rural livelihoods in Chiradzulu District, Malawi. Ecol. Econ. 2009, 68, 613–624. [Google Scholar] [CrossRef]
  67. Thomas, C.S.; Pantaleo, K.T.M.; Salim, M.M.; Sawe, T.C.; Munishi, P.K.T.; Maliondo, S.M. Woodlands degradation in the Southern Highlands, Miombo of Tanzania: Implications on conservation and carbon stocks. Int. J. Biodivers. Conserv. 2014, 6, 230–237. [Google Scholar] [CrossRef]
  68. Zahabu, E. Sinks and Sources: A Strategy to Involve Forest Communities in Tanzania in Global Climate Policy. Ph.D. Thesis, University of Twente, Enschede, The Netherlands, 2008. [Google Scholar]
  69. Makhado, R.; Potgieter, M.; Wessels, D. Colophospermum mopane wood utilisation in the northeast of the Limpopo Province, South Africa. CSIR 2009. [Google Scholar]
  70. Mashabane, L.; Wessels, D.; Potgieter, M. The utilisation of Colophospermum mopane by the Vatsonga in the Gazankulu region (eastern Northern Province, South Africa). South. Afr. J. Bot. 2001, 67, 199–205. [Google Scholar] [CrossRef]
  71. Sassen, M.; Sheil, D. Human impacts on forest structure and species richness on the edges of a protected mountain forest in Uganda. For. Ecol. Manag. 2013, 307, 206–218. [Google Scholar] [CrossRef]
  72. Hennenberg, K.J.; Goetze, D.; Minden, V.; Traoré, D.; Porembski, S. Size-class distribution of Anogeissus leiocarpus (Combretaceae) along forest–savanna ecotones in northern Ivory Coast. J. Trop. Ecol. 2005, 21, 273–281. [Google Scholar] [CrossRef] [Green Version]
  73. Zhou, P.; Luukkanen, O.; Tokola, T.; Hares, M. Comparison of forest stand characteristics and species diversity indices under different human impacts along an altitudinal gradient. Fenn. Int. J. Geogr. 2009, 187, 17–30. [Google Scholar]
  74. Egbinola, C.N. Impacts of Human Activities on Tree Species Composition Along the Forest Savanna Boundary in Nigeria. Indones. J. Geogr. 2016, 47, 115–123. [Google Scholar] [CrossRef] [Green Version]
  75. Ndah, N.R.; Andrew, E.E.; Bechem, E. Species composition, diversity and distribution in a disturbed Takamanda Rainforest, South West, Cameroon. Afr. J. Plant Sci. 2013, 7, 577–585. [Google Scholar]
  76. Mwampamba, T.H. Has the woodfuel crisis returned? Urban charcoal consumption in Tanzania and its implications to present and future forest availability. Energy Policy 2007, 35, 4221–4234. [Google Scholar] [CrossRef]
  77. Thapa, S.; Chapman, D.S. Impacts of resource extraction on forest structure and diversity in Bardia National Park, Nepal. For. Ecol. Manag. 2010, 259, 641–649. [Google Scholar] [CrossRef]
  78. Leaver, J.; Cherry, M.I. Forest product harvesting in the Eastern Cape, South Africa: Impacts on habitat structure. South. Afr. J. Sci. 2020, 116, 1–9. [Google Scholar] [CrossRef]
  79. Rüger, N.; Williams-Linera, G.; Kissling, W.D.; Huth, A. Long-Term Impacts of Fuelwood Extraction on a Tropical Montane Cloud Forest. Ecosystems 2008, 11, 868–881. [Google Scholar] [CrossRef]
  80. Luoga, E.J.; Witkowski, E.; Balkwill, K. Harvested and standing wood stocks in protected and communal miombo woodlands of eastern Tanzania. For. Ecol. Manag. 2002, 164, 15–30. [Google Scholar] [CrossRef]
  81. Boudreau, S.; Lawes, M.; Piper, S.; Phadima, L. Subsistence harvesting of pole-size understorey species from Ongoye Forest Reserve, South Africa: Species preference, harvest intensity, and social correlates. For. Ecol. Manag. 2005, 216, 149–165. [Google Scholar] [CrossRef]
  82. Feka, Z.N. Sustainable management of mangrove forests in West Africa: A new policy perspective? Ocean. Coast. Manag. 2015, 116, 341–352. [Google Scholar] [CrossRef]
  83. Feka, N.Z.; Manzano, M.G.; Dahdouh-Guebas, F. The effects of different gender harvesting practices on mangrove ecology and conservation in Cameroon. Int. J. Biodivers. Sci. Ecosyst. Serv. Manag. 2011, 7, 108–121. [Google Scholar] [CrossRef] [Green Version]
  84. DeWees, P.A.; Campbell, B.M.; Katerere, Y.; Sitoe, A.; Cunningham, A.B.; Angelsen, A.; Wunder, S. Managing the Miombo Woodlands of Southern Africa: Policies, Incentives and Options for the Rural Poor. J. Nat. Resour. Policy Res. 2010, 2, 57–73. [Google Scholar] [CrossRef] [Green Version]
  85. Wily, L.A. Participatory forest management in Africa: An overview of progress and issues. In Proceedings of the Second International Workshop on Participatory Forestry in Africa. Defining the Way Forward: Sustainable Livelihoods and Sustainable Forest Management Through Participatory Forestry, Arusha, United Republic of Tanzania, 18–22 February 2002; pp. 18–22. [Google Scholar]
  86. Blomley, T.; Pfliegner, K.; Isango, J.; Zahabu, E.; Ahrends, A.; Burgess, N. Seeing the wood for the trees: An assessment of the impact of participatory forest management on forest condition in Tanzania. Oryx 2008, 42, 380–391. [Google Scholar] [CrossRef] [Green Version]
  87. Turyahabwe, N.; Geldenhuys, C.J.; Watts, S.; Obua, J. Local organisations and decentralised forest management in Uganda: Roles, challenges and policy implications. Int. For. Rev. 2007, 9, 581–596. [Google Scholar] [CrossRef]
  88. Syampungani, S.; Chirwa, P.W.; Akinnifesi, F.K.; Sileshi, G.; Ajayi, O.C. The miombo woodlands at the cross roads: Potential threats, sustainable livelihoods, policy gaps and challenges. Nat. Resour. Forum 2009, 33, 150–159. [Google Scholar] [CrossRef]
  89. Lund, J.; Treue, T. Are We Getting There? Evidence of Decentralized Forest Management from the Tanzanian Miombo Woodlands. World Dev. 2008, 36, 2780–2800. [Google Scholar] [CrossRef]
  90. Persha, L.; Blomley, T. Management Decentralization and Montane Forest Conditions in Tanzania. Conserv. Biol. 2009, 23, 1485–1496. [Google Scholar] [CrossRef] [PubMed]
  91. Topp-Jørgensen, E.; Poulsen, M.K.; Lund, J.; Massao, J.F. Community-based Monitoring of Natural Resource Use and Forest Quality in Montane Forests and Miombo Woodlands of Tanzania. Biodivers. Conserv. 2005, 14, 2653–2677. [Google Scholar] [CrossRef]
  92. Bellfield, H.; Sabogal, D.; Goodman, L.; Leggett, M. Case Study Report: Community-Based Monitoring Systems for REDD+ in Guyana. Forests 2015, 6, 133–156. [Google Scholar] [CrossRef] [Green Version]
Figure 1. Location Map.
Sustainability 13 11316 g001
Figure 2. (a) Spatial distribution of tree density across the study area. (b) Map of the study area highlighting the high and low areas.
Sustainability 13 11316 g002
Figure 3. (a) Size class distribution of the harvested stump diameter measured at ankle height. (b) Variation in stump density along the observed extraction gradient. The error bars indicate standard deviation.
Sustainability 13 11316 g003
Figure 4. Dead wood density with distance from settlements.
Sustainability 13 11316 g004
Figure 5. Perception of respondents on woodland status.
Sustainability 13 11316 g005
Figure 6. Perception of respondents on the distance travelled to access woodland resources.
Sustainability 13 11316 g006
Table 1. Total number of different species found in the study area.
SpeciesFamilyNumber of Individuals
Acacia eriolobaFabaceae16
Acacia erubescensFabaceae427
Acacia galpiniiFabaceae9
Acacia KarooFabaceae363
Acacia melliferaFabaceae78
Acacia nigrescensFabaceae17
Acacia niloticaFabaceae209
Acacia tortilisFabaceae307
Boscia albitruncaCapparaceae78
Boscia reterniversCapparaceae49
Combretum ApiculatumCombretaceae393
Colophospermum mopaneFabaceae2171
Combretum hereroenseCombretaceae21
Combretum imberbeCombretaceae27
Commiphora africanaBurseraceae82
Commiphora mossambicensisBurseraceae97
Commiphora pyrencathoidesBurseraceae4
Dichrostachys cinereaFabaceae109
Diospyros lycioidesEbenaceae7
Grewia bicolorTiliaceae11
Grewia flavaTiliaceae59
Grewia retinervisTiliaceae41
lbizia anthelminticaFabaceae13
Peltophorum africanumMalvaceae35
Philenoptera nelsiiFabaceae5
Sclerocarya birreaAnacardiaceae9
Steganotaenia araliaceaApiaceae19
Terminalia prunioidesCombretaceae217
Terminalia sericeaCombretaceae23
Ximenia americanaOlacaceae8
Ziziphus mucronataRhamnaceae24
Table 2. Total number of stumps recorded in each sample plot in the study area.
Plot NoDensity/0.036 ha
138
226
3, 2033
485
5, 1414
6, 2813
711
85
91
10, 13, 2622
1129
12, 254
15, 1730
16, 1917
1835
21, 318
2228
2325
2410
2720
2919
306
327
Table 3. Annual average quantities of woodland resources harvested per household.
Woodland ResourcesUnitsMode of CollectionQuantities HarvestedSeason
Household Consumption
Fuelwood
Fencing poles
kgHeadload
WheelbarrowBicycle
Two-wheeled cart
Four-wheeled cart
Van
1488.83 ± 484.23
1061.02 ± 418.45
369.6 ± 139.70
4821.43 ± 321.43
13,178.44 ± 494.72
11,047.22 ± 1252.76
Throughout the year
NumberNumber of logs191.66 ± 29.41Once off
Kraal poles
Serala poles
NumberNumber of logs102.22 ± 14.98Seasonally
NumberFour-wheeled cart74.29 ± 18.50Seasonally
House rafters
Commercial Purposes
Fuelwood
Fencing poles
NumberNumber of poles12.85 ± 1.22Once off
kgTwo-wheeled cart
Four-wheeled cart
Van
Truck
14,318.18 ± 1901.28
49,200 ± 5396.60
18,450 ± 3350.70
12,300
All year round
NumberNumber of logs323.14 ± 44.69Seasonally
Values are arranged as means followed by standard error of means. Note: Serala is a traditional structure designed to preserve harvested agricultural crops, such as sorghum, maize, and beans.
Publisher’s Note: MDPI stays neutral with regard to jurisdictional claims in published maps and institutional affiliations.

