Phylloquinone and Menaquinone-4 Tissue Distribution at Different Life Stages in Male and Female Sprague–Dawley Rats Fed Different VK Levels Since Weaning or Subjected to a 40% Calorie Restriction since Adulthood

Abstract
:1. Introduction
2. Methods and Materials
2.1. Animals and Diets
2.2. Sacrifice Procedure (Applies to Both Studies)
2.3. Analytical Procedure (Applies to Both Studies)
2.4. Statistical Analysis
3. Results
3.1. Study 1
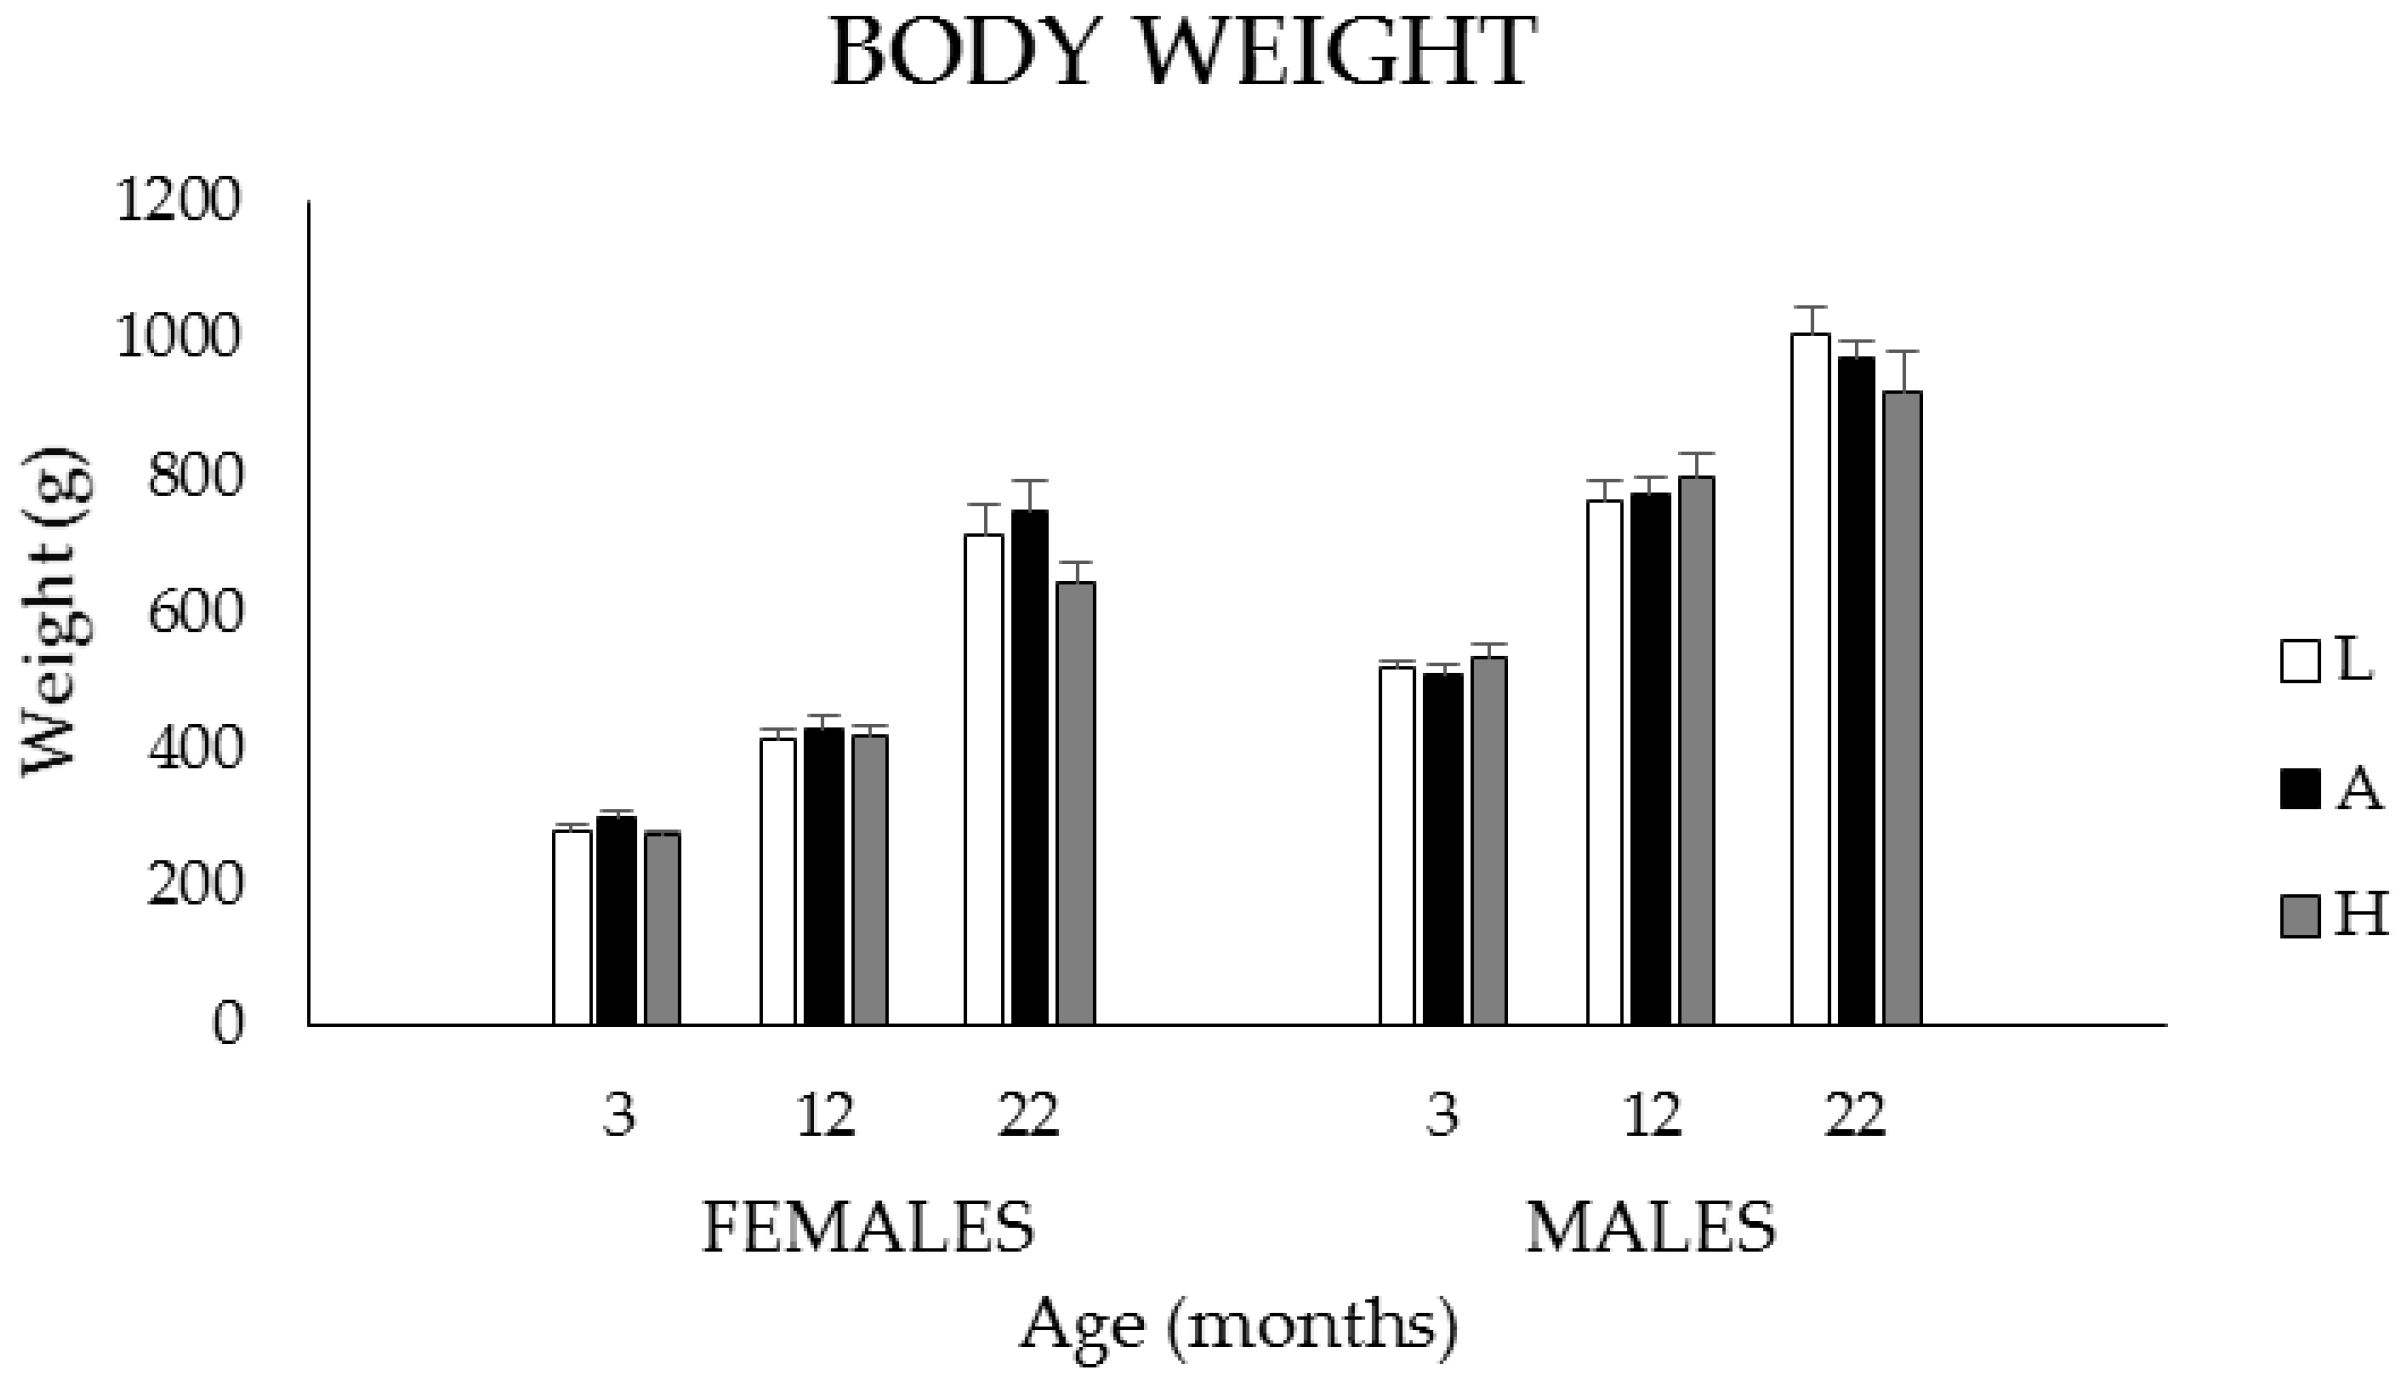
3.1.1. Body Weights, Food, and K1 Intakes
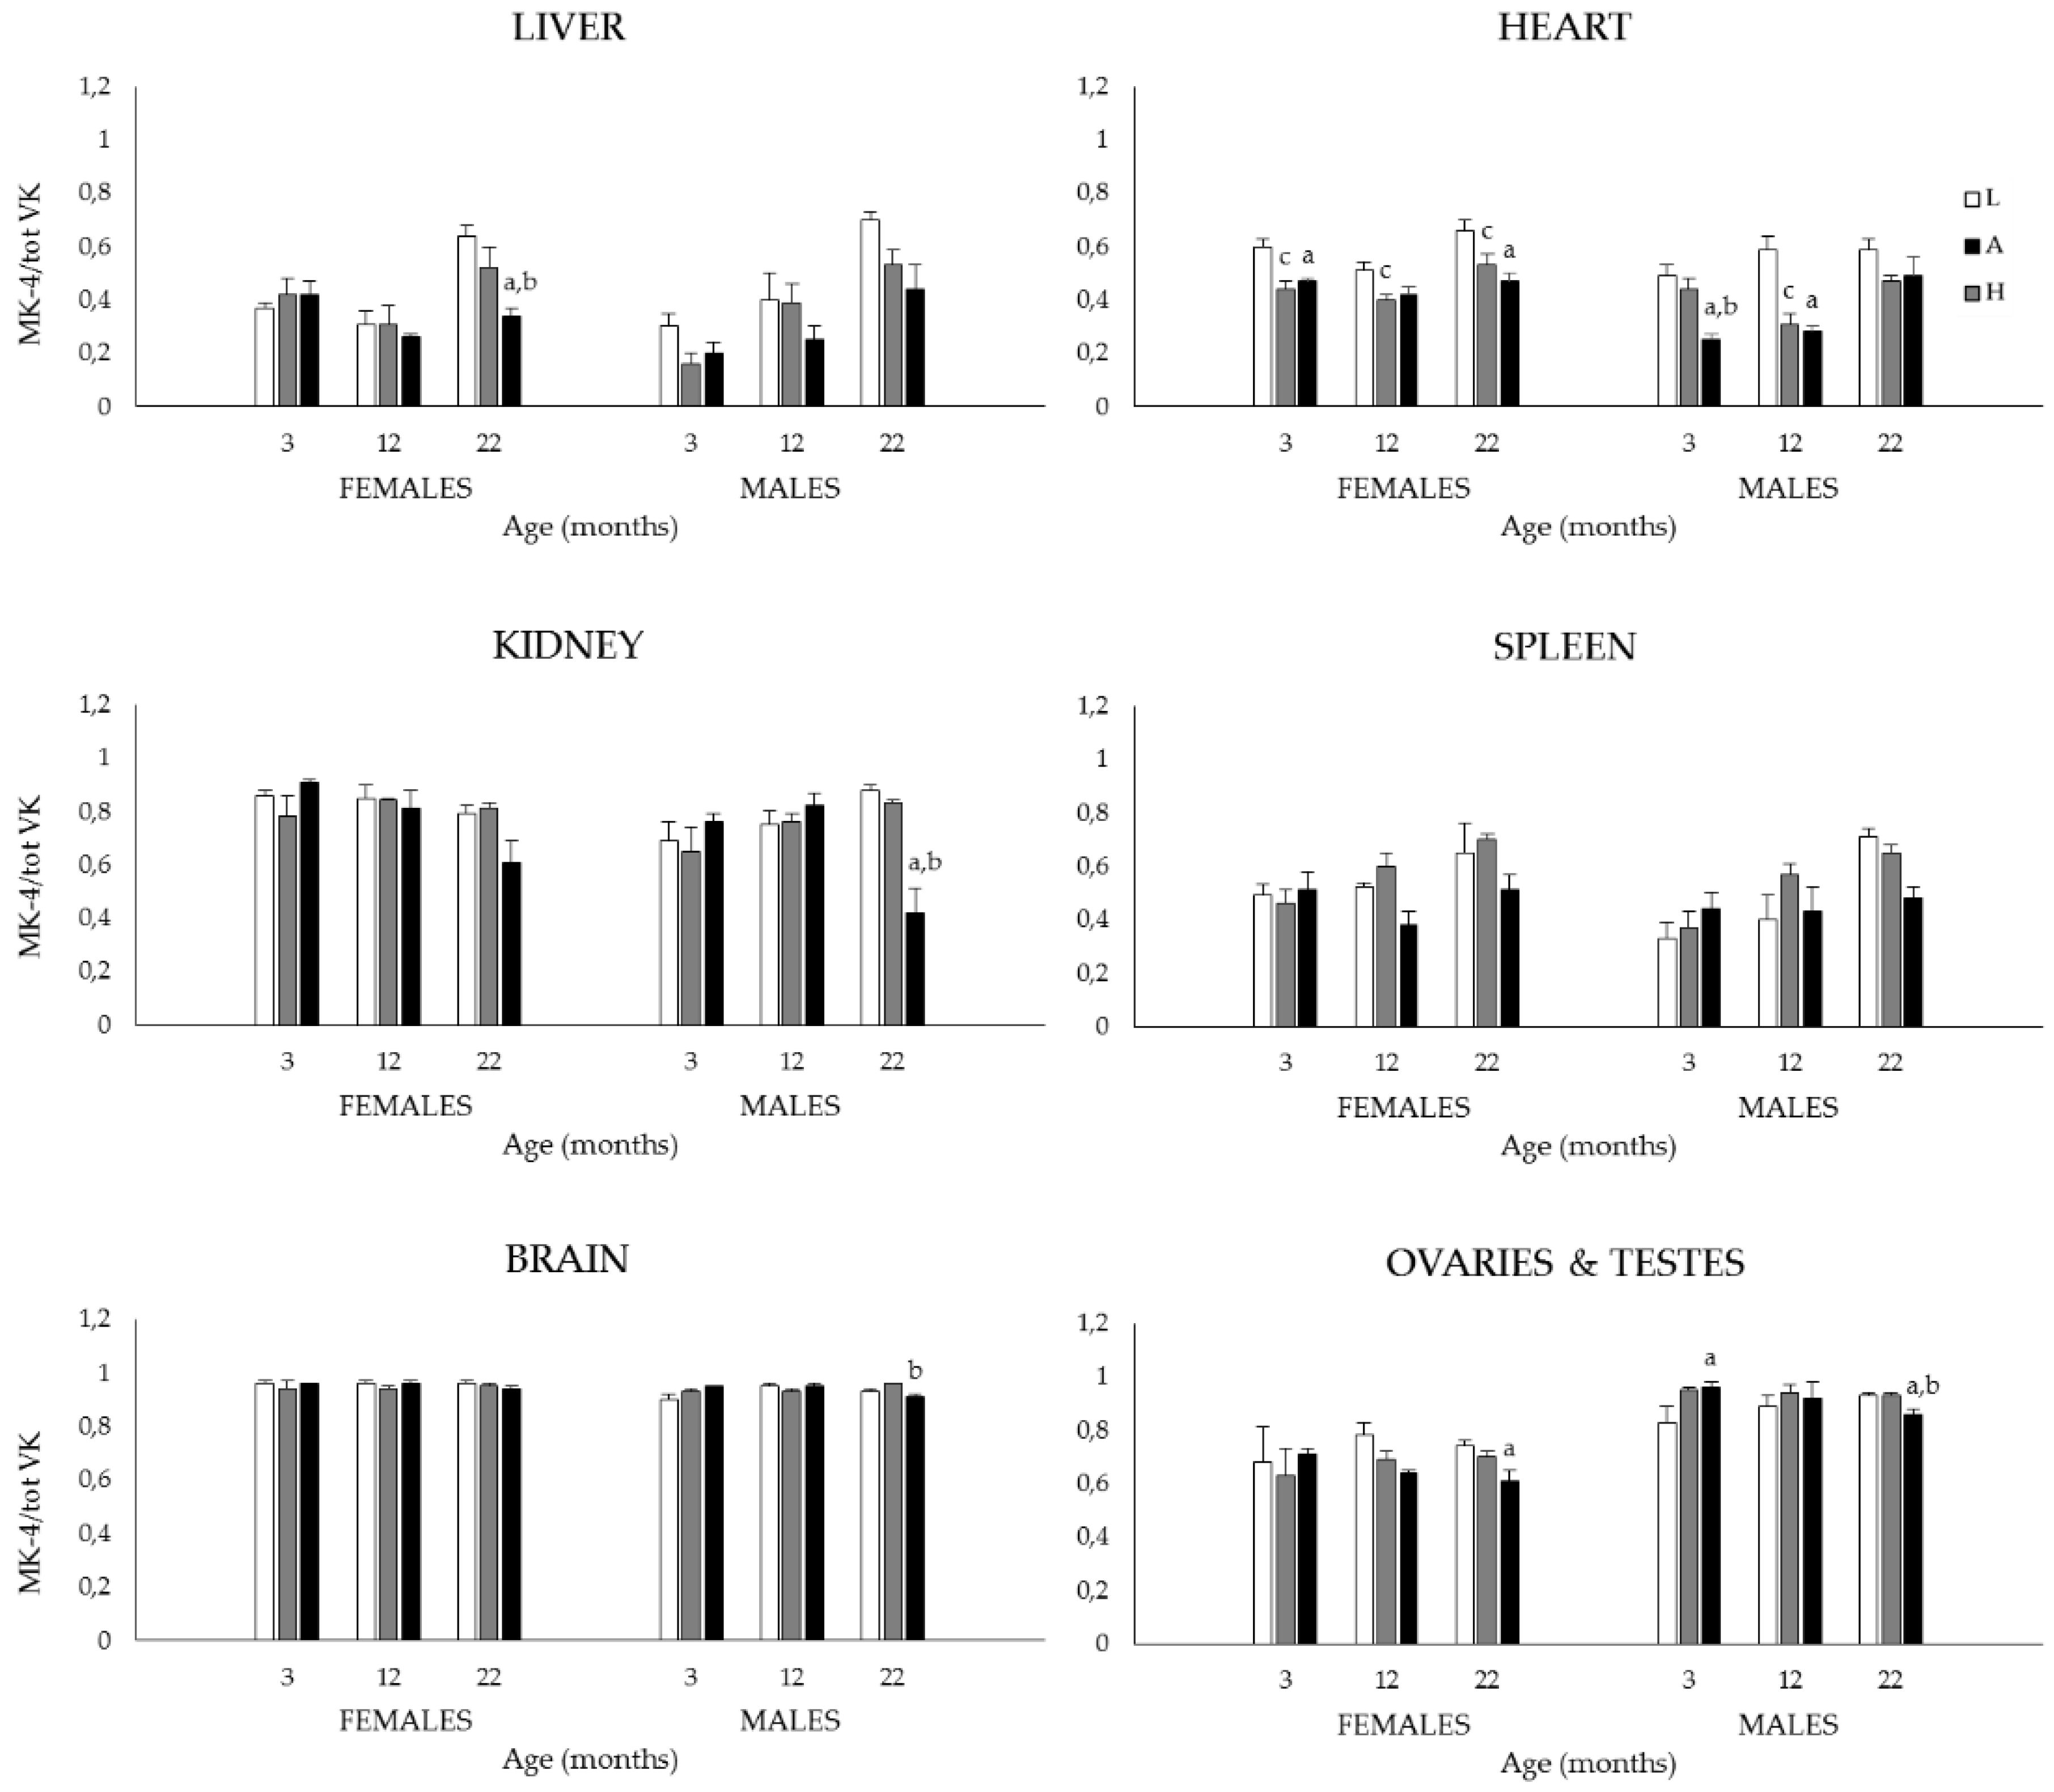
3.1.2. Plasma and Tissue K1, MK-4, and Total VK (K1 + MK-4) Concentrations, and MK-4/Total VK Ratios
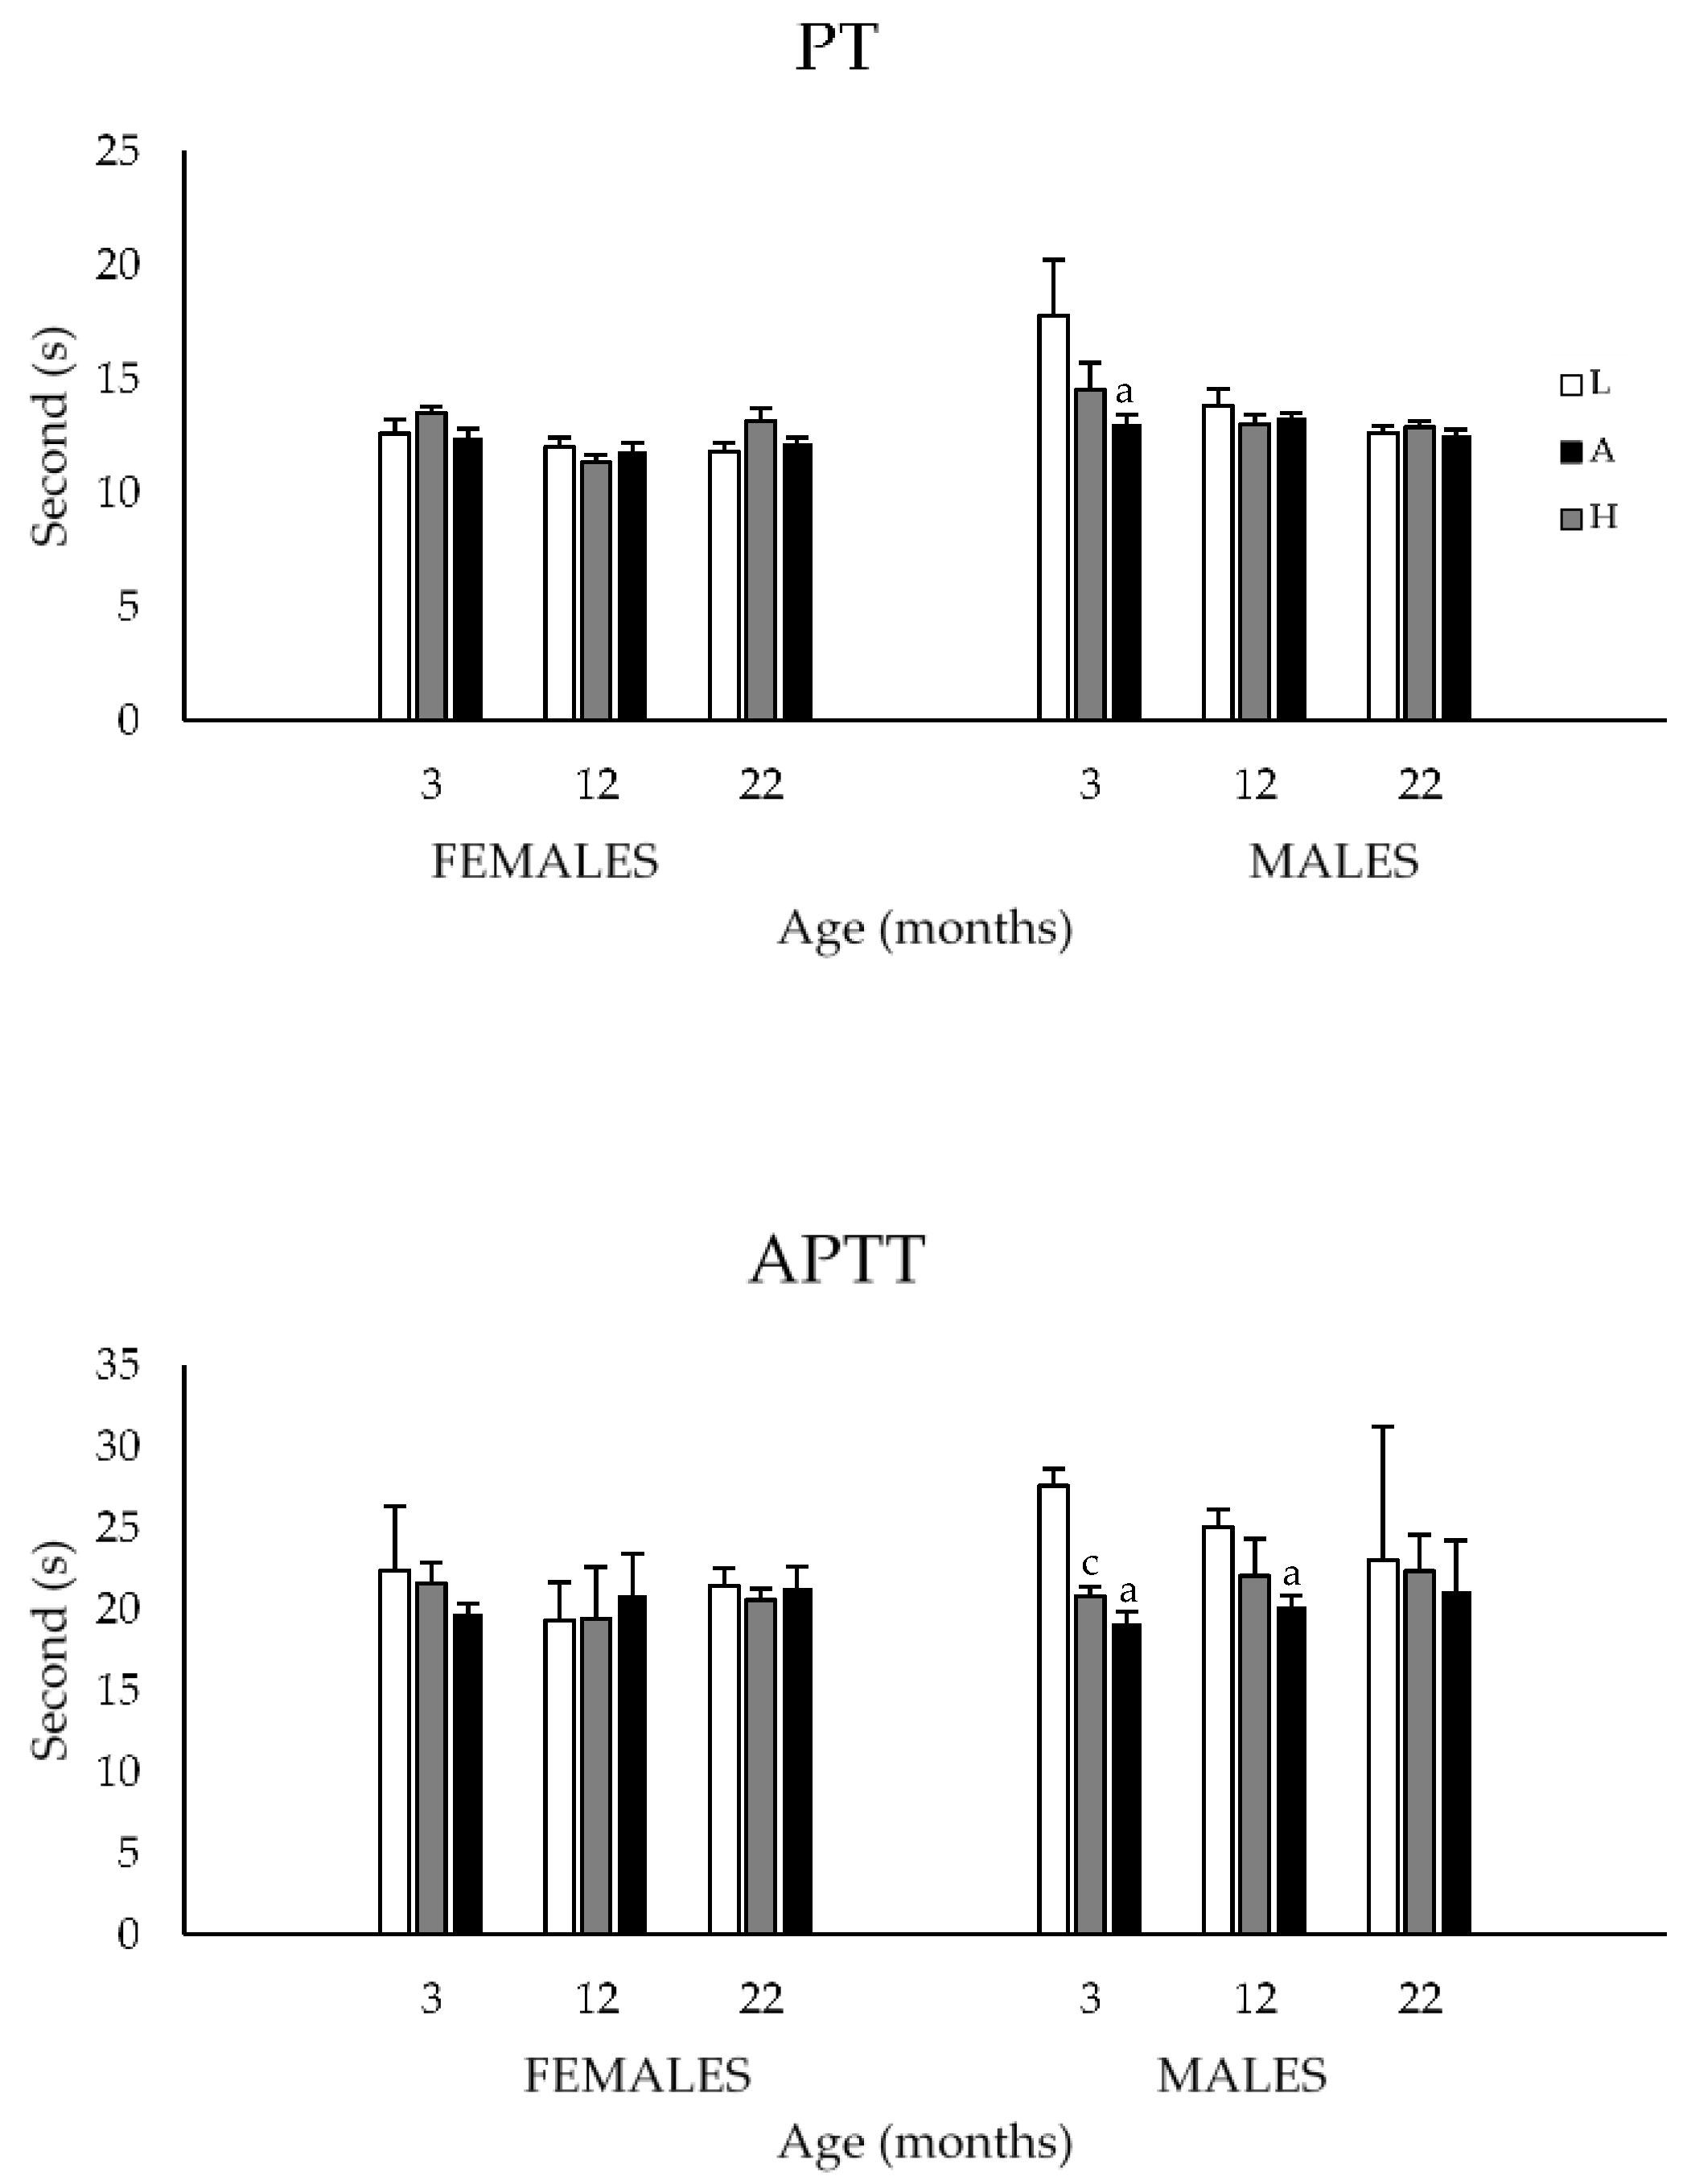
3.1.3. Prothrombin and Activated Partial Thromboplastin Times
3.2. Study 2
3.2.1. Body Weights, Food, and K1Intakes
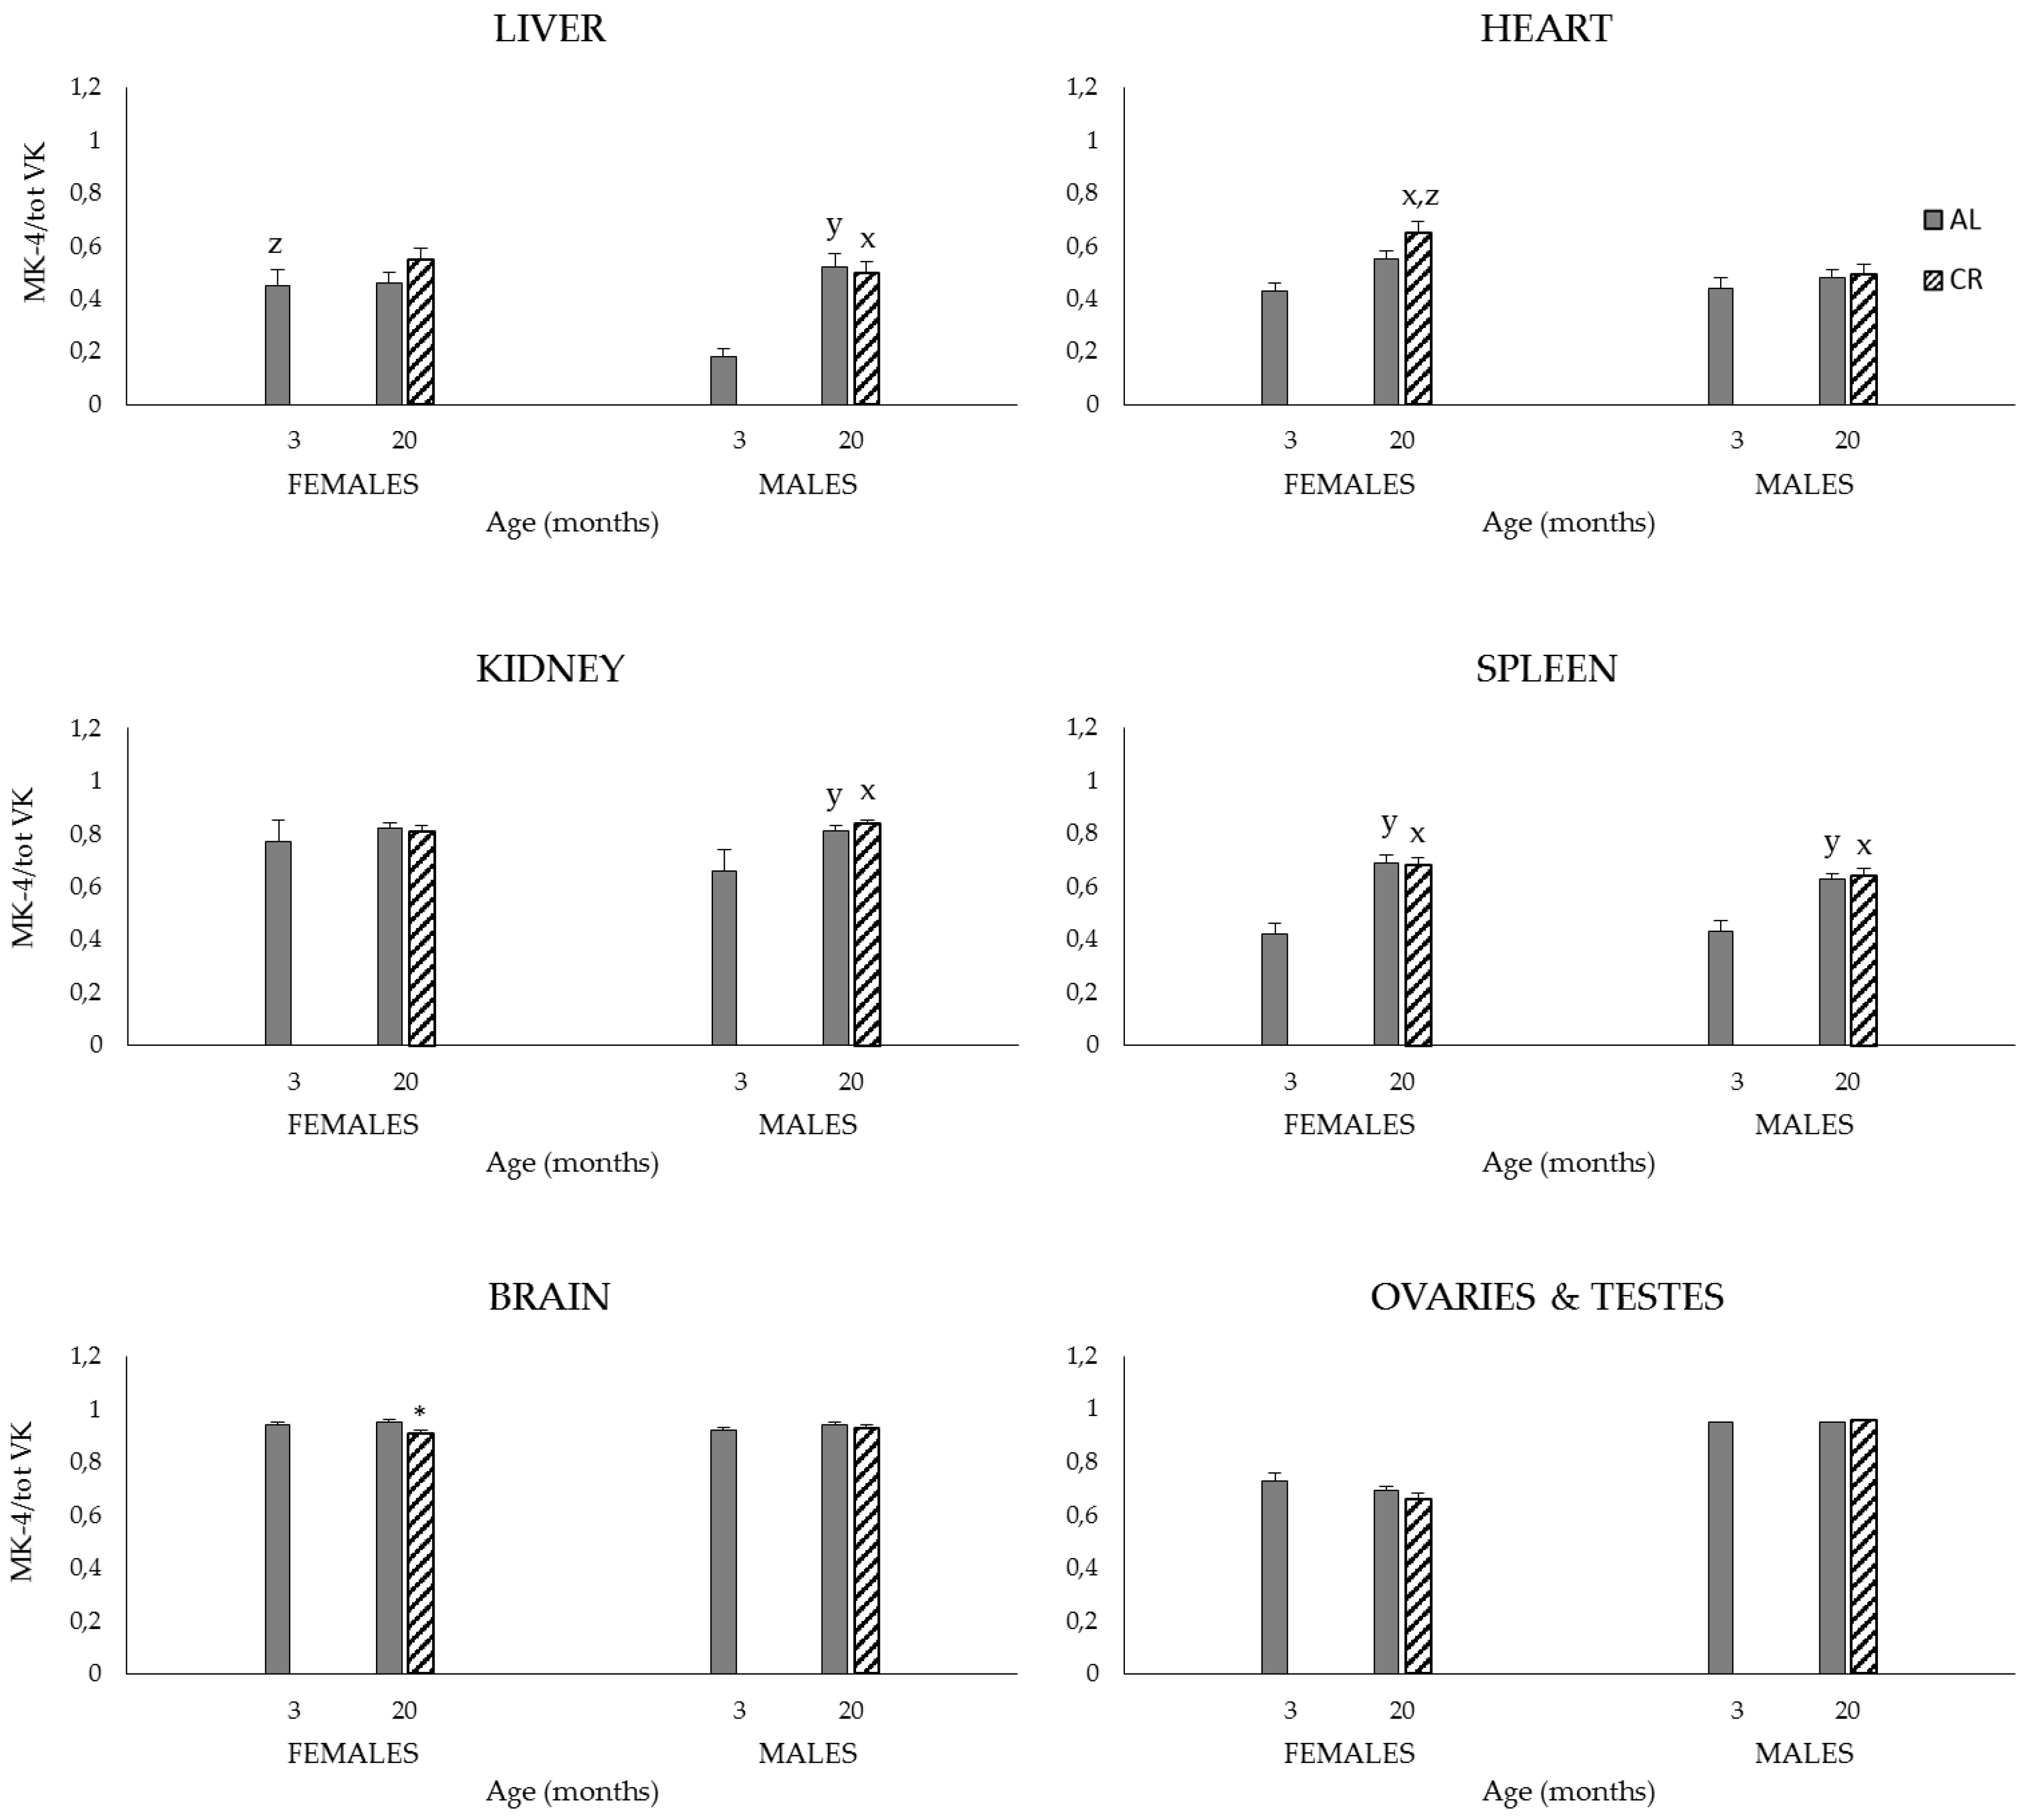
3.2.2. Plasma and Tissue K1, MK-4, and Total VK (K1 + MK-4) Concentrations, and MK-4/Total VK Ratios
3.2.3. Prothrombin and Activated Partial Thromboplastin Times
4. Discussion
4.1. Study 1
4.2. Study 2
5. Conclusions
Acknowledgments
Author Contributions
Conflicts of Interest
References
- Booth, S.L. Roles for vitamin K beyond coagulation. Annu. Rev. Nutr. 2009, 29, 89–110. [Google Scholar] [CrossRef] [PubMed]
- Ferland, G. The discovery of vitamin K and its clinical applications. Ann. Nutr. Metab. 2012, 61, 213–218. [Google Scholar] [CrossRef] [PubMed]
- Beulens, J.W.; Booth, S.L.; van den Heuvel, E.G.; Stoecklin, E.; Baka, A.; Vermeer, C. The role of menaquinones (vitamin K2) in human health. Br. J. Nutr. 2013, 110, 1357–1368. [Google Scholar] [CrossRef] [PubMed]
- Ferron, M.; Lacombe, J. Regulation of energy metabolism by the skeleton: Osteocalcin and beyond. Arch. Biochem. Biophys. 2014, 561, 137–146. [Google Scholar] [CrossRef] [PubMed]
- Shearer, M.J.; Newman, P. Recent trends in the metabolism and cell biology of vitamin K with special reference to vitamin K cycling and mk-4 biosynthesis. J. Lipid Res. 2014, 55, 345–362. [Google Scholar] [CrossRef] [PubMed]
- Thijssen, H.H.; Drittij-Reijnders, M.J. Vitamin K distribution in rat tissues: Dietary phylloquinone is a source of tissue menaquinone-4. Br. J. Nutr. 1994, 72, 415–425. [Google Scholar] [CrossRef] [PubMed]
- Thijssen, H.H.; Drittij-Reijnders, M.J.; Fischer, M.A. Phylloquinone and menaquinone-4 distribution in rats: Synthesis rather than uptake determines menaquinone-4 organ concentrations. J. Nutr. 1996, 126, 537–543. [Google Scholar] [PubMed]
- Al Rajabi, A.; Booth, S.L.; Peterson, J.W.; Choi, S.W.; Suttie, J.W.; Shea, M.K.; Miao, B.; Grusak, M.A.; Fu, X. Deuterium-labeled phylloquinone has tissue-specific conversion to menaquinone-4 among fischer 344 male rats. J. Nutr. 2012, 142, 841–845. [Google Scholar] [CrossRef] [PubMed]
- Hirota, Y.; Tsugawa, N.; Nakagawa, K.; Suhara, Y.; Tanaka, K.; Uchino, Y.; Takeuchi, A.; Sawada, N.; Kamao, M.; Wada, A.; et al. Menadione (vitamin K3) is a catabolic product of oral phylloquinone (vitamin K1) in the intestine and a circulating precursor of tissue menaquinone-4 (vitamin K2) in rats. J. Biol. Chem. 2013, 288, 33071–33080. [Google Scholar] [CrossRef] [PubMed]
- Nakagawa, K.; Sawada, N.; Hirota, Y.; Uchino, Y.; Suhara, Y.; Hasegawa, T.; Amizuka, N.; Okamoto, T.; Tsugawa, N.; Kamao, M.; et al. Vitamin K2 biosynthetic enzyme, UBIAD1 is essential for embryonic development of mice. PLoS ONE 2014, 9, e104078. [Google Scholar] [CrossRef] [PubMed]
- Ferland, G. Vitamin K, an emerging nutrient in brain function. Biofactors 2012, 38, 151–157. [Google Scholar] [CrossRef] [PubMed]
- Reddi, K.; Henderson, B.; Meghji, S.; Wilson, M.; Poole, S.; Hopper, C.; Harris, M.; Hodges, S.J. Interleukin 6 production by lipopolysaccharide-stimulated human fibroblasts is potently inhibited by naphthoquinone (vitamin K) compounds. Cytokine 1995, 7, 287–290. [Google Scholar] [CrossRef] [PubMed]
- Ohsaki, Y.; Shirakawa, H.; Hiwatashi, K.; Furukawa, Y.; Mizutani, T.; Komai, M. Vitamin K suppresses lipopolysaccharide-induced inflammation in the rat. Biosci. Biotechnol. Biochem. 2006, 70, 926–932. [Google Scholar] [CrossRef] [PubMed]
- Ohsaki, Y.; Shirakawa, H.; Miura, A.; Giriwono, P.E.; Sato, S.; Ohashi, A.; Iribe, M.; Goto, T.; Komai, M. Vitamin K suppresses the lipopolysaccharide-induced expression of inflammatory cytokines in cultured macrophage-like cells via the inhibition of the activation of nuclear factor κB through the repression of IKKalpha/beta phosphorylation. J. Nutr. Biochem. 2010, 21, 1120–1126. [Google Scholar] [CrossRef] [PubMed]
- Moriya, M.; Nakatsuji, Y.; Okuno, T.; Hamasaki, T.; Sawada, M.; Sakoda, S. Vitamin K2 ameliorates experimental autoimmune encephalomyelitis in lewis rats. J. Neuroimmunol. 2005, 170, 11–20. [Google Scholar] [CrossRef] [PubMed]
- Li, J.; Lin, J.C.; Wang, H.; Peterson, J.W.; Furie, B.C.; Furie, B.; Booth, S.L.; Volpe, J.J.; Rosenberg, P.A. Novel role of vitamin K in preventing oxidative injury to developing oligodendrocytes and neurons. J. Neurosci. 2003, 23, 5816–5826. [Google Scholar] [PubMed]
- Li, J.; Wang, H.; Rosenberg, P.A. Vitamin K prevents oxidative cell death by inhibiting activation of 12-lipoxygenase in developing oligodendrocytes. J. Neurosci. Res. 2009, 87, 1997–2005. [Google Scholar] [CrossRef] [PubMed]
- Shibayama-Imazu, T.; Aiuchi, T.; Nakaya, K. Vitamin K2-mediated apoptosis in cancer cells: Role of mitochondrial transmembrane potential. Vitam. Horm. 2008, 78, 211–226. [Google Scholar] [PubMed]
- Ozaki, I.; Zhang, H.; Mizuta, T.; Ide, Y.; Eguchi, Y.; Yasutake, T.; Sakamaki, T.; Pestell, R.G.; Yamamoto, K. Menatetrenone, a vitamin K2 analogue, inhibits hepatocellular carcinoma cell growth by suppressing cyclin D1 expression through inhibition of nuclear factor κB activation. Clin. Cancer Res. 2007, 13, 2236–2245. [Google Scholar] [CrossRef] [PubMed]
- Tabb, M.M.; Sun, A.; Zhou, C.; Grun, F.; Errandi, J.; Romero, K.; Pham, H.; Inoue, S.; Mallick, S.; Lin, M.; et al. Vitamin K2 regulation of bone homeostasis is mediated by the steroid and xenobiotic receptor SXR. J. Biol. Chem. 2003, 278, 43919–43927. [Google Scholar] [CrossRef] [PubMed]
- Ichikawa, T.; Horie-Inoue, K.; Ikeda, K.; Blumberg, B.; Inoue, S. Steroid and xenobiotic receptor SXR mediates vitamin K2-activated transcription of extracellular matrix-related genes and collagen accumulation in osteoblastic cells. J. Biol. Chem. 2006, 281, 16927–16934. [Google Scholar] [CrossRef] [PubMed]
- Tsang, C.K.; Kamei, Y. Novel effect of vitamin K1 (phylloquinone) and vitamin K2 (menaquinone) on promoting nerve growth factor-mediated neurite outgrowth from PC12D cells. Neurosci. Lett. 2002, 323, 9–12. [Google Scholar] [CrossRef]
- Otsuka, M.; Kato, N.; Shao, R.X.; Hoshida, Y.; Ijichi, H.; Koike, Y.; Taniguchi, H.; Moriyama, M.; Shiratori, Y.; Kawabe, T.; et al. Vitamin K2 inhibits the growth and invasiveness of hepatocellular carcinoma cells via protein kinase A activation. Hepatology 2004, 40, 243–251. [Google Scholar] [CrossRef] [PubMed]
- Ichikawa, T.; Horie-Inoue, K.; Ikeda, K.; Blumberg, B.; Inoue, S. Vitamin K2 induces phosphorylation of protein kinase A and expression of novel target genes in osteoblastic cells. J. Mol. Endocrinol. 2007, 39, 239–247. [Google Scholar] [CrossRef] [PubMed]
- Ito, A.; Shirakawa, H.; Takumi, N.; Minegishi, Y.; Ohashi, A.; Howlader, Z.H.; Ohsaki, Y.; Sato, T.; Goto, T.; Komai, M. Menaquinone-4 enhances testosterone production in rats and testis-derived tumor cells. Lipids Health Dis. 2011, 10, 158. [Google Scholar] [CrossRef] [PubMed]
- Ronden, J.E.; Thijssen, H.H.; Vermeer, C. Tissue distribution of K-vitamers under different nutritional regimens in the rat. Biochim. Biophys. Acta 1998, 1379, 16–22. [Google Scholar] [CrossRef]
- Sato, T.; Ozaki, R.; Kamo, S.; Hara, Y.; Konishi, S.; Isobe, Y.; Saitoh, S.; Harada, H. The biological activity and tissue distribution of 2′,3′-dihydrophylloquinone in rats. Biochim. Biophys. Acta 2003, 1622, 145–150. [Google Scholar] [CrossRef]
- Booth, S.L.; Peterson, J.W.; Smith, D.; Shea, M.K.; Chamberland, J.; Crivello, N. Age and dietary form of vitamin K affect menaquinone-4 concentrations in male fischer 344 rats. J. Nutr. 2008, 138, 492–496. [Google Scholar] [PubMed]
- Huber, A.M.; Davidson, K.W.; O’Brien-Morse, M.E.; Sadowski, J.A. Tissue phylloquinone and menaquinones in rats are affected by age and gender. J. Nutr. 1999, 129, 1039–1044. [Google Scholar] [PubMed]
- Huber, A.M.; Davidson, K.W.; O’Brien-Morse, M.E.; Sadowski, J.A. Gender differences in hepatic phylloquinone and menaquinones in the vitamin K-deficient and -supplemented rat. Biochim. Biophys. Acta 1999, 1426, 43–52. [Google Scholar] [CrossRef]
- Anton, B.; Vitetta, L.; Cortizo, F.; Sali, A. Can we delay aging? The biology and science of aging. Ann. N. Y. Acad. Sci. 2005, 1057, 525–535. [Google Scholar] [CrossRef] [PubMed]
- Speakman, J.R.; Mitchell, S.E. Caloric restriction. Mol. Asp. Med. 2011, 32, 159–221. [Google Scholar] [CrossRef] [PubMed]
- Fontana, L.; Partridge, L. Promoting health and longevity through diet: From model organisms to humans. Cell 2015, 161, 106–118. [Google Scholar] [CrossRef] [PubMed]
- Kindberg, C.G.; Suttie, J.W. Effect of various intakes of phylloquinone on signs of vitamin K deficiency and serum and liver phylloquinone concentrations in the rat. J. Nutr. 1989, 119, 175–180. [Google Scholar] [PubMed]
- Carrie, I.; Portoukalian, J.; Vicaretti, R.; Rochford, J.; Potvin, S.; Ferland, G. Menaquinone-4 concentration is correlated with sphingolipid concentrations in rat brain. J. Nutr. 2004, 134, 167–172. [Google Scholar] [PubMed]
- Davidson, K.W.; Sadowski, J.A. Determination of vitamin K compounds in plasma or serum by high-performance liquid chromatography using postcolumn chemical reduction and fluorimetric detection. Methods Enzymol. 1997, 282, 408–421. [Google Scholar] [PubMed]
- Wang, L.Y.; Bates, C.J.; Yan, L.; Harrington, D.J.; Shearer, M.J.; Prentice, A. Determination of phylloquinone (vitamin K1) in plasma and serum by HPLC with fluorescence detection. Clin. Chim. Acta 2004, 347, 199–207. [Google Scholar] [CrossRef] [PubMed]
- Booth, S.L.; Centi, A.J.; Gundberg, C. Bone as an endocrine organ relevant to diabetes. Curr. Diab. Rep. 2014, 14, 556. [Google Scholar] [CrossRef] [PubMed]
- Tokita, H.; Tsuchida, A.; Miyazawa, K.; Ohyashiki, K.; Katayanagi, S.; Sudo, H.; Enomoto, M.; Takagi, Y.; Aoki, T. Vitamin K2-induced antitumor effects via cell-cycle arrest and apoptosis in gastric cancer cell lines. Int. J. Mol. Med. 2006, 17, 235–243. [Google Scholar] [CrossRef] [PubMed]
- Menard, C.; Quirion, R.; Bouchard, S.; Ferland, G.; Gaudreau, P. Glutamatergic signaling and low prodynorphin expression are associated with intact memory and reduced anxiety in rat models of healthy aging. Front. Aging Neurosci. 2014, 6, 81. [Google Scholar] [PubMed]
- Moyse, E.; Bedard, K.; Segura, S.; Mahaut, S.; Tardivel, C.; Ferland, G.; Lebrun, B.; Gaudreau, P. Effects of aging and caloric restriction on brainstem satiety center signals in rats. Mech. Ageing Dev. 2012, 133, 83–91. [Google Scholar] [CrossRef] [PubMed]
- Sogabe, N.; Maruyama, R.; Baba, O.; Hosoi, T.; Goseki-Sone, M. Effects of long-term vitamin K1 (phylloquinone) or vitamin K2 (menaquinone-4) supplementation on body composition and serum parameters in rats. Bone 2011, 48, 1036–1042. [Google Scholar] [CrossRef] [PubMed]
- Knapen, M.H.; Schurgers, L.J.; Shearer, M.J.; Newman, P.; Theuwissen, E.; Vermeer, C. Association of vitamin K status with adiponectin and body composition in healthy subjects: Uncarboxylated osteocalcin is not associated with fat mass and body weight. Br. J. Nutr. 2012, 108, 1017–1024. [Google Scholar] [CrossRef] [PubMed]
- Mellette, S.J. Interrelationships between vitamin K and estrogenic hormones. Am. J. Clin. Nutr. 1961, 9, 108–116. [Google Scholar] [PubMed]
- Ronden, J.E.; Drittij-Reijnders, M.J.; Vermeer, C.; Thijssen, H.H. Intestinal flora is not an intermediate in the phylloquinone-menaquinone-4 conversion in the rat. Biochim. Biophys. Acta 1998, 1379, 69–75. [Google Scholar] [CrossRef]
- Jolly, D.W.; Craig, C.; Nelson, T.E., Jr. Estrogen and prothrombin synthesis: Effect of estrogen on absorption of vitamin K1. Am. J. Physiol. 1977, 232, H12–H17. [Google Scholar] [PubMed]
- Lopez-Otin, C.; Blasco, M.A.; Partridge, L.; Serrano, M.; Kroemer, G. The hallmarks of aging. Cell 2013, 153, 1194–1217. [Google Scholar] [CrossRef] [PubMed]
- Metta, V.A.; Mameesh, M.S.; Johnson, B.C. Vitamin K deficiency in rats induced by the feeding of irradiated beef. J. Nutr. 1959, 69, 18–22. [Google Scholar] [PubMed]
- Gustafsson, B.E.; Daft, F.S.; Mc, D.E.; Smith, J.C.; Fitzgerald, R.J. Effects of vitamin K-active compounds and intestinal microorganisms in vitamin K-deficient germfree rats. J. Nutr. 1962, 78, 461–468. [Google Scholar] [PubMed]
- Kenessary, A.; Zhumadilov, Z.; Nurgozhin, T.; Kipling, D.; Yeoman, M.; Cox, L.; Ostler, E.; Faragher, R. Biomarkers, interventions and healthy ageing. New Biotechnol. 2013, 30, 373–377. [Google Scholar] [CrossRef] [PubMed]
- Kamzalov, S.; Sohal, R.S. Effect of age and caloric restriction on coenzyme q and alpha-tocopherol levels in the rat. Exp. Gerontol. 2004, 39, 1199–1205. [Google Scholar] [CrossRef] [PubMed]

| Age (Months) | Diet | Food Intake (g/100 BW/Day) | K1 Intake (µg/100 g·BW/Day) | ||
|---|---|---|---|---|---|
| F | M | F | M | ||
| 3 | L | 5.7 ± 0.2 | 4.5 ± 0.1 | 562.6 ± 15.9 | 444.6 ± 9.4 |
| A | 5.6 ± 0.2 | 4.5 ± 0.1 | 2780.4 ± 83.0 c | 2204.8 ± 56.2 c | |
| H | 6.3 ± 0.1 a,b | 4.7 ± 0.2 | 9433.2 ± 164.3 a,b | 7022.3 ± 217.7 a,b | |
| 12 | L | 4.2 ± 0.2 | 3.0 ± 0.1 | 414.9 ± 15.3 | 297.2 ± 11.6 |
| A | 4.2 ± 0.2 | 3.2 ± 0.1 | 2063.6 ± 101.2 c | 1574.8 ± 51.4 c | |
| H | 3.8 ± 0.2 | 3.0 ± 0.1 | 5987.3 ± 174.2 a,b | 4386.0 ± 165.9 a,b | |
| 22 | L | 2.6 ± 0.2 | 2.7 ± 0.1 | 253.6 ± 14.4 | 268.9 ± 9.9 |
| A | 2.5 ± 0.2 | 2.6 ± 0.1 | 1231.5 ± 85.6c | 1281.9 ± 43.5 c | |
| H | 2.8 ± 0.2 | 2.7 ± 0.2 | 4141.4 ± 245.1 a,b | 3954.1 ± 229.3 a,b | |
| Organ (Months) | VK Diet (µg) | K1 | MK-4 | K1 + MK4 | |||
|---|---|---|---|---|---|---|---|
| F | M | F | M | F | M | ||
| pmol/g or L Plasma | |||||||
| Plasma | |||||||
| 3 | L | 0.14 ± 0.11 | 0.04 ± 0.09 | nd | nd | 0.14 ± 0.11 | 0.04 ± 0.09 |
| A | 0.21 ± 0.08 | 0.27 ± 0.17 | nd | nd | 0.21 ± 0.08 | 0.27 ± 0.17 | |
| H | 0.67 ± 0.35 a,b | 0.41 ± 0.30 a | nd | nd | 0.67 ± 0.35 a,b | 0.41 ± 0.30 a | |
| 12 | L | 0.36 ± 0.29 | 0.21 ± 0.08 | nd | nd | 0.36 ± 0.29 | 0.21 ± 0.08 |
| A | 0.44 ± 0.08 | 0.15 ± 0.08 | nd | nd | 0.44 ± 0.08 | 0.15 ± 0.08 | |
| H | 1.83 ± 0.53 a,b | 0.76 ± 0.43 a,b | nd | nd | 1.83 ± 0.53 a,b | 0.76 ± 0.43 a,b | |
| 22 | L | 0.96 ± 0.35 | 0.84 ± 0.97 | nd | nd | 0.96 ± 0.35 | 0.84 ± 0.97 |
| A | 1.83 ± 0.58 | 1.19 ± 0.42 | nd | nd | 1.83 ± 0.58 | 1.19 ± 0.42 | |
| H | 4.60 ± 1.63 a,b | 2.29 ± 1.08 a | nd | nd | 4.60 ± 1.63 a,b | 2.29 ± 1.08 a | |
| Liver | |||||||
| 3 | L | 46.4 ± 4.9 | 43.0 ± 13.9 | 26.7 ± 2.6 | 16.4 ± 3.5 | 73.1 ± 6.3 | 59.5 ± 16.4 |
| A | 49.8 ± 7.7 | 68.6 ± 25.7 | 37.4 ± 7.2 | 10.2 ± 3.2 | 87.2 ± 12.5 | 78.8 ± 27.3 | |
| H | 199.6 ± 30.0 a,b | 73.3 ± 19.5 | 135.5 ± 14.6 a,b | 14.5 ± 2.9 | 335.1 ± 32.7 a,b | 87.8 ± 17.7 | |
| 12 | L | 71.5 ± 14.3 | 33.7 ± 7.8 | 35.8 ± 7.4 | 23.6 ± 7.7 | 107.3 ± 20.7 | 57.4 ± 11.3 |
| A | 171.9 ± 43.8 c | 44.3 ± 6.8 | 68.4 ± 10.9 | 31.9 ± 7.6 | 240.3 ± 41.5 c | 76.2 ± 12.7 | |
| H | 410.3 ± 13.9 a,b | 122.5 ± 37.6 a | 142.7 ± 10.9 a | 38.9 ± 11.8 | 553.0 ± 22.4 a | 161.5 ± 43.4 a | |
| 22 | L | 34.7 ± 2.9 | 25.6 ± 5.4 | 65.0 ± 9.3 | 57.5 ± 8.8 | 99.7 ± 8.1 | 83.1 ± 13.7 |
| A | 69.2 ± 12.6 c | 52.6 ± 8.5 | 81.0 ± 17.9 | 58.8 ± 7.8 | 150.2 ± 21.7 | 111.4 ± 8.3 | |
| H | 191.1 ± 14.3 a,b | 79.1 ± 19.1 a | 104.4 ± 18.0 | 61.7 ± 16.0 | 295.4 ± 29.9 a | 140.8 ± 25.8 | |
| Heart | |||||||
| 3 | L | 13.2 ± 1.7 | 9.5 ± 0.3 | 19.5 ± 2.2 | 9.7 ± 1.6 | 32.7 ± 3.2 | 19.2 ± 1.7 |
| A | 32.1 ± 2.1 c | 31.2 ± 1.9 c | 25.0 ± 2.4 | 26.6 ± 5.2 c | 57.1 ± 2.9 c | 57.7 ± 5.6 c | |
| H | 300.4 ± 74.4 a,b | 188.1 ± 42.1 a,b | 265.9 ± 60.2 a,b | 59.9 ± 11.5 a,b | 566.2 ± 134.4 a,b | 248.0 ± 52.6 a,b | |
| 12 | L | 16.3 ± 0.7 | 15.6 ± 5.3 | 17.7 ± 2.7 | 34.7 ± 20.9 | 34.0 ± 3.4 | 50.2 ± 26.0 |
| A | 41.5 ± 6.4 c | 32.1 ± 4.0 c | 27.7 ± 4.3 | 15.7 ± 3.6 | 69.2 ± 10.4 c | 47.7 ± 7.4 | |
| H | 225.6 ± 32.0 a,b | 213.9 ± 42.6 a,b | 165.9 ± 24.6 a,b | 79.6 ± 11.4 a,b | 391.5 ± 51.9 a,b | 293.4 ± 52.9 a,b | |
| 22 | L | 30.8 ± 4.7 | 30.1 ± 2.8 | 56.9 ± 3.5 | 43.5 ± 3.8 | 87.6 ± 5.1 | 73.6 ± 3.1 |
| A | 54.9 ± 7.3 c | 47.1 ± 7.7 | 62.5 ± 7.7 | 42.0 ± 8.1 | 117.4 ± 12.1 | 89.1 ± 15.4 | |
| H | 106.3 ± 14.4 a,b | 100.9 ± 39.0 a | 104.0 ± 24.1 | 89.7 ± 25.8 | 210.2 ± 37.1 a,b | 190.6 ± 56.1 | |
| Kidneys | |||||||
| 3 | L | 2.8 ± 0.5 | 4.7 ± 0.6 | 17.6 ± 3.2 | 11.9 ± 3.5 | 20.4 ± 3.6 | 16.6 ± 3.2 |
| A | 9.3 ± 4.3 | 6.5 ± 1.4 | 29.9 ± 2.9 | 14.7 ± 3.7 | 39.2 ± 4.9 | 21.1 ± 3.1 | |
| H | 18.7 ± 4.7 | 10.2 ± 2.2 | 176.7 ± 24.6 a | 34.9 ± 9.2 | 195.4 ± 28.1 a,b | 45.1 ± 10.9 a | |
| 12 | L | 4.3 ± 1.1 | 3.7 ± 0.8 | 28.5 ± 8.8 | 12.1 ± 3.8 | 32.8 ± 9.5 | 15.8 ± 4.4 |
| A | 6.0 ± 1.2 | 6.6 ± 1.1 | 32.6 ± 8.4 | 22.1 ± 5.8 | 38.6 ± 9.6 | 28.8 ± 6.8 | |
| H | 32.0 ± 4.6 a,b | 6.4 ± 1.8 | 154.1 ± 34.8 a,b | 32.2 ± 8.5 a | 186.1 ± 30.3 a,b | 38.6 ± 8.9 a | |
| 22 | L | 7.7 ± 0.9 | 3.6 ± 0.5 | 30.8 ± 4.5 | 26.3 ± 3.0 | 38.5 ± 4.7 | 30.0 ± 3.1 |
| A | 11.6 ± 1.1 | 7.8 ± 0.6 c | 52.4 ± 7.1 | 38.9 ± 3.7 | 63.9 ± 7.6 c | 46.7 ± 4.2 | |
| H | 30.6 ± 9.8 a,b | 20.3 ± 5.5 a,b | 42.3 ± 8.6 | 19.4 ± 8.4 | 72.9 ± 13.3 a | 39.7 ± 12.8 | |
| Spleen | |||||||
| 3 | L | 16.7 ± 1.5 | 16.6 ± 2.3 | 17.2 ± 3.2 | 8.6 ± 1.9 | 33.9 ± 4.0 | 25.1 ± 3.3 |
| A | 24.9 ± 4.4 | 28.0 ± 3.4 c | 23.6 ± 6.8 | 17.1 ± 3.9 | 48.5 ± 9.6 | 45.1 ± 4.7 | |
| H | 80.1 ± 17.8 a,b | 49.4 ± 6.0 a,b | 73.1 ± 15.3 a,b | 37.6 ± 4.2 a,b | 153.2 ± 28.7 a,b | 86.9 ± 5.1 a | |
| 12 | L | 15.5 ± 1.8 | 15.5 ± 6.8 | 17.5 ± 3.5 | 11.4 ± 4.4 | 33.0 ± 5.2 | 26.8 ± 10.6 |
| A | 30.4 ± 4.5 c | 31.8 ± 10.4 | 50.9 ± 11.9 | 47.2 ± 17.1 | 81.3 ± 15.2 | 79.0 ± 26.6 | |
| H | 110.9 ± 17.7 a,b | 38.2 ± 7.0 | 66.8 ± 8.7 | 35.7 ± 12.5 | 177.6 ± 22.8 a | 73.8 ± 18.2 a | |
| 22 | L | 18.8 ± 3.9 | 22.7 ± 6.0 | 43.1 ± 10.6 | 56.3 ± 14.4 | 61.8 ± 10.8 | 79.0 ± 19.4 |
| A | 28.4 ± 4.7 | 26.1 ± 3.8 | 67.1 ± 8.9 | 48.3 ± 7.8 | 95.5 ± 13.2 | 74.3 ± 11.1 | |
| H | 91.9 ± 14.9 a,b | 126.7 ± 17.2 a,b | 101.5 ± 21.1 a | 120.6 ± 22.1 | 193.4 ± 31.1 a,b | 247.2 ± 35.9 a,b | |
| Brain | |||||||
| 3 | L | 2.0 ± 0.7 | 2.3 ± 0.4 | 54.2 ± 7.1 | 21.1 ± 1.6 | 56.2 ± 7.3 | 23.4 ± 1.3 |
| A | 4.3 ± 0.8 | 3.7 ± 0.6 | 64.5 ± 4.8 | 47.2 ± 5.6 c | 68.8 ± 5.1 | 51.0 ± 5.7 c | |
| H | 8.0 ± 0.7 a,b | 8.4 ± 0.9 a,b | 197.5 ± 7.6 a,b | 144.3 ± 12.0 a,b | 205.4 ± 8.0 a,b | 152.6 ± 12.7 a,b | |
| 12 | L | 1.6 ± 0.3 | 2.6 ± 1.2 | 47.1 ± 4.1 | 46.9 ± 18.9 | 48.7 ± 4.0 | 49.5 ± 20.1 |
| A | 4.2 ± 0.4 c | 3.3 ± 0.5 | 71.9 ± 7.1 c | 40.6 ± 3.9 | 76.1 ± 7.3 c | 43.9 ± 4.4 | |
| H | 7.4 ± 1.2 a,b | 9.1 ± 2.3 a | 187.2 ± 20.8 a,b | 157.6 ± 10.5 a,b | 194.6 ± 20.7 a,b | 166.7 ± 12.4 a,b | |
| 22 | L | 2.2 ± 0.3 | 3.9 ± 0.2 | 53.5 ± 5.9 | 56.8 ± 11.9 | 55.7 ± 6.0 | 60.6 ± 11.8 |
| A | 3.2 ± 0.2 | 3.4 ± 0.4 | 66.7 ± 7.9 | 85.5 ± 4.1 | 70.0 ± 8.0 | 88.9 ± 4.2 | |
| H | 4.4 ± 0.8 a | 5.4 ± 1.7 | 70.0 ± 8.5 | 63.3 ± 20.5 | 74.4 ± 9.0 | 68.7 ± 21.9 | |
| Ovaries | |||||||
| 3 | L | 89.1 ± 35.9 | 190.6 ± 39.1 | 279.7 ± 34.4 | |||
| A | 133.3 ± 19.2 | 296.1 ± 100.0 | 429.5 ± 98.5 | ||||
| H | 267.6 ± 42.4 a | 616.4 ± 48.2 a | 884.0 ± 89.7 a,b | ||||
| 12 | L | 60.0 ± 22.1 | 187.1 ± 39.9 | 247.1 ± 54.7 | |||
| A | 218.2 ± 9.2 c | 517.2 ± 93.4 c | 735.4 ± 99.8 c | ||||
| H | 424.4 ± 46.6 a | 762.1 ± 67.3 a | 1186.5 ± 111.2 a | ||||
| 22 | L | 183.9 ± 32.3 | 516.2 ± 72.2 | 700.1 ± 99.4 | |||
| A | 307.8 ± 50.2 | 706.6 ± 90.7 | 1014.4 ± 138.4 | ||||
| H | 416.6 ± 46.7 | 656.7 ± 49.6 | 1073.3 ± 51.8 | ||||
| Testes | |||||||
| 3 | L | 13.4 ± 4.5 | 63.8 ± 7.2 | 77.3 ± 6.6 | |||
| A | 7.2 ± 1.4 | 134.5 ± 15.8 c | 141.6 ± 16.3 c | ||||
| H | 11.8 ± 3.6 | 292.4 ± 30.0 a,b | 304.1 ± 28.6 a,b | ||||
| 12 | L | 9.9 ± 4.8 | 83.4 ± 28.3 | 93.3 ± 29.4 | |||
| A | 20.9 ± 12.8 | 258.7 ± 43.6 c | 279.7 ± 51.4 c | ||||
| H | 22.0 ± 11.8 | 299.1 ± 52.3 a | 321.1 ± 45.0 a | ||||
| 22 | L | 4.5 ± 0.6 | 64.3 ± 8.1 | 68.8 ± 8.2 | |||
| A | 6.8 ± 0.6 | 96.3 ± 8.3 c | 103.1 ± 8.7 c | ||||
| H | 13.3 ± 1.9 a,b | 81.4 ± 9.5 | 94.7 ± 9.7 | ||||
| Age (Months) | Diet | Body Weight (g) | Food Intake (g/Day) | K1 Intake (µg/Day) | Food Intake (g/100 g·BW/Day) | K1 Intake (µg/100 g·BW/Day) | |||||
|---|---|---|---|---|---|---|---|---|---|---|---|
| F | M | F | M | F | M | F | M | F | M | ||
| 3 | AL | 277 ± 35 z | 523 ± 73 | 16.5 ± 1.7 z | 22.5 ± 1.3 | 8.3 ± 0.8 z | 11.2 ± 0.6 | 6.0 ± 0.5 z | 4.3 ± 0.4 | 3.0 ± 0.2 z | 2.2 ± 0.2 |
| 20 | AL | 647 ± 171 y,z | 939 ± 132 y | 18.0 ± 3.5 z | 27.1 ± 3.8 y | 9.0 ± 1.8 | 13.6 ± 9.3 | 2.9 ± 0.5 y | 2.9 ± 0.4 y | 1.4 ± 0.2 y | 1.4 ± 0.2y |
| CR | 281 ± 29 z,* | 484 ± 37 * | 11.0 x,z,* | 16.0 x,* | 9.2 z | 13.3 | 4.6 x,z,* | 3.9 * | 3.8 x,z,* | 3.3 x,* | |
| Diet | K1 | MK-4 | K1 + MK4 | ||||
|---|---|---|---|---|---|---|---|
| F | M | F | M | F | M | ||
| pmol/g or L Plasma | pmol/g or L Plasma | pmol/g or L Plasma | |||||
| Plasma | |||||||
| 3 | AL | 0.21 ± 0.03 | 0.25 ± 0.08 | nd | nd | 0.21 ± 0.03 | 0.25 ± 0.08 |
| 20 | AL | 1.73 ± 0.15 y,z | 1.12 ± 0.11 y | nd | nd | 1.73 ± 0.15 y,z | 1.12 ± 0.11 y |
| CR | 1.35 ± 0.10 x,z,* | 0.85 ± 0.07 x,* | nd | nd | 1.35 ± 0.10 x,* | 0.85 ± 0.07 x,* | |
| Liver | |||||||
| 3 | AL | 54.2 ± 8.1 | 48.4 ± 17.9 | 43.4 ± 3.6 z | 18.5 ± 2.1 | 97.6 ± 7.7 | 56.9 ± 20.0 |
| 20 | AL | 71.2 ± 7.9 | 50.7 ± 6.1 | 66.6 ± 12.0 | 54.5 ± 6.1 y | 137.8 ± 17.9 | 105.2 ± 7.2 y |
| CR | 49.0 ± 5.7 * | 50.6 ± 6.6 | 61.6 ± 8.2 | 48.6 ± 5.6 x | 110.6 ± 10.5 | 99.2 ± 7.3 x | |
| Heart | |||||||
| 3 | AL | 32.1 ± 2.1 | 31.2 ± 1.9 | 24.7 ± 2.4 | 26.2 ± 5.1 | 56.7 ± 2.9 | 57.4 ± 5.5 |
| 20 | AL | 47.2 ± 6.4 | 46.9 ± 5.1 | 55.5 ± 5.6 y | 43.3 ± 5.6 | 102.8 ± 10.2 y | 90.2 ± 9.6 y |
| CR | 32.7 ± 6.8 | 41.5 ± 5.8 | 53.6 ± 4.8 x,z | 38.7 ± 4.6 | 86.3 ± 9.0 | 80.2 ± 7.4 | |
| Kidney | |||||||
| 3 | AL | 9.3 ± 4.3 | 5.6 ± 1.4 | 29.5 ± 2.8 z | 12.0 ± 3.3 | 38.7 ± 4.9 z | 17.6 ± 3.5 |
| 20 | AL | 11.8 ± 1.1 z | 7.6 ± 0.4 | 54.5 ± 4.7 y,z | 35.0 ± 3.9 y | 66.3 ± 5.1 y,z | 42.6 ± 4.3 y |
| CR | 10.1 ± 1.0 z | 6.2 ± 0.4 * | 45.3 ± 4.7 z | 33.2 ± 1.6 x | 55.4 ± 5.0 z | 39.4 ± 1.5 x | |
| Spleen | |||||||
| 3 | AL | 23.6 ± 5.1 | 25.1 ± 2.3 | 17.0 ± 3.0 | 19.7 ± 3.7 | 40.6 ± 7.0 | 44.8 ± 5.3 |
| 20 | AL | 26.9 ± 3.2 | 23.5 ± 2.2 | 64.0 ± 7.2 y,z | 41.1 ± 4.4 y | 90.9 ± 8.9 y,z | 64.6 ± 6.3 |
| CR | 24.2 ± 3.0 | 23.0 ± 3.0 | 53.7 ± 6.0 x | 42.8 ± 5.7 x | 77.9 ± 7.8 x | 65.7 ± 7.2 | |
| Brain | |||||||
| 3 | AL | 4.3 ± 0.8 | 3.7 ± 0.6 | 63.6 ± 4.7 z | 46.6 ± 5.5 | 67.9 ± 5.0 z | 50.3 ± 5.6 |
| 20 | AL | 3.5 ± 0.4 | 3.6 ± 0.4 | 69.9 ± 5.6 | 66.3 ± 7.3 | 73.4 ± 5.8 | 70.0 ± 7.3 |
| CR | 4.6 ± 0.4 | 3.9 ± 0.4 | 52.9 ± 5.8 * | 54.8 ± 7.2 | 57.4 ± 5.9 | 58.7 ± 7.4 | |
| Ovaries | |||||||
| 3 | AL | 133.7 ± 19.6 | 426.5 ± 114.9 | 560.2 ± 133.1 | |||
| 20 | AL | 278.5 ± 27.4 y | 636.3 ± 58.5 | 914.8 ± 76.7 y | |||
| CR | 240.5 ± 28.0 x | 453.4 ± 42.1 * | 693.9 ± 65.0 * | ||||
| Testes | |||||||
| 3 | AL | 6.1 ± 1.0 | 131.8 ± 19.0 | 137.9 ± 19.6 | |||
| 20 | AL | 6.1 ± 0.6 | 110.4 ± 7.8 | 116.5 ± 7.8 | |||
| CR | 4.6 ± 0.3 | 123.6 ± 8.9 | 128.2 ± 8.7 | ||||
| Age (Months) | Diet | PT | APTT | ||
|---|---|---|---|---|---|
| (s) | |||||
| M | F | M | F | ||
| 3 | AL | 14.5 ± 1.2 | 13.5 ± 0.3 | 20.8 ± 1.2 | 21.6 ± 1.3 |
| 20 | AL | 12.8 ± 0.2 | 12.8 ± 0.3 | 21.7 ± 1.4 | 20.0 ± 1.6 |
| CR | 14.0 ± 0.4 z,* | 12.9 ± 0.2 | 23.3 ± 1.6 | 20.3 ± 1.1 | |
© 2016 by the authors; licensee MDPI, Basel, Switzerland. This article is an open access article distributed under the terms and conditions of the Creative Commons by Attribution (CC-BY) license (http://creativecommons.org/licenses/by/4.0/).
Share and Cite
Ferland, G.; Doucet, I.; Mainville, D. Phylloquinone and Menaquinone-4 Tissue Distribution at Different Life Stages in Male and Female Sprague–Dawley Rats Fed Different VK Levels Since Weaning or Subjected to a 40% Calorie Restriction since Adulthood. Nutrients 2016, 8, 141. https://doi.org/10.3390/nu8030141
Ferland G, Doucet I, Mainville D. Phylloquinone and Menaquinone-4 Tissue Distribution at Different Life Stages in Male and Female Sprague–Dawley Rats Fed Different VK Levels Since Weaning or Subjected to a 40% Calorie Restriction since Adulthood. Nutrients. 2016; 8(3):141. https://doi.org/10.3390/nu8030141
Chicago/Turabian StyleFerland, Guylaine, Isabelle Doucet, and Dominique Mainville. 2016. "Phylloquinone and Menaquinone-4 Tissue Distribution at Different Life Stages in Male and Female Sprague–Dawley Rats Fed Different VK Levels Since Weaning or Subjected to a 40% Calorie Restriction since Adulthood" Nutrients 8, no. 3: 141. https://doi.org/10.3390/nu8030141
APA StyleFerland, G., Doucet, I., & Mainville, D. (2016). Phylloquinone and Menaquinone-4 Tissue Distribution at Different Life Stages in Male and Female Sprague–Dawley Rats Fed Different VK Levels Since Weaning or Subjected to a 40% Calorie Restriction since Adulthood. Nutrients, 8(3), 141. https://doi.org/10.3390/nu8030141