Article

Evaluation of the Effect of Hydroseeded Vegetation for Slope Reinforcement

by
Okoli Jude Emeka
1,
Haslinda Nahazanan
1,*,
Bahareh Kalantar
2,
Zailani Khuzaimah
3 and
Ojogbane Success Sani
1
1
Department of Civil Engineering, Faculty of Engineering, Universiti Putra Malaysia, Serdang 43400, Malaysia
2
RIKEN Center for Advanced Intelligence Project, Goal-Oriented Technology Research Group, Disaster Resilience Science Team, Tokyo 103-0027, Japan
3
Institute of Plantation Studies, Universiti Putra Malaysia, Serdang 43400, Malaysia
*
Author to whom correspondence should be addressed.
Land 2021, 10(10), 995; https://doi.org/10.3390/land10100995
Submission received: 21 July 2021 / Revised: 20 August 2021 / Accepted: 21 August 2021 / Published: 22 September 2021
(This article belongs to the Special Issue Landslide Hazard and Environment Risk Assessment)

Abstract

:
A landslide is a significant environmental hazard that results in an enormous loss of lives and properties. Studies have revealed that rainfall, soil characteristics, and human errors, such as deforestation, are the leading causes of landslides, reducing soil water infiltration and increasing the water runoff of a slope. This paper introduces vegetation establishment as a low-cost, practical measure for slope reinforcement through the ground cover and the root of the vegetation. This study reveals the level of complexity of the terrain with regards to the evaluation of high and low stability areas and has produced a landslide susceptibility map. For this purpose, 12 conditioning factors, namely slope, aspect, elevation, curvature, hill shade, stream power index (SPI), topographic wetness index (TWI), terrain roughness index (TRI), distances to roads, distance to lakes, distance to trees, and build-up, were used through the analytic hierarchy process (AHP) model to produce landslide susceptibility map. Receiver operating characteristics (ROC) was used for validation of the results. The area under the curve (AUC) values obtained from the ROC method for the AHP model was 0.865. Four seed samples, namely ryegrass, rye corn, signal grass, and couch, were hydroseeded to determine the vegetation root and ground cover’s effectiveness on stabilization and reinforcement on a high-risk susceptible 65° slope between August and December 2020. The observed monthly vegetation root of couch grass gave the most acceptable result. With a spreading and creeping vegetation ground cover characteristic, ryegrass showed the most acceptable monthly result for vegetation ground cover effectiveness. The findings suggest that the selection of couch species over other species is justified based on landslide control benefits.

1. Introduction

Landslide hazard management, prevention, and control are critical to preventing loss of lives and properties [1,2,3]. For every hazard management, mitigation is the final stage, and it provides the methodology of controlling any form of natural hazard [4,5,6]. Mitigating an existing landslide hazard or preventing future landslides is an element of a dangerous decrease in the causative components or an increase in the opposing forces [4,7,8]. Vegetation influence in slope stability analysis reveals a significant and still ongoing challenge for research. Few research studies within the mitigation framework of slope stability have increasingly leaned towards the influence exerted by either vegetation canopy [9,10] or vegetation root mechanisms [11,12], with more emphasis on the surface runoff on vegetation cover. The present study focuses on the effective means of reducing the rate of surface runoff, which practically reduces the effect of landslides through their combined vegetation cover and vegetation root system. Bare slopes are prone to landslides as a result of the lack of surface cover.
Moreover, due to the tropical weather conditions of Malaysia, the soils go through intense soil weathering, which may elevate soil erosion and surface runoff. Landslide control measures are essential to address the issues of slope failures due to their impact on lives and the economy. So far, there has not been much available information or research on vegetation slope stabilization methods in Malaysia. According to Popescu [13], a list of approaches to control and prevent landslides was organized into four experimental groups by the International Union of Geological Sciences Working Group on Landslides (IUGS WG/L), which includes: (i) Slope geometry modification (ii) Drainage (iii) Retaining structures (iv) Internal slope reinforcement. Moreover, Hutchinson [14] listed drainage as the most crucial methodology to reduce landslides, followed by slope geometry modification as the second most applied approach. The study also suggested that although a single mitigation strategy may prevail, most slope failure mitigation strategies combine some groups.
Over a decade, there has been an apparent shift to “soft engineering”, non-structural preventive measures such as drainage and slope geometry modification, as well as some novel approaches such as stabilization using lime/cement, soil nailing, or grouting [15]. Non-structural solutions are less expensive compared to the cost of structural solutions [16]. On the other hand, structural measures such as retaining walls include opening the slope during the construction process and sometimes needing steeper temporary cuts [17]. Both techniques increase the risk of landslide during construction or increased precipitation infiltration [18]. The mitigation approach should be designed to significantly fit the condition of the specific slope under investigation [19]. In high-risk terrains where landslides pose a danger to lives or primarily affect properties, a landslide expert, a geotechnical, or civil engineer should be consulted before carrying out any stabilization work [20]. However, these methods have their limitations. Thus, to address this, we looked into applying a soil bioengineering methodology, especially on plant species that have never been used in Malaysia. For effective landslide management, one must identify the most critical conditioning factors that affect the slope’s stability, determine landslide-susceptible areas, then select the appropriate and cost-effective method to be sufficiently utilized to minimize the possibility of landslide [21]. Here, we analyze the effects of different plant species used for slope stabilization in other parts of the world. Furthermore, the focus was on species selection and the vegetation engineering properties, especially their root architecture and ground cover. The present study also considers runoff, rainfall, soil type, vegetation, and slope. Thus, knowledge of the relationships between the landslide susceptibility mapping and an effective landslide control mechanism for effective landslide hazard management is fundamental [8].
Different landslide susceptibility models with a considerable level of accuracy have been developed and broadly classified into data-driven (quantitative) and expert opinion (qualitative) categories, both of which have their respective advantages and limitations. The choice of mapping techniques depends on the structure of the terrain, landslide triggering factors, data availability, and landslide types [22,23]. Data-driven methods are divided into statistical and deterministic approaches, according to Mantovani et al. [24]. A statistical method is an indirect approach that uses statistical analysis to obtain landslide predictions from several parameters. The statistical method is further divided into bivariate and multivariate models. Statistical models include frequency ratio (FR) [25,26], information value method (IVM) [27,28,29], weights of evidence method (WOE) [30,31,32,33], and machine learning algorithms, such as logistic regression (LR) [25,34], artificial neural network (ANN) [35,36], support vector machine (SVM) [37,38], and deep learning (DL) [39,40] are based on data collected from previous landslides and their spatial coverage. Integration between event data and targets makes landslide mapping easier in a geographic information system (GIS) environment [41]. These methods require less human knowledge and experience to produce and utilize as susceptibility models [36]. The machine learning algorithms effectively analyze large datasets with higher precision than statistical methods [42]. Generally, these data-driven strategies have their limitations, such as the application of a relative generalization approach for landslide parameters and applications over a large area, a lack of knowledge of the correlation between landslides and the conditioning parameters, and a lack of understanding of relevant expert ideas in empirical modeling [33]. In recent years, machine learning algorithms have become a more robust approach in landslide research [43], but the models require managing uncertainties. These uncertainties could result from errors and model variability [44], difficulties in the selection of parameters [45], system understanding [46], the weighting of parameters [47], and human judgment [48]. Moreover, machine learning may encounter prediction errors if trained with a small data set [43]. Besides errors from model building, the selection of input variables also impacts the prediction accuracy in machine learning [49]. Uncertainties resulting from these landslide susceptibility models are inevitable [48] and can threaten the selection of the most suitable landslide susceptibility approach [50].
In qualitative methodologies divided into geomorphic and heuristic methods, such as AHP [51,52,53] and weighted linear combination [8,54,55], weights and ranks are assigned by the experts regardless of any existing landslide inventory maps and terrain variations [28]. The deterministic approach includes static and dynamic methods that evaluate landslide hazards using slope stability models, which results in the calculation of safety factors. Contrary to data-driven models, expert knowledge has been projected as outstanding, more reliable, consistent, and generally applicable when the knowledge is formalized, particularly for a large-scale mapping [56]. Another advantage of these approaches is that each polygon on the map can be evaluated separately, according to its unique set of conditions [57]. The main limitations of these methods are their subjectivity in factor selection, mapping, and the weighting of the parameters, but avoid generalization, as is often used in data-driven strategies [58]. Due to these different landslide susceptibility approaches, they may produce varying results.
Although these methods may yield accurate results in most cases, there is also a certain degree of uncertainty, sometimes leading to inaccurate results [59]. The weighting of criteria can result in many uncertainties in expert opinion methods [60]. The user’s preferred data input choices are seen as the actual rules in the spatial decision-making process and but may often be erroneous. These uncertainties can unfavorably influence the accuracy of the landslide susceptibility results if ignored [61]. Attempts have been made to improve the accuracy of these models, as they are valuable tools for solving a wide range of spatial anomalies [62]. Therefore, the authenticity of any spatial simulation models and expert opinion methods depends largely on calculating the relative importance of each parameter [63]. Moreover, the model validation process must be reliable, robust, and have a certain degree of fitting and prediction skill [64]. However, the performance evaluation of most of the landslide susceptibility maps (LSMs) can be based on the testing datasets [65].
AHP, first developed by Saaty [62], is categorized under this qualitative approach and applied by several researchers for landslide susceptibility assessment [51,52,66,67]. AHP uses a hierarchical process of landslide parameters to compare possible pairs and assign weights and a consistency ratio [8]. The AHP method is based on three principles: Decomposition, comparative judgment, and assigning priorities [8]. AHP enables the experts to derive significant parameters from a pair of criteria for multi-criteria decision-making. It decides the parameters based on the objective and knowledge of the problem [68].
Hydroseeding is an efficient method of plant establishment on a land surface [69] and involves applying seed under pressure using a water carrier [70]. The basic hydroseeding concept sprays seed mixed with water or dried onto an already prepared surface [71]. Hydroseeding is a mechanism that involves the application of a mix of seeds, adhesives, mulch, fertilizers, and water on soils, using an appropriate hydroseeding tool [70]. This experiment evaluates the reinforcement effect of four seed samples on a failing terrain within the Universiti Putra Malaysia (UPM) by applying the same mixtures and spray methodology, comparing their vegetation root system and ground cover, and evaluating their vegetation landslide control strength. This approach is one of the techniques of ground revegetation used to stabilize bare soil surface to control landslide hazards [72]. Cellulose mulch mixed with tackifier as a binder is also applied [73]. The cellulose mulch, combined with the seeds, germinator, fertilizer, are mixed with water in the hydroseeder, forming a homogeneous slurry and uniformly sprayed on the soil [74]. The fertilizer-mixed cellulose fiber mulch and the seed act as an absorbent mat and hold a large water capacity that helps seed germination and forms a stable blanket cover on the surface before the seed germination period. Hydroseeding is a widely used method of landslide or soil erosion control [75]. The United States and Australia are among the countries that use hydroseeding because it is considered the fastest, most efficient, and most economical method of landslide control [76]. Studies revealed the following observations and conclusions from hydroseeding application: (a) The hydroseeding process is the fastest means of landslide and soil erosion prevention [74]; (b) Some seeds germinate within two days, which enables the topsoil of the embankment to be already 100% stabilized right before the development of the vegetation ground cover [77]; (c) Watering is required less as soon as the ground cover grass seed has been established [78]; (d) The mulch serves as water retention and absorbing mat, and reduces the development of the unwanted weeds [74]; (d) The end product of hydroseeding requires a very minimal maintenance policy as soon as the permanent ground cover is purely developed [74]. In summary, the contribution of this study is to compare the slope reinforcement effectiveness of the four seed samples (rye corn, ryegrass, signal grass, and couch) used in different parts of the world in Malaysia in relation to the soil conditions.

2. Study Area and Materials

2.1. Study Area

The study was conducted within the UPM, a government tertiary institution in Serdang, Selangor, Peninsular Malaysia (Figure 1a), a land surface of about 1108 hectares made up of different natural and artificial facilities in buildings, agricultural lands, trees, and lakes. The entire area is within latitude: 2°59′34.19″ N and longitude: 101°42′16.79″ E. It is mostly warm with a sunny tropical rainforest climate and abundant rainfall, particularly in the northeast monsoon season between October and March. It has a constant annual temperature with a maximum between 31 and 33 °C, while minimums are usually between 22 and 23.5 °C. The average yearly rainfall is about 2400 mm, with relative dryness between June and July. The geology of Serdang consists of three different rock formations, which include the Kajang, Kuala Lumpur, and Kenny hills formations. Kajang formation consists of schist and some intercalations of limestone and phyllites. On the other hand, the Kuala Lumpur formation consists of limestones with intercalation of phyllite, while quartzes and phyllite make up the Kenny hills formation [79]. The experiment was carried out on the 11 August 2020 on a 65° slope gradient within 2°59′34.3″ N 101°43′30.1″ E. The area’s soil is a mix of sandy, clay, and loam collectively identified under Serdang and Malacca. The surrounding vegetation in the site consisted of native and introduced lower grasslands species. The land is irregular, highly degraded with a uniform slope subject to severe erosion, and prone to landslide, with no vegetation. Before carrying out the field tests, a calibration test was conducted to identify the machine calibrations and settings. This test showed that the spray mechanism was reliable and ready to go with the tests.
The site was cleared of stumps, rock debris, stones, and unwanted materials of more than 4–5 cm (Figure 1c). A hand rake was used to rough grade the entire area to uncover debris and level the site. Initial tiling to a depth of 5 cm was done to reduce earth compaction, allow bonding of the topsoil and the subsoil, and improve vegetation root penetration and groundwater movement. We also studied the soil’s physical and chemical properties to reveal the soil nutrient level, pH, acidity, and alkalinity level. The site was measured and marked and ready for hydroseeding. Table 1 presents the description of the study area.

Physical and Chemical Properties of Serdang and Malacca Series

The soil of the study area was predominantly sand. The soil textures were primarily sandy clay loam to sandy clay. The clayey property of the soil increased slightly with depth. This is one of the characteristics of the Serdang series, developed from sandstone parent material [80]. The Serdang and Malacca Series consisted of topsoil at 0.1 m and 1.5 m subsurface depth. At a depth of 1.5 m, the value of the soils of the Serdang series was about 57.21% sand, 10.21% silt, and 32.53% clay. For the Malacca series, at between 1.5 m, the values of the soils samples collected were about 41.58% sand, 2.94% silt, and 55.49% clay.
The physical and chemical properties of soils depend primarily on soil texture, which gives more ideas on soil classification (a nutrient required by plants), crop suitability, and soil interpretation [81]. The particle size distribution of the Malacca soil series observed in the study area reveals that the Malacca series’s soil is dominated by clay. Sand content decreases with depth while clay content increases with depth. High clay content on the B horizon shows that illuviation has occurred and that the Malacca series contains more ferromagnesium minerals, which produces more clay [82]. The soil had a lower bulk density on the topsoil, which means that the soil organic matter content was lesser on topsoil with values between 1.47 and 1.42 grcm−3 and from 1.48 to 1.49 grcm−3 and 1.44 to 1.45 grcm−3 on the subsoil. The bulk density of the Serdang series was moderate and can improve crop production. The value of bulk density of the Malacca series was 1.36 and 1.27 grcm−3 at the topsoil, and between 1.37 to 1.41 grcm−3 and 1.30 to 1.32 grcm−3 on subsoil. The bulk density was higher on the subsoil. This is due to the compaction of soil at the oxic horizon as a result of the illuviation process. It could also be a result of the decrease in organic matter content with depth.
The water holding capacity of the topsoil and subsoil at 33 kPa ranged from 23.02 to 16.61 v/v and 21.16 to 17.01 v/v while the water holding capacity of the topsoil and subsoil at 1500 kPa ranged from 12.59 to 7.58 v/v and 11.97 to 8.36 v/v. The value of soil moisture content at the potential 33 kPa (FC) and 1500 kPa (PWP) was higher on topsoil than subsoil. More organic matter content in the topsoil increases the soil’s ability to hold water. At 33 kPa, the water holding capacity of the Malacca series’ was 23.83% to 21.51% v/v on the topsoil and 23.72% to 21.81% v/v on subsoil, while at 1500 kPa, water was held from 10.75% to 10.77% v/v on topsoil and from 10.29% to 13.23% v/v on the subsoil. The low available water holding capacity is due to low organic matter, which reduces the specific surface area of the soil. Both soil series show very strong to moderate pH values from 4.99 to 4.90 and 5.68 to 5.22. The pH value of the topsoil is higher than the subsoil, probably as a result of the H+ supply to the soil by organic matter. The pH values were between 4 and 5 and are considered low. This value is typical for tropical soil, where soil erosion, weathering, and leaching are considered very high. The pH of Ultisols in Malaysia is acidic below 7, which ranges from 4 to 5 in the B horizon due to climatic conditions that wash away the soil’s cations such as Ca2+ Ma2+, P, K, and Na, and causes the accumulation of sesquioxide and has an impact on low productivity [83]. Table 2 summarizes the properties of the soil of the study location.

2.2. Data Description

2.2.1. Hydroseeding Mixture

After studying the nature of the slope, climate, and soil condition, the experiment was carried out on a steep slope within the study area. We prepared the land and divided the layout into four segments measuring 8 ft in length and 2 ft wide, creating a square-shaped plot of 32 ft on all sides—a rigid distinction made due to a slope gradient and separate subplots. The seeds were separately mixed with fertilizer and liquid seed germinator in the exact quantities and sprayed accordingly. The following samples and mixtures were applied:
G1: Rye grass (Lolium perenne L.). Ryegrass originated from Europe, Asia, and North Africa and is mainly cultivated and naturalized in Australia, America, and some islands in Oceania. Characterized by bunch-like growth habits, they are perennial. Perennial ryegrass is significant in forage/livestock systems. The high palatability and quick digestibility characteristics make it highly valuable for dairy and sheep foraging systems. In temperate regions, ryegrass is sometimes called forage grass. Its main features include increased yield potential, faster establishment, appropriate for reduced-tillage renovation, and application on heavy and waterlogged soils (Figure 2a).
G2: Rye corn (Secale cereale) originates from Turkey. Rye corn is a species of cereal that has been commonly grown on the sandy outlays of the Mallee regions of South Australia and Victoria. A versatile species that tolerate arid conditions and grows well on sandy soil types, it performs best when grown on good fertile soils that respond well to nitrogen applications to gain the most from the shorter growing season soils (Figure 2b).
G3: Signal grass (Brachiaria decumbens/Urochioa Decumbens): It is originally from Uganda and widely grown in tropical and subtropical countries. It forms a thick, high-yielding sward that reacts very well to increased nitrogen. It is also a perennial grass with a solid stoloniferous root system and extended training stems that roots down from their nodes. It is recommended for shallow slope erosion control and is predominantly grown on most road cuts in Malaysian highways. Signal grass was initially used in the wet, humid tropics, but in recent years it has been grown over much broader climatic conditions (Figure 2c).
G4: Couch Bermuda grass (Cynodon dactylon) is native to most eastern hemispheres (Afro-Eurasia and Australia). Moreover, it is perennial and has both stolon and rhizomes. The couch is used both as a cover crop and for erosion control. This grass produces good quality hay and grazing. This grass adapts mainly in areas where the annual rainfall varies between 600 mm and 1750 mm (Figure 2d). Table 3 presents the seed sample’s origin, quantity, and price.
Bio Green is a concentrated, highly effective, water-soluble, granular fertilizer with the optimum ratio of nutrients. It is highly suitable for grass, greens, and leafy plants. Bio green contains three significant elements, namely Nitrogen, Phosphorus, and Potassium (NPK), which enhance the growth of plants. Nitrogen (N) aids in leaf growth, which then forms proteins and chlorophyll. Phosphorus (P) aids in root development, while Potassium (K) helps in stem and root growth and protein synthesis. Bio-green is a Malaysian formulated product that has undergone extensive research and testing to be equivalent in performance to fertilizers’ NPK 15.15.15 range. It is a product of composted organic materials with micro-nutrients naturally present. It contains natural humic and amino compounds and is highly water-soluble, with nutrient leaching being significantly reduced. It also improves soil structure, and its slow-release effect lasts longer compared to other fertilizers of a similar range.

2.2.2. Landslide Inventories and Conditioning Factors

A landslide inventory map with 202 landslide sites was obtained from an aerial photo from the UPM’s Geospatial Information Science Research Centre (GISRC) database supported with field observation. Furthermore, the landslide inventory was divided into two datasets (ground truth and classified); 70% (141 points) were used as ground truth data to train the models, while 30% (61 points) were used as classified data in a confusion matrix to validate the models.
For this study, LiDAR data were analyzed by a qualitative method. The LiDAR data was captured in 2015 by Ground Data Solution Bhd using a Riegl scanner aboard an EC-120 Helicopter flown over the University Putra Malaysia at an altitude of about 600 m above the terrain surface. The acquired point cloud averages 6 points per square meter, with a 15 cm vertical accuracy on non-vegetated terrain and a 25 cm horizontal accuracy. Based on expert’s opinion, literature, and significance to the study area, twelve landslide conditioning factors within and around the study area, namely the elevation, slope, aspect, curvature, hill shade, land use, distance to trees, distance to road, distance to urban, distance to lake, stream power index (SPI), terrain roughness index (TRI), and topographic wetness index (TWI). Slope, aspect, elevation, curvature, and hill shade were directly created from the digital elevation model (DEM) derived from LiDAR data using their layer toolboxes. Stream power index (SPI), topographic wetness index (TWI), and terrain roughness index (TRI) were created from spatial layers such as slope, flow direction, and flow accumulation. Shapefiles of distances to roads, lakes, trees, and build-up were digitized as land-use/landcover from the LiDAR image and produced using the Euclidean distance method in ArcGIS with 10 × 10 cell sizes.

2.2.3. Effects of Climate on Vegetation

Changes in climatic conditions could reduce crop yield [84]. The increase in temperature results in enhanced evapotranspiration, decreasing water availability, and further exacerbating dry months [85]. High storms associated with heavy rainfall increase flood frequency, which negatively impacts vegetation growth. Moreover, an increase in air and the temperature of water reduces the efficiency of plants. Low rainfall and high temperature reduces soil moisture content, water availability for irrigation and impair crop growth in non-irrigated areas. We studied the climatic conditions of the study area (temperature and precipitation) before and after the test (from August to December 2020) to assess its relationship to seed germination, growth, and development. The climate data obtained from the Malaysian Meteorological Department were examined critically and implemented in the study. The study area has a constant annual temperature with a maximum between 31 and 33 °C, and minimums usually between 22 and 23.5 °C. The average annual rainfall is also about 2400 mm. Table 4 below shows the average climate condition of the study area.

3. Methodology

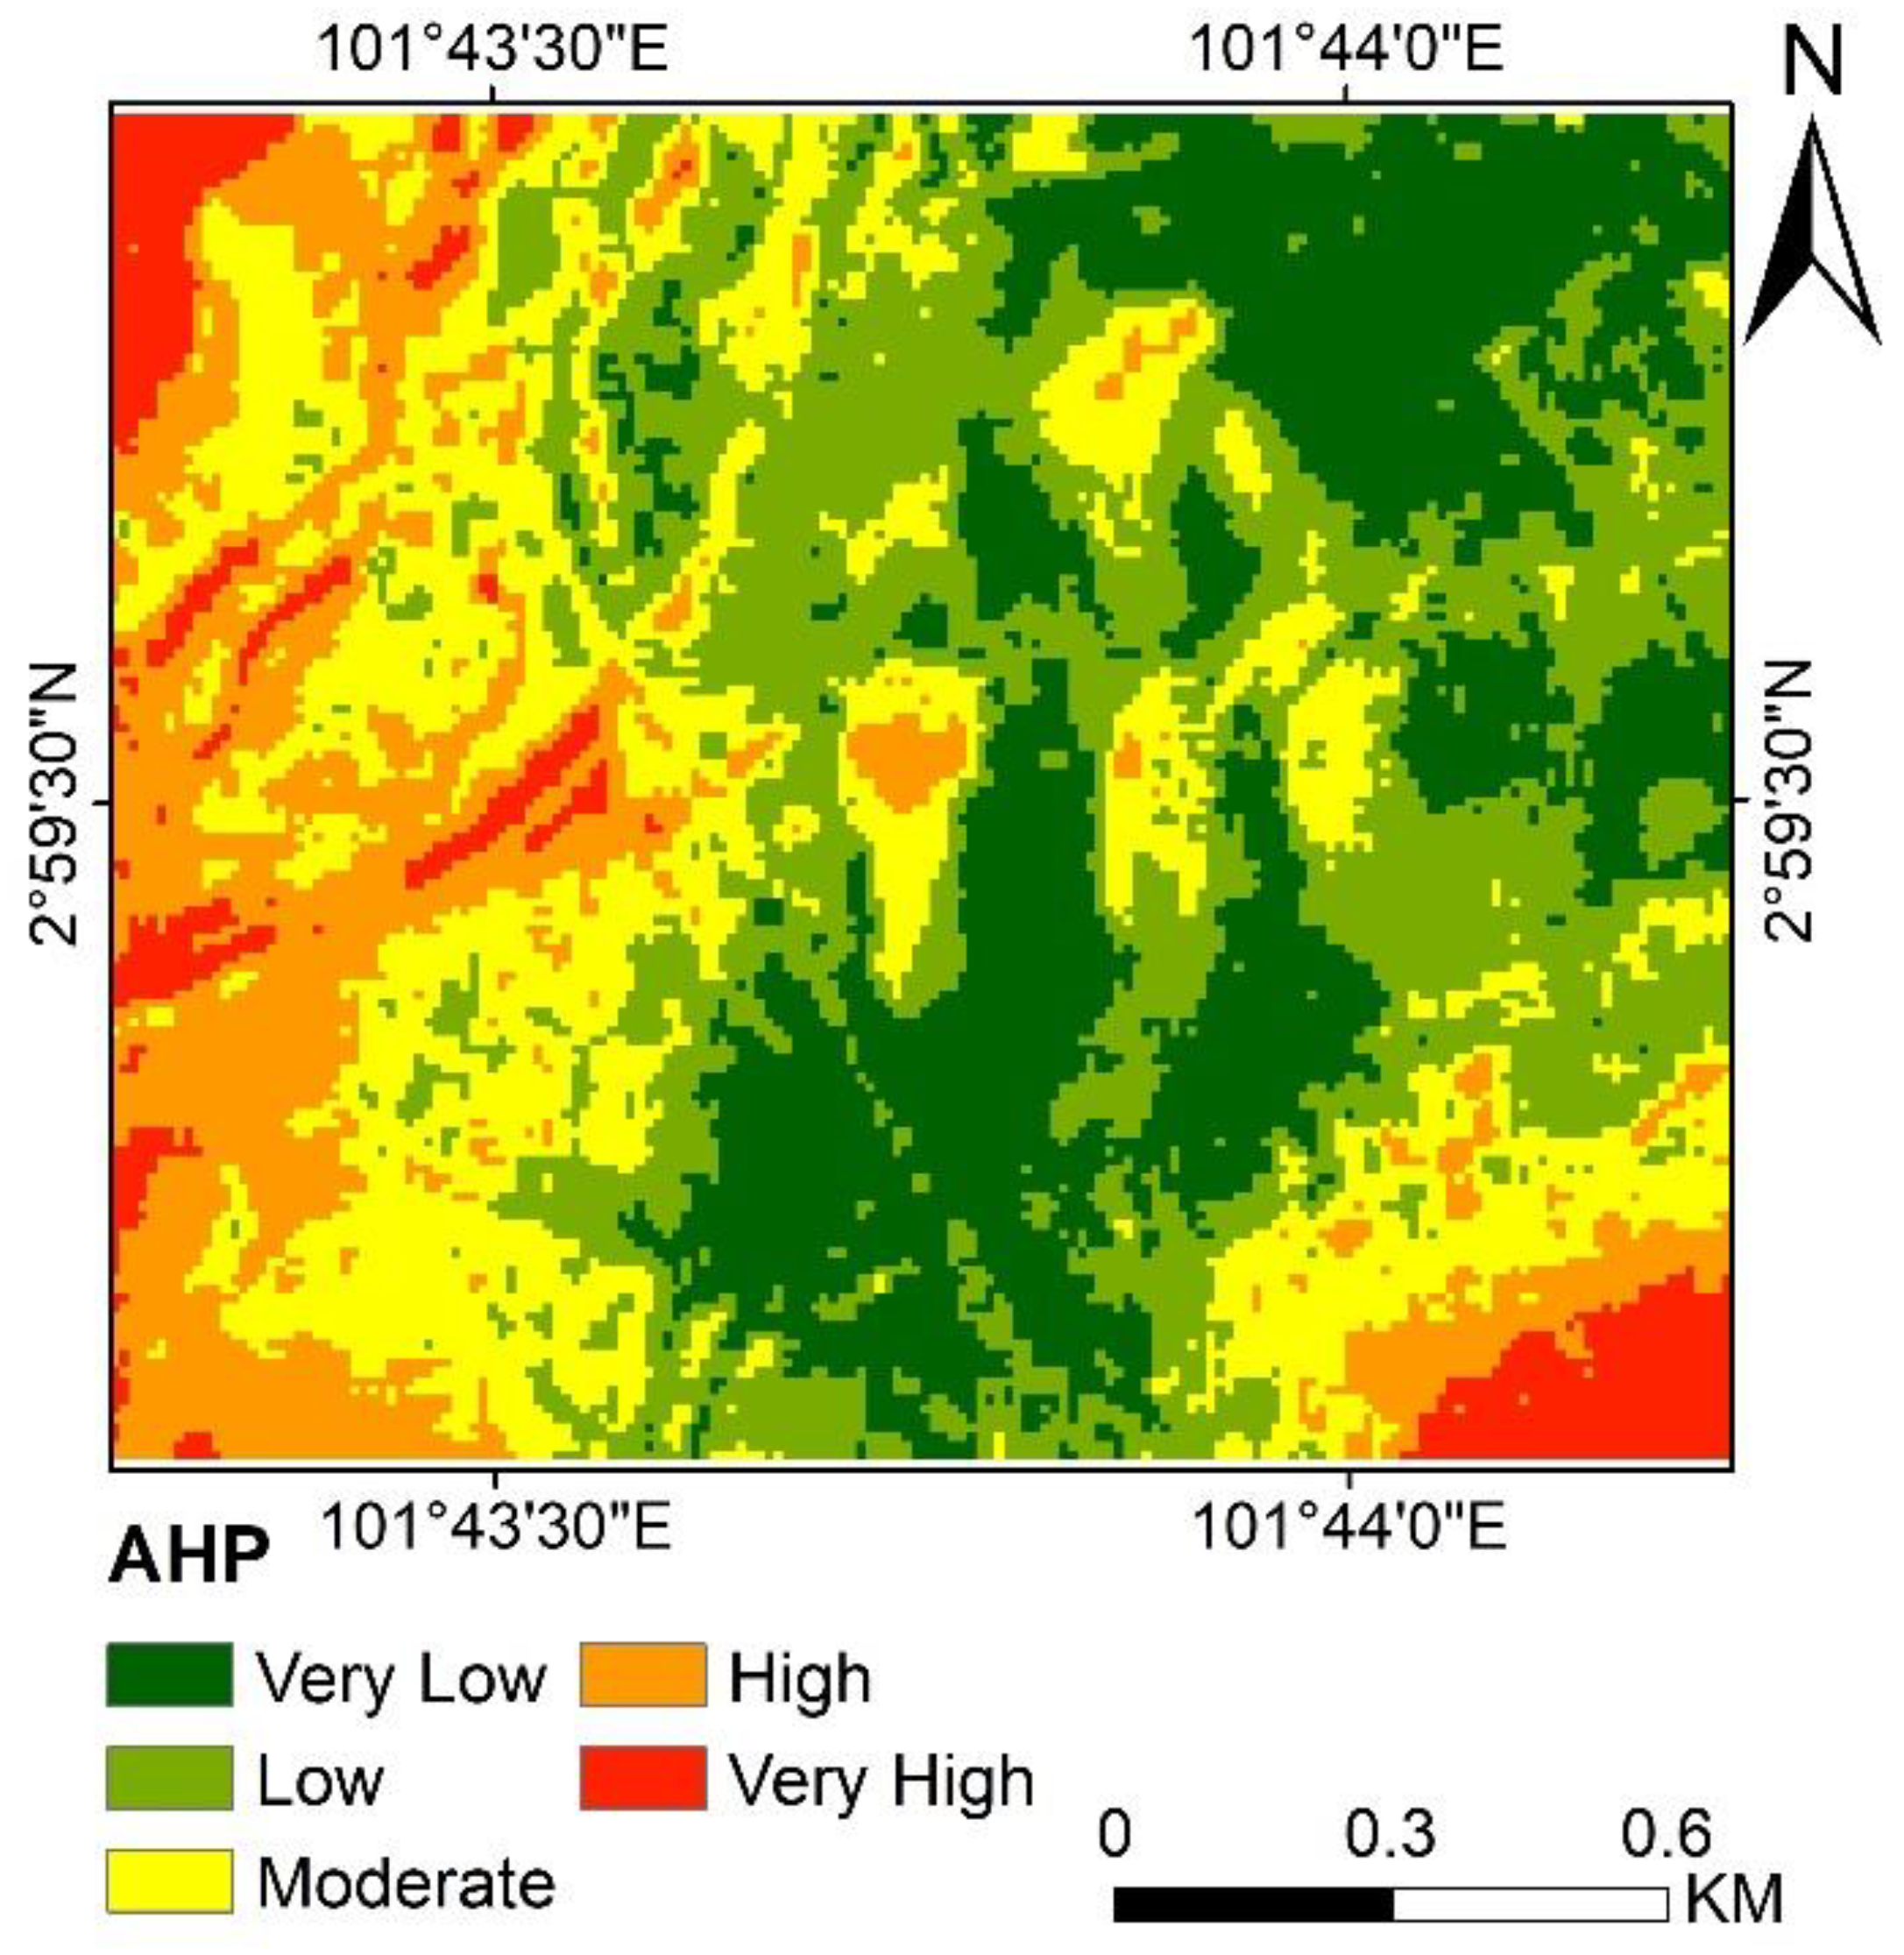
3.1. AHP for Landslide Susceptibility Mapping

The production of a landslide susceptibility map of the whole area to predict the possibility of landslide occurrence was carried out to determine landslide high and low-risk areas using the AHP method. Professor Thomas L. Saaty originally developed AHP as a multi-criteria decision-making (MCDM) approach [66]. Applying AHP in this study aims to identify, correlate, weigh, and rank different parameters that determine slope susceptibility to landslide [86]. The method assigned weights to the conditioning factors by pairwise comparison. This pairwise comparison creates judgments between pairs of the set of variables instead of prioritizing them. The conditioning parameters associated with the study area and essential to assess landslide susceptibility are significant in achieving this judgment. The conditioning factors were ranked between 1 to 9 according to their level of importance. AHP is one of the most widely successful GIS-based methodologies for landslide susceptibility mapping over the past decades [52]. This is due to its ease of use and high capabilities in providing prediction maps [87]. It uses the consistency ratio (CR) to identify consistencies by comparing the priorities of each criterion using the CR equation, according to Saaty [62].
CR = C I R I
where R I the random consistency index and CI represents the consistency index expressed as
CI = λ m a x 1 n 1
where λmax represents the principal value of the matrix, n is the order of the matrix. Moreover, the weights of each criterion were integrated into a single landslide susceptibility index by applying the equation:
L S I = i = 1 n Ri   × wi
This decision-making tool specifies the value of each factor. Where Ri represents the rating classes of each layer, and wi represents the weight of each of the landslide conditioning factors. Each factor’s weight from the matrix class was multiplied by the weight class. The local representation of elements in the slope area where landslide is predicated determines the susceptibility of map results.

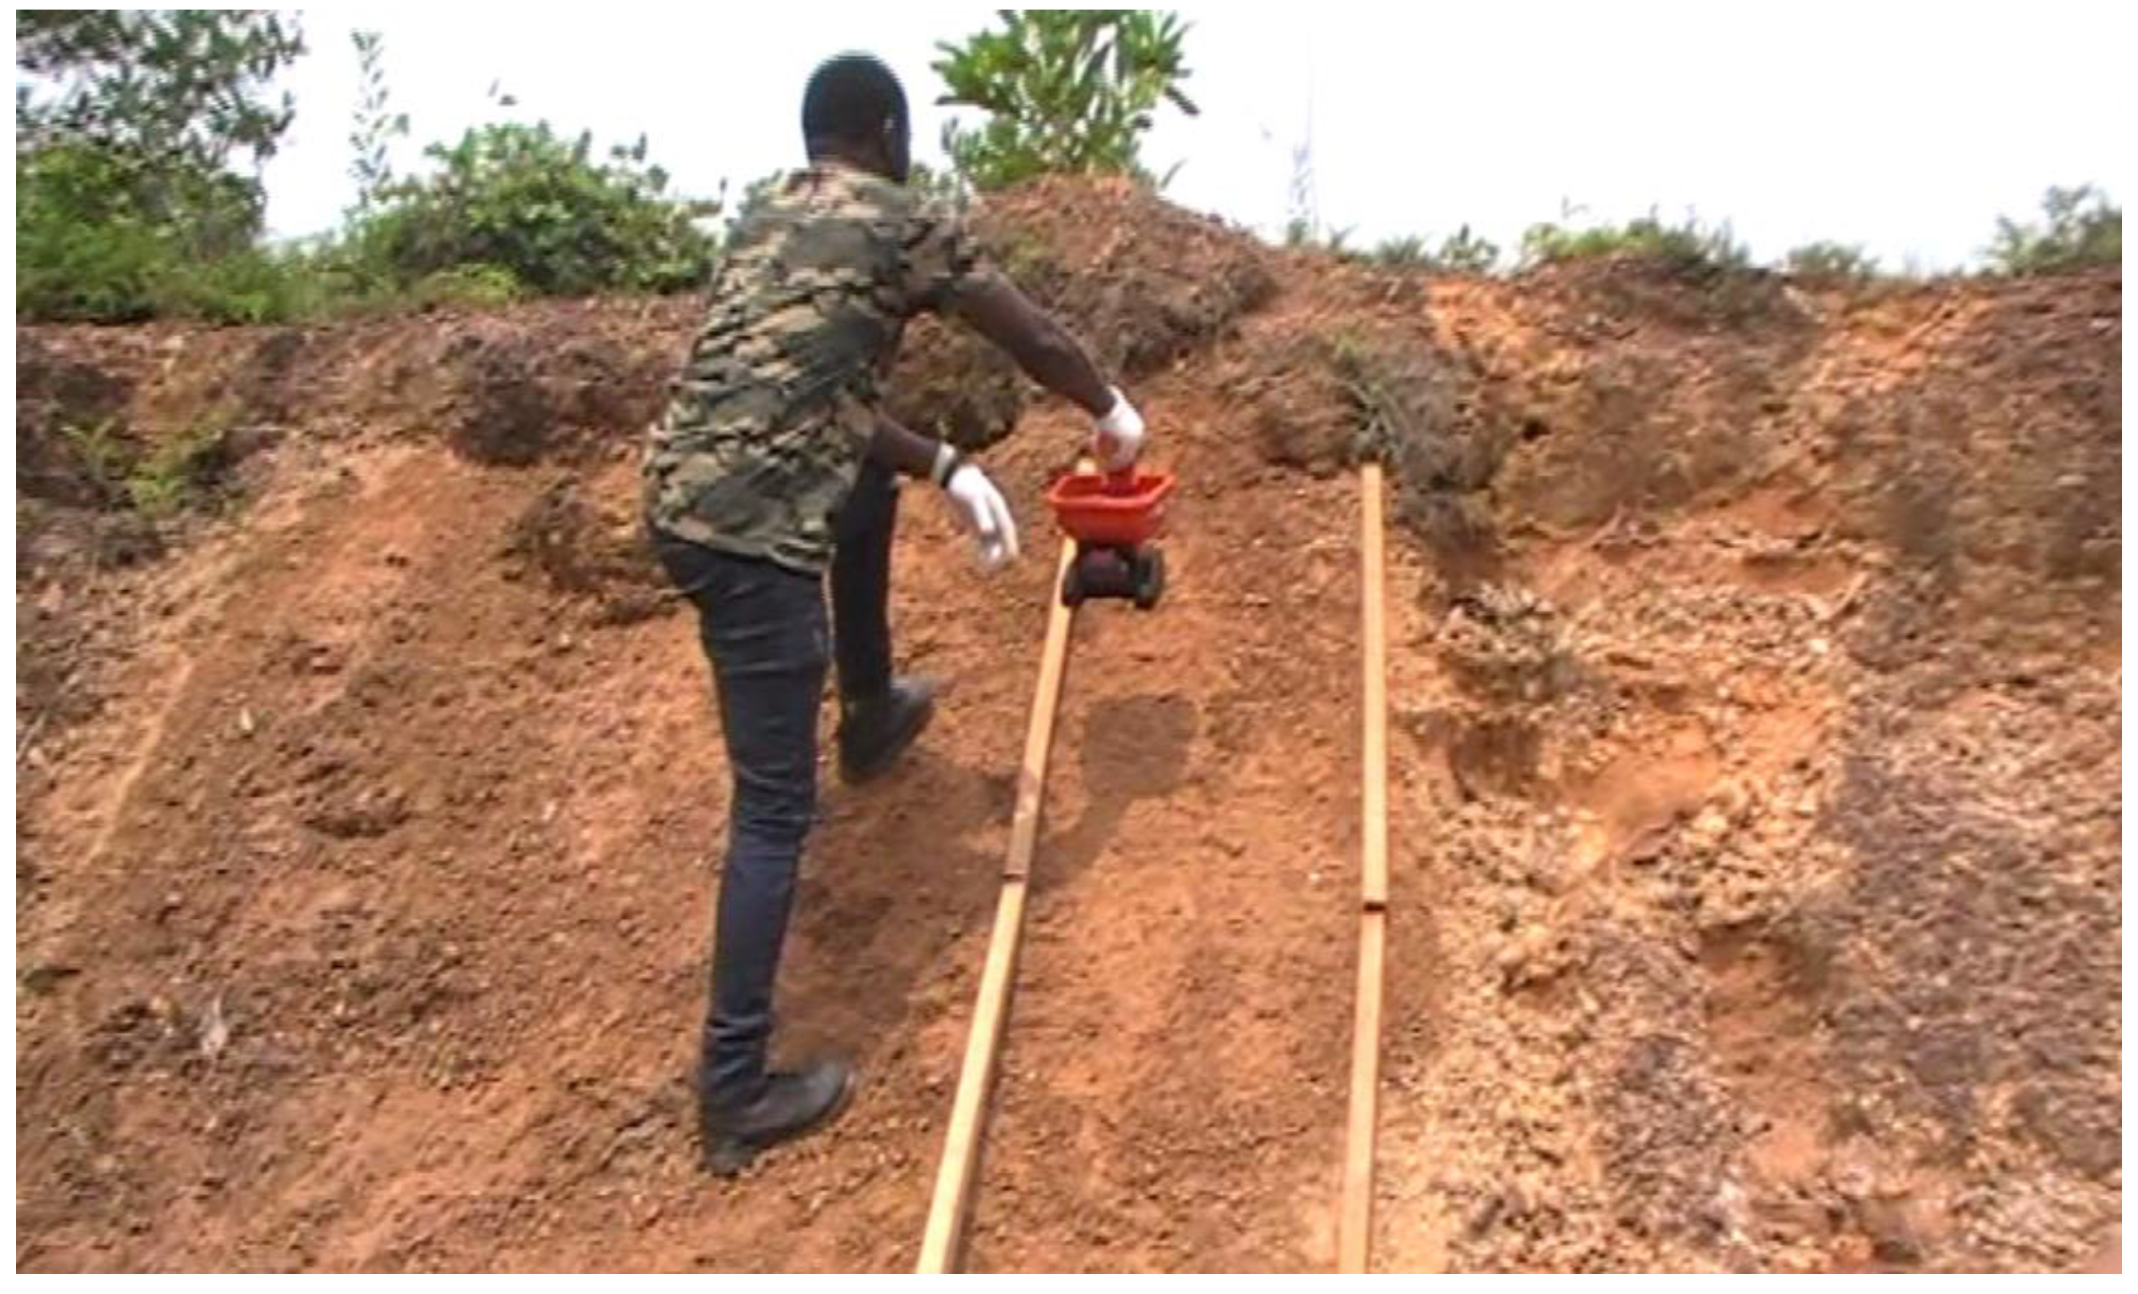
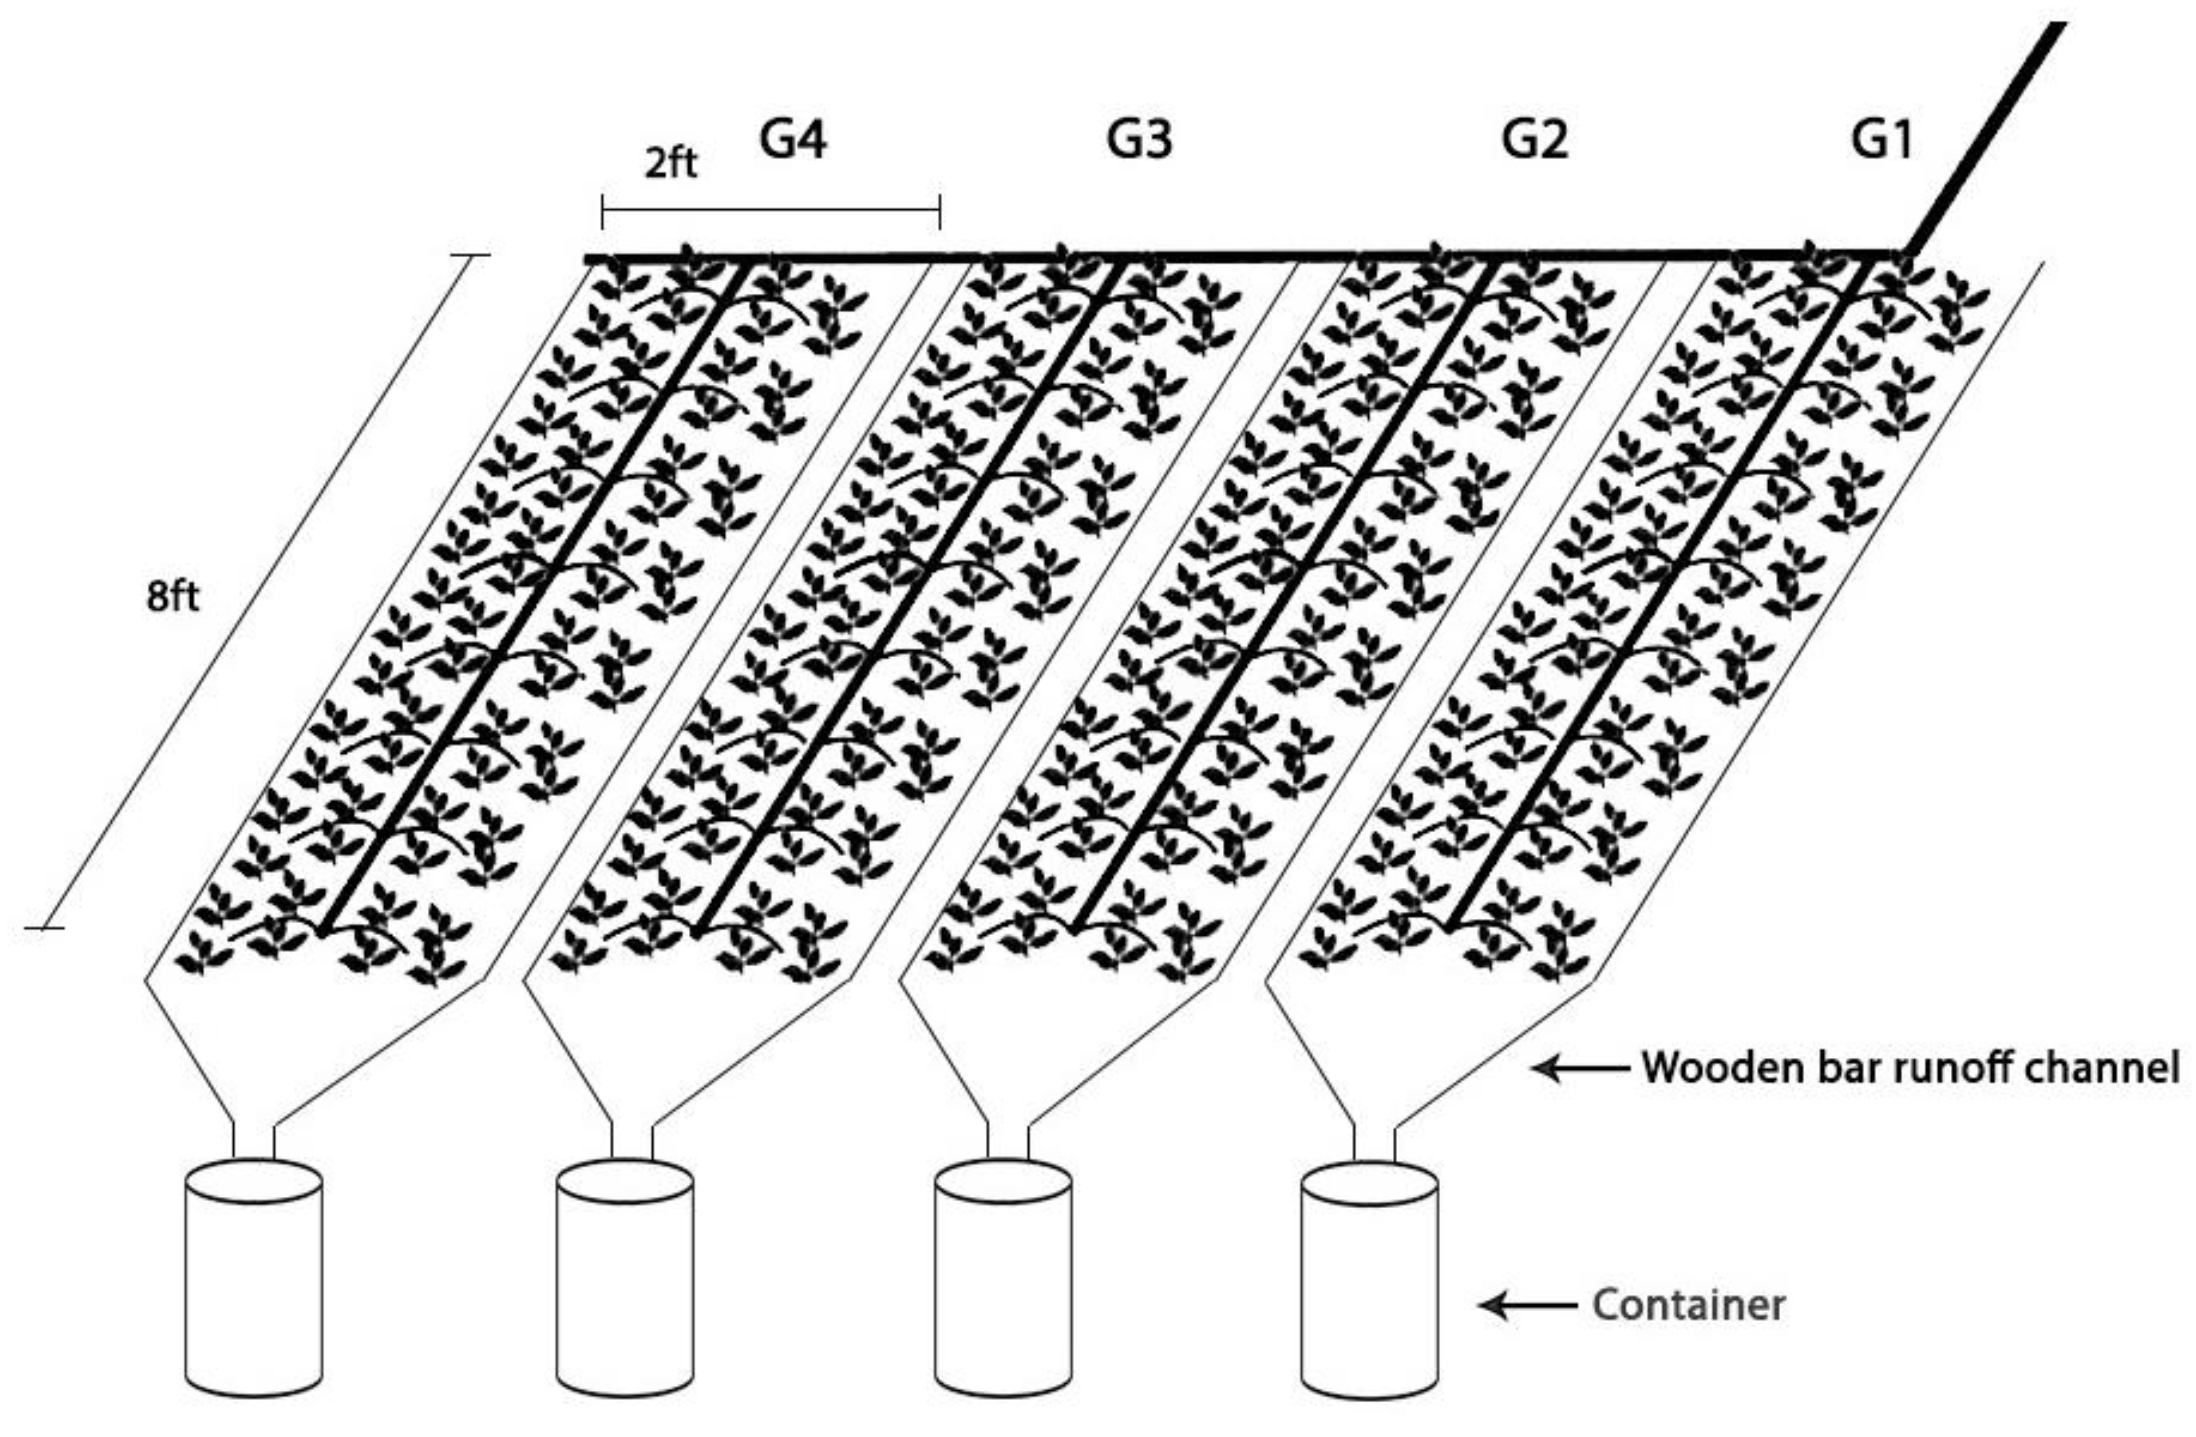
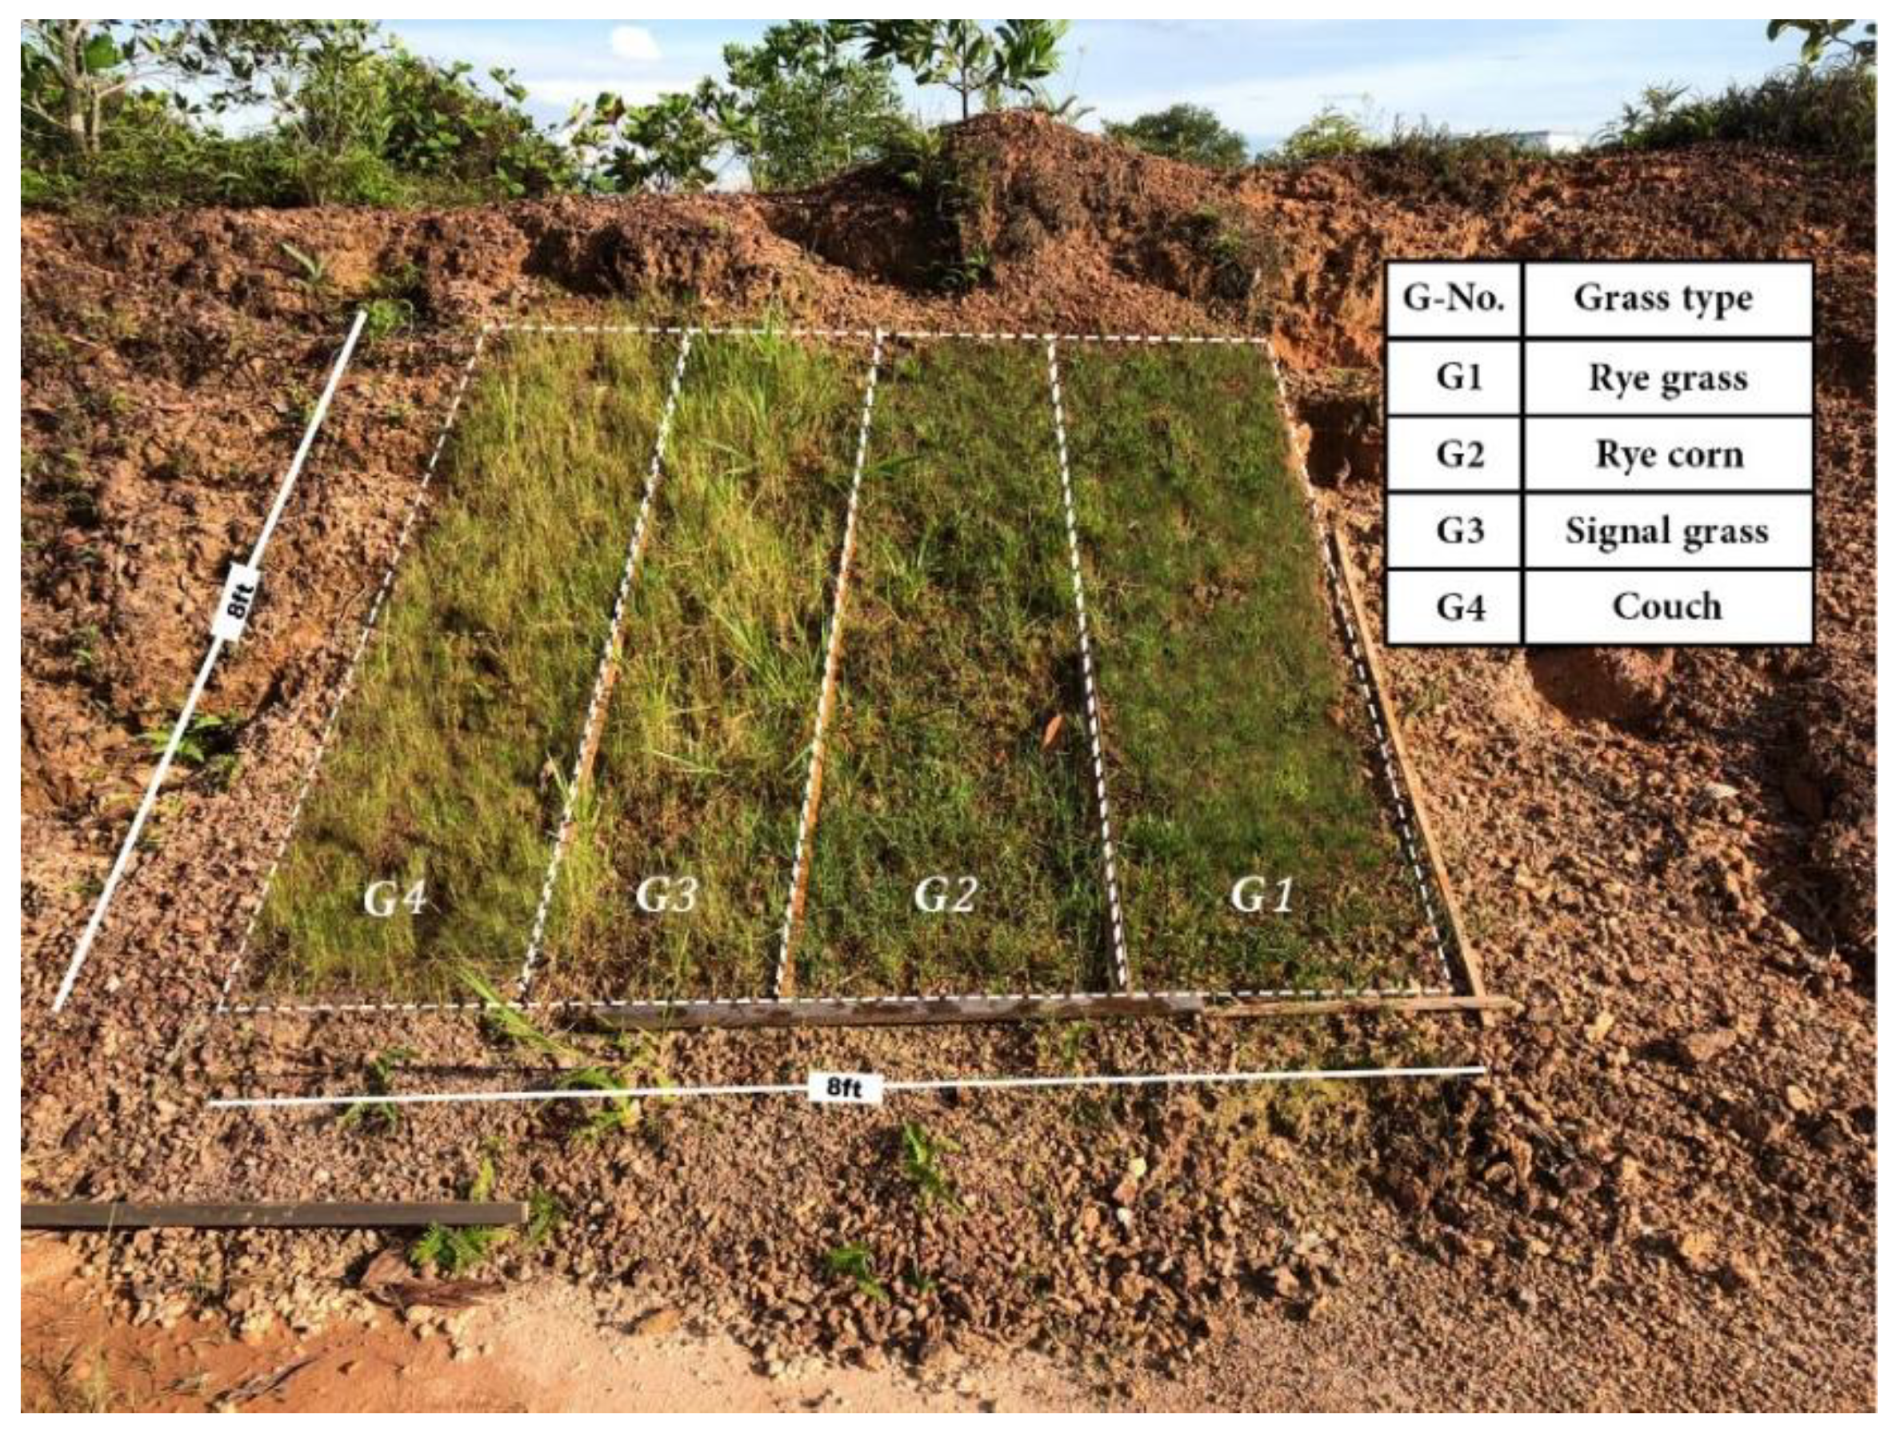
3.2. Field Experimental Design

We carried out the hydroseeding experiment on the 11 August 2020 within the study area on a terrain sloping at 65° with a total horizontal surface area of 304 cm and a total vertical area of 244 cm wide and divided into four equal parts of 61 cm each, as shown in Figure 3. The site was leveled and tilled with a rake to remove large soil particles. We studied the nature of the soil and climatic condition and did not modify the earth as this may alter the experiment results. Seed samples of 1 kg each were separately mixed with 500 g of fertilizer and 50 mL of seed germinator mixtures before the hydroseeding experiment. The mixtures were sprayed with an Ozito cordless hand spreader.

3.2.1. Vegetation Ground Cover

Vegetation ground cover has long been adequate, especially in reducing landslide and erosion on the roadside slopes [88]. Vegetation cover promotes infiltration and provides resistance to topsoil by stabilizing the soil structure and intercepting rainfall and runoff, thereby playing a vital role in soil and water conservation [89]. A related approach to stabilize disturbed slopes is by hydroseeding. In this research, we used the line-based method to measure the vegetation ground cover. Geometrically, it is a single-dimensional distance line measurement that measures the distance of the first contact to the last touch of the species. It also determines the percentage cover for each line then averages the lines together to estimate vegetation cover. The formula of the line-based method is as shown below.
% g r o u n d   c o v e r = T o t a l   d i s t a n c e   o f   s p e c i e   A D i s t a n c e   o f   a l l   s p e c i e   a l o n g   l i n e × 100  
When the vegetation ground cover is denser and complex, the surface is shielded from wind, and direct rainfall is intercepted and redirected by the canopy.

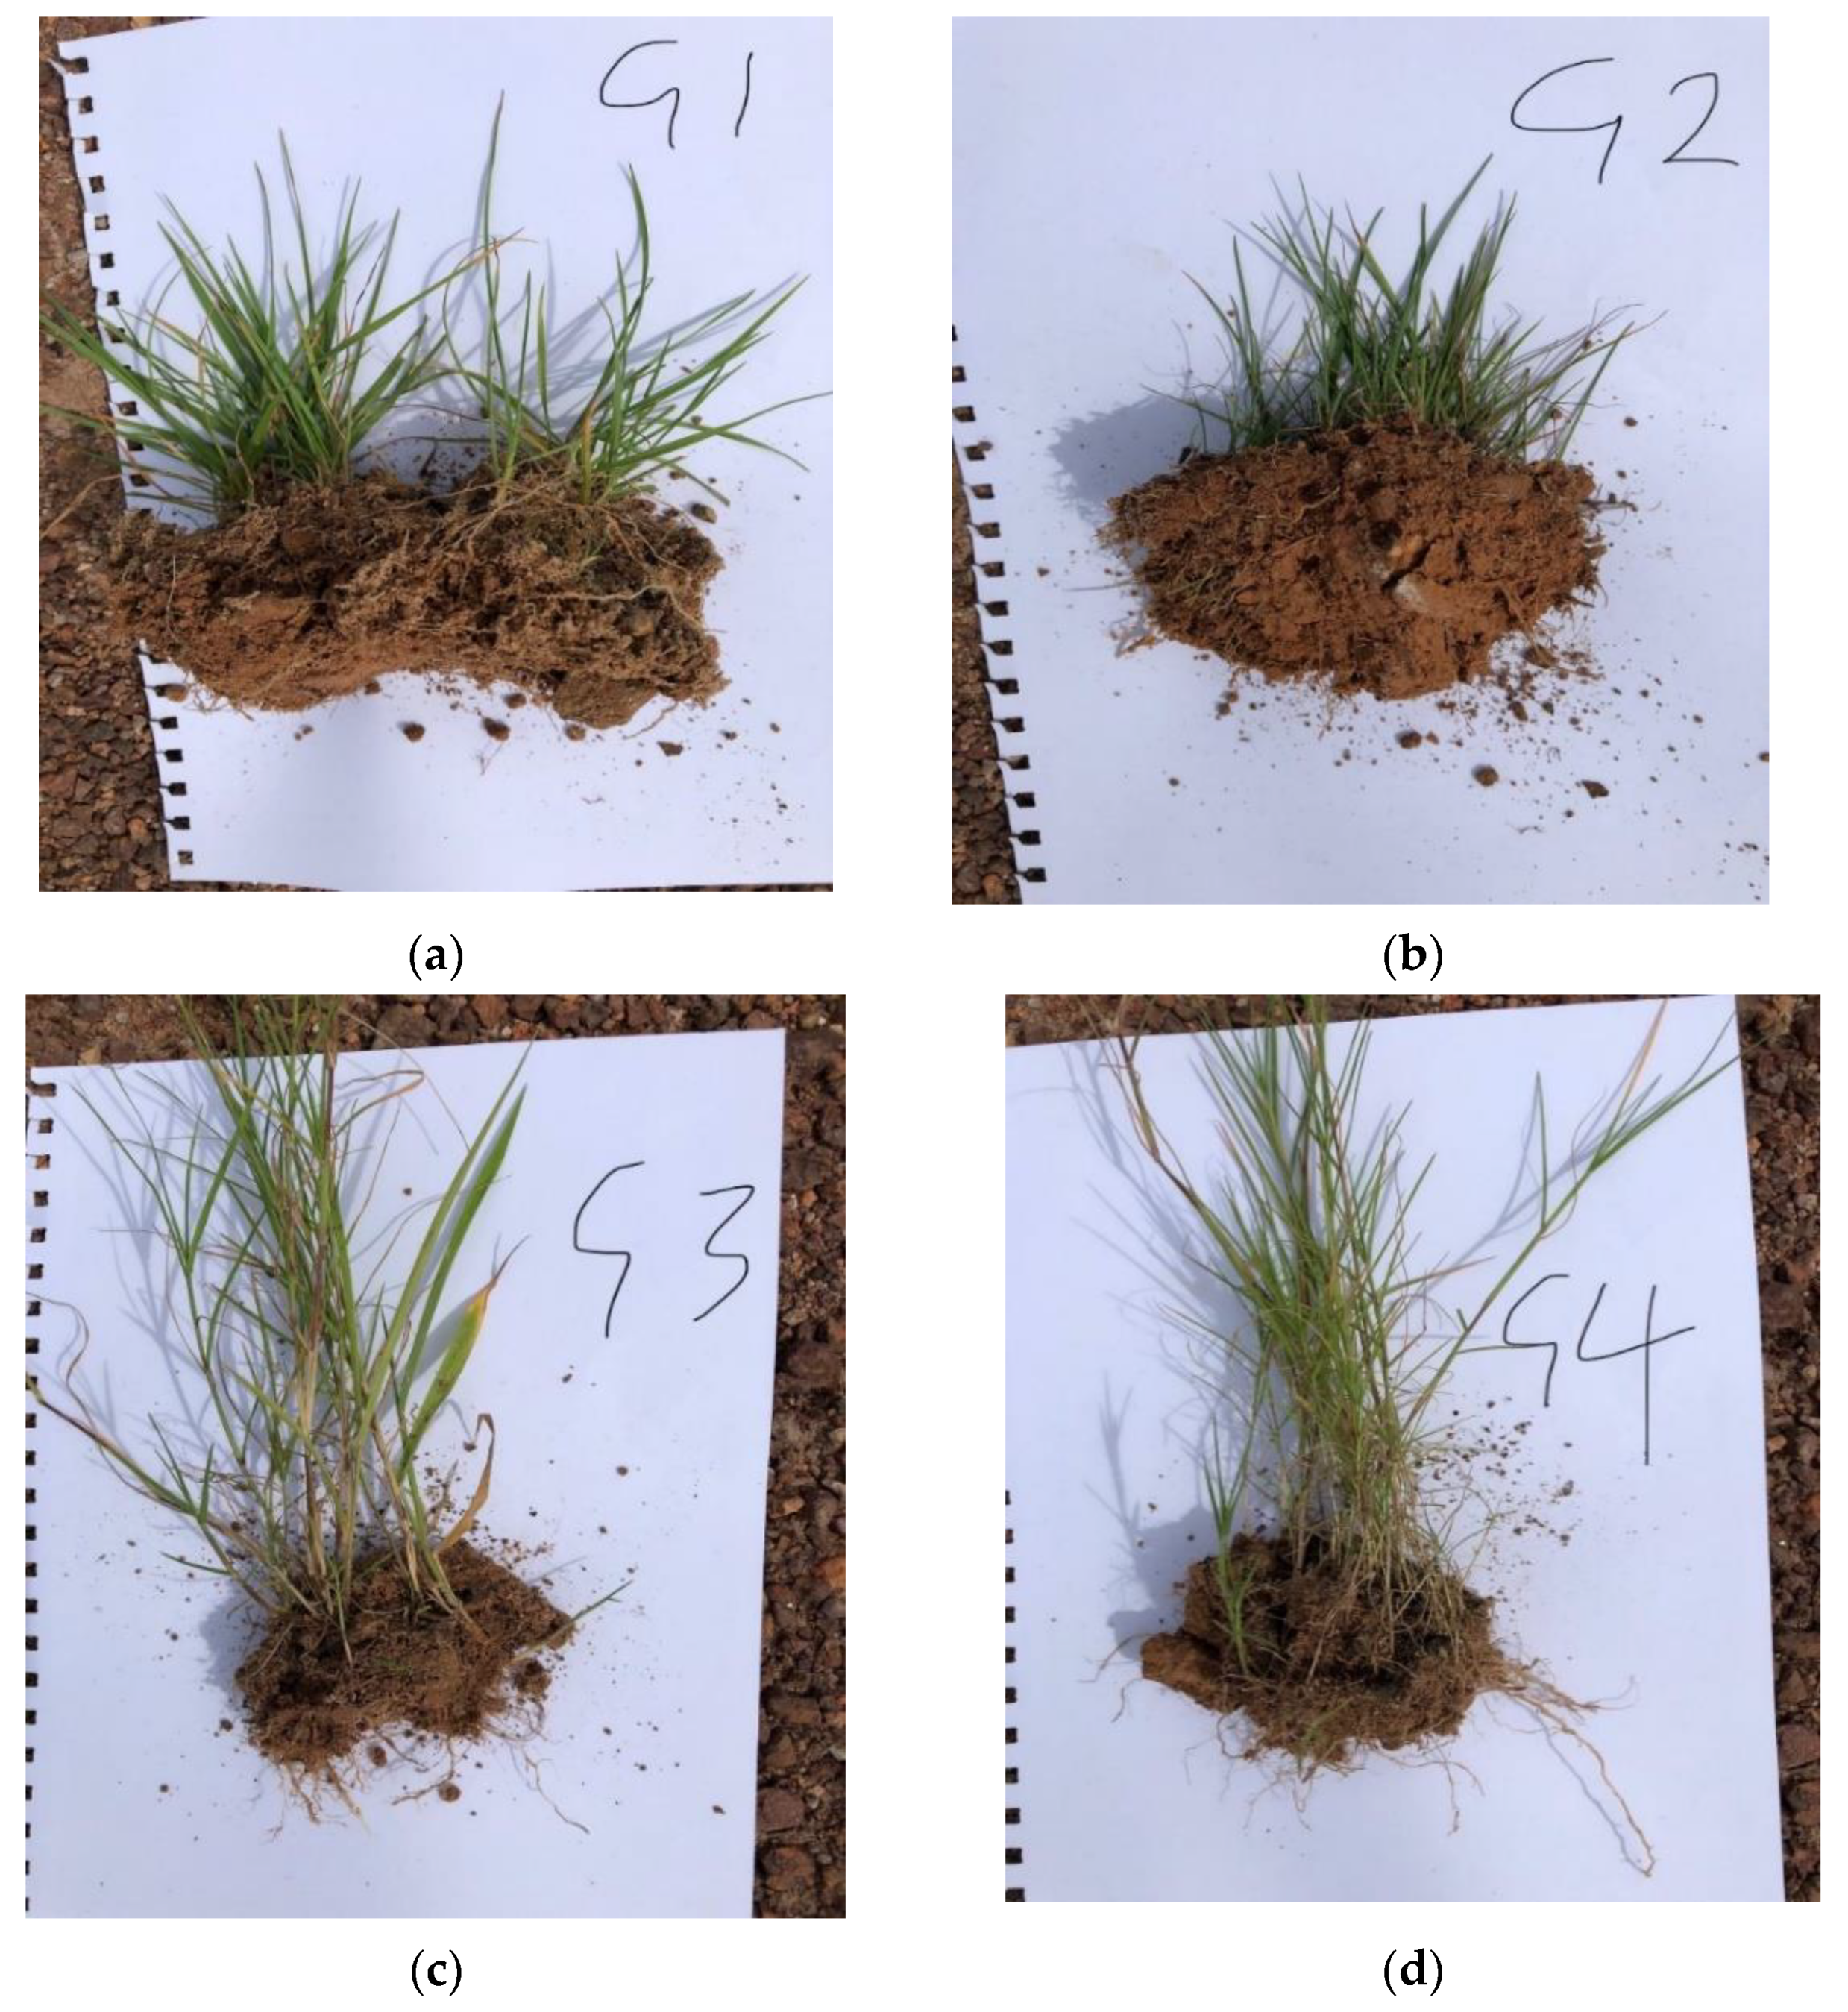
3.2.2. Vegetation Root

According to structural stability and vegetation ecology theory, if the root systems are more complicated and profound, the soil is more stable, and infiltration is higher [90]. Therefore, well-developed root systems can help reduce runoff by directing rainfall into groundwater storage more quickly, helping to reduce the slope strain and stabilizing the slope. The vegetation root architecture was determined using Yen’s [91] pull-out tests. Root samples from each of the four species were manually uprooted from the field, washed, and the root diameters were measured using a measuring tape.

3.2.3. Estimation of Surface Runoff

Rainfall surface runoff is an indicator for determining the water loss of a slope [92]. It occurs when the intensity of rainfall is greater than the intensity of infiltration, leading to the failure of excess water to infiltrate [93]. To determine the rainfall rate, surface runoff, rainfall duration, and rainfall intensity were recorded. The rainfall events were based on the following criteria: (i) Erosive rainfall with daily rainfall amount greater than 12 mm (ii) Similar rainfall intervals (iii) Rainfall duration of no less than 60 min. These factors proved to be effective in rainfall interception for surface runoff [94]. Duration is the extent of the rainfall, and intensity is the rate at which it rains, mathematically expressed by the height of the rainfall layer per minute (mm/min) [95]. Rainfall intensity is the ratio of the total rainfall amount in a given period to the duration of the period [96]. The present study focuses on the relationship among runoff, rainfall, soil type, vegetation, slope, with the primary focus of finding an effective means of reducing the rate of surface runoff, which will practically reduce the effect of landslides. Different methodologies exist for computing and estimating surface runoff [97]. However, this research applies the rational method to determine the surface runoff of the site experiment.

Rational Method

It is considered the most widely employed and easy-to-use practical method to estimate and determine the surface runoff of any specific rainfall. This method is used primarily on small scales. The rational approach is expressed mathematically as
Q = CIA
where C = coefficient of runoff (runoff volume/rainfall), A = area of the catchment, and I = intensity of the precipitation.
We made sizeable holes and installed plastic containers with rigid channels that channel water into the collection bottles at the bottom of each plot to measure runoff volume (Figure 4). The surface runoff volume of the plants was collected in this plastic container at the same rainfall intensity and duration during the rainfall events and transferred to a measuring cylinder to get the readings. The surface runoff volume of each vegetation was therefore determined by dividing volume by the period.
This experiment shows how vegetation characteristics such as the vegetation roots and vegetation ground cover reduce surface runoff. This experiment only considers surface runoff from September to December 2020. We collected four rainfall events for this study. These event dates were chosen based on a weather forecast predicting rainfall of >12 mm, which matched the experimental criteria. The daily rainfall data was obtained from the National Hydraulic Research Institute of Malaysia (NAHRIM).

4. Results

4.1. Landslide Susceptibility Assessment

The landslide susceptibility result using the AHP model includes the weights of the conditioning factors, class weights, and a CR [98]. Applying the AHP, a decision hierarchy was built through a pairwise comparison of each conditioning factor. The AHP prioritized the effective criteria and variables by using pairwise comparisons to create a matrix. Ratings of the parameters were provided on a 9-point scale. The values of 1/9 represent the least important, 1 represents equal importance, and 9 represents the most important. The degree of consistency used in developing the rating was also determined. Moreover, a procedure through which an index of consistency, known as a CR, was produced. The CR indicates the probability that the matrix judgments were generated randomly [99]. Spatial Analyst Tools ArcGIS 10.7 software was used to reclassify each cell of the final map into five categories and values assigned ranging from 1 to 5, representing very low to very high in the LSM. The landslide susceptibility map was classified into five classes using the natural break classifier. Figure 5 shows the LSM produced by AHP, which reveals 20.65% of very low, 20.18% low, 20.37% moderate, 19.45% high, and 19.35% very high susceptible areas.

Validation

The landslide susceptibility model was evaluated using the receiver operating characteristic curve (ROC curve), a non-dependent threshold approach. The ROC curve shows the validity of the diagnostic ability of a binary classifier system as its discrimination threshold [100]. The ROC curve is created by plotting the values of the true positive rate (TPR) against the values of the false-positive rate (FPR) at different threshold settings [101]. This curve validates the model’s accuracy regardless of the prediction model since it compares random landslide points and a separated dataset of landslides [102,103]. A synthetic index was calculated for the ROC, utilizing the area under the curve (AUC), which has generally been applied in past studies to evaluate the accuracy of the landslide susceptibility map. A higher AUC value indicates a higher accuracy of the susceptibility map [98]. The AUC value obtained from the AHP model revealed a 0.865 accuracy (Figure 6). Therefore, the results of the model indicate an accurate susceptibility map. A precise LSM model highly depends on conditional factors. It thus assists decision-makers, landscapers, and urban planners in identifying hazard-prone areas for early mitigation. After studying the nature and environmental conditions of the study area, a hydroseeding experiment was introduced and carried out on a high-risk slope within the study location to control and prevent potential landslides.

4.2. Experimental Observations, Monitoring, and the Result of Hydroseeding

In this study, we evaluated and recorded the germination performance of the four hydroseeded seed species. The main goal was to determine which of these seeds, currently used to hydroseed slopes in different parts of the world, is more effective in the study area. Moreover, the vegetation ground cover and the vegetation root were studied to test their effectiveness in controlling landslides (Figure 7).

4.2.1. Germination Rate

Before the experiment, we studied environmental factors such as rainfall and temperature. The surveys were conducted at the end of each month from August to December 2020. In each subplot, the species were identified and recorded. Couch (G4) seed germinated between the 2nd and 3rd day and showed an approximate 92% germination rate, followed by signal grass (G3) which grew on the 9th day with an 88% germination rate. The survey also recorded a delay in germination on both rye corn (G2) and ryegrass (G1), which germinated between day 15 and day 17, with 84% and 60% germination rates, respectively.

4.2.2. Vegetation Root Length

The vegetation root is the most crucial aspect of the plant for slope stabilization. Adequate subsurface drainage is essential to reduce the pore-water pressure of the subsoil. Over the past decades, several types of research have revealed significant roles played by plant roots to minimize the detachment rates of the soil as a result of concentrated flows and are therefore very effective in controlling landslides [104,105]. Vegetation roots support the slope drainage system and act as a scale preferential flow direction on the hillslope and drain the subsoil’s water content from unstable terrain. When vegetation root systems converge, or the subsurface flow ends abruptly in the slope, it may lead to a concentration of water pressure in a critical region of the hill, thereby leading to instability. Flow direction may occur, resulting in both positive and negative outcomes on slope stability. Practical and precise knowledge of the disposition of vegetation roots in the slope is necessary to get it right. In this study, the vegetation root architecture was determined using the pull-out tests introduced by Yen [91]. Root samples from each of the four species were uprooted from the field, washed, and the root length was measured using a measuring tape, and the values were recorded and plotted in Figure 8.
The root architecture of the four seed species in Figure 9a–d shows the typical distribution of the root system. It offers a general idea of how the roots developed and indicates the localization of deep-rooted and fibrous roots within the root system. Ryegrass has a fibrous root system with thick primary roots and thinner lateral branches and showed a poor result. The roots of ryegrass are usually arbuscular mycorrhizal. Flawed due to the environmental and climatic conditions, ryegrass, if under suitable conditions, may germinate faster than some other grass seeds. However, the roots spread slowly and grow naturally into clumps that spread their shoots vertically, called tillers. The shallow roots of ryegrass limit its tolerance for heat and drought. It adapts well to a wide variety of improved soil conditions, such as acidic and alkaline soils. It also thrives better under soil pH. Rye corn showed an extensive, fibrous root system that may expand.
On the other hand, signal grass showed a better root development in the soil with a deep taproot system that can effectively grow deeper on a wide range of soils and adapt to different environmental conditions. The experiment also reveals that the couch has the most extended root system, with a shallow taproot system that can spread, anchoring the shallower soil depth and around the subsoil. The experiment so far compared the effectiveness of the four seed plant roots in stabilizing the soil against possible landslides. However susceptible to incisive landslide occurrence, no research has been done to compare the effectiveness of these four plants in controlling landslides in this study location. Hence, this study introduced the landslide-reducing potential of these species with both fibrous and tap roots systems on the slope of the study area. The experimental results showed that plant roots with taproot systems were more adaptive and efficient in the soil type than the seed with a fibrous root system. According to [106], tap-rooted plant species penetrate more into thick soils than fibrous-rooted plant species. Therefore it is well adapted for use in landslide mitigation and control.
The different vegetation roots showed a significant variation regarding the site characteristics; with an increase in rainfall, the roots considerably showed their best tolerance following an increasing monthly pattern, with the highest length observed from G4 in December, followed by G3. Both G1 and G2, with a fibrous root system, also showed a significant monthly root development. The vegetation root was plotted using an origin software.

4.3. Result of the Hydroseeded Vegetation Ground Cover

Hydroseeded vegetation ground cover is the percentage of the ground surface covered by vegetation. It controls landslides by anchoring the soil against rainfall and other landslide causative factors. The plants were monitored, and the vegetation ground cover was recorded from August to December.
The species with the highest values was ryegrass (G1). It showed leaf spreading and creeping characteristics. From August to September 2020, the experimental result recorded 40% vegetation cover due to its prolonged germination rate. A significant 180% of coverage was recorded between November and December. Rye corn (G2) was second to ryegrass and reached 160% coverage between November and December. However, the values sharply increased from 60% to 120% between August and October 2020. Signal grass (G3) showed the lowest result with 40% to 80% between August and October and 95% between November and December. Moreover, couch (G4) gave values between 80% and 120% from August to October and remained unchanged until December with 140%.
Vegetation ground cover can help to prevent landslides by protecting the soil surface against the impact of rainfall and surface runoff. It also reduces runoff volume, increases surface roughness, and reduces sediment traps and transportation [105,107]. The result was plotted using the Origin software, as shown (Figure 10) below.
At the start of the monitoring period, August 2020, G1 and G3 showed the lowest vegetation cover while the vegetation cover reached 80% in G4. Between September and December, the vegetation covers of G1 significantly increased, topping other species and showing the best choice for control of surface landslide. Test G3 showed the least acceptable result with a 95% vegetation cover.

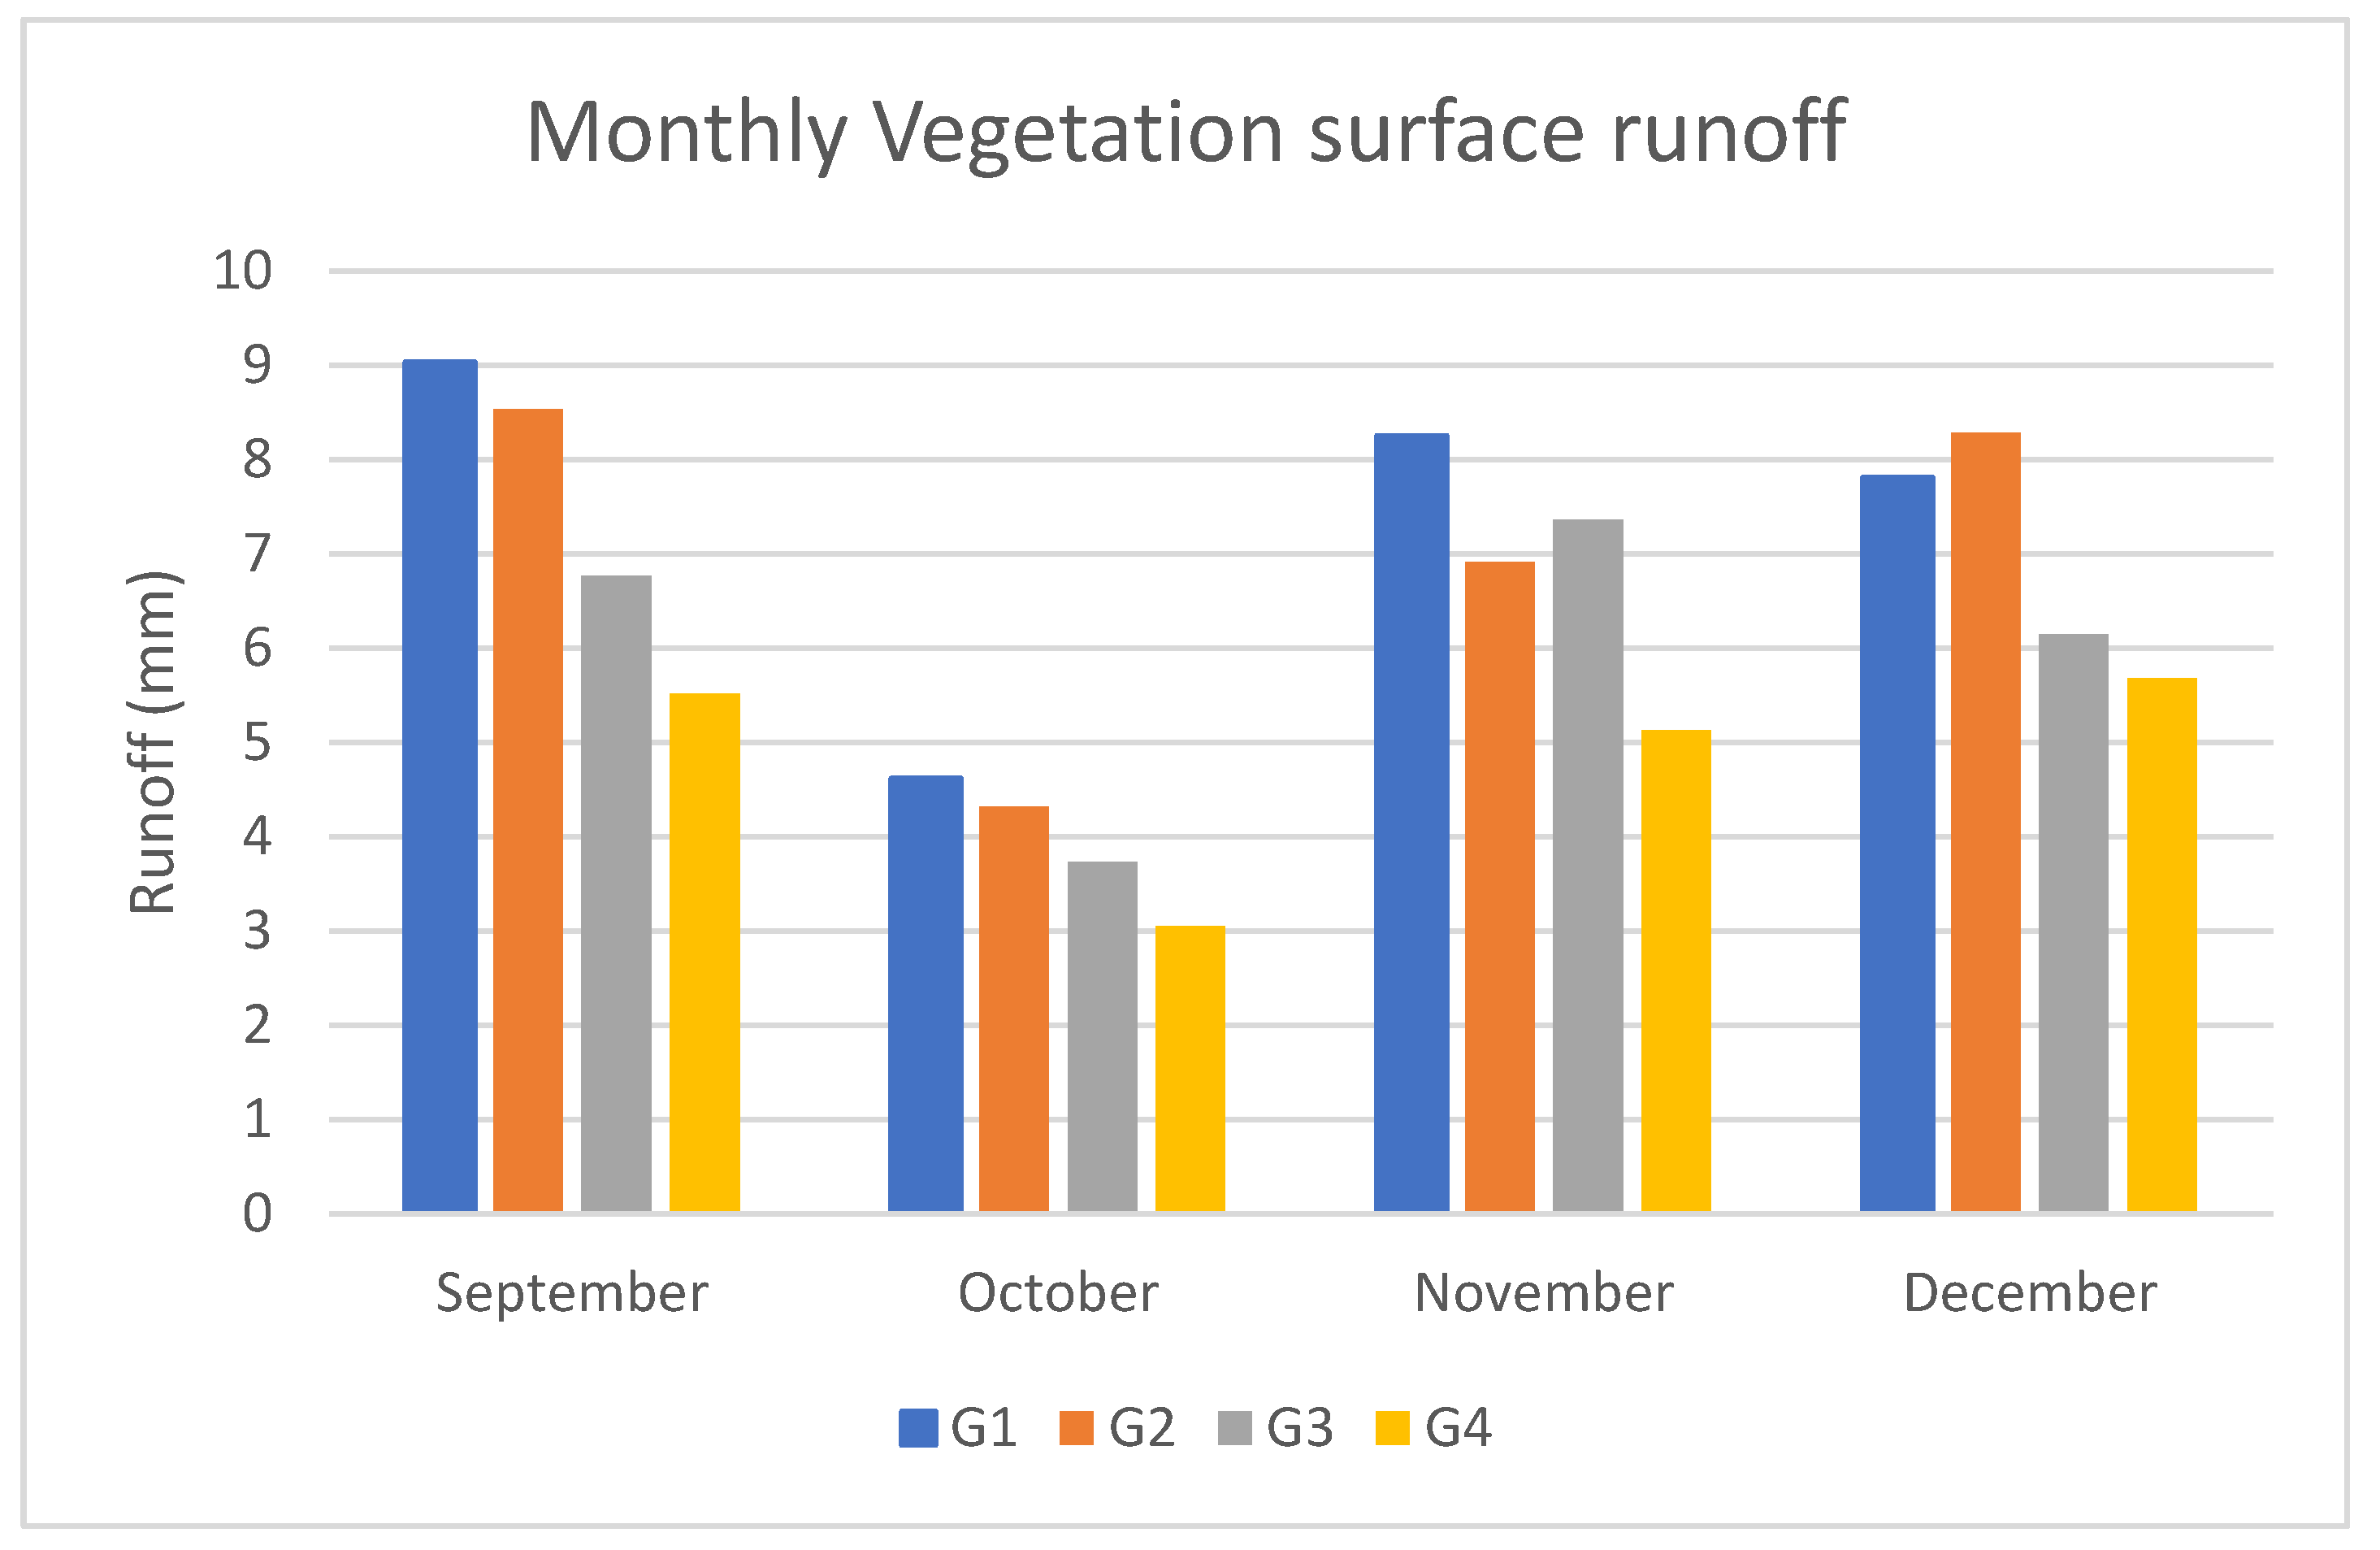
4.4. Vegetation Surface Runoff

The experiment focused on analyzing the overall influence of the vegetation root and vegetation ground cover to reduce surface runoff, reducing the effects of landslides on the study area. The four different vegetation species were subjected to rainfall intensities of 35 mm/h in September, 48 mm/h in October, 33 mm/h in November, and 34 mm/h in December on a Malacca and Serdang soil series sloping at 65°, as shown in Table 5 below. The area’s soil type is a mix of sandy, clay, and loam, collectively identified under the Serdang and Malacca series. In line with past literature, the runoff rate increased due to the percentage of vegetation ground cover and vegetation root characteristics [108].
The results show that G2 has the highest surface runoff rate followed by the G1 plot, then G3, with G4 having the least runoff amount under different rainfall intensities. The surface vegetation runoff of the vegetation is shown in Figure 11 below.
It shows that the runoff rate changes due to their vegetation characteristics under the same rainfall intensity. One can observe from Figure 11 that the amount of surface runoff in the G1 and G2 plots was significantly higher than the G3 and G4 plots under the same rainfall intensity.
The average surface runoff of G4 is 4.85 mm, while G3 comes behind with an average surface runoff value of 5.89 m3. G2 and G1 also have surface runoff values of 7.01 mm and 7.43 mm, respectively. Couch vegetation offers the most acceptable landslide control benefits to signal grass, rye corn, and ryegrass vegetation. The findings suggest that the selection of couch species over other species is justified based on landslide control benefits.

5. Discussion

The AHP method was applied in this study to identify, correlate, weigh, and rank different landslide parameters that determine slope susceptibility. Using the systematic analysis of a pairwise comparison matrix of a list of the conditioning factors by expert’s opinion scores between one and nine indicates the relative importance that was used. The susceptibility map helped determine high-risk, landslide susceptible areas for the mitigation process. The output map of the landslide susceptibility model was evaluated qualitatively, which is essential in selecting the most suitable site to carry out the landslide mitigation experiment. Applying the AHP approach, very low susceptibility areas were 20.65%, 20.18% low, 20.37% moderate, 19.45% high, and 19.35% very highly susceptible areas.
From the AHP susceptibility map, a hydroseeding experiment was carried out on the high-risk visibly sliding slope, with the result revealing that hydroseeding has great potential on degraded terrains in a similar environment. Results also showed that the grasses thrived more during rainfall season than dry season with daily watering. The results of the vegetation root system appear to show that vegetation has the best potential for long-term slope stabilization. Comparing the development of this study with other researchers that successfully carried out a similar experiment in a laboratory using rainfall simulations, the experimental results are very similar with natural precipitation and daily watering. Improved knowledge on this research is equally expected to support and enhance the selection of hydroseeding components and improve the soil nutrient and native species in future restoration projects.
Several authors have argued that climatic conditions and soil types are the main factors limiting the vegetation reinforcement of soil, especially in semiarid environments, resulting in low vegetation cover and distorted roots [109]. Hence, this experiment went through rainy and dry seasons and different soil types to prove the effectiveness of the selected seed with good results.
According to Garcia-Palacios et al. [110], vegetation covering more than 50% of semiarid terrain requires no further mitigation to prevent landslide or soil erosion. In this research, the vegetation ground cover for ryegrass and signal grass was less than 50% in August. Ryegrass was also less than 40% in September, with both plants maintaining soil stability. Risse et al. [111] noted that the rate of soil loss was about 10 to 20 times higher in construction sites than in agricultural lands. Moreover, Wang et al. [112] stated that several studies have revealed that soil properties such as moisture content and nutrients could affect their root morphology as vegetation matures. Thus, in our experiment, the vegetation root system increased with time, though evidence of nutrient loss could be seen from the plant leaves.

6. Conclusions

After studying the nature and environmental conditions of the study area, a hydroseeding experiment was introduced and carried out on the high-risk, steep slope within the study location to control and prevent potential landslides. Four seed samples were separately hydroseeded, and their success rate was compared in relation to the soil condition of the study area. The vegetation was tested under four different rainfall intensities. The result showed that couch (G4) has the least average surface runoff of 4.85 mm. It also has the fastest estimated germination rate of 92% in 3 days and showed densely populated, strong stemmed vegetation cover, with a tall height and a deep, long shallow taproot system. It showed the most reliable and most effective for landslide control in the study area, followed by G3 with a value of 5.89 mm, and an estimated 88% germination rate on day nine, with thick, stemmed solid vegetation ground cover and also has the tallest vegetation height, as well as a deep-rooted taproot system. G2 has an average surface runoff of 7.01 mm with an estimated 84% germination rate on day fifteen, with creeping and sparsely populated vegetation cover, short vegetation height, and an extensive fibrous root system. More so, G1, with the highest average runoff value of 7.43 mm, germinated on day 17, with an estimated 92% germination rate. It showed similar results and characteristics to G2 with a creeping and sparsely distributed vegetation cover and short vegetation height with fibrous, thick, and thinner lateral root branches. Based on the results of this investigation, couch vegetation offers the best landslide control benefits to that of signal grass, rye corn, and ryegrass vegetation. The findings suggest that the selection of the couch species over other species is justified based on landslide control benefits.
Further studies are recommended to use different satellite sensors for landslides susceptibility mapping of the study area. Moreover, other types of slope seeds should be experimented with. Ryegrass and rye corn developed poorly under the soil and climatic condition of this study area. They could also thrive well under improved soil and favorable climate conditions.

Author Contributions

O.J.E. performed the experiments and data acquisition; O.J.E. wrote the manuscript, discussion, and analyzed the data. H.N. and Z.K. supervised; B.K. and O.S.S. edited, restructured, and optimized the manuscript professionally. All authors have read and agreed to the published version of the manuscript.

Funding

The research is supported by the Universiti Putra Malaysia.

Institutional Review Board Statement

Not applicable.

Informed Consent Statement

Not applicable.

Data Availability Statement

Available on request.

Acknowledgments

The authors would like to thank the Universiti Putra Malaysia for providing all facilities during this research. We are also thankful to RIKEN Center for Advanced Intelligence Project, Japan.

Conflicts of Interest

The authors declare no conflict of interest.

References

  1. Al-Najjar, H.A.H.A.; Pradhan, B.; Kalantar, B.; Sameen, M.I.; Santosh, M.; Alamri, A. Landslide Susceptibility Modeling: An Integrated Novel Method Based on Machine Learning Feature Transformation. Remote Sens. 2021, 13, 3281. [Google Scholar] [CrossRef]
  2. Kalantar, B.; Ueda, N.; Al-Najjar, H.A.H.; Idrees, M.O.; Motevalli, A.; Pradhan, B. Landslide susceptibility mapping at Dodangeh watershed, Iran using LR and ANN models in GIS. In Proceedings of the SPIE Remote Sensing, Berlin, Germany, 10–13 September 2018; Volume 10790. [Google Scholar]
  3. Al-Najjar, H.A.H.; Pradhan, B. Spatial landslide susceptibility assessment using machine learning techniques assisted by additional data created with generative adversarial networks. Geosci. Front. 2021, 12, 625–637. [Google Scholar] [CrossRef]
  4. Kalantar, B.; Ueda, N.; Al-Najjar, H.A.H.; Saeidi, V.; Gibril, M.B.A.; Halin, A.A. A comparison between three conditioning factors dataset for landslide prediction in the sajadrood catchment of iran. ISPRS Ann. Photogramm. Remote Sens. Spat. Inf. Sci. 2020, 5, 625–632. [Google Scholar] [CrossRef]
  5. Al-Najjar, H.A.H.; Kalantar, B.; Pradhan, B.; Saeidi, V. Conditioning factor determination for mapping and prediction of landslide susceptibility using machine learning algorithms. In Proceedings of the SPIE 11156 Earth Resources Environmental Remote Sensing/GIS Appllications X, Strasbourg, France, 10–12 September 2019; Volume 19. [Google Scholar] [CrossRef]
  6. Kalantar, B.; Ueda, N.; Lay, U.S.; Al-Najjar, H.A.H.; Halin, A.A. Conditioning factors determination for landslide susceptibility mapping using support vector machine learning. In Proceedings of the IGARSS 2019-2019 IEEE International Geoscience and Remote Sensing Symposium, Yokohama, Japan, 28 July–2 August 2019; pp. 9626–9629. [Google Scholar]
  7. Kalantar, B.; Ueda, N.; Saeidi, V.; Ahmadi, K.; Halin, A.A.; Shabani, F. Landslide susceptibility mapping: Machine and ensemble learning based on remote sensing big data. Remote Sens. 2020, 12, 1737. [Google Scholar] [CrossRef]
  8. Psomiadis, E.; Papazachariou, A.; Soulis, K.X.; Alexiou, D.S.; Charalampopoulos, I. Landslide mapping and susceptibility assessment using geospatial analysis and earth observation data. Land 2020, 9, 133. [Google Scholar] [CrossRef]
  9. Osiński, P.; Rickson, R.J.; Hann, M.J.; Koda, E. Assessment of slope stability influenced by vegetation cover and additional loads applied. Ann. Warsaw Univ. Life Sci. Land Reclam. 2018, 46, 81–91. [Google Scholar] [CrossRef]
  10. Eugeniusz, K.; Piotr, O. Improvement of Slope Stability as a Result combining diverse reinforcement methods. Architectura 2012, 11, 3–14. [Google Scholar]
  11. Wang, S.; Zhao, M.; Meng, X.; Chen, G.; Zeng, R.; Yang, Q.; Liu, Y.; Wang, B. Evaluation of the effects of forest on slope stability and its implications for forest management: A case study of Bailong River Basin, China. Sustainability 2020, 12, 6655. [Google Scholar] [CrossRef]
  12. Ali, N.; Farshchi, I.; Mu’azu, M.A.; Rees, S.W. Soil-root interaction and effects on slope stability analysis. Electron. J. Geotech. Eng. 2012, 17C, 319–328. [Google Scholar]
  13. Popescu, M. A suggested method for reporting landslide remedial measures. Bull. Eng. Geol. Environ. 2001, 60, 69–74. [Google Scholar] [CrossRef]
  14. Hutchinson, J.N. Some Aspect of morphological and Geotechnical parameters of Landslides, with examples drwan from Italy and elsewhere. Geol. Romana 1994, 30, 5–13. [Google Scholar]
  15. Popescu, M.E.; Sasahara, K. Engineering Measures for Landslide Disaster Mitigation BT. In Landslides—Disaster Risk Reduction; Sassa, K., Canuti, P., Eds.; Springer: Berlin/Heidelberg, Germany, 2009; pp. 609–631. ISBN 978-3-540-69970-5. [Google Scholar]
  16. Bakri, N.N.O.; Mydin, M.A.O. General Building Defects: Causes, Symptoms and Remedial Work. Eur. J. Technol. Des. 2014, 3, 4–17. [Google Scholar] [CrossRef]
  17. Choi, K.Y.; Cheung, R.W.M. Landslide disaster prevention and mitigation through works in Hong Kong. J. Rock Mech. Geotech. Eng. 2013, 5, 354–365. [Google Scholar] [CrossRef] [Green Version]
  18. Sun, J.; Liu, Q.; Li, J.; An, Y. Effects of rainfall infiltration on deep slope failure. Sci. China Ser. G Phys. Mech. Astron. 2009, 52, 108–114. [Google Scholar] [CrossRef]
  19. Nelson, M.; Saftner, D.; Carranza-Torres, C. Slope Stabilization for Local Government Engineers in Minnesota. In Proceedings of the Congress on Technical Advancement 2017: Construction and Forensic Engineering, Duluth, Minnesota, 10–13 September 2017; pp. 127–138. [Google Scholar] [CrossRef] [Green Version]
  20. Lacasse, S.; Nadim, F.; Kalsnes, B. Living with landslide risk. Geotech. Eng. J. SEAGS AGSSEA 2010, 41, 4–14. [Google Scholar]
  21. Noroozi, A.G.; Hajiannia, A. The Effects of Various Factors on Slope Stability. Int. J. Sci. Eng. Investig. 2015, 4, 44–48. [Google Scholar]
  22. Pham, B.T.; Tien Bui, D.; Pourghasemi, H.R.; Indra, P.; Dholakia, M.B. Landslide susceptibility assesssment in the Uttarakhand area (India) using GIS: A comparison study of prediction capability of naïve bayes, multilayer perceptron neural networks, and functional trees methods. Theor. Appl. Climatol. 2017, 128, 255–273. [Google Scholar] [CrossRef]
  23. Althuwaynee, O.F.; Pradhan, B. Semi-quantitative landslide risk assessment using GIS-based exposure analysis in Kuala Lumpur City. Geomat. Nat. Hazards Risk 2017, 8, 706–732. [Google Scholar] [CrossRef] [Green Version]
  24. Lacerda, W.; Ehrlich, M.; Fontoura, S.; Sayão, A.; Van Westen, C. Geo-Information tools for landslide risk assessment: An overview of recent developments. Landslides Eval. Stab. Terrain Eval. Stabilisation Set 2 Vol. 2004, 39–56. [Google Scholar] [CrossRef]
  25. Rasyid, A.R.; Bhandary, N.P.; Yatabe, R. Performance of frequency ratio and logistic regression model in creating GIS based landslides susceptibility map at Lompobattang Mountain, Indonesia. Geoenviron. Disasters 2016, 3, 19. [Google Scholar] [CrossRef] [Green Version]
  26. Javad, M.; Baharin, A.; Barat, M.; Farshid, S. Using frequency ratio method for spatial landslide prediction. Res. J. Appl. Sci. Eng. Technol. 2014, 7, 3174–3180. [Google Scholar] [CrossRef]
  27. Wubalem, A. Landslide Susceptibility Mapping Using Statistical Methods in Uatzau Catchment Area, Northwestern Ethiopia. Geoenviron. Disasters 2020, 8, 1. [Google Scholar] [CrossRef]
  28. Ciurleo, M.; Cascini, L.; Calvello, M. A comparison of statistical and deterministic methods for shallow landslide susceptibility zoning in clayey soils. Eng. Geol. 2017, 223, 71–81. [Google Scholar] [CrossRef]
  29. Gordo, C.; Zêzere, J.L.; Marques, R. Landslide susceptibility assessment at the basin scale for rainfall- and earthquake-triggered shallow slides. Geosciences 2019, 9, 268. [Google Scholar] [CrossRef] [Green Version]
  30. Rahman, M.S.; Ahmed, B.; Di, L. Landslide initiation and runout susceptibility modeling in the context of hill cutting and rapid urbanization: A combined approach of weights of evidence and spatial multi-criteria. J. Mt. Sci. 2017, 14, 1919–1937. [Google Scholar] [CrossRef]
  31. Elmoulat, M.; Brahim, L.A. Landslides susceptibility mapping using GIS and weights of evidence model in Tetouan-ras-Mazari area (Northern Morocco). Geomat. Nat. Hazards Risk 2018, 9, 1306–1325. [Google Scholar] [CrossRef] [Green Version]
  32. Thiery, Y.; Malet, J.P.; Sterlacchini, S.; Puissant, A.; Maquaire, O. Landslide susceptibility assessment by bivariate methods at large scales: Application to a complex mountainous environment. Geomorphology 2007, 92, 38–59. [Google Scholar] [CrossRef] [Green Version]
  33. Ghosh, S.; Das, R.; Goswami, B. Developing GIS-based techniques for application of knowledge and data-driven methods of landslide susceptibility mapping. Indian J. Geosci. 2013, 67, 249–272. [Google Scholar]
  34. Maalouf, M. Logistic regression in data analysis: An overview. Int. J. Data Anal. Tech. Strateg. 2011, 3, 281–299. [Google Scholar] [CrossRef]
  35. Qiao, G.; Lu, P.; Scaioni, M.; Xu, S.; Tong, X.; Feng, T.; Wu, H.; Chen, W.; Tian, Y.; Wang, W.; et al. Landslide investigation with remote sensing and sensor network: From susceptibility mapping and scaled-down simulation towards in situ sensor network design. Remote Sens. 2013, 5, 4319–4346. [Google Scholar] [CrossRef] [Green Version]
  36. Polykretis, C.; Ferentinou, M.; Chalkias, C. A comparative study of landslide susceptibility mapping using landslide susceptibility index and artificial neural networks in the Krios River and Krathis River catchments (northern Peloponnesus, Greece). Bull. Eng. Geol. Environ. 2014, 74, 27–45. [Google Scholar] [CrossRef]
  37. Vakhshoori, V.; Pourghasemi, H.R.; Zare, M.; Blaschke, T. Landslide susceptibility mapping using GIS-based data mining algorithms. Water 2019, 11, 2292. [Google Scholar] [CrossRef] [Green Version]
  38. Ramachandra, T.V.; Aithal, B.H.; Kumar, U.; Joshi, N.V. Prediction of shallow landslide prone regions in undulating terrains. Disaster Adv. 2013, 6, 54–64. [Google Scholar]
  39. Al-Najjar, H.A.H.; Kalantar, B.; Pradhan, B.; Saeidi, V.; Halin, A.A.; Ueda, N.; Mansor, S. Land cover classification from fused DSM and UAV images using convolutional neural networks. Remote Sens. 2019, 11, 1461. [Google Scholar] [CrossRef] [Green Version]
  40. Kalantar, B.; Ueda, N.; Saeidi, V.; Janizadeh, S.; Shabani, F. Deep Neural Network Utilizing Remote Sensing Datasets for Flood Hazard Susceptibility Mapping in Brisbane, Australia. Remote Sens. 2021, 13, 2638. [Google Scholar] [CrossRef]
  41. Shahabi, H.; Hashim, M. Landslide susceptibility mapping using GIS-based statistical models and Remote sensing data in tropical environment. Sci. Rep. 2015, 5, 9899. [Google Scholar] [CrossRef] [Green Version]
  42. Nefeslioglu, H.A.; Sezer, E.; Gokceoglu, C.; Bozkir, A.S.; Duman, T.Y. Assessment of Landslide Susceptibility by Decision Trees in the Metropolitan Area of Istanbul, Turkey. Math. Probl. Eng. 2010, 2010, 901095. [Google Scholar] [CrossRef] [Green Version]
  43. Sarker, I.H. Machine Learning: Algorithms, Real-World Applications and Research Directions. SN Comput. Sci. 2021, 2, 160. [Google Scholar] [CrossRef]
  44. Tharwat, A. Classification error: Bias and variance, Underfitting and Overfitting. Mach. Learn. Present. 2018. [Google Scholar] [CrossRef]
  45. Cao, Q.; Banerjee, R.; Gupta, S.; Li, J.; Zhou, W.; Jeyachandra, B. Data Driven Production Forecasting Using Machine Learning. In Proceedings of the SPE Argentina Exploration and Production of Unconventional Resources Symposium, Buenos Aires, Argentina, 1–3 June 2016. [Google Scholar]
  46. Abdar, M.; Pourpanah, F.; Hussain, S.; Rezazadegan, D.; Liu, L.; Ghavamzadeh, M.; Fieguth, P.; Cao, X.; Khosravi, A.; Acharya, U.R.; et al. A review of uncertainty quantification in deep learning: Techniques, applications and challenges. Inf. Fusion 2021, 76, 243–297. [Google Scholar] [CrossRef]
  47. Blundell, C.; Cornebise, J.; Kavukcuoglu, K.; Wierstra, D. Weight uncertainty in neural networks. In Proceedings of the 32nd International Conference on Machine Learning, Lille, France, 6–11 July 2015; Volume 2, pp. 1613–1622. [Google Scholar]
  48. Feizizadeh, B.; Jankowski, P.; Blaschke, T. A Spatially Explicit Approach for Sensitivity and Uncertainty Analysis of GIS-Multicriteria Landslide Susceptibility Mapping; Verlag der Österreichischen Akademie der Wissenschaften: Vienna, Austria, 2013; pp. 157–164. [Google Scholar] [CrossRef] [Green Version]
  49. Han, B.; Yao, Q.; Yu, X.; Niu, G.; Xu, M.; Hu, W.; Tsang, I.W.; Sugiyama, M. Co-teaching: Robust training of deep neural networks with extremely noisy labels. Adv. Neural Inf. Process. Syst. 2018, 2018, 8527–8537. [Google Scholar]
  50. Adnan, M.S.G.; Rahman, M.S.; Ahmed, N.; Ahmed, B.; Rabbi, M.F.; Rahman, R.M. Improving spatial agreement in machine learning-based landslide susceptibility mapping. Remote Sens. 2020, 12, 3347. [Google Scholar] [CrossRef]
  51. Ait Brahim, L.; Bousta, M.; Jemmah, I.A.; El Hamdouni, I.; ElMahsani, A.; Abdelouafi, A.; Sossey alaoui, F.; Lallout, I. Landslide susceptibility mapping using AHP method and GIS in the peninsula of Tangier (Rif-northern morocco). In Proceedings of the MATEC Web Conference, Rabat, Morocco, 22–25 November 2017; Volume 149, p. 02084. [Google Scholar] [CrossRef]
  52. Moradi, M.; Bazyar, M.H.; Mohammadi, Z. GIS-based landslide susceptibility mapping by AHP method, a case study, Dena City, Iran. J. Basic Appl. Sci. Res. 2012, 2, 6715–6723. [Google Scholar]
  53. Nguyen, T.T.N.; Liu, C.C. A new approach using AHP to generate landslide susceptibility maps in the chen-yu-lan watershed, Taiwan. Sensors 2019, 19, 505. [Google Scholar] [CrossRef] [Green Version]
  54. Chou, J.R. A weighted linear combination ranking technique for multi-criteria decision analysis. S. Afr. J. Econ. Manag. Sci. 2013, 16, 28–41. [Google Scholar]
  55. Malczewski, J. On the use of weighted linear combination method in GIS: Common and best practice approaches. Trans. GIS 2000, 4, 5–22. [Google Scholar] [CrossRef]
  56. Syst, H.E.; Attribute, C.C. Interactive comment on “A Novel Strategy for landslide displacement and its direction monitoring” by Z.-W. Zhu et al. Nat. Hazards Earth Syst. Sci. Discuss. 2014, 1, C2961–C2962. [Google Scholar]
  57. Stanley, T.; Kirschbaum, D.B. A heuristic approach to global landslide susceptibility mapping. Nat. Hazards 2017, 87, 145–164. [Google Scholar] [CrossRef] [PubMed] [Green Version]
  58. Sun, D.; Xu, J.; Wen, H.; Wang, Y. An Optimized Random Forest Model and Its Generalization Ability in Landslide Susceptibility Mapping: Application in Two Areas of Three Gorges Reservoir, China. J. Earth Sci. 2020, 31, 1068–1086. [Google Scholar] [CrossRef]
  59. Feizizadeh, B.; Shadman Roodposhti, M.; Jankowski, P.; Blaschke, T. A GIS-based extended fuzzy multi-criteria evaluation for landslide susceptibility mapping. Comput. Geosci. 2014, 73, 208–221. [Google Scholar] [CrossRef] [Green Version]
  60. Loucks, D.P.; van Beek, E. System Sensitivity and Uncertainty Analysis. In Water Resource Systems Planning and Management; Springer: Cham, Switzerland, 2017. [Google Scholar] [CrossRef] [Green Version]
  61. Ghorbanzadeh, O.; Feizizadeh, B.; Blaschke, T. Multi-criteria risk evaluation by integrating an analytical network process approach into GIS-based sensitivity and uncertainty analyses. Geomat. Nat. Hazards Risk 2018, 9, 127–151. [Google Scholar] [CrossRef] [Green Version]
  62. Ghosh, S. Knowledge Guided Empirical Prediction of Landslide Hazard; ITC: Enschede, The Netherlands, 2011; ISBN 9789061643104. [Google Scholar]
  63. Norton, J. An introduction to sensitivity assessment of simulation models. Environ. Model. Softw. 2015, 69, 166–174. [Google Scholar] [CrossRef]
  64. Guzzetti, F.; Reichenbach, P.; Ardizzone, F.; Cardinali, M.; Galli, M. Estimating the quality of landslide susceptibility models. Geomorphology 2006, 81, 166–184. [Google Scholar] [CrossRef]
  65. Sterlacchini, S.; Ballabio, C.; Blahut, J.; Masetti, M.; Sorichetta, A. Spatial agreement of predicted patterns in landslide susceptibility maps. Geomorphology 2011, 125, 51–61. [Google Scholar] [CrossRef]
  66. Noorollahi, Y. Landslide modelling and susceptibility mapping using AHP and fuzzy approaches. Int. J. Hydrol. 2018, 2, 137–148. [Google Scholar] [CrossRef]
  67. Grozavu, A.; Patriche, C.; Mihai, F. Application of ahp method for mapping slope geomorphic phenomena. Int. Multidiscip. Sci. GeoConference Surv. Geol. Min. Ecol. Manag. SGEM 2017, 17, 377–384. [Google Scholar] [CrossRef]
  68. He, H.; Hu, D.; Sun, Q.; Zhu, L.; Liu, Y. A landslide susceptibility assessment method based on GIS technology and an AHP-weighted information content method: A case study of southern Anhui, China. ISPRS Int. J. Geo-Inf. 2019, 8, 266. [Google Scholar] [CrossRef] [Green Version]
  69. Parsakhoo, A.; Jajouzadeh, M.; Motlagh, A.R. Effect of hydroseeding on grass yield and water use efficiency on forest road artificial soil slopes. J. For. Sci. 2018, 64, 157–163. [Google Scholar] [CrossRef] [Green Version]
  70. Vallone, M.; Pipitone, F.; Alleri, M.; Febo, P.; Catania, P. Hydroseeding application on degraded slopes in the southern Mediterranean area (Sicily). Appl. Eng. Agric. 2013, 29, 309–319. [Google Scholar] [CrossRef] [Green Version]
  71. Drake, D. Assessment of Hydroplanting Techniques and Herbicide. Master’s Thesis, University of Hawai’i System, Honolulu, HI, USA, 2009. [Google Scholar]
  72. Stokes, A.; Douglas, G.B.; Fourcaud, T.; Giadrossich, F.; Gillies, C.; Hubble, T.; Kim, J.H.; Loades, K.W.; Mao, Z.; Mcivor, I.R.; et al. Ecological mitigation of hillslope instability: Ten key issues facing researchers and practitioners. Plant Soil 2014, 377, 1–23. [Google Scholar] [CrossRef] [Green Version]
  73. Kumarasinghe, U. A review on new technologies in soil erosion management. J. Res. Technol. Eng. 2021, 2, 120–127. [Google Scholar]
  74. Cereno, M.M.; Tan, F.J.; Uy, F.A.A. Combined Hydroseeding and Coconet Reinforcement for Soil Erosion Control. Soil Eros. Stud. 2011, 2–15. [Google Scholar] [CrossRef] [Green Version]
  75. Faucette, L.B.; Risse, M.; Jordan, C.F.; Cabrera, M.; Coleman, D.C.; West, L.T. Vegetation and soil quality effects from hydroseed and compost blankets used for erosion control in construction activities. J. Soil Water Conserv. 2006, 61, 2–8. [Google Scholar] [CrossRef]
  76. Blankenship, W.D.; Condon, L.A.; Pyke, D.A. Hydroseeding tackifiers and dryland moss restoration potential. Restor. Ecol. 2019, 28, S127–S138. [Google Scholar] [CrossRef] [Green Version]
  77. Rivera, D.; Mejías, V.; Jáuregui, B.M.; Costa-Tenorio, M.; López-Archilla, A.I.; Peco, B. Spreading Topsoil Encourages Ecological Restoration on Embankments: Soil Fertility, Microbial Activity and Vegetation Cover. PLoS ONE 2014, 9, e101413. [Google Scholar] [CrossRef] [Green Version]
  78. Heyes, S.; Butler, M.; Gartlan, C.; Ovington, A. Corangamite Seed Supply & Revegetation Project. 2008. Available online: https://www.ccmaknowledgebase.vic.gov.au/resources/Developing_seed_production_areas_for_native_plants.pdf (accessed on 24 August 2021).
  79. Farhani, N.B.Y. Evaluation of Geological Formation for Potential Groundwater Aquifer by Integrated by Geophysical Technique. Available online: http://psasir.upm.edu.my/id/eprint/76090 (accessed on 5 September 2021).
  80. Paramananthan, S.; Daud, N. Classification of Acid Sulfate Soils of Peninsular Malaysia. Pertanika 1986, 9, 323–330. [Google Scholar]
  81. William, J. Chancellor Soil Physical Properties. Adv. Soil Dyn. 2013, 1, 21–254. [Google Scholar] [CrossRef]
  82. Ghani, M.A.; Ghani, A. Petrology of granitic rocks along new Pos Selim to Kampung Raja highway (km 0 to km 22): Identification of different granitic bodies, its field and petrographic characteristics. Bull. Geol. Soc. Malays. 2003, 46, 35–40. [Google Scholar] [CrossRef] [Green Version]
  83. Fatai, A.A.; Shamshuddin, J.; Fauziah, C.I.; Radziah, O.; Bohluli, M. Formation and characteristics of an Ultisol in Peninsular Malaysia utilized for oil palm production. Solid Earth 2017, 1–21. [Google Scholar] [CrossRef]
  84. Zhao, C.; Liu, B.; Piao, S.; Wang, X.; Lobell, D.B.; Huang, Y.; Huang, M.; Yao, Y.; Bassu, S.; Ciais, P.; et al. Temperature increase reduces global yields of major crops in four independent estimates. Proc. Natl. Acad. Sci. USA 2017, 114, 9326–9331. [Google Scholar] [CrossRef] [PubMed] [Green Version]
  85. Chen, H.; Zhang, W.; Gao, H.; Nie, N. Climate change and anthropogenic impacts on wetland and agriculture in the Songnen and Sanjiang Plain, northeast China. Remote Sens. 2018, 10, 356. [Google Scholar] [CrossRef] [Green Version]
  86. Grozavu, A.; Patriche, C.V. Mapping landslide susceptibility at national scale by spatial multi-criteria evaluation. Geomat. Nat. Hazards Risk 2021, 12, 1127–1152. [Google Scholar] [CrossRef]
  87. Bahrami, Y.; Hassani, H.; Maghsoudi, A. Landslide susceptibility mapping using AHP and fuzzy methods in the Gilan province, Iran. GeoJournal 2021, 86, 1797–1816. [Google Scholar] [CrossRef]
  88. Cerdà, A. Soil water erosion on road embankments in eastern Spain. Sci. Total Environ. 2007, 378, 151–155. [Google Scholar] [CrossRef] [PubMed]
  89. Pan, C.; Shangguan, Z. Runoff hydraulic characteristics and sediment generation in sloped grassplots under simulated rainfall conditions. J. Hydrol. 2006, 331, 178–185. [Google Scholar] [CrossRef]
  90. Gaurina-Medjimurec, N. Handbook of Research on Advancements in Environmental Engineering; IGI Global: Hershey, PA, USA, 2014; ISBN 9781466673373. [Google Scholar]
  91. Yen, C. Study on the root system form and distribution habit of the ligneous plants for soil conservation in Taiwan. J. Chin. Soil Water Conserv. 1972, 3, 179–204. [Google Scholar]
  92. Zhao, B.; Zhang, L.; Xia, Z.; Xu, W.; Xia, L.; Liang, Y.; Xia, D. Effects of Rainfall Intensity and Vegetation Cover on Erosion Characteristics of a Soil Containing Rock Fragments Slope. Adv. Civ. Eng. 2019, 2019, 7043428. [Google Scholar] [CrossRef]
  93. Wu, L.; Peng, M.; Qiao, S.; Ma, X. Effects of rainfall intensity and slope gradient on runoff and sediment yield characteristics of bare loess soil. Environ. Sci. Pollut. Res. 2018, 25, 3480–3487. [Google Scholar] [CrossRef]
  94. Li, X.; Niu, J.; Xie, B. The effect of leaf litter cover on surface runoff and Soil Erosion in Northern China. PLoS ONE 2014, 9, e107789. [Google Scholar] [CrossRef] [Green Version]
  95. Repel, A. Developing of the rainfall intensity-duration-frequency curves for the Kosice region using multiple computational models. IOP Conf. Ser. Mater. Sci. Eng. 2019, 566, 012026. [Google Scholar] [CrossRef]
  96. Gámez-Balmaceda, E.; López-Ramos, A.; Martínez-Acosta, L.; Medrano-Barboza, J.P.; López, J.F.R.; Seingier, G.; Daesslé, L.W.; López-Lambraño, A.A. Rainfall intensity-duration-frequency relationship. Case study: Depth-duration ratio in a semi-arid zone in Mexico. Hydrology 2020, 7, 78. [Google Scholar] [CrossRef]
  97. Fantina, D.E. A Comparison of Runoff Estimation Techniques. 2012. Available online: https://www.suncam.com/courses/100233-06.html (accessed on 24 August 2021).
  98. Meena, S.R.; Ghorbanzadeh, O.; Blaschke, T. A comparative study of statistics-based landslide susceptibility models: A case study of the region affected by the Gorkha earthquake in Nepal. ISPRS Int. J. Geo-Inf. 2019, 8, 94. [Google Scholar] [CrossRef] [Green Version]
  99. Al-Shabeeb, A.R.; Al-Adamat, R.; Mashagbah, A. AHP with GIS for a Preliminary Site Selection of Wind Turbines in the North West of Jordan. Int. J. Geosci. 2016, 7, 1208–1221. [Google Scholar] [CrossRef] [Green Version]
  100. Rossi, M.; Reichenbach, P. LAND-SE: A software for statistically based landslide susceptibility zonation, version 1.0. Geosci. Model Dev. 2016, 9, 3533–3543. [Google Scholar] [CrossRef] [Green Version]
  101. Tazik, E.; Jahantab, Z.; Bakhtiari, M.; Rezaei, A.; Alavipanah, S.K. Landslide susceptibility mapping by combining the three methods Fuzzy Logic, Frequency Ratio and Analytical Hierarchy Process in Dozain basin. Int. Arch. Photogramm. Remote Sens. Spat. Inf. Sci. 2014, 40, 267. [Google Scholar] [CrossRef] [Green Version]
  102. Gigović, L.; Drobnjak, S.; Pamučar, D. The application of the hybrid GIS spatial multi-criteria decision analysis best–worst methodology for landslide susceptibility mapping. ISPRS Int. J. Geo-Inf. 2019, 8, 79. [Google Scholar] [CrossRef] [Green Version]
  103. SafeLand Recommended Procedures for Validating Landslide Hazard and Risk Models and Maps, Report. 2011. Available online: https://www.ngi.no/download/file/5994 (accessed on 24 August 2021).
  104. Baets, S.; Poesen, J. Empirical models for predicting the erosion-reducing effect of plant roots during concentrated flow. Geomorphology 2010, 118, 425–432. [Google Scholar] [CrossRef]
  105. Vannoppen, W.; Vanmaercke, M.; De Baets, S.; Poesen, J. A review of the mechanical effects of plant roots on concentrated flow erosion rates. Earth-Sci. Rev. 2015, 150, 666–678. [Google Scholar] [CrossRef] [Green Version]
  106. Chen, G.; Weil, R.R. Penetration of cover crop roots through compacted soils. Plant Soil 2010, 331, 31–43. [Google Scholar] [CrossRef]
  107. Najafi, S.; Dragovich, D.; Heckmann, T.; Sadeghi, S.H. Sediment connectivity concepts and approaches. Catena 2021, 196, 104880. [Google Scholar] [CrossRef]
  108. Luo, J.; Zhou, X.; Rubinato, M.; Li, G.; Tian, Y.; Zhou, J. Impact of multiple vegetation covers on surface runoff and sediment yield in the small basin of nverzhai, hunan province, China. Forests 2020, 11, 329. [Google Scholar] [CrossRef] [Green Version]
  109. Bochet, E.; García-Fayos, P.; Alborch, B.; Tormo, J. Soil water availability effects on seed germination account for species segregation in semiarid roadslopes. Plant Soil 2007, 295, 179–191. [Google Scholar] [CrossRef]
  110. García-Palacios, P.; Bowker, M.A.; Chapman, S.J.; Maestre, F.T.; Soliveres, S.; Gallardo, A.; Valladares, F.; Guerrero, C.; Escudero, A. Early-successional vegetation changes after roadside prairie restoration modify processes related with soil functioning by changing microbial functional diversity. Soil Biol. Biochem. 2011, 43, 1245–1253. [Google Scholar] [CrossRef]
  111. Risse, M.; Cabrera, M.; Coleman, D.C.; West, L.T. Contaminated Soils, Sediments and Water. In Contaminated Soils Sediments Water; Springer: Berlin/Heidelberg, Germany, 2006. [Google Scholar] [CrossRef]
  112. Kim, J.H.; Fourcaud, T.; Jourdan, C.; Maeght, J.L.; Mao, Z.; Metayer, J.; Meylan, L.; Pierret, A.; Rapidel, B.; Roupsard, O.; et al. Vegetation as a driver of temporal variations in slope stability: The impact of hydrological processes. Geophys. Res. Lett. 2017, 44, 4897–4907. [Google Scholar] [CrossRef]
Figure 1. Study area (a) map of Malaysia; (b) LiDAR image of the study area; (c) hydroseeded site.
Land 10 00995 g001
Figure 2. Seed samples: (a) Ryegrass; (b) rye corn; (c) signal grass; (d) couch.
Land 10 00995 g002
Figure 3. The spraying process on the study area.
Land 10 00995 g003
Figure 4. Experimental surface runoff plot.
Land 10 00995 g004
Figure 5. Landslide Susceptibility map by AHP.
Land 10 00995 g005
Figure 6. ROC curve.
Land 10 00995 g006
Figure 7. Hydroseeded vegetation.
Land 10 00995 g007
Figure 8. Graph plot of the monthly vegetation root length.
Land 10 00995 g008
Figure 9. The different vegetation root samples: (a) Ryegrass (G1); (b) rye corn (G2); (c) signal grass (G3); (d) couch (G4).
Land 10 00995 g009
Figure 10. A plot of the vegetation ground cover.
Land 10 00995 g010
Figure 11. Monthly vegetation surface runoff.
Land 10 00995 g011
Table 1. Site description of the study area.
PropertiesDescription
LocationUPM, Serdang
Slope angle65 degrees
Soil typeSerdang (Typic Kandiudults) and Malacca Series (Typic Hapludox)
Precipitation2400 mm annually
HumidityThe average annual percentage of humidity is: 80.0%
Temperature22 to 33 °C
Table 2. The soil physical and chemical properties of the study area.
PropertiesSerdang SeriesMalacca Series
Depth (m)
Soil texture
Topsoil 0.1
Subsoil 1.5
Sandy clay loam to sandy clay
0.1
1.5
Clay and Sand
Bulk density (grcm−3)Topsoil1.47 and 1.421.36 and 1.27
Subsoil1.48 to 1.49 and 1.44 to 1.451.37 to 1.41 to 1.30 to 1.32
Porosity (%)Topsoil36.8 and 38.2641.37 and 47.08
Subsoil30.15 to 21.87 and 344 to 23.1529.15 to 34.12 and 42.22 to 34.51
Water holding capacity (%)Topsoil 33 kPa23.02 to 16.6123.83 to 21.51
Subsoil 33 kPa21.16 to 17.0123.72 to 21.81
Soil pH (%)Topsoil 1500 kPa12.59 to 7.5810.75 to 10.77
Subsoil 1500 kPa11.97 to 8.3610.29 to 13.23
Topsoil4.99 to 4.904.47 and 5.30
Subsoil5.68 to 5.22
Table 3. The quantity, origin, and prices of the seed samples.
SeedsQuantity (kg)OriginPrice per kg (AUD)
Rye grass (Lolium perenne L.)1 kgEurope, Asia and northern Africa5.10
Rye corn (Secale cereale)1 kgTurkey1.90
Signal grass (Brachiaria Decumbens/Urochioa Decumbens)1 kgUganda16.50
Couch Bermuda grass (Cynodon dactylon)1 kgAfro-Eurasia and Australia24.00
Table 4. The annual climatic condition of the study area in 2020 (from climate data).
Jan.Feb.Mar.Apr.MayJun.Jul.Aug.Sept.Oct.Nov.Dec.
Avg.
Temperature
°C (°F)
25.125.72626.126.326.226.12625.825.725.225.1
(77.2)(78.3)(78.8)(78.9)(79.3)(79.2)(78.9)(78.8)(78.5)(78.2)(77.4)(77.2)
Min Temperature
°C (°F)
21.921.922.723.123.423.122.822.822.822.822.722.3
(71.4)(71.4)(72.8)(73.6)(74.1)(73.5)(73.1)(73.1)(73)(73)(72.8)(72.2)
Max Temperature
°C (°F)
209174268300246174183219243308373284
(8.2)(6.9)(10.6)(11.8)(9.7)(6.9)(7.2)(8.6)(9.6)(12.1)(14.7)(11.2)
Precipitation/Rainfall mm (in)209174268300246174183219243308373284
(8.2)(6.9)(10.6)(11.8)(9.7)(6.9)(7.2)(8.6)(9.6)(12.1)(14.7)(11.2)
Humidity85%82%85%87%87%85%84%84%85%87%90%88%
Rainy days201824272522242425262624
Table 5. Showing selected daily runoff under different rainfall intensities.
DateRainfall
(mm/h)
G1
Runoff (mm)
G2
Runoff (mm)
G3
Runoff (mm)
G4
Runoff (mm)
September359.038.536.775.52
October484.624.323.733.05
November338.256.917.365.13
December347.818.286.155.68
Publisher’s Note: MDPI stays neutral with regard to jurisdictional claims in published maps and institutional affiliations.

