3. Results and Discussion
The cyclic voltammetry technique was used to help identify possible redox reactions taking part on Mo and W working electrodes in both electrolytes. Cathodic end potential, E
C, was gradually swept from the initial potential, E
I, towards more negative values. A typical result is presented in
Figure 2. Clear indications of four redox processes were obtained in the potential range up to 1.000 V negative to the open circuit of the working Mo or W electrode in Electrolyte I. They were represented as four reduction (cathodic) current waves (C
1, C
2, C
3 and C
4) and four oxidation (anodic) counterparts (A
1, A
2, A
3 and A
4). Comparing the current wave peak potentials shown in
Figure 2 to the similar current wave potentials obtained in our previous study from NdF
3 + LiF + 2 wt.%Nd
2O
3 electrolyte on W and Mo electrodes under the same conditions for the neodymium deposition and dissolution, helped attribution of C
1/A
1 and C
2/A
2 to the deposition and dissolution of neodymium and C
4/A
4 to the deposition and dissolution of lithium [
12,
15]. According to the data published in our earlier work, in the fluoride electrolyte, neodymium reduces to the metal form in two steps, seen as C
1 and C
2 in
Figure 2 [
12,
15]. Therefore, the electrode reaction corresponding to the current waves C
3/A
3 can be assigned to possible deposition and dissolution of praseodymium.
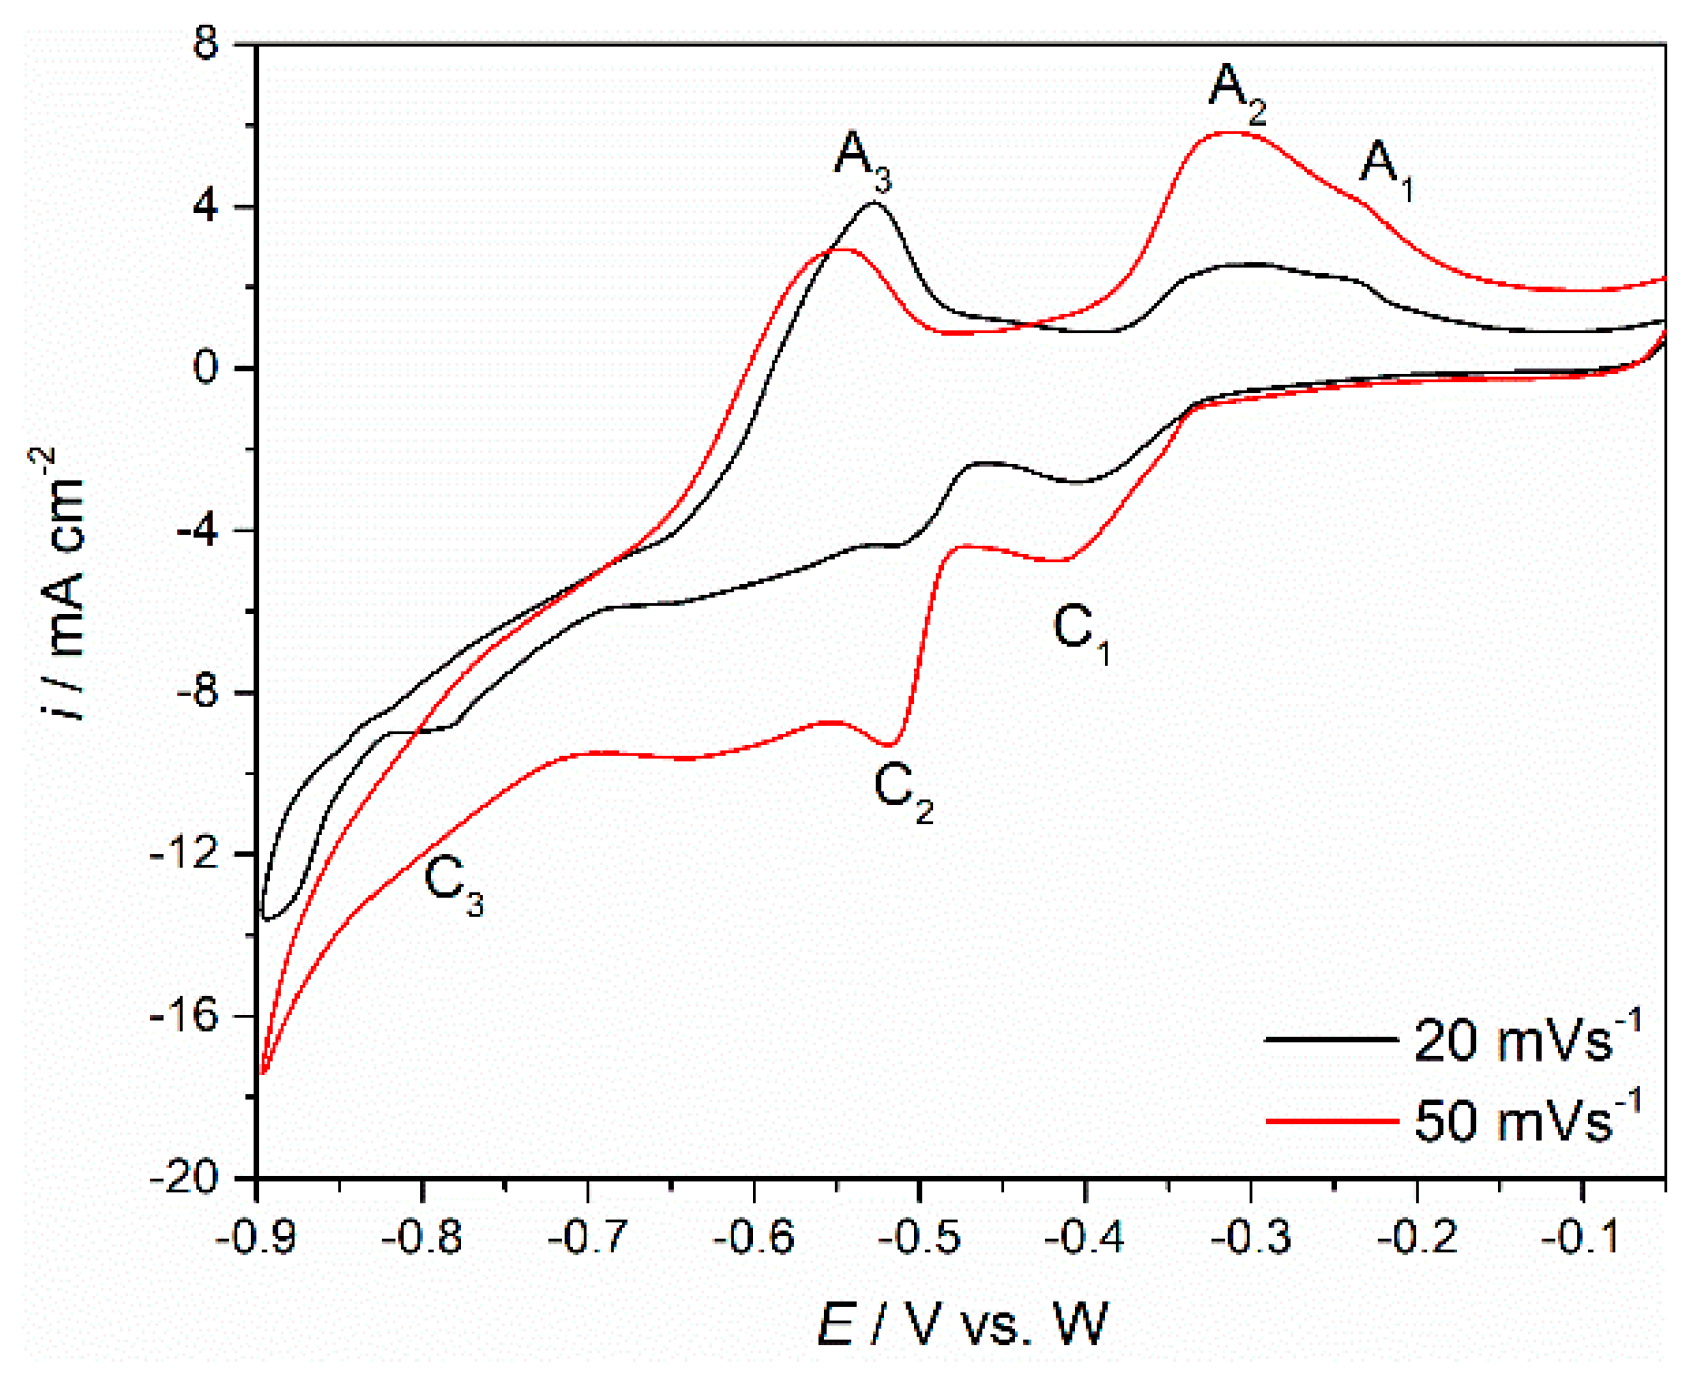
Cyclic voltammetry with different scan rates (50 and 300 mV·s
−1) was employed to study the electrochemical reactions related to Nd and Pr redox transitions on W and Mo working electrodes.
Figure 3a,b show voltammograms obtained on each of the working electrode substrates (Mo and W) in the molten Electrolyte I, at 1323 K. On both substrates, within the applied potential range, the voltammograms, exhibited three distinct current waves C
1, C
2 and C
3 in the cathodic sections and corresponding anodic counterparts A
1, A
2 and A
3 in the anodic sections of the scanned potential range.
Furthermore, it was apparent that there were in fact three redox reactions (C1/A1, C2/A2 and C3/A3), because each cathodic current wave was a prerequisite for its anodic counterpart.
The small difference between the voltammograms obtained on Mo and W was recorded in the peak potentials of the recorded current waves. On W working electrode, the current wave C
1, starting at ≈−0.550 V vs. W, should reflect the reduction of Nd(III) to Nd(II), and the anodic peak A
1 in the reverse scan at ≈−0.300 V vs. W, should reflect the oxidation of Nd(II) to Nd(III) [
12,
15,
20]. At more cathodic potentials ≈−0.700 V vs. W, the reduction current wave C
2 should be assigned to further reduction of Nd(II) to Nd(0), and the anodic counterpart current wave A
2 should represent the oxidation of Nd(0) to Nd(II). In other words, the reduction process of Nd(III) ions to Nd metal takes place in two steps, Nd(III) → Nd(II) and Nd(II) → Nd(0), which is in accordance with the results reported in molten fluorides with Nd
2O
3 added [
12,
15,
20]. At the potentials negative to −0.700 V vs. W, a third reduction current wave was observed. Since the C
3 current wave potentials are cathodic with respect to the reduction potential of Nd(II), cathodic peak C
3 (starting from around −0.800 V vs. W) should be associated with the electroreduction of Pr(III) to Pr(0). In the anodic scan, starting at around −0.670 V vs. W, the oxidation current wave A
3, should then correspond to the dissolution of Pr metal that was previously deposited on the working electrode, e.g., Pr(0) to Pr(III). It appeared that the electroreduction of Pr(III) ions to Pr metal in this system is a single one-step process, Pr(III) → Pr(0), which is in agreement with the results observed in similar molten fluoride electrolytes [
5,
17,
28]. On the basis of experimental results in this study, the cathodic peak potential values C
2 and C
3, as seen on CVs in
Figure 3a,b, reflecting the electroreduction potentials of Nd(II) ions into Nd metal (C
2), are more positive than the electroreduction potential of Pr(III) ions (C
3), which is consistent with the results seen in the literature [
17]. Additionally, due to close values of the reduction potentials for reactions: Nd(II) + 2e
− → Nd(0), and Pr(III) + 3e
− → Pr(0), it was difficult to obtain ideally shaped individual current waves by cyclic voltammetry, particularly at higher scan rates. As recorded in voltammograms obtained on Mo and W cathodes, potentials of cathodic current waves on the Mo substrate are slightly shifted toward more positive values compared to the W substrate, whereas the anodic current waves are similar in values. Therefore, it can be assumed that in the Electrolyte I system, W and Mo working electrodes behave almost identically. Similar results were observed with Mo and W WEs in NdF
3 + LiF + 2 wt.%Nd
2O
3 melts [
15].
To investigate the redox reactions further, the CVs recorded at different scan rates on Mo and W electrodes in molten NdF
3 + PrF
3 + LiF + 1 wt.%Pr
6O
11 + 1 wt.%Nd
2O
3 electrolyte (
Figure 3a,b) were recorded and analysed. It was observed that with an increase in scan rates (50–300 mV·s
−1), reduction current densities for peaks C
1, C
2 and C
3 and oxidation current densities for peaks A
3, A
2 and A
1 increased. Attempts were made to recognize the possible reversibility of the recorded redox reactions or their parts. The reversibility was examined by plotting the influence of the scan rates applied to the current wave peak potentials recorded.
Figure 4 shows graphical representations of the plots derived from the data in
Figure 3a:
(a) A
1 anodic peak current density values as a function of square root of the scan rates applied, and (b) the logarithms of A
1 anodic peak current values as a function of the peak potentials recorded for different potential scan rates applied (log i
P = f(E
P)). The first plot appears to be linear and does not pass through the origin,
Figure 4a. This should indicate that the oxidation process Nd(II)

Nd(III) is reversible and under mixed control, as was shown in the earlier work done in neodymium oxyfluoride melts under very similar conditions [
12,
15,
20]. The relationship presented in
Figure 4b is linear for the whole range of the scan rates applied, which made it possible for the number of exchanged electrons in the Nd(II)→Nd(III) reaction to be calculated. The calculation was performed using the equation often employed in electrodeposition studies that defining the slope (K) as a function of log i
P = f(E
PEAK) and the number of electrons involved in the reaction (z) [
12,
15,
20]. It was found that the slope K of the linear function from
Figure 4b was 2.39, and the corresponding electron transfer number therefore should be 1.25, so close to 1. This directly confirmed the oxidation reaction recorded as an oxidation process A
1 (
Figure 3a) involves one electron exchange in electrochemical oxidation of Nd(II) to Nd(III). Thus, it was confirmed that the redox reaction reflected as a current wave pair C
1/A
1 was Nd(II)

Nd(III), which nominated the current wave pair C
2/A
2 as the Nd(II)

Nd(0) as a redox reaction [
12,
20].
The data presented in
Figure 4c, where the maximum cathodic current densities for peak C
3 and its anodic counterpart peak A
3 from
Figure 3b are plotted versus the square root of the scan rates applied, indicated a linear relationship that did not pass through the origin. The results were implying that the redox process recorded as the C
3/A
3 current wave pair (Pr(III)

Pr(0)) was reversible and under mixed control: by mass transfer of the complexed praseodymium ions in the molten NdF
3 + PrF
3 + LiF + 1 wt.%Pr
6O
11 + 1 wt.%Nd
2O
3 and that the rate of the charge transfer step was likely complicated by the dismantling structure of the praseodymium oxyfluoride complexes [
25,
29].
Although values of the peak potentials for the redox pairs C
3/A
3, C
2/A
2 and C
1/A
1 in the voltammograms,
Figure 3a,b, were slightly different from when the scan rates applied were varied, the observed should be attributed to the reversible reactions under mixed control as shown above and in our previous studies [
12,
15]. These conclusions apply for both Mo and W working electrodes.
CV performed on Mo electrode in the same molten fluoride while applying different holding times at chosen cathodic end potentials, E
C = −0.630 V vs. W, before returning to the starting potential, E
I, is shown in
Figure 5. C
2/A
2 and C
1/A
1 identify the redox signals that occurred within this potential window. The same electrochemical reactions associated with C
2/A
2 and C
1/A
1 redox couples were observed in previous studies and described as neodymium electrochemical deposition/dissolution in two steps on/from Mo working electrode under given conditions [
12,
15,
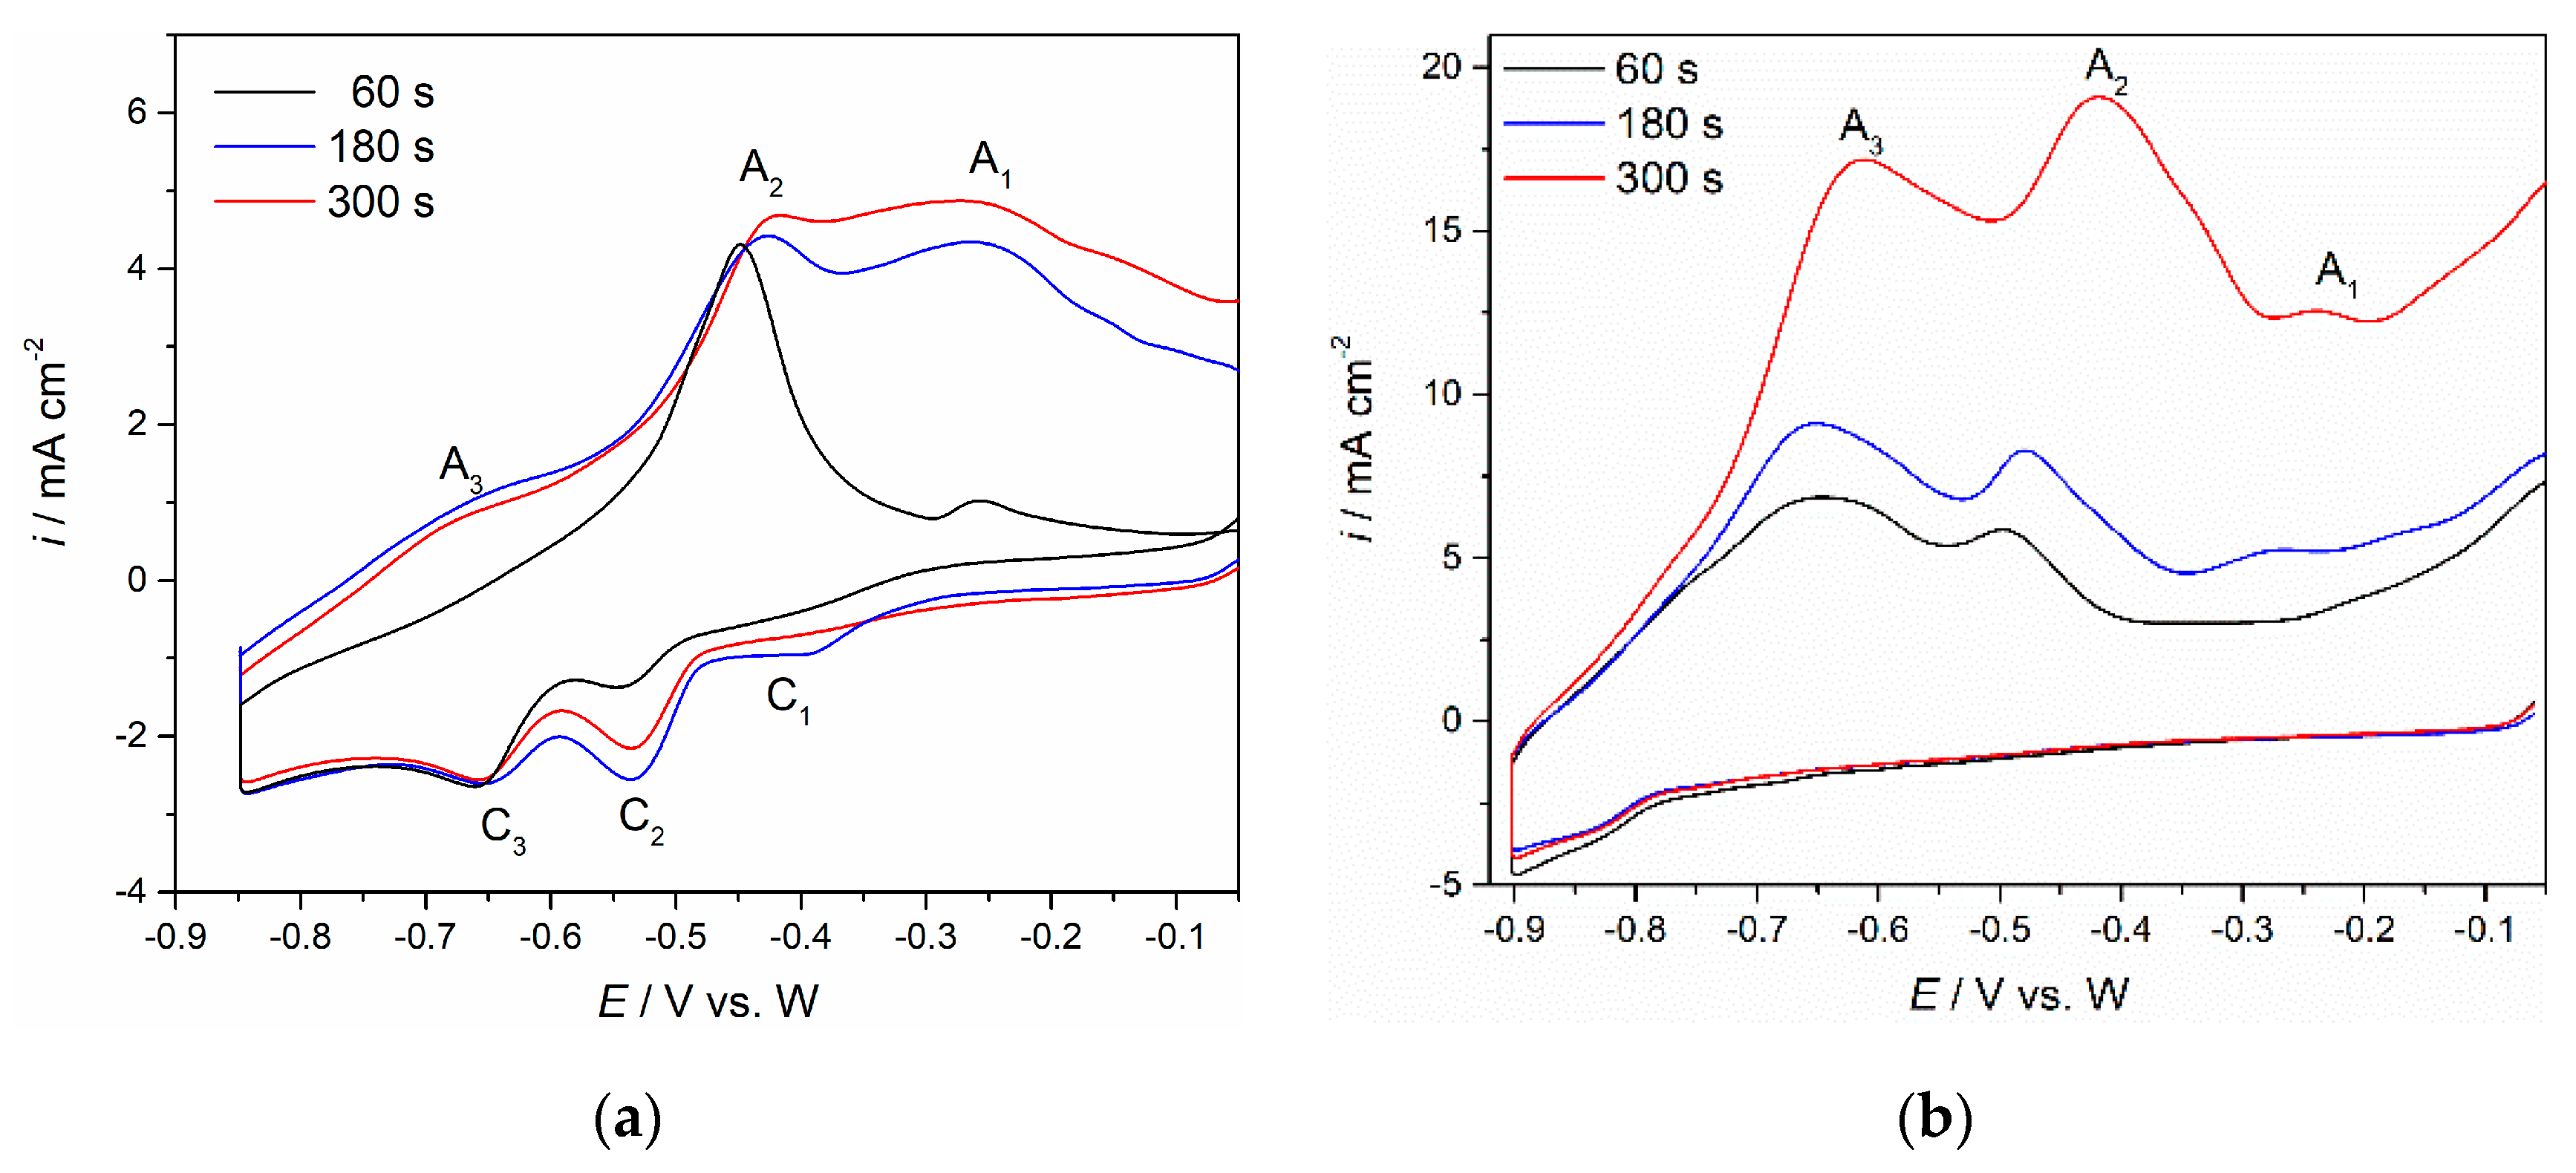
20]. In a separate set of experiments, the cathodic end potential of the Mo working electrode was held at −0.850 V vs. W,
Figure 6a, and the W working electrode at −0.900 V vs. W,
Figure 6b, for 60, 180 and 300 s, before letting the potential return to positive values. On the basis of the above mentioned results, in
Figure 2,
Figure 3 and
Figure 5, the chosen cathodic end potential has proven to be negative enough to sustain the praseodymium and neodymium electrodeposition but not too much to induce lithium deposition. With an increase in deposition time, the maximum peak current at the E
C potential increased, and the charge encompassed by the anodic current waves (A
3, A
2, A
1), was substantially enlarged. The increased charge encompassed by anodic current waves with increased deposition time indicated more praseodymium and neodymium metal being dissolved. The conclusion had to be that the electroreduction processes of Nd and Pr in the fluoride bath made of Electrolyte I, on both W and Mo working substrates were taking place in a very similar way.
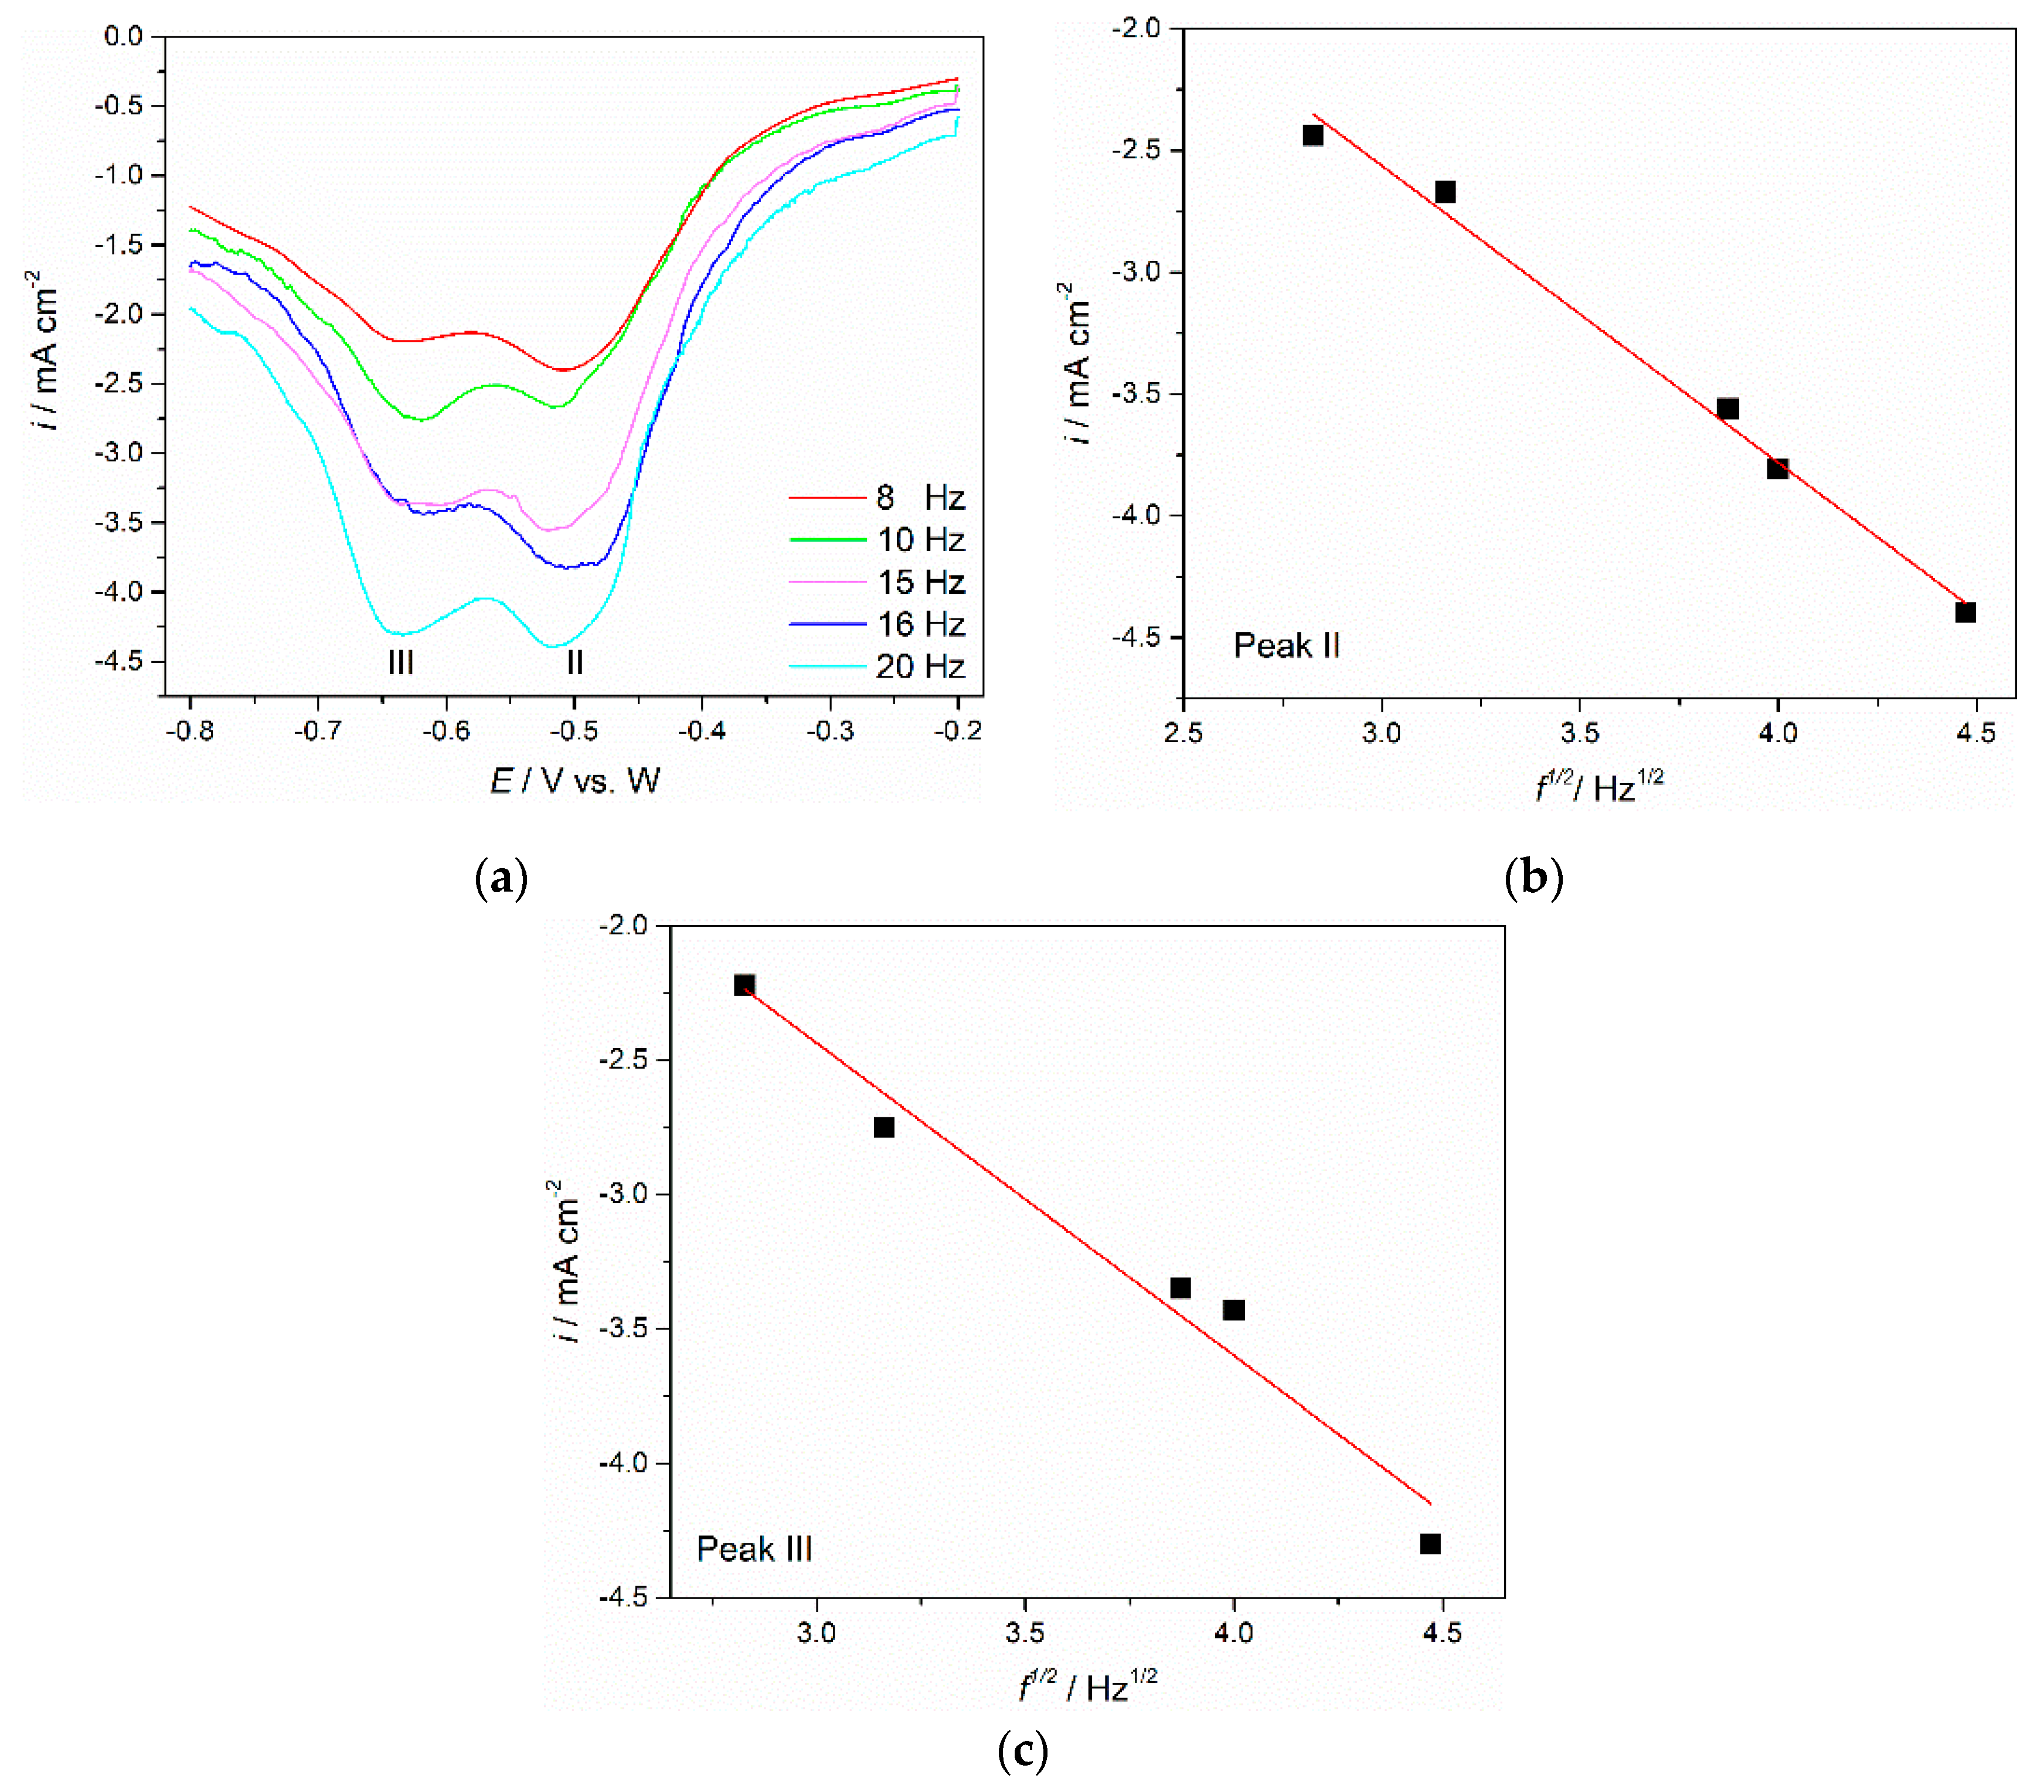
To further clarify the electrochemical reduction of neodymium and praseodymium in the molten Electrolyte I, square wave voltammetry (SWV) was employed. SWV is characterised by advanced sensitivity and high resolution and can be applied to estimate the number of exchanged electrons involved in reduction processes [
30,
31]. A set of square wave voltammograms showing application of different frequencies to the Mo working electrode are presented in
Figure 7. The peaks II and III detected at potentials ≈−0.505 V vs. W and ≈−0.640 V vs. W are in good agreement within the range of the cathodic current wave potentials C
2 and C
3 recorded in the voltammograms presented in
Figure 3a and
Figure 5a and ascribed to the reduction of Nd(II) → Nd(0) and Pr(III) → Pr(0), respectively. For a reversible electrode reaction, mathematical analysis enables us to use a simple equation connecting the width of the half-peak,
W1/2, recorded in a SW voltammogram with the number of the exchanged electrons [
17,
30]:
where
W1/2 is the half-peak width (V),
T is the temperature (K),
R represents the universal gas constant (J·mol
−1·K
−1),
n is the number of exchanged electrons, and
F is the Faraday constant (96,485 C·mol
−1). Application of Equation (1) for reversible systems is possible if the criterion of linearity for the peak current density vs. the square root of the frequency is fulfilled [
17,
31]. The linear relationship for the obtained SWV was proven by plotting peak current density vs. the square root of frequency, as can be seen from
Figure 7b,c. The relationship can be used to calculate the electrons involved in reactions of the frequency range examined [
17,
31]. A Gaussian fitting model was applied to calculate the half-peak width, which was used to determine the number of the transferred electrons.
The results derived from Equation (1) for peak II revealed the exchange electron number as 2.37, close to 2. The conclusion had to be that the current wave II (C2) should reflect the reduction of neodymium Nd(II) into metal Nd, after two electrons were exchanged.
After application of Equation (1) to the current wave III in
Figure 7a, it was found that the number of electrons exchanged in the reduction was 3.42, close to 3. This indicated that the reduction of praseodymium, Pr(III) in the used electrolyte takes place in only one electrochemical step involving three electron exchange, namely Pr(III) → Pr(0). The number of electrons involved in the Pr electroreduction process calculated in the present study corresponds very well with the average oxidation state of Pr in Pr
6O
11, which is in alignment to the available data 3.667 [
32].
The electrochemical reduction processes of Nd and Pr in Electrolyte I were verified by multiple electrochemical techniques. However, in order to further study the ongoing reaction mechanism, and adjust the deposition parameters to potentially improve the efficiency of the Nd and Pr electrolysis process, the percentage of rare earth oxide that was added to the base electrolyte was changed.
The literature presents claims that increased weight percentage of Nd
2O
3 in the neodymium fluoride electrolyte has a significant impact on Nd metal production [
1,
22]. Based on our previous work, it appears that better neodymium yield on the cathode is achieved when 2 wt.% of Nd
2O
3 is added to the original neodymium fluoride melt. With the Nd
2O
3 added in the fluoride bath, the oxide will react with NdF
3 or LiF to form different oxyfluorides complexes, namely NdOF or [NdOF
5]
4− [
1,
12,
33,
34]. Due to the excess of F
- ions in fluoride molten salts, both complexes coexist, and which complex will be reduced into metallic Nd during the electrodeposition of Nd from Nd(III) depends on the neodymium oxyfluoride/neodymium fluoride ion molar ratio, electrode potential and applied current density [
12,
34,
35]. However, the data on the subject of dissolution of praseodymium oxide, especially Pr
6O
11, in fluoride molten bath are rather limited [
1,
18,
25,
29]. During preparation of rare earth fluoride electrolytes, praseodymium oxide is dissolved in neodymium fluoride or corresponding praseodymium fluoride molten electrolyte. As a result, of the chemical exchange between the praseodymium oxide and rare earth fluorides, praseodymium oxyfluoride complexes are formed. The knowledge gathered around this subject suggests substantial similarity between the Nd and Pr complexes formed in the melts containing their fluorides, LiF, Nd
2O
3 and Pr
6O
11 [
1,
29]. Controlled addition of rare earth oxides to fluoride melts should increase the conductivity of the electrolyte and provide a source of rare earth metals for the electrolysis [
18].
Since the objective was to maximize the quantity of Nd and Pr electrodeposited on the working electrode substrates (Mo and W), the experiments were repeated, applying the same set of experimental techniques but in NdF
3 + PrF
3 + LiF + 2 wt.%Pr
6O
11 + 2 wt.%Nd
2O
3 electrolyte instead. The voltammograms in
Figure 8 reflect the results of the CVs applied on a Mo cathode in the Electrolyte II at 1323 K. They exhibit three current waves in the cathodic run (namely C
1, C
2 and C
3) showing peak potentials at ≈−0.400 V, ≈−0.550 V and ≈−0.800 V vs. W, respectively, and three anodic current waves with peak potentials at around ≈−0.600 V, ≈−0.350 V and ≈−0.200 V vs. W, respectively. Compared to the voltammograms obtained for Electrolyte I under the same conditions, the current densities recorded were up to five times higher in the electrolyte with higher oxide weight percentages. Otherwise, the current wave pairs C
1/A
1, C
2/A
2 and C
3/A
3 in
Figure 8 should correspond to the electrochemical redox processes, which were found to be Nd(III)/Nd(II), Nd(II)/Nd(0) and Pr(III)/Pr(0).
Figure 9 shows CVs similar to those described above for Electrolyte I (
Figure 6a,b). These were recorded while applying different holding times at chosen cathodic end potentials, E
C, on Mo working electrode in the electrolyte with higher oxides concentration. By using the same procedures as those employed for Electrolyte I, prolonged deposition at potentials cathodic to the peak potential C
3 induced increased amounts of charge encompassed by the anodic current waves, A
3 and A
2, which clearly suggested an increased quantity of dissolved praseodymium and neodymium, which were previously deposited during the application of the E
C cathodic potential.
To support the proposition that current wave pairs C
1/A
1, C
2/A
2 and C
3/A
3 recorded in the voltammograms presented in
Figure 8 and
Figure 9 are the results of praseodymium (C
3/A
3) and neodymium (C
1/A
1, C
2/A
2), metal phase formation and dissolution open circuit potentiometry was conducted. Nd and Pr were electrodeposited on working electrode substrates by applying a constant potential negative to the peak of the C
3 potential for a short period of time, and then the resulting transient curve for the open circuit working electrode potential was recorded. The open circuit chronopotentiograms obtained in Electrolyte II on a Mo working electrode after potentiostatic electrodeposition at −0.900 V vs. W at 1323 K is presented in
Figure 10. The chronopotentiogram shows the plateaux I ≈ −0.750 V, II ≈ −0.600 V and III ≈ −0.350 V vs. W, respectively, pointing out that the number of inflection points agreed with the number of anodic current waves (A
1, A
2 and A
3) seen in the previously presented voltammograms. Relatively stable plateaux I and II reflect two phases (metal Pr and metal Nd) in equilibrium with individual ions in the surrounding electrolyte under the given conditions. The fading potential of the inclined plateau III should reflect declining equilibrium between Nd(III)

Nd(II) ions.
In the oxide richer Electrolyte II, SWV measurements resulted in more distinct results in terms of the deposition of neodymium and praseodymium. An example of the typical SWV on a Mo working electrode is presented in
Figure 11. Two well-pronounced cathodic peaks were recorded in the potential range applied. Half-peak width was established, and after applying a Gaussian fitting model, the exchange electron number was calculated using Equation (1), after proving the linear relationship;
Figure 11b. Reduction peak II identified at around −0.600 V vs. W was processed, and the number of transferred electrons was found to be 2.23, which implied the exchange of two electrons, i.e., the reduction process of Nd(II) into Nd metal. As for the reduction peak III identified at ≈−0.820 V, the number of exchanged electrons was determined to be 3.43, which can be explained as a three-electron exchange in the one-step reduction process of Pr(III) to Pr metal. SWV obtained with different frequencies on Mo cathode in both electrolytes confirmed the already suggested corresponding potentials of the cathodic reactions C
2 and C
3 and the number of exchanged electrons involved in each reaction.
Thus, taking into account similar behaviour of molybdenum and tungsten in the common Nd-Pr fluoride electrolytes with 2 wt.% and 4 wt.% REO added, one should assume that on both electrodes at potentials more negative than the reduction potential of Pr(III) ions, Nd metal and Pr metal can be co-deposited.
Literature is very scarce regarding Nd and Pr metal being identified on an inert cathode (Mo and W) surface by a deposition similar to the potentiostatic deposition from an oxide fluoride molten salt electrolyte [
25]. There are, however, reports showing Nd and Pr being deposited from fluoride melts, but only in the form of alloys [
17,
23].
To confirm the presence of Nd and Pr metal on an inert working substrate, potentiostic electrolysis was conducted at −0.900 V vs. W on Mo working electrode for 60 and 90 min in the electrolyte made of NdF3 + PrF3 + LiF + 2 wt.%Pr6O11 + 2 wt.%Nd2O3.
The applied potential was approximately 100 mV more negative than the peak potential value of the cathodic current wave C
3, which reflects the reduction process Pr(III) into Pr(0);
Figure 2,
Figure 5,
Figure 6,
Figure 8 and
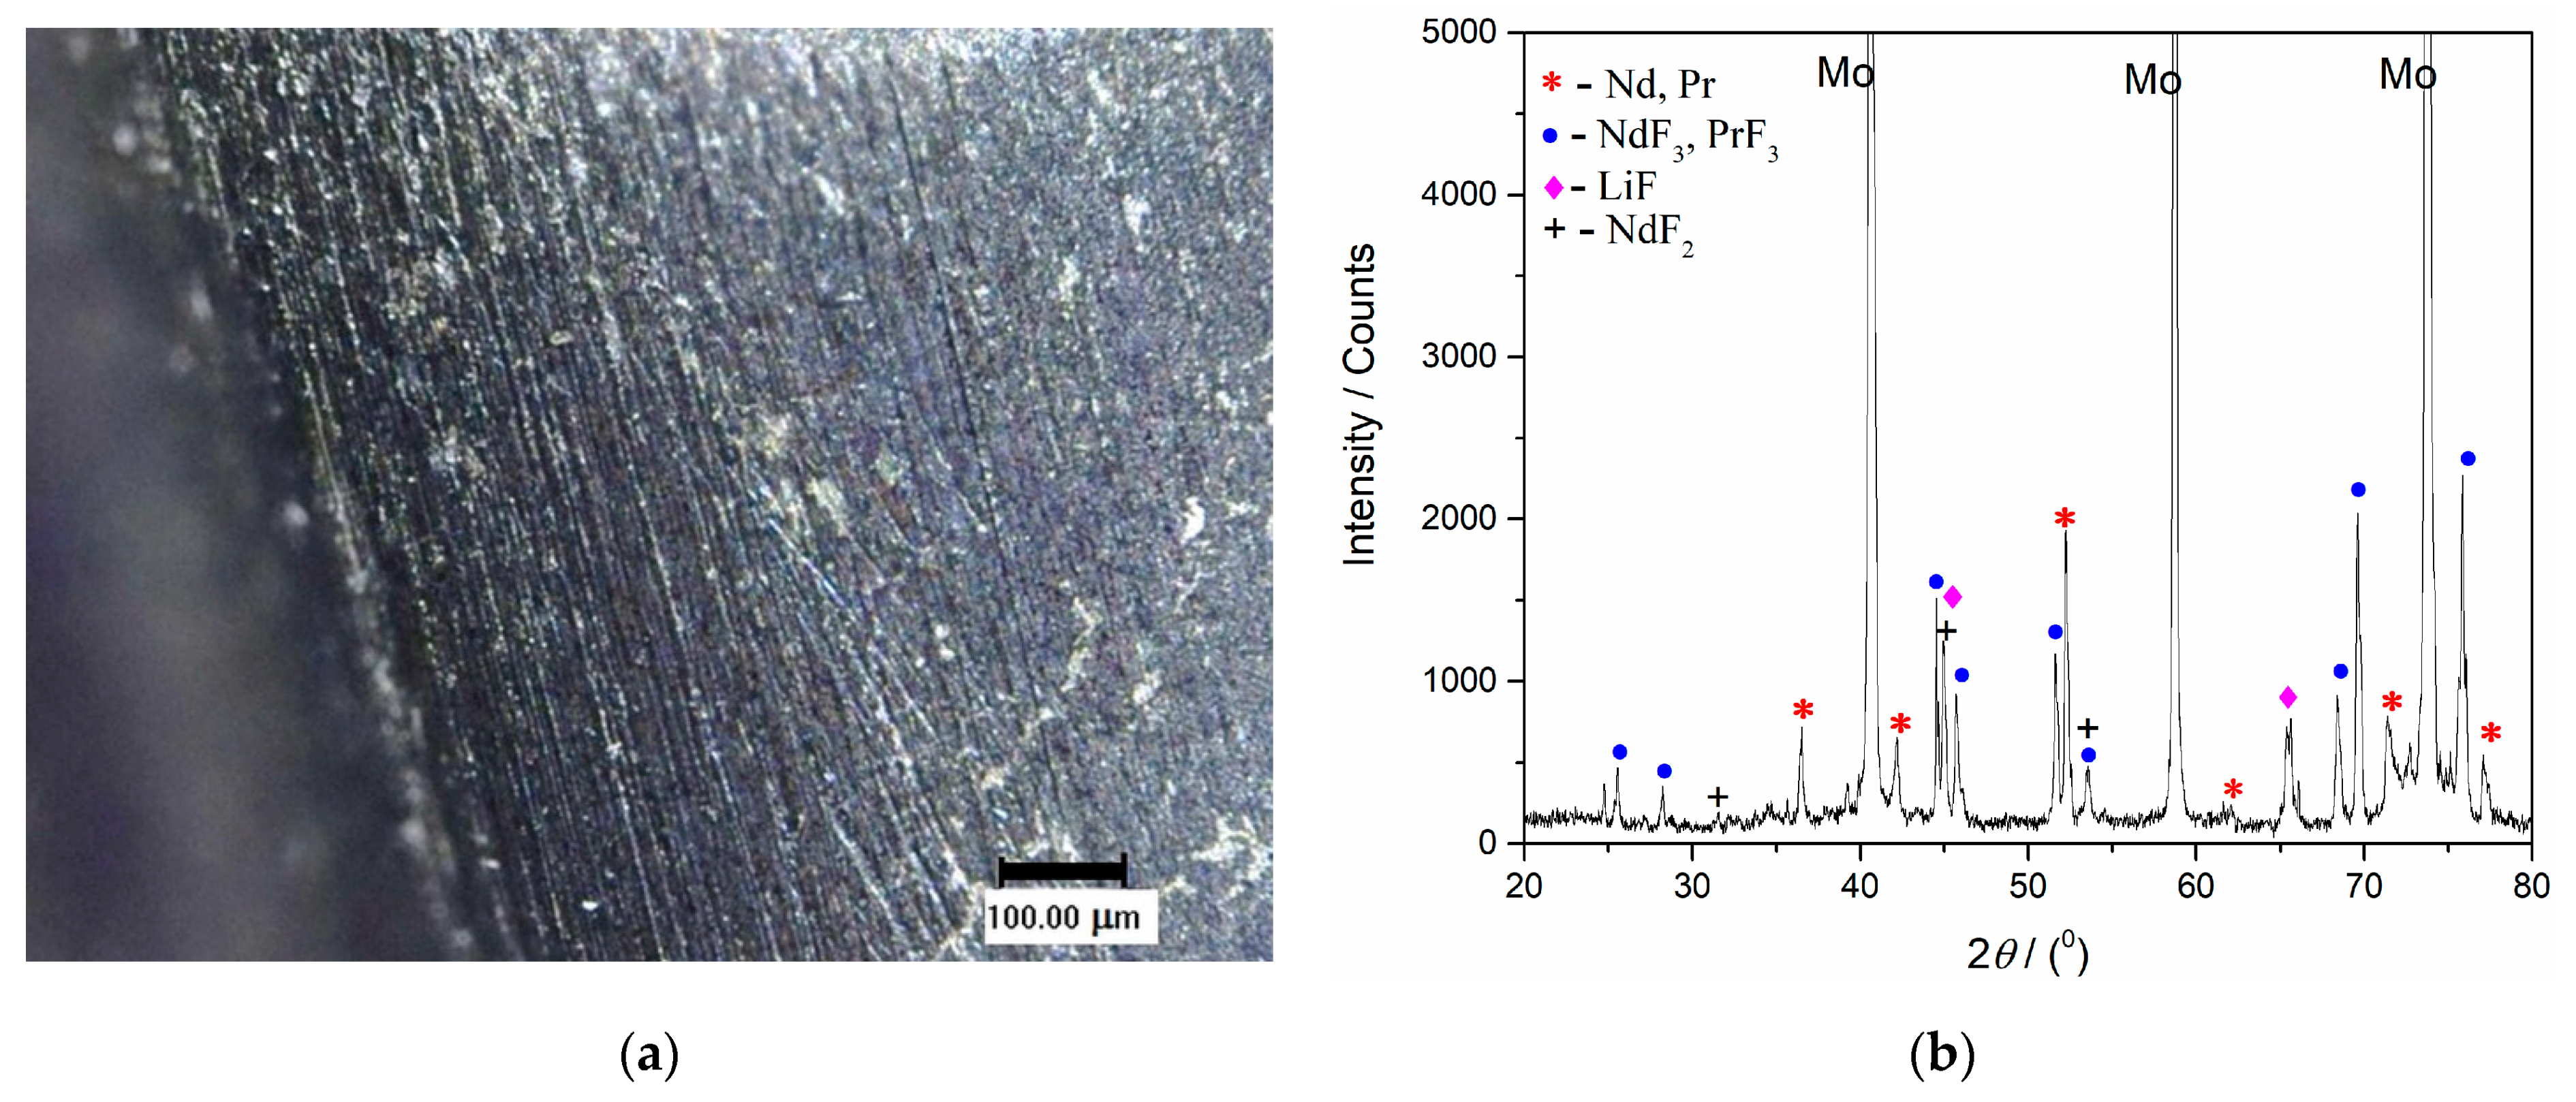
Figure 9. After the deposition ended, a solidified electrolyte film from the Mo working electrode surface was mechanically removed. The film-free surface was then analysed by optical microscopy,
Figure 12a and
Figure 13a, and by XRD,
Figure 12b and
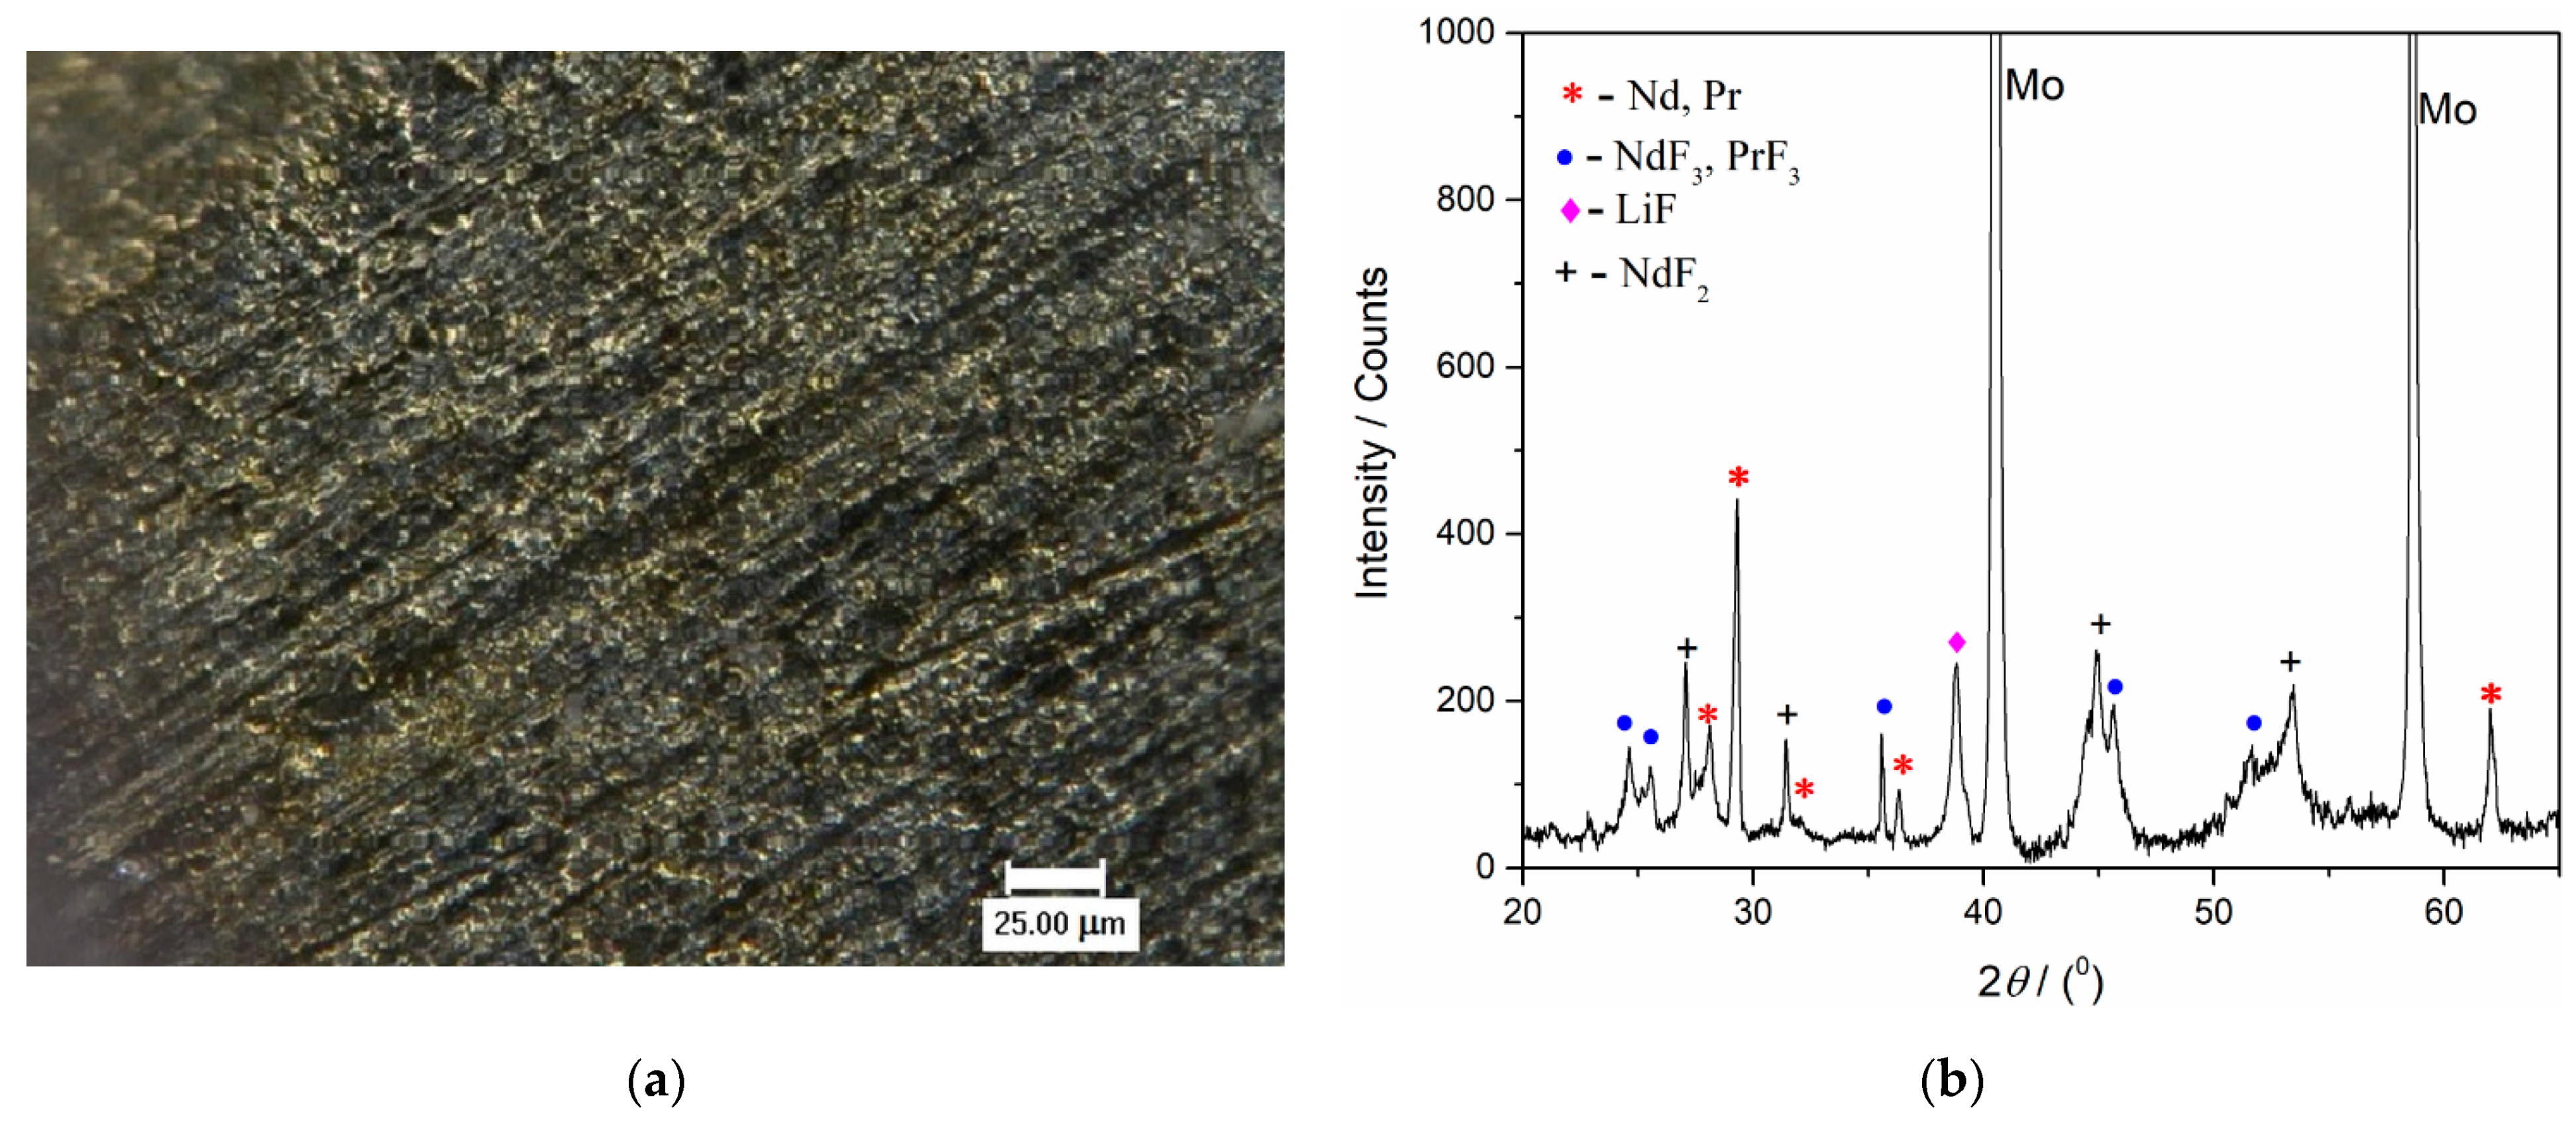
Figure 13b. The scratches observed were remains of the mechanical preparation of the electrode surface.
Figure 12b presents the XRD pattern of the sample obtained after deposition at a constant potential of −0.900 V vs. W for 60 min in molten Electrolyte II. Peaks identified in the diffractogram at 2
θ = 36.40°, 41.83°, 52.37°, 62.37°, 71.75°, 77.33° are attributed to hexagonal Nd [JCPDS No. 03-065-3424], and the peaks with slight variations in 2
θ values, due to very similar lattice parameters of both metals, at 36.27°, 411.89°, 52.14°, 62.16°, 71.45°, 77.01° are characteristic of hexagonal Pr [JCPDS No. 01-089-2921]. The diffraction peaks identified at 2
θ = 25.31°, 28.23°, 44.61°, 45.73°, 51.66°, 53.63°, 68.35°, 68.78°, 75.55°, are characteristic of hexagonal NdF
3 [JCPDS No. 01-078-1859] and hexagonal PrF
3 [JCPDS No. 01-078-1464], respectively. The diffraction peaks recorded at 2
θ = 45.06° and 65.63° belong to face-centered cubic LiF [JCPDS No. 01-072-1538]. The peak at a 2
θ value of 31.47° reflects face-centered cubic NdF
2 and the peaks at around 45.1° and 53.5° can also be ascribed to NdF
2 [JCPDS No. 00-033-0934].
With the XRD patterns presented in
Figure 12b and
Figure 13b, the electrodeposition of Nd and Pr on an inert electrode used was confirmed. However, the presence of NdF
2, NdF
3, PrF
3 and LiF melt residue could not be avoided.
With prolonged deposition time, in addition to those already seen in
Figure 12b, new prominent peaks corresponding to Nd and Pr metals could be seen in the diffractogram in
Figure 13b. They appear at 2
θ values of 28.16°, 29.18°, and 32.06°, which correspond to Nd, and at very similar 2
θ values—28.05°, 29.06°, and 31.94°—corresponding to the Pr metal.
The results of the electrochemical measurements and XRD analysis revealed that the chosen potential at −0.900 V vs. W was cathodic enough to sustain Nd and Pr metal deposition (deposition current density of ≈−6 mAcm
−2) without lithium being co-deposited, see
Figure 12b and
Figure 13b.
Concerning XRD NdF
2 identification, it should be mentioned that very similar results were obtained on the Mo working electrode after potentiostatic electrodeposition from the molten salt NdF
3 + LiF + 2 wt.%Nd
2O
3 electrolyte [
12,
15]. It seems that NdF
2 is formed as a result of disproportionate reaction between Nd metal electrodeposited and Nd(III) ions: Nd(0) + 2Nd(III) → 3Nd(II). These results were also in agreement with the conclusions obtained by some other authors describing neodymium electrodeposition from neodymium oxyfluoride melts, at temperatures close to or above 1323 K [
12,
15,
20].
However, there is also the aspect of ecologically unacceptable gases that could evolve on the working glassy carbon anode during Nd and Pr electrodeposition onto inert Mo or W cathode from used molten salts electrolytes. To make an assessment of this potential result, anodic gases evolved during the controlled potentiostatic electrolysis and electrochemical measurements were analysed in situ by FTIR spectrometer.
Recent literature reports that the formation of greenhouse gasses is influenced by the concentration of REO dissolved in the fluoride electrolyte [
8,
12,
24,
36]. In a molten oxide fluoride electrolyte with a given oxide concentration, where glassy carbon serves as the anode during potentiostatic electrolysis, the generated oxygen species react with the carbon anode and produce mainly CO and CO
2. When the REO concentration drops off, the “anode effect” occurs and perfluorocarbon (PFC) gases such as CF
4 and C
2F
6 are generated, and their greenhouse gas potential is much higher, exceeding 7390 and 12,200 CO
2-equivalents, respectively [
25,
36,
37]. However, it should be noted that the formation of PFC gases occurs at significantly higher anodic potentials than the CO/CO
2 formation [
8]. Thus, for an environmentally friendly electrolytic production of Nd-Pr alloys, apart from the controlled potentiostatic mode, the right amount of RE oxides in the electrolyte is needed in order to avoid the critical conditions for CF
4 and C
2F
6 gas production [
1,
8,
12,
24,
36,
37].
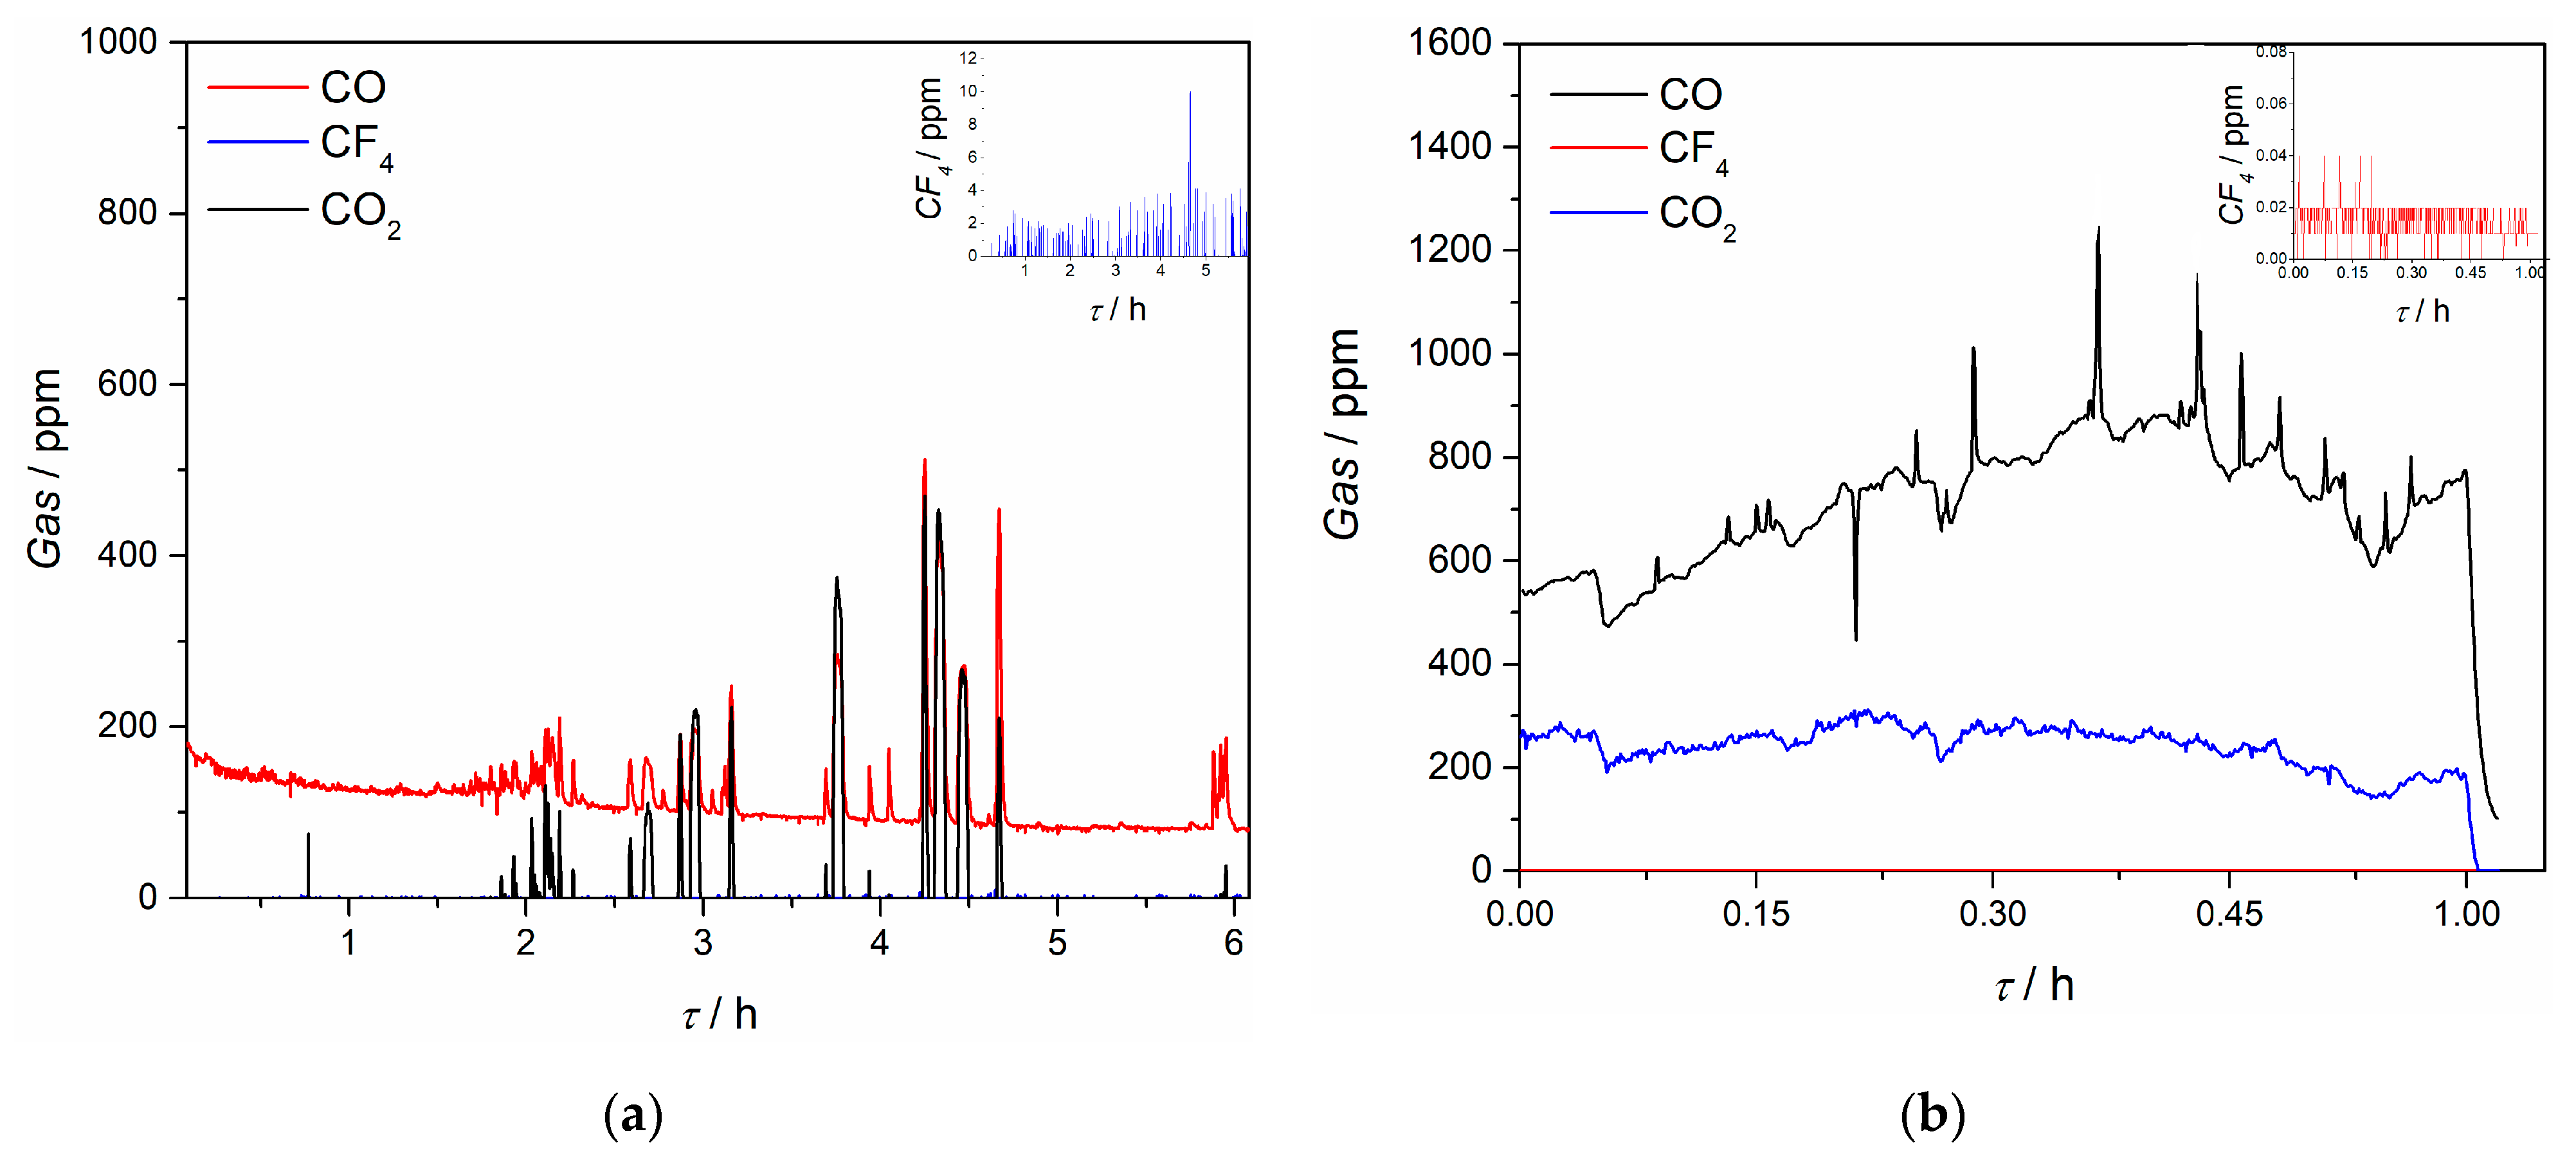
Composition of off-gases during the electrochemical measurements and electrolysis in this work was recorded in situ and ratio and quantity of evolved gases were detected, see
Figure 14. It was noticed that throughout the electrochemical experiments, CO and CO
2 gases were detected, and except for some spikes during replacement of the electrode, the average quantity of CO was below 100 ppm and for CO
2 around 5 ppm. However, during the potentiostatic Pr/Nd deposition, CO quantity evolved was higher, being around 700 ppm on average, with maximum recorded ≈1200 ppm. Evolved quantity of CO
2 was around 200 ppm during the deposition. The results indicate that within the controlled potential range applied, the electrodeposition of Nd/Pr proceeds at the expense of the neodymium and praseodymium oxides [
24]. The anodic working potentials, governed by the applied cathodic potentials were obviously high enough to sustain oxidation processes on the GC anode by oxygen and fluoride ions at longer reaction times, prior to the partial passivation of the anode occurs. Similar observation was reported by other researchers in the field, claiming that only oxygen containing species are taking part in partial passivation and CF
4 emission starts only later at higher anodic potentials [
24].
The quantity of recorded CF
4 was almost negligible; the average values during the electrochemical experiments were below 5 ppm and during the potentiostatic Pr/Nd deposition around 0.02 ppm, which should be attributed to the relatively low applied deposition overpotential (and therefore small anodic overpotential). At the same time, C
2F
6 was not detected under the potential regime applied. According to Zhang et al. [
38], and taking into account the off-gas results obtained during voltammetry measurements in this study, it appears that in the positive scan the PFC gases are being adsorbed on the anode and are forming an insulating layer which reduces the anode oxidation current. During the reverse scan PFC are rapidly desorbed from the graphite anode and the desorption potential is more negative than the adsorption potential, thus reducing the PFC emission to a great extent and keeping the process in a green process window [
38,
39].


 ,
, 


 Nd(III) is reversible and under mixed control, as was shown in the earlier work done in neodymium oxyfluoride melts under very similar conditions [12,15,20]. The relationship presented in Figure 4b is linear for the whole range of the scan rates applied, which made it possible for the number of exchanged electrons in the Nd(II)→Nd(III) reaction to be calculated. The calculation was performed using the equation often employed in electrodeposition studies that defining the slope (K) as a function of log iP = f(EPEAK) and the number of electrons involved in the reaction (z) [12,15,20]. It was found that the slope K of the linear function from Figure 4b was 2.39, and the corresponding electron transfer number therefore should be 1.25, so close to 1. This directly confirmed the oxidation reaction recorded as an oxidation process A1 (Figure 3a) involves one electron exchange in electrochemical oxidation of Nd(II) to Nd(III). Thus, it was confirmed that the redox reaction reflected as a current wave pair C1/A1 was Nd(II)


