Article

Influence of Selected Substrate Dosage on the Process of Biogas Installation Start-Up in Real Conditions

1
Faculty of Civil Engineering and Environmental Sciences, Białystok University of Technology, 15-351 Białystok, Poland
2
Faculty of Civil Engineering, Environmental and Geodetic Sciences, Koszalin University of Technology, 75-453 Koszalin, Poland
3
Regional Waste Recovery Facility in Sianów, 76-004 Sianów, Poland
*
Author to whom correspondence should be addressed.
Energies 2021, 14(18), 5948; https://doi.org/10.3390/en14185948
Submission received: 13 August 2021 / Revised: 7 September 2021 / Accepted: 14 September 2021 / Published: 18 September 2021

Abstract

:
This paper presents an analysis of selected parameters of biogas, formed as a result of methane fermentation, during the start-up of a biogas installation, using water, liquid manure, corn silage and inoculated sludge as substrates. Moreover, the dependencies between the type and amount of the supplied substrate and the obtained parameters of biogas and fermentation mass are presented and explained. During 59 days after the start of the biogas plant operation, the methane content increased to a maximum of about 62%. Finally, after about 80 days, the methane content stabilized at a constant level of about 55%. CO2 content increased from about 6% (day 32) to about 46% (day 84), with a clear linear correlation between carbon dioxide and methane content. Oxygen content decreased from about 18% (day 32) to about 0.3% (day 84) as the resulting gases displaced air from the reactor, and there was also a linear correlation between oxygen and methane content. The hydrogen sulfide content decreased from about 76 ppm (day 32) to about 0 ppm (day 47), after which, in a clear power correlation to the methane content, it maximally increased to 890 ppm (day 61). However, for the sake of safe engine operation, the desulfurization plant was started on day 63, which resulted in a H2S concentration below 50 ppm on day 74 of the experiment. The final hydrogen sulfide content was 9 ppm on day 84 of the biogas plant start-up.

1. Introduction

Renewable energy sources are an important element in the energy balance of a country, being a characteristic of an innovative economy. Biogas plants have been built on an industrial scale in Western Europe since the 1980s, though a sudden increase in the number of installations has occurred only in recent years [1,2]. This is a result of the EU countries making commitments to reduce greenhouse gas emissions and the promotion of renewable energy sources [3,4,5,6]. The total electricity produced from biogas reached 88 TWh in 2017, of which 40% was generated in Germany [7]. In Poland, the first biogas plant was launched in 2005, and in mid-2020 there were 310 biogas plants operating in Poland with a total electrical capacity of 245,148 MW, including only 120 agricultural biogas plants with a total electrical capacity of 101.3 MW. The potential to obtain biogas is estimated at 13–15 billion m3 per year, with 7–8 billion m3 of biomethane per year (in Poland). In comparison, about 19 billion m3 of natural gas is consumed in Poland annually. Undoubtedly, it is justifiable to build increasing numbers of new biogas plants, both agricultural and utilization ones.
In Europe, biogas is mainly produced as a result of the anaerobic digestion of agricultural waste, manure/dung and energy crops [8]. In addition, sludge from sewage treatment plants, the organic fraction of municipal solid waste and solid waste deposited in landfills are possible sources of raw material [9,10]. Biogas is formed in a biological process from organic matter in the absence of oxygen [3,11]. This process, which is widespread in nature, takes place in peat bogs, sea beds, liquid manure and the rumen of ruminants, among other places [12,13,14]. The biodegradable organic matter is almost entirely converted into biogas. In addition, small amounts of new biomass or heat are produced [15,16,17]. The methane fermentation process that results in biogas production consists of four stages. In the first stage (hydrolysis), polymerized insoluble organic compounds (carbohydrates, proteins, fats), are transformed by enzymes of specific strains of hydrolyzing bacteria into soluble monomers and dimers (simple sugars, amino acids, fatty acids) [18]. Hydrolysis of polymers that are difficult to decompose (cellulose, lignins), as well as decomposition-sensitive fats, proteins and carbohydrates, is assumed to be the phase that limits the fermentation rate [19,20]. The second stage (acidogenesis) is the acidification phase during which predominant acidogenic bacteria convert chemicals dissolved in water (also hydrolysis products) to short-chain organic acids, alcohols, aldehyde, carbon dioxide and hydrogen. During acidogenesis the total amount of organic substance (expressed as COD) remains unchanged, and its breakdown into different types of simple organic compounds takes place [4,6,15,20]. In the third stage (acetogenesis), specialized types of bacteria convert higher organic acids to acetic acid, carbon dioxide and hydrogen, which are substrates that can be converted to methane. In the fourth stage (methanogenesis), methane is produced by methanogenic bacteria. According to stoichiometric dependencies, it has been determined that almost 70% of methane is produced by acetate reduction: CH3COOH → CH4 + CO2. Few bacterial species can produce methane from this substrate, while almost all known methanogenic bacteria are able to produce methane from hydrogen and carbon dioxide: 4H2 + CO2 → CH4 + 2H2O. The stages of hydrolysis and acidogenesis are closely linked; they are called “acid fermentation” because the resulting products are acids (hydrogen, carbon dioxide, ethyl alcohol, and acetic, butyric, lactic, propionic and valerian acids). The stages of acetogenesis and methanogenesis responsible for the production of methane, called “methanogenic fermentation”, are also related [21]. Hence, there is often a reference to a two-stage process of anaerobic conversion of organic matter [22]. The fermentation process functions best when the rate of decomposition of organic matter in the acidic and methane-fermentation stages is the same. A decrease in the rate of acidic fermentation results in a reduction in methanogenic bacteria substrates and, consequently, a decrease in methane production [4,6,23].
Different biogas plant start-up and operating conditions have a significant impact on biogas production potential. In order to achieve optimal biogas efficiency at the lowest cost, several parameters of the independent variables must be controlled, especially temperature, pH value, retention time and the organic matter load, all of which have a direct impact on microbial activity. On the other hand, the physical properties of the raw material can vary in terms of toxic substance content; nevertheless, it can also influence microbial activity [24].
In practical terms, the concept of activating a biogas plant is interpreted in different ways. Some experts believe that a biogas installation start-up is the time it takes for the installation to achieve the planned performance parameters (electric and thermal power) [25]. Other experts, on the other hand, consider biogas start-up to be the time it takes to turn on a generator [26]. Regardless of the approach, it is most economically beneficial if the start-up time is as short as possible [5,6,12,27].
This publication presents a real-scale study of a biogas plant start-up located in Poland, in particular an analysis of selected parameters of biogas produced by methane fermentation using water, liquid manure, corn silage and inoculated sludge as substrates. Moreover, the dependencies between the type and amount of supplied substrate and the obtained parameters of biogas and fermentation mass are presented.

2. Materials and Methods

The technological system consists of a dispenser, to which solid substrates are fed in the form of corn silage and manure/dung for their initial grinding and mixing [4,6]. Then, the substrates are directed to the fermenter by means of screw feeders. The installation is also equipped with a buffer tank to which liquid substrates, i.e., liquid manure and sewage sludge, are delivered by means of sanitation transport. In the buffer tank, substrates are initially mixed and homogenized, and the pH and temperature are stabilized. Then, the substrates are sequentially directed to the fermenter via a pumping pipeline. In this case, the pumping system consists of three independent pumps working alternately, which, with an extensive network of pipelines and gate valves, allow for any combination of pumping between tanks. In the technological system, the phenomenon of methane fermentation occurs in two primary fermentation tanks, each with an active volume of about 3500 m3 [4,6]. As is most common in Germany [28], in these chambers, the substrates under mesophilic conditions (at 38 °C) are subjected to mixing by four propeller mixers, providing an increase in microbial metabolism and improving the stability of the anaerobic process. In addition, they support the upward flow of gas bubbles from the biodegradable material at a high total content of solids [28,29,30] and reduce the formation of sludge at the bottom of the fermentation chambers; as a result, they provide the highest available volume for the anaerobic digestion process and minimize the need for chamber cleaning [31]. The capacity of the fermentation tanks allows a retention time of over 100 days. This time ensures substrate degassing, which, according to German data, is about 90 days. The system also has a secondary fermentation tank with an active volume of approximately 3500 m3, where at a process temperature of 38 °C the retention time is approximately 70 days (estimated substrate volume after the fermentation process is approximately 55 t/d). The secondary fermentation tank increases the retention time of the material and is additionally used as a fermentation residue tank during the winter season. The fermentation process is realized by a cascade method. The gas storage time is about 7 h. Biogas is stored in membrane tanks located above the primary and secondary fermentation tanks from where it is transported for treatment and further to the cogenerators, which produce electricity of about 1000 kW and heat of about 1100 kW. The digestion residue from the secondary fermentation tank can be used for agricultural purposes, but can also be directed to a dewatering station and further to a compositing process. [4,6,11,14] The digestion residue is subjected to liming for microbiological hygienization and then stored on concrete slabs. The liquid residue, on the other hand, is directed back into the process as a source of bacterial flora that accelerates the methane fermentation process. Since the used substrates are characterized by low sulfur content, the desulfurization is carried out using the air method. Nevertheless, in order to increase the safety of the cogenerators and the flexibility of the plant operation, a desulphurization node was provided in the system, in the process of adsorption with granular activated carbon. The cooled and cleaned biogas is combusted in cogeneration units. About 90% of the electricity goes to the external grid, and about 10% is used by the biogas plant for its own needs. As reported in the literature [32,33], this value slightly exceeds the most common upper limit, which varies on average between 4.9 and 9.3%. The heat is used for the process itself, and the surplus is sold to a neighboring industrial plant.
The technology is a hermetic process and thus does not generate odors.
The total solids or dry matter content of the biodegradable substrate is highly connected to the feedstock. According to Nsair, these values play a crucial role in determining the fermentation technology (dry or wet fermentation), the reactor design, as well as the stirring technology [24]. The wet fermentation process occurs at a dry matter content of less than 15%, while dry fermentation takes place at higher DM values. According to Nsair, the dry matter content of the biodegradable feedstock is a critical factor in controlling Bingham viscosity and yield stress [24]. According to Aboudi [34] and Dhar [35], the biogas formation potential might be dependent on the dry matter content of the biodegradable feedstock.
Most large-scale biogas plants operate in wet fermentation conditions, where the dry matter content is less than 12%. In order to launch the presented installation, the following materials were used: water, corn silage (32% d.m.), a mixture of pig and cattle liquid manure (8% d.m.) and, in order to quickly expand in the fermentation chambers and significantly accelerate the methane-fermentation process, inoculum sludge (10% d.m.), which served as a medium for the proper bacterial flora. The inoculated sludge came from the secondary fermentation tank of an operating biogas plant, which used liquid manure, corn silage, manure/dung and food-processing waste as substrates during normal operation.
The amounts of methane (CH4) (%), carbon dioxide (CO2) (%), oxygen (O2) (%) and hydrogen sulphide (H2S) (ppm) were analyzed in biogas. Monitoring of selected biogas parameters was conducted using a Binder Combimass GA-m Version 2012-03 mobile gas analyzer [36,37]. Sampling was performed directly from the biogas storage (membrane roof). Monitoring of selected parameters of the digestion mass consisted of measuring volatile fatty acids (VFAs) (mg HAceq/dm3), total inorganic carbon (TIC) (mg CaCO3/dm3) and pH. Monitoring was carried out using a PRONOVA Analysentechnik GmbH & Co KG FOS/TAC 2000 analyzer [38]. Samples were taken directly from the fermenter.

3. Results and Discussion

At the initial stage of biogas plant start-up (until day 11), due to the maximum height of installed coils (2.6 m), the fermenter was filled with liquid substrates in the form of a mixture of water and liquid manure to the level of 2.8 m. Only after the coils were completely covered with the mixture did the slow heating of the fermentation mass begin.
According to Jabłoński [39] and Nsair [24], it can be observed that the highest number of microorganism species is observed under mesophilic conditions (32 to 42 °C) and especially at around 37 °C, so the final temperature value in the fermenter is 38 °C. According to several studies reviewed, it was concluded that temperature fluctuations should be avoided [13,24,39]. The temperature inside the fermenter affects not only the microorganisms but also the reaction kinetics [40], so obtaining the final temperature value should be conducted in several steps. The temperature increase in the heated fermentation mass could not be more than 2 °C/day. Due to the resulting thermal tension of the concrete, the temperature of the medium in the coils (supply temperature) could not exceed the difference of 20 °C. After four days of heating the fermentation mass from 9.2 °C to 17 °C, filling the tank with water to the 4.3 m level was resumed without stopping the slow heating of the fermenter. Around day 30, after bringing the fermentation mass to a temperature of 33 °C, adding inoculated sludge was initiated (Figure 1).
Raising the temperature in the fermenter to above 30 °C was determined by the temperature of the imported inoculated sludge, which was just about 30 °C. The inoculated sludge that was imported from the post-fermentation tank of another biogas plant had an original temperature of approximately 38 °C; however, it was cooled during transportation. On the one hand, too large a drop in temperature would be detrimental to the methanogenic bacteria in the sludge [41]. On the other hand, increasing the temperature leads to an increase in the enzymatic activity of the microorganisms. Nevertheless, exceeding these specified optimal temperatures can lead to an inhibition of enzymatic reactions [39,42,43]. Moreover, according to the literature, for mesophilic conditions, temperature variations of more than ±3 °C should be avoided during the day. [24] In the case of the analyzed biogas plant, as of day 38, the temperature in the reactor chamber was stable and equal to 38 °C (Figure 2A).
According to Nsair [24], hydraulic retention time (HRT) is one of the determining parameters for the volume of the reactor, which defines the remaining time of the feedstock until it is discharged.
HRT = VR V−1 (d)
where VR is the digester volume (m3) and V is the substrate volumetric feed rate in the reactor, daily (m3 d−1).
According to Nsair [24], optimum biogas production can be obtained at different HRTs, depending on the substrate used. Various HRTs were assessed in the literature to find the optimum values for the different substrates. The adopted HRT varied from 0.75 to 60.00 days. The optimum HRT was suggested to be in the range of 16 to 60 days [44,45,46,47,48,49]. According to Schmidt, in order to prevent washouts of microorganisms required for the process, HRT should not be less than 10 to 25 days [48]. In the conducted experiment, the HRT coefficient ranged from 11 to 297 during the initial start-up period, reached a value of 60 on day 66 and stabilized from day 72 of reactor operation at a value of about 30 (Figure 2B).
In the first batch, 270 m3 of inoculated sludge was added to the fermenter over a period of four days. On the next day (day 32), after the first dose of inoculated sludge was introduced, the biogas composition (CH4, CO2, O2, H2S) examination was initiated (Figure 3 and Figure 4). The content of individual gases was on average: CH4 = 3.4%, CO2 = 5.9%, O2 = 18.2%, H2S = 78 ppm. At this stage, the production of methane, carbon dioxide and hydrogen sulfide was still low. By this time, these gases were formed by fermentation of previously supplied liquid manure in a volume of about 800 m3 and by further fermentation of the introduced inoculated sludge. In contrast, the high oxygen content was caused by the presence of a large amount of atmospheric air in the fermenter. According to Nsair [24], strictly anaerobic microorganism groups of acetogens and methanogens can be affected by an oxygen leak in the reactor, which can lead to inhibition. Both experimental and simulation results of the study conducted by Botheju and the coauthors [50] showed that an increase in the oxygen loads caused a decrease in methane potential. More than 0.1 mg L−1 of oxygen concentration caused an inhibition of obligate anaerobic methanogenic archaea [51,52]. At that time, the nitrogen content of the biogas in the fermenter was about 73%.
In the following days, the fermentation mass was heated to a presumed temperature of 38 °C and stirred to distribute the bacteria in the inoculated sludge throughout the whole tank. During the 10 days in which no substrate was introduced, the biogas composition changed, reaching the following gas contents on day 45: CH4 = 6.9%, CO2 = 8.1%, O2 = 16.9%, H2S = 3 ppm. There was an increase in the percentage concentration of methane and carbon dioxide, and a decrease in the percentage concentration of oxygen and the content of hydrogen sulfide. The change in the content of the analyzed gases was due to the increasing production of biogas, displacing atmospheric air from the tank, and was indicative of the gradual multiplication of bacteria.
Over the next few days (up to day 48), a second batch of substrates was fed into the tank: 280 m3 of inoculated sludge, and on days 48 to 49, corn silage was added (5 tons in total). As a result, the biogas composition improved significantly, and on day 52 (before the introduction of the next batch of substrates) the content of individual gases was: CH4 = 32.2%, CO2 = 19.5%, O2 = 8.5%, H2S = 26 ppm. There was an increase in methane, carbon dioxide and hydrogen sulfide, and a decrease in oxygen. This improvement in biogas composition was due to the addition of a significant amount of methanogenic bacteria contained in the inoculated sludge and the supply of corn silage, a carrier of protein and carbohydrates that provide nutrients for the microorganisms, to the chamber on day 48.
In the following days (up to day 56), the third batch of 200 m3 of substrates was supplied, which contained 175 m3 of inoculated sludge and 25 t of corn silage. In addition, from day 59, continuous adding of corn silage began, starting with a small mass (from 7 t/d) and gradually increasing (to 27 t/d from day 76). Simultaneously, liquid manure was introduced into the reactor at a volume of 9 m3/d (five portions per week).
To ensure safe operation of the engine, methane should constitute a minimum of 50% of the biogas volume. [24] Based on the research, it can be stated that the biogas on day 54, in terms of methane concentration, reached a value allowing it to be burned in generators, i.e., CH4 = 56.6%. For these conditions, biogas has an average low calorific value (LCV) 10 MJ kg−1 [51] and a high combustion value (NCV) 20 ÷ 21 MJ kg−1 [53,54,55]. The other contents of the studied gases were, respectively: CO2 = 32%, O2 = 2.6%, H2S = 310 ppm. For the sake of reliability of measurements, the biological desulphurization by aerobic method installation was not in operation at the time of measurements. At the initial stage of bioreactor start-up, the volume of biogas produced is relatively small and, as a result, does not ensure continuous operation of the generator, so the biogas is combusted in batches in gas flares. During the study, the highest value of hydrogen sulfide concentration of 890 ppm was recorded on day 61. For safe engine operation, the hydrogen sulfide concentration should be less than 200 ppm (preferably less than 50 ppm). [24] The desulfurization plant was started on day 62, which resulted in a H2S concentration below 50 ppm on day 75 of the experiment (Figure 4B). On day 75, the first cogeneration unit was also started.
On the basis of the graphs presented in Figure 3 and Figure 4, it can be concluded that there is a correlation between the change in the values of methane and carbon dioxide (Figure 5A) and oxygen (Figure 5B).
According to Weiland [29], the composition of the input determines, among other things, the content of volatile solids inside the reactor; thus, on day 55 of the research, an analysis of the fermentation mass was started (Figure 6). Zhang [56] and Voß [57] report that usually biogas plants operate in the pH range of 6.5 to 8.4. In the analyzed biogas plant, the pH value remained constant in the range of 7.0 to 7.2. However, as the mass of added corn silage increased, so did the rate of biogas production. The methane concentration stabilized at 54–62%. The value of fermentation mass indicator expressed as a quotient of volatile fatty acids (VFAs) (mg HAceq/dm3) and total inorganic carbon (TIC) (mg CaCO3/dm3) increased from 0.18 to 0.34 (on day 70) and tended to stabilize at a constant level in the range of 0.3–0.5.
As a result of an increase in corn silage dosage from 20 t/d to 31 t/d (from day 70 to 75), an increase in the value of fermentation mass expressed as a VFAs/TIC ratio was observed, from 0.34 to 0.62. According to Hamzah [58], an increase in the concentration of VFAs reduces biogas production and stability due to a decrease in pH, which can cause toxicity in anaerobic digestion. Considering the value of the VFAs/TIC ratio, which should range from 0.3 to 0.5, the corn silage dosage was reduced to 27 t/d from day 76 of the research. Then, until day 84, the dosage of this substrate was maintained at 27 t/d to stabilize the value of the VFAs/TIC quotient. A recommended fermentation mass ratio value below 0.5 was found from day 80 of the experiment (VFAs/TIC = 0.43).

4. Conclusions

Based on the results of the analysis performed during the start-up of the industrial-scale biogas plant using water, liquid manure, corn silage and inoculated sludge, it can be concluded that:
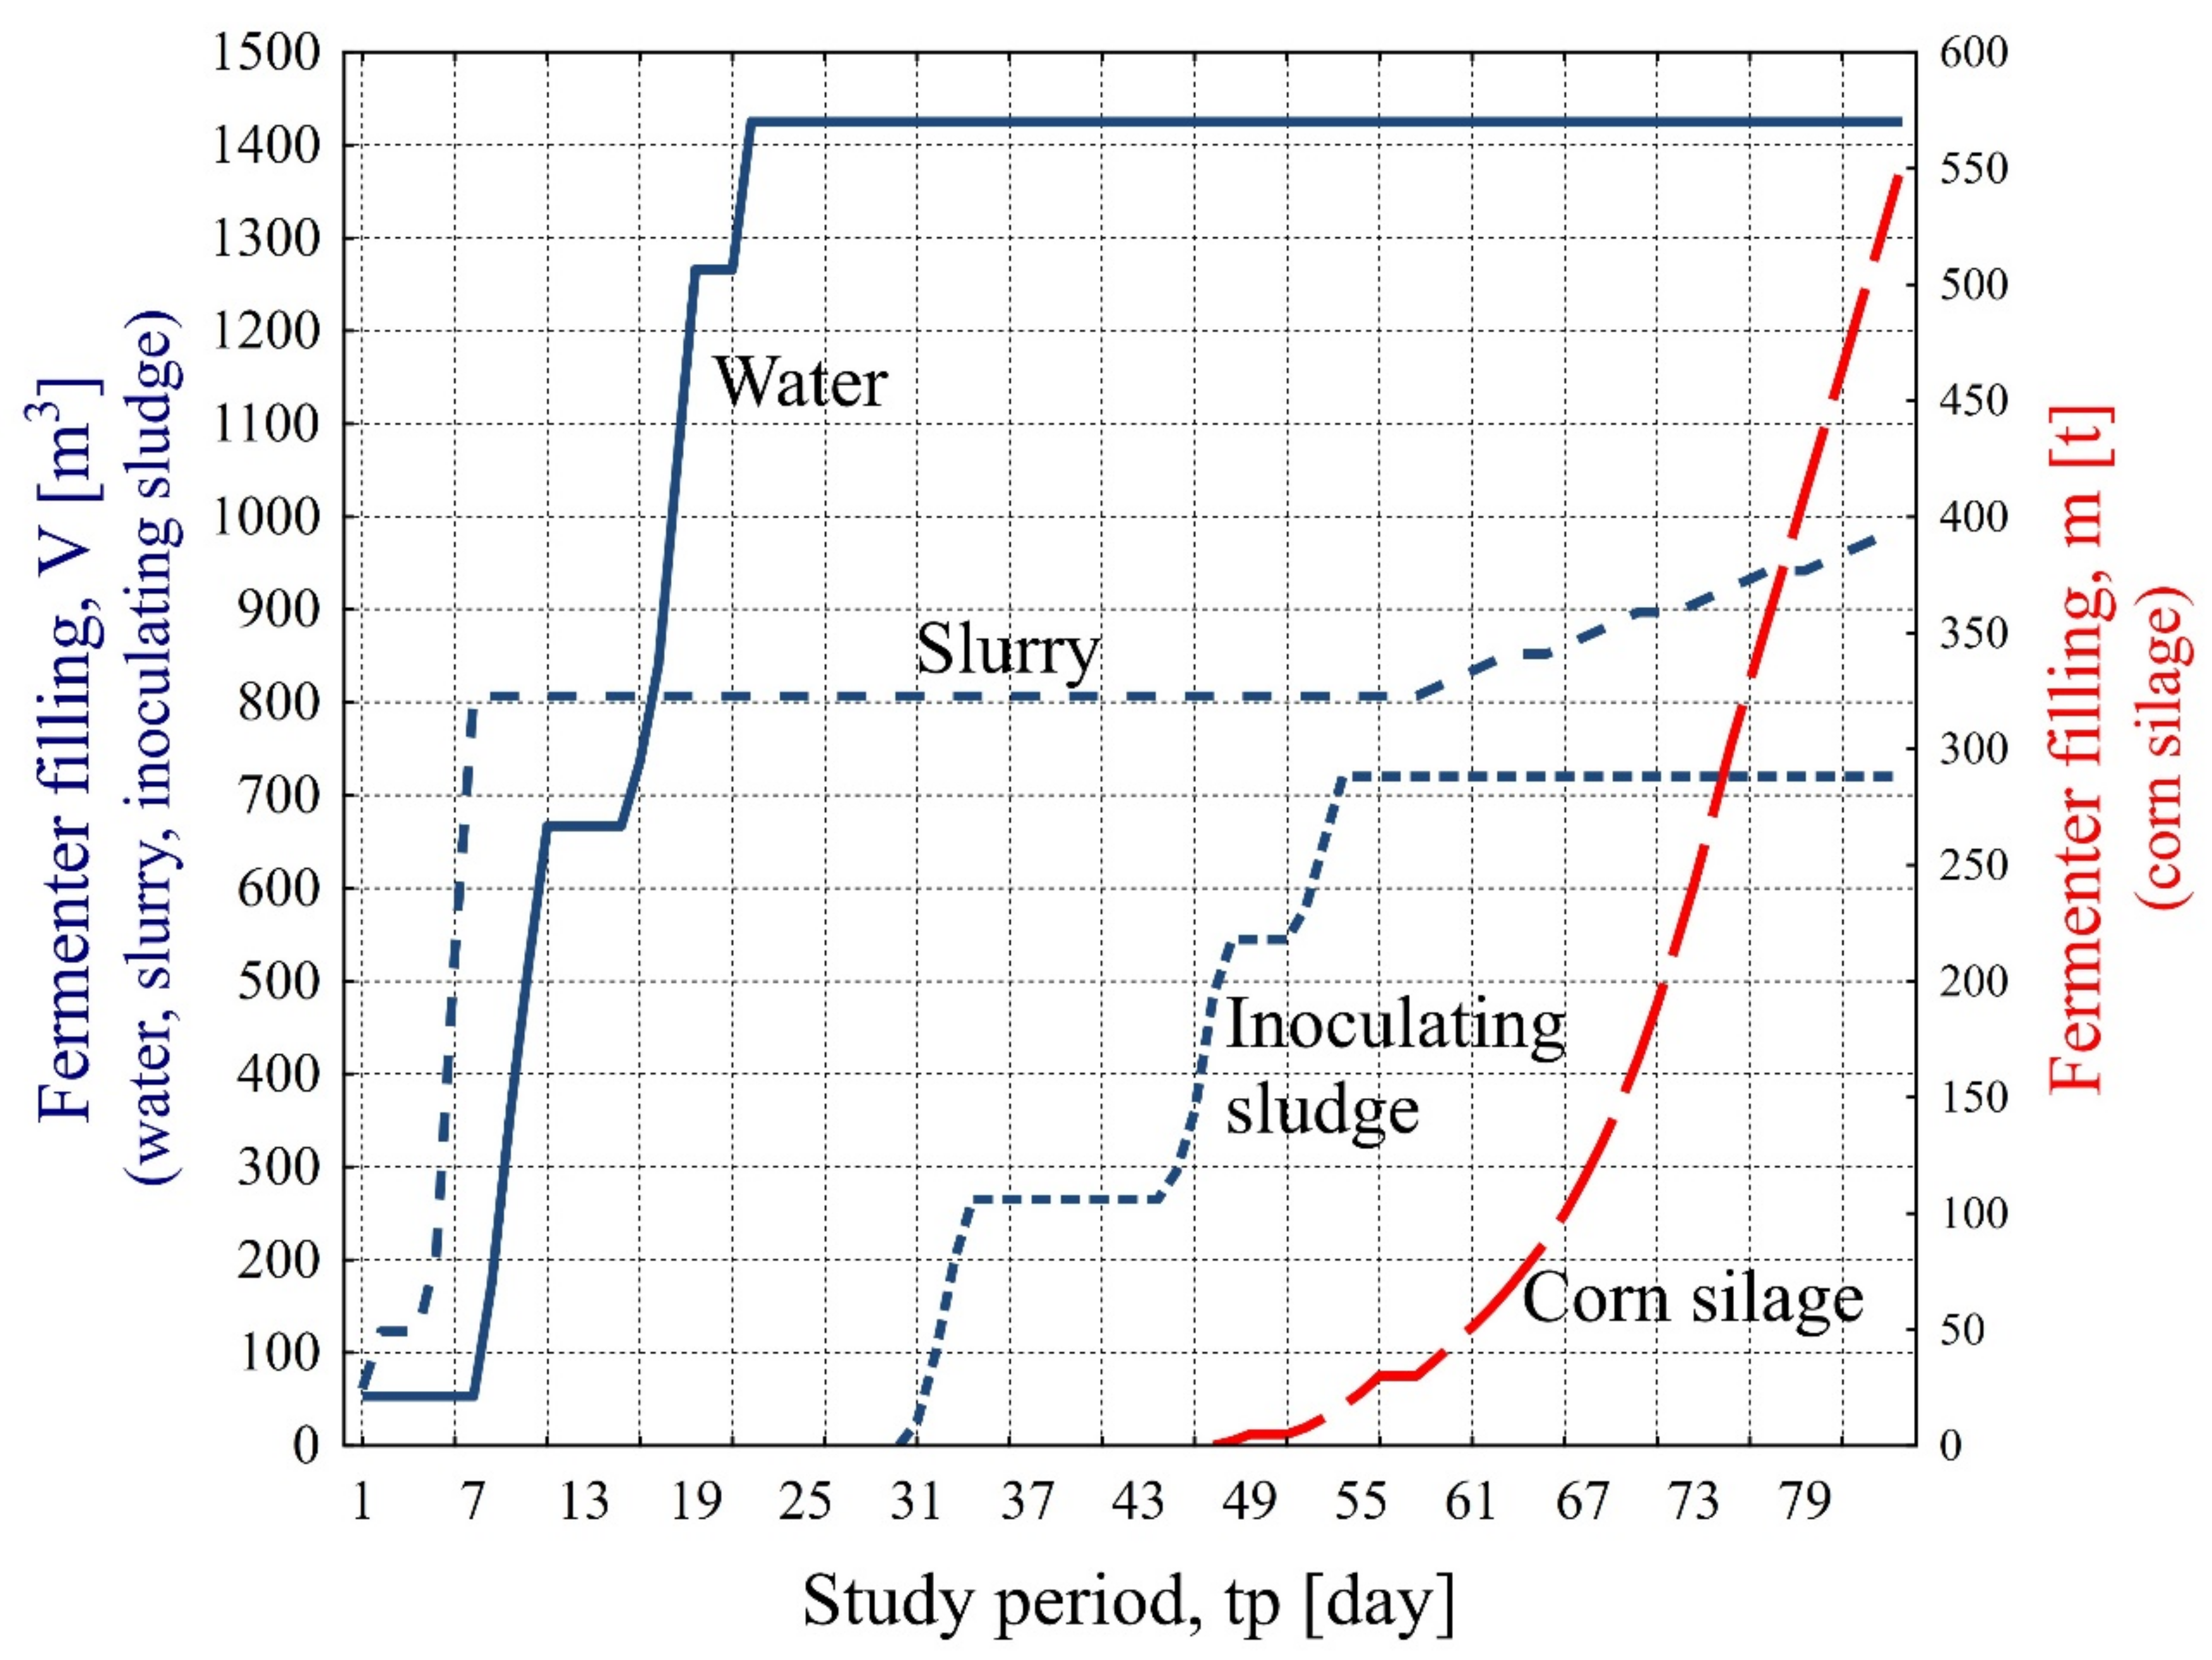
  • The dosage of substrates in the form of corn silage as a source of protein and carbohydrates, providing a nutrient for methanogenic bacteria located in the inoculated sludge, results in the acceleration of the fermentation process and faster achievement of proper biogas parameters.
  • The recommended reactor temperature of 38 °C for mesophilic conditions was safely reached on day 38 of the biogas plant start-up.
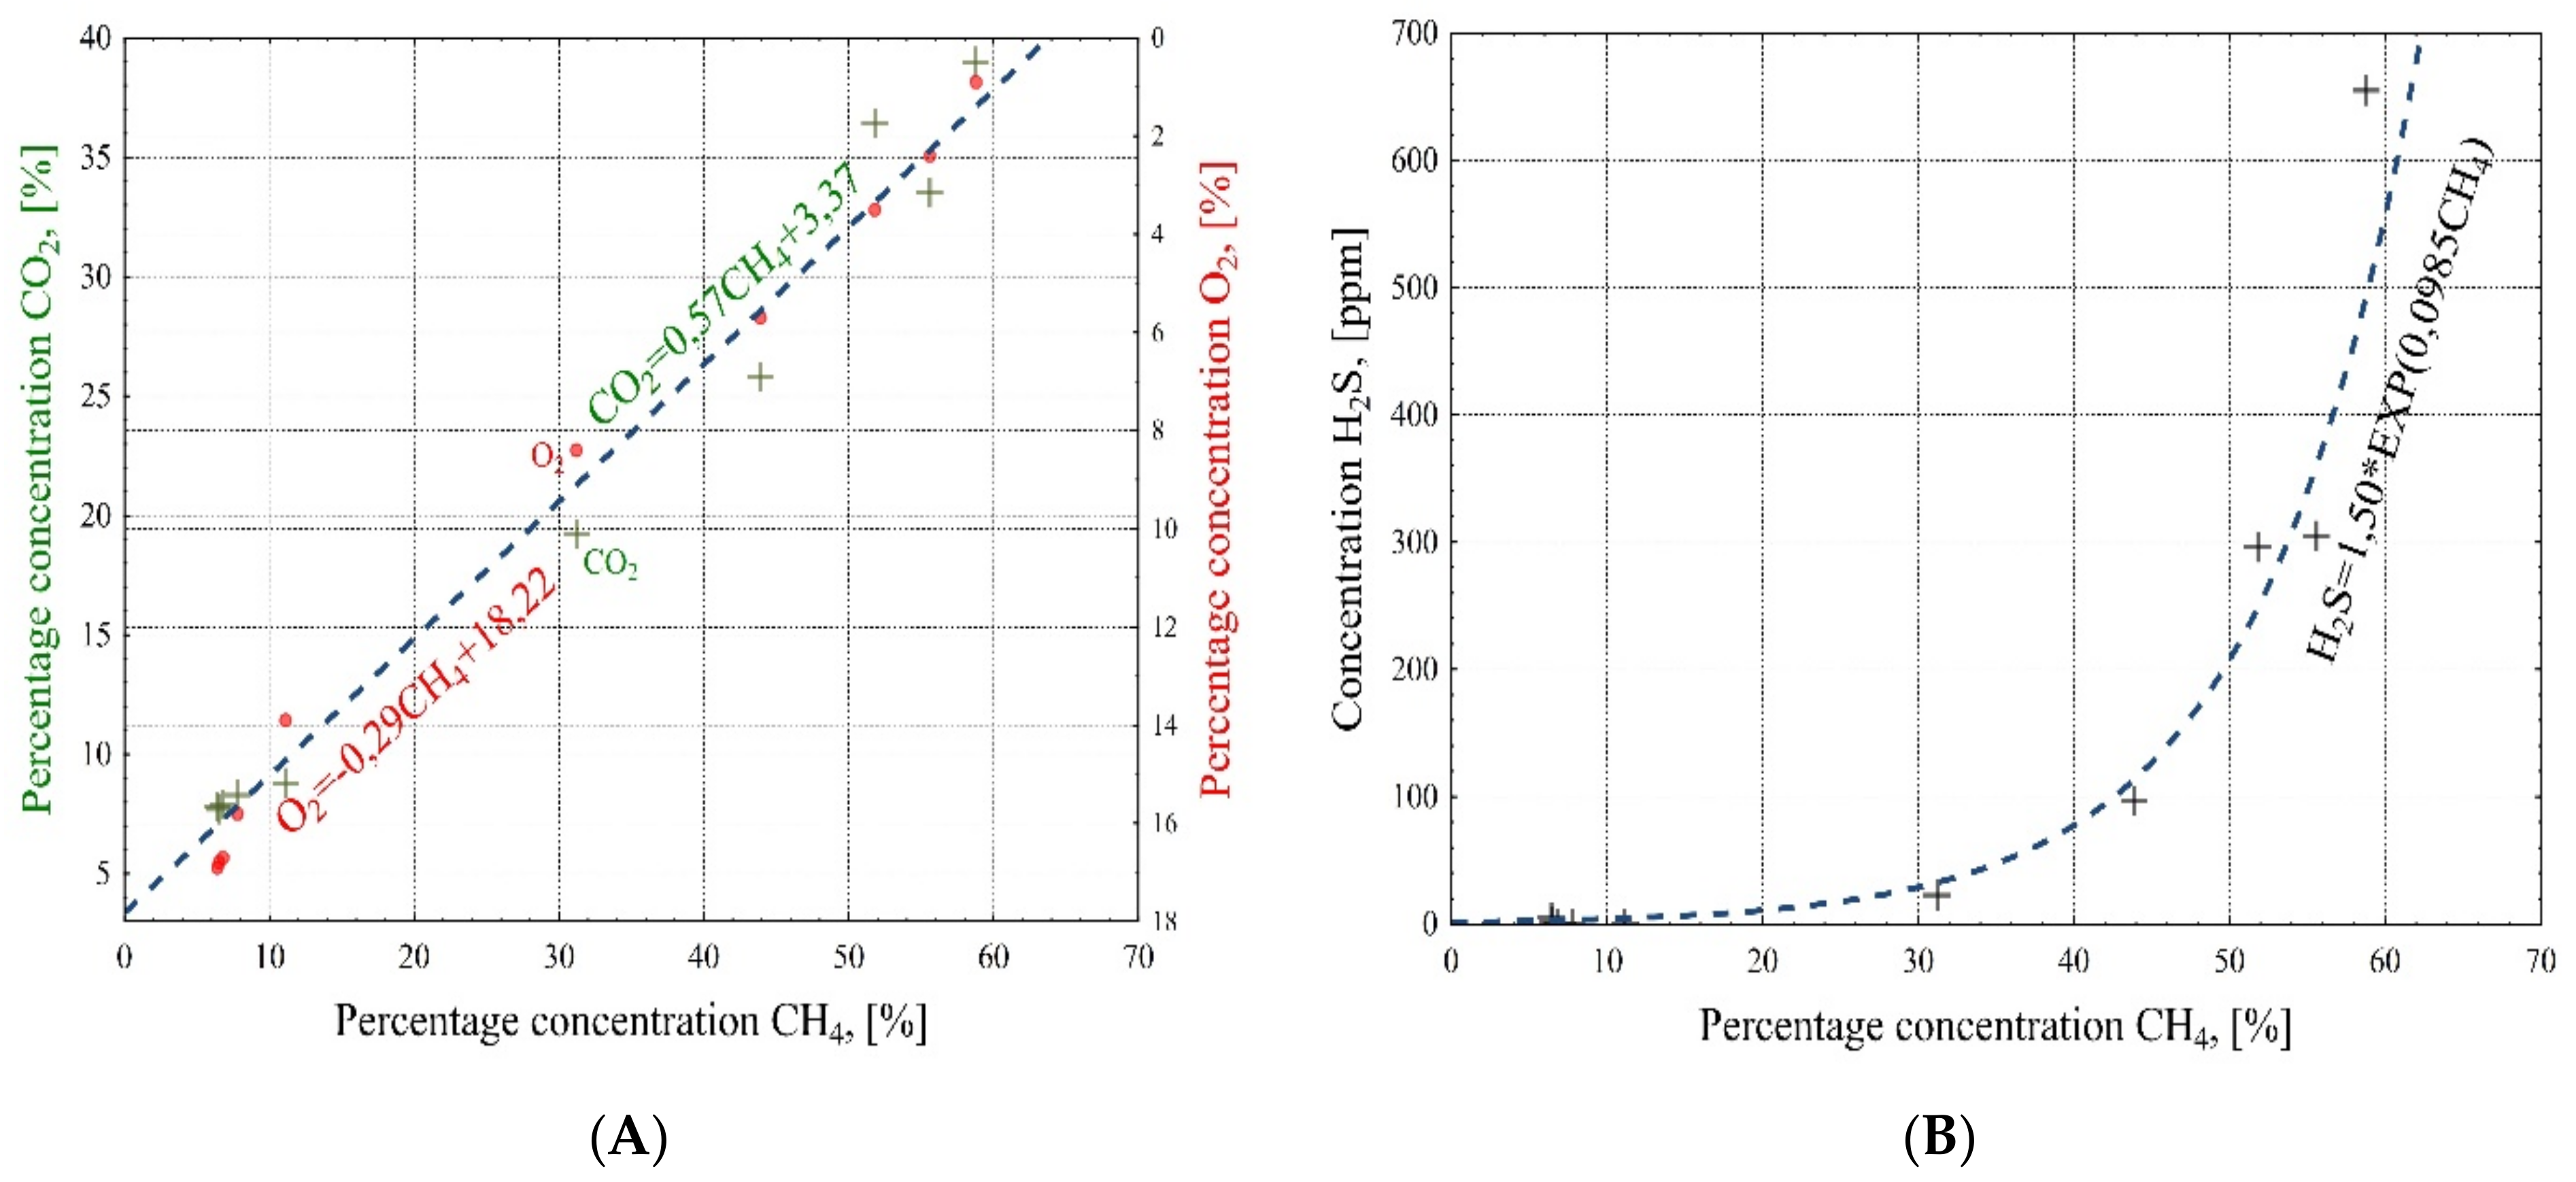
  • On day 59 after the start of the biogas plant operation, the methane content increased to a maximum of about 62%. Finally, after about 80 days, the methane content stabilized at a constant level of about 55%.
  • Carbon dioxide content increased from about 6% (day 32) to about 46% (day 84), with a clear linear correlation between carbon dioxide and methane content.
  • The oxygen content decreased from about 18% (day 32) to about 0.3% (day 84) as the resulting gases displaced air from the reactor, and there was also a linear correlation between oxygen and methane content.
  • The hydrogen sulfide content decreased from about 76 ppm (day 32) to about 0 ppm (day 47), after which, in a clear power correlation to the methane content, it maximally increased to 890 ppm (day 61). However, for the sake of safe engine operation, the desulfurization plant was started on day 63, which resulted in a hydrogen sulfide concentration below 50 ppm on day 74 of the experiment. The final hydrogen sulfide content was 9 ppm on day 84 of the biogas plant start-up.
  • As the mass of added corn silage increased, so did the fermentation mass index value, expressed as the VFA/TIC ratio. The adjustment of the corn silage dosage from 31 t/d to 27 t/d, applied on the 76th day after the start-up of the biogas plant, resulted in stabilization of the VFA/TIC value at a constant level of about 0.35.
  • In order to guarantee the correct operation of the biogas plant, a comprehensive monitoring system is required, which will ensure increased efficiency and sustainable operation of the reactors through information about the parameter values of the resulting variables.

Author Contributions

Conceptualization—P.K. and K.I.; methodology—J.P.; investigation—P.K., K.I. and J.P.; supervision—J.P. and K.I.; formal analysis—P.K. and K.I.; validation—J.P.; writing—original draft, J.P.; writing—review and editing—K.I., J.P. and P.K. All authors have read and agreed to the published version of the manuscript.

Funding

The research was carried out within the framework of thesis no. W/WB-IIŚ/2/2021 at the Bialystok University of Technology and was financed from the research subsidy granted by the Minister of Education and Science.

Institutional Review Board Statement

Not applicable.

Informed Consent Statement

Not applicable.

Data Availability Statement

Not applicable.

Conflicts of Interest

The authors declare no conflict of interest.

References

  1. Ahmad, S.; Razzaq, S.; Rehan, M.A.; Hashmi, M.A.; Ali, S.; Amjad, M.S.; Mehmood, U. Experimental Investigation of Novel Fixed Dome Type Biogas Plant using Gas Recovery Chamber in Rural Areas of Pakistan. Int. J. Renew. Energy Res. 2019, 9, 1537–1547. [Google Scholar]
  2. Csikos, N.; Schwanebeck, M.; Kuhwald, M.; Szilassi, P.; Duttmann, R. Density of Biogas Power Plants as An Indicator of Bioenergy Generat-ed Transformation of Agricultural Landscapes. Sustainability 2019, 9, 11. [Google Scholar]
  3. Kilic, M.K.; Abut, N.; Kilic, F.C.; Eyidoğan, M.; Kaya, D. An examination of measuring and control systems in an industrial biogas plant in turkey. Int. J. Ecosyst. Ecol. Sci. 2019, 9, 11–16. [Google Scholar] [CrossRef]
  4. Kogut, P.; Piekarski, J.; Dąbrowski, T.; Kaczmarek, F. Biogas Production Plants as a Method of Utilisation of Sewage Sludge in Relation to the Polish Legislation. Rocz. Ochr. Sr. 2012, 14, 534–545. [Google Scholar]
  5. Yu, Q.; Li, H.; Deng, Z.; Liao, X.; Liu, X.; Liu, J. Comparative assessment on two full-scale food waste treatment plants with different anaer-obic digestion processes. J. Clean. Prod. 2020, 263, 121625. [Google Scholar] [CrossRef]
  6. Kogut, P.; Piekarski, J.; Ignatowicz, K. Start-up of Biogas Plant with Inoculating Sludge Application. Rocz. Ochr. Sr. 2014, 16, 534–545. [Google Scholar]
  7. Refai, S. Development of Efficient Tools for Monitoring and Improvement of Biogas Production. Ph.D. Thesis, Universitäts-und Landesbibliothek Bonn, Bonn, Germany, 2016. [Google Scholar]
  8. Sarker, S.; Lamb, J.J.; Hjelme, D.R.; Lien, K.M. A Review of the Role of Critical Parameters in the Design and Operation of Biogas Production Plants. Appl. Sci. 2019, 9, 1915. [Google Scholar] [CrossRef] [Green Version]
  9. Stolze, Y.; Bremges, A.; Maus, I.; Pühler, A.; Sczyrba, A.; Schlüter, A. Targeted in situ metatranscriptomics for selected taxa from mesophilic and thermophilic biogas plants. Microb. Biotechnol. 2017, 11, 667–679. [Google Scholar] [CrossRef] [PubMed] [Green Version]
  10. Heerenklage, J.; Rechtenbach, D.; Atamaniuk, I.; Alassali, A.; Raga, R.; Koch, K.; Kuchta, K. Development of a method to produce standardised and storable inocula for biomethane potential tests-Preliminary steps. Renew. Energy 2019, 143, 753–761. [Google Scholar] [CrossRef]
  11. Jarrar, L.; Ayadi, O.; Al, A.J. Techno-economic Aspects of Electricity Generation from a Farm Based Biogas Plant. J. Sustain. Dev. Energy Water Environ. Syst. 2020, 8, 476–492. [Google Scholar] [CrossRef] [Green Version]
  12. Ervasti, S.; Vainio, M.; Tampio, E. Use of local resources as co-substrates in a farm-scale biogas plant. Open Agric. 2019, 4, 650–660. [Google Scholar] [CrossRef]
  13. Uddin, M.E.; Larson, R.A.; Wattiaux, M.A.E. Efects of dairy cow breed and dietary forage on greenhouse gas emissions from manure during storage and after field application. J. Clean. Prod. 2020, 270, 122–461. [Google Scholar] [CrossRef]
  14. Wattiaux, M.A.; Uddin, M.E.; Letelier, P.; Jackson, R.D.; Larson, R.A. Invited Review: Emission and mitigation of greenhouse gases from dairy farms: The cow, the manure, and the field. Appl. Anim. Sci. 2019, 35, 238–254. [Google Scholar] [CrossRef]
  15. Xue, B.; Wang, L.; Yan, T. Methane emission inventories for enteric fermentation and manure management of yak, buffalo and dairy and beef cattle in China from 1988 to 2009. Agric. Ecosyst. Environ. 2014, 195, 202–210. [Google Scholar] [CrossRef]
  16. Ignatowicz, K. Occurrence Study of Agro-Chemical Pollutants in Waters of Supraśl Catchment. Arch. Environ. Prot. 2009, 35, 69–77. [Google Scholar]
  17. Piñas, J.A.V.; Venturini, O.J.; Silva Lora, E.E.; del Olmo, O.A.; Calle Roalcaba, O.D. An economic holistic feasibility assessment of centralized and decentralized biogas plants with mono-digestion and co-digestion systems. Renew. Energy 2019, 139, 40–51. [Google Scholar] [CrossRef]
  18. Lenort, R.; Stas, D.; Wicher, P.; Holman, D.; Ignatowicz, K. Comparative Study of Sustainable Key Performance Indicators in Metallurgical Industry. Rocz. Ochr. Sr. 2017, 19, 36–51. [Google Scholar]
  19. Wang, Y.; Zhang, W.; Dong, H.; Zhu, Z.; Li, B. Performance Evaluation of a Large-Scale Swine Manure Mesophilic Biogas Plant in China. Trans. ASABE 2017, 60, 1713–1720. [Google Scholar] [CrossRef]
  20. Puchlik, M.; Ignatowicz, K.; Dąbrowski, W. Influence of bio-preparation on wastewater purification process in constructed wetlands. J. Ecol. Eng. 2015, 16, 159–163. [Google Scholar] [CrossRef] [Green Version]
  21. Appels, L.; Lauwers, J.; Degrève, J.; Helsen, L.; Lievens, B.; Willems, K.A.; Van Impe, J.; Dewil, R. Anaerobic digestion in global bio-energy production: Potential and research challenges. Renew. Sustain. Energy Rev. 2011, 15, 4295–4301. [Google Scholar] [CrossRef]
  22. Ibrahim, U.M.; Ahmed, S.I.; Gutti, B.; Muhammad, I.M.; Hamza, U.D.; Ibrahim, M.D. Biogas Production from Combined Irish Potato and Poultry Wastes: Optimization and Kinetic Studies. Int. J. Eng. Technol. 2018, 7, 170–176. [Google Scholar] [CrossRef] [Green Version]
  23. Han, Y.; Green, H.; Tao, W. Reversibility of propionic acid inhibition to anaerobic digestion: Inhibition kinetics and micro-bial mechanism. Chemosphere 2020, 255, 126840. [Google Scholar] [CrossRef]
  24. Nsair, A.; Onen Cinar, S.; Alassali, A.; Abu Qdais, H.; Kuchta, K. Operational Parameters of Biogas Plants: A Review and Evaluation Study. Energies 2020, 13, 3761. [Google Scholar] [CrossRef]
  25. Gattermann, H.; Kaltschmitt, M.; Niebaum, A.; Schattauer, A.; Scholwin, F.; Weiland, P. Biogaserzeugung und-Nutzung; Institut fur Energetik und Umwelt gGMBH: Leipzig, Germany, 2006. [Google Scholar]
  26. Jin, Y.; Wen, J.; Nie, Y.; Chen, H.; Wang, G. Biomass-biogas recycling technique studies of municipal food waste disposal. Rocz. Ochr. Środowiska 2012, 14, 21–55. [Google Scholar]
  27. Piekutin, J.; Puchlik, M.; Haczykowski, M.; Dyczewska, K. The Efficiency of the Biogas Plant Operation Depending on the Substrate Used. Energies 2021, 14, 3157. [Google Scholar] [CrossRef]
  28. Lemmer, A.; Naegele, H.-J.; Sondermann, J. How Efficient are Agitators in Biogas Digesters? Determination of the Efficiency of Submersible Motor Mixers and Incline Agitators by Measuring Nutrient Distribution in Full-Scale Agricultural Biogas Digesters. Energies 2013, 6, 6255–6273. [Google Scholar] [CrossRef] [Green Version]
  29. Weiland, P. Biogas production: Current state and perspectives. Appl. Microbiol. Biotechnol. 2009, 85, 849–860. [Google Scholar] [CrossRef]
  30. Wiedemann, L.; Conti, F.; Janus, T.; Sonnleitner, M.; Zörner, W.; Goldbrunner, M. Mixing in Biogas Digesters and Development of an Artificial Substrate for Laboratory-Scale Mixing Optimization. Chem. Eng. Technol. 2016, 40, 238–247. [Google Scholar] [CrossRef]
  31. Last, S. The Anaerobic Digestion Biofuels Blog. Available online: https://blog.anaerobic-digestion.com/digester-cleaning-services/ (accessed on 28 January 2019).
  32. Nsair, A.; Cinar, S.Ö.; Abu-Qdais, H.; Kuchta, K. Optimizing the performance of a large-scale biogas plant by controlling stirring process: A case study. Energy Convers. Manag. 2019, 198, 111931. [Google Scholar] [CrossRef]
  33. Frey, J.; Grüssing, F.; Nägele, H.-J.; Oechsner, H. Cutting the electric power consumption of biogas plants: The impact of new technologies. Landtechnik. Agric. Eng. 2013, 68, 58–63. [Google Scholar]
  34. Aboudi, K.; Álvarez-Gallego, C.J.; García, L.I.R. Semi-continuous anaerobic co-digestion of sugar beet byproduct and pig manure: Effect of the organic loading rate (OLR) on process performance. Bioresour. Technol. 2015, 194, 283–290. [Google Scholar] [CrossRef] [PubMed]
  35. Dhar, H.; Kumar, P.; Kumar, S.; Mukherjee, S.; Vaidya, A.N. Effect of organic loading rate during anaerobic digestion of municipal solid waste. Bioresour. Technol. 2016, 217, 56–61. [Google Scholar] [CrossRef]
  36. Żyłka, R.; Dąbrowski, W.; Malinowski, P.; Karolinczak, B. Modeling of Electric Energy Consumption during Dairy Wastewater Treatment Plant Operation. Energies 2020, 13, 3769. [Google Scholar] [CrossRef]
  37. Bindergroup Measurement & Control. Available online: http://www.bindergroup.info/binder/downloads/EN/BIDE-M-D-COMBIMASS-GA-m-EN-R08-Datenblatt-COMBIMASS-GA-m.pdf (accessed on 16 September 2021).
  38. Alternative Energies Solution. Available online: http://www.alternative-energies.fr/site/wp-content/uploads/2012/07/FOS-TAC-2000-EN.pdf (accessed on 16 September 2021).
  39. Jabłoński, S.; Rodowicz, P.; Łukaszewicz, M.; Ski, S.J.J.O.; Lukaszewicz, M. Methanogenic archaea database containing physiological and biochemical characteristics. Int. J. Syst. Evol. Microbiol. 2015, 65, 1360–1368. [Google Scholar] [CrossRef] [PubMed]
  40. Mondal, C.; Biswas, G.K. Effect of Temperature on Kinetic Constants in Anaerobic Bio-digestion. Chitkara Chem. Rev. 2013, 1, 19–28. [Google Scholar] [CrossRef]
  41. Adekunle, K.F.; Okolie, J.A. A Review of Biochemical Process of Anaerobic Digestion. Adv. Biosci. Biotechnol. 2015, 6, 205–212. [Google Scholar] [CrossRef] [Green Version]
  42. Hans, B. Enzyme Kinetics Principles and Methods; Wiley Vch Valag: Weinheim, Germany, 2008. [Google Scholar]
  43. Caballero-Arzápalo, N. Untersuchungen zum Anaeroben Abbauprozess Ausgewählter Abfallsubstrate mit Hilfe Spezieller Mikroorganismen und Enzyme; Technische Universität München: Munich, Germany, 2015. [Google Scholar]
  44. Li, C.; Champagne, P.; Anderson, B.C. Biogas production performance of mesophilic and thermophilic anaerobic co-digestion with fat, oil, and grease in semi-continuous flow digesters: Effects of temperature, hydraulic retention time, and organic loading rate. Environ. Technol. 2013, 34, 2125–2133. [Google Scholar] [CrossRef]
  45. Kaosol, T.; Sohgrathok, N. Influence of Hydraulic Retention Time on Biogas Production from Frozen Seafood Wastewater Using Decanter Cake as Anaerobic Co-digestion Material. Int. J. Environ. Ecol. Eng. 2012, 6, 303–307. [Google Scholar]
  46. Dareioti, M.A.; Kornaros, M. Anaerobic mesophilic co-digestion of ensiled sorghum, cheese whey and liquid cow manure in a two-stage CSTR system: Effect of hydraulic retention time. Bioresour. Technol. 2015, 175, 553–562. [Google Scholar] [CrossRef] [PubMed]
  47. Dareioti, M.A.; Kornaros, M. Effect of hydraulic retention time (HRT) on the anaerobic co-digestion of agro-industrial wastes in a two-stage CSTR system. Bioresour. Technol. 2014, 167, 407–415. [Google Scholar] [CrossRef]
  48. Schmidt, T.; Ziganshin, A.M.; Nikolausz, M.; Scholwin, F.; Nelles, M.; Kleinsteuber, S.; Pröter, J. Effects of the reduction of the hydraulic retention time to 1.5 days at constant organic loading in CSTR, ASBR, and fixed-bed reactors—Performance and methanogenic community composition. Biomass Bioenergy 2014, 69, 241–248. [Google Scholar] [CrossRef]
  49. Shi, X.-S.; Dong, J.-J.; Yu, J.-H.; Yin, H.; Hu, S.-M.; Huang, S.-X.; Yuan, X.-Z. Effect of Hydraulic Retention Time on Anaerobic Digestion of Wheat Straw in the Semicontinuous Continuous Stirred-Tank Reactors. BioMed Res. Int. 2017, 2017, 2457805. [Google Scholar] [CrossRef] [PubMed]
  50. Botheju, D. Oxygen Effects in Anaerobic Digestion—A Review. Open Waste Manag. J. 2011, 4, 1–19. [Google Scholar] [CrossRef] [Green Version]
  51. Rohstoffe, F.N. Guide to Biogas from Production to Use; Federal Ministry of Food, Agriculture and Consumer Protection: Gülzow, Germany; Fachagentur Nachwachsende Rohstoffe e. V. (FNR): Gülzow, Germany, 2012.
  52. Ioelovich, M. Recent findings and the energetic potential of plant biomass as a renewable source of biofuels—A review. Bio. Resour. 2015, 10, 1879–1914. [Google Scholar]
  53. Ahring, B.K.; Sandberg, M.; Angelidaki, I. Volatile fatty acids as indicators of process imbalance in anaerobic digestors. Appl. Microbiol. Biotechnol. 1995, 43, 559–565. [Google Scholar] [CrossRef]
  54. Agrahari, R.P.; Tiwari, G.N. The Production of Biogas Using Kitchen Waste. Int. J. Energy Sci. 2013, 3, 408. [Google Scholar] [CrossRef]
  55. Achinas, S.; Achinas, V.; Euverink, G.J.W. A Technological Overview of Biogas Production from Biowaste. BioRixv 2017, 3, 299–307. [Google Scholar] [CrossRef]
  56. Zhang, C.; Su, H.; Baeyens, J.; Tan, T. Reviewing the anaerobic digestion of food waste for biogas production. Renew. Sustain. Energy Rev. 2014, 38, 383–392. [Google Scholar] [CrossRef]
  57. Voß, E. Prozessanalyse und Optimierung von Landwirtschaftlichen Biogasanlagen. Ph.D. Thesis, Institut für Siedlungswasserwirtschaft und Abfalltechnik, Hanover, Germany, 2015. [Google Scholar]
  58. Hamzah, M.A.F.; Jahim, J.M.; Abdul, P.M.; Asis, A.J. Investigation of Temperature Effect on Start-Up Operation from Anaerobic Digestion of Acidified Palm Oil Mill Effluent. Energies 2019, 12, 2473. [Google Scholar] [CrossRef] [Green Version]
Figure 1. Filling of the fermenter V [m3] depending on the duration of the start-up of the biogas installation tp [day] using water, corn silage, a mixture of pig and cattle liquid manure and inoculated sludge.
Energies 14 05948 g001
Figure 2. Variation in temperature (T) (°C) (A) and hydraulic retention time (HRT) (day) (B) as a function of operating time from the start of the biogas plant tp (day) using water, corn silage, a mixture of pig and cattle liquid manure and inoculated sludge.
Energies 14 05948 g002
Figure 3. Changes in the percentage concentration of methane (CH4) (%) (A) and carbon dioxide (CO2) (%) (B) depending on the duration of biogas installation start-up tp (day).
Energies 14 05948 g003
Figure 4. Change in the values of oxygen (O2) percentage concentration (%) (A) and hydrogen sulfide (H2S) concentration (ppm) (B) depending on the duration of biogas installation start-up tp (day).
Energies 14 05948 g004
Figure 5. Correlation between the values of the indicators of percent methane (CH4) concentration with percent oxygen (O2) concentration (%) and percent carbon dioxide (O2) concentration (%) (A) with hydrogen sulfide (H2S) concentration (ppm) (B).
Energies 14 05948 g005
Figure 6. Graph of the change in the ratio of volatile fatty acids (VFAs) (mg HAceq/dm3) and total inorganic carbon (TIC) (mg CaCO3/dm3) depending on the duration of biogas plant start-up using inoculated sludge.
Energies 14 05948 g006
Publisher’s Note: MDPI stays neutral with regard to jurisdictional claims in published maps and institutional affiliations.

