
Highly Sensitive and Ecologically Sustainable Reversed-Phase HPTLC Method for the Determination of Hydroquinone in Commercial Whitening Creams


 , and
, and
Abstract
1. Introduction
2. Materials and Methods
2.1. Materials
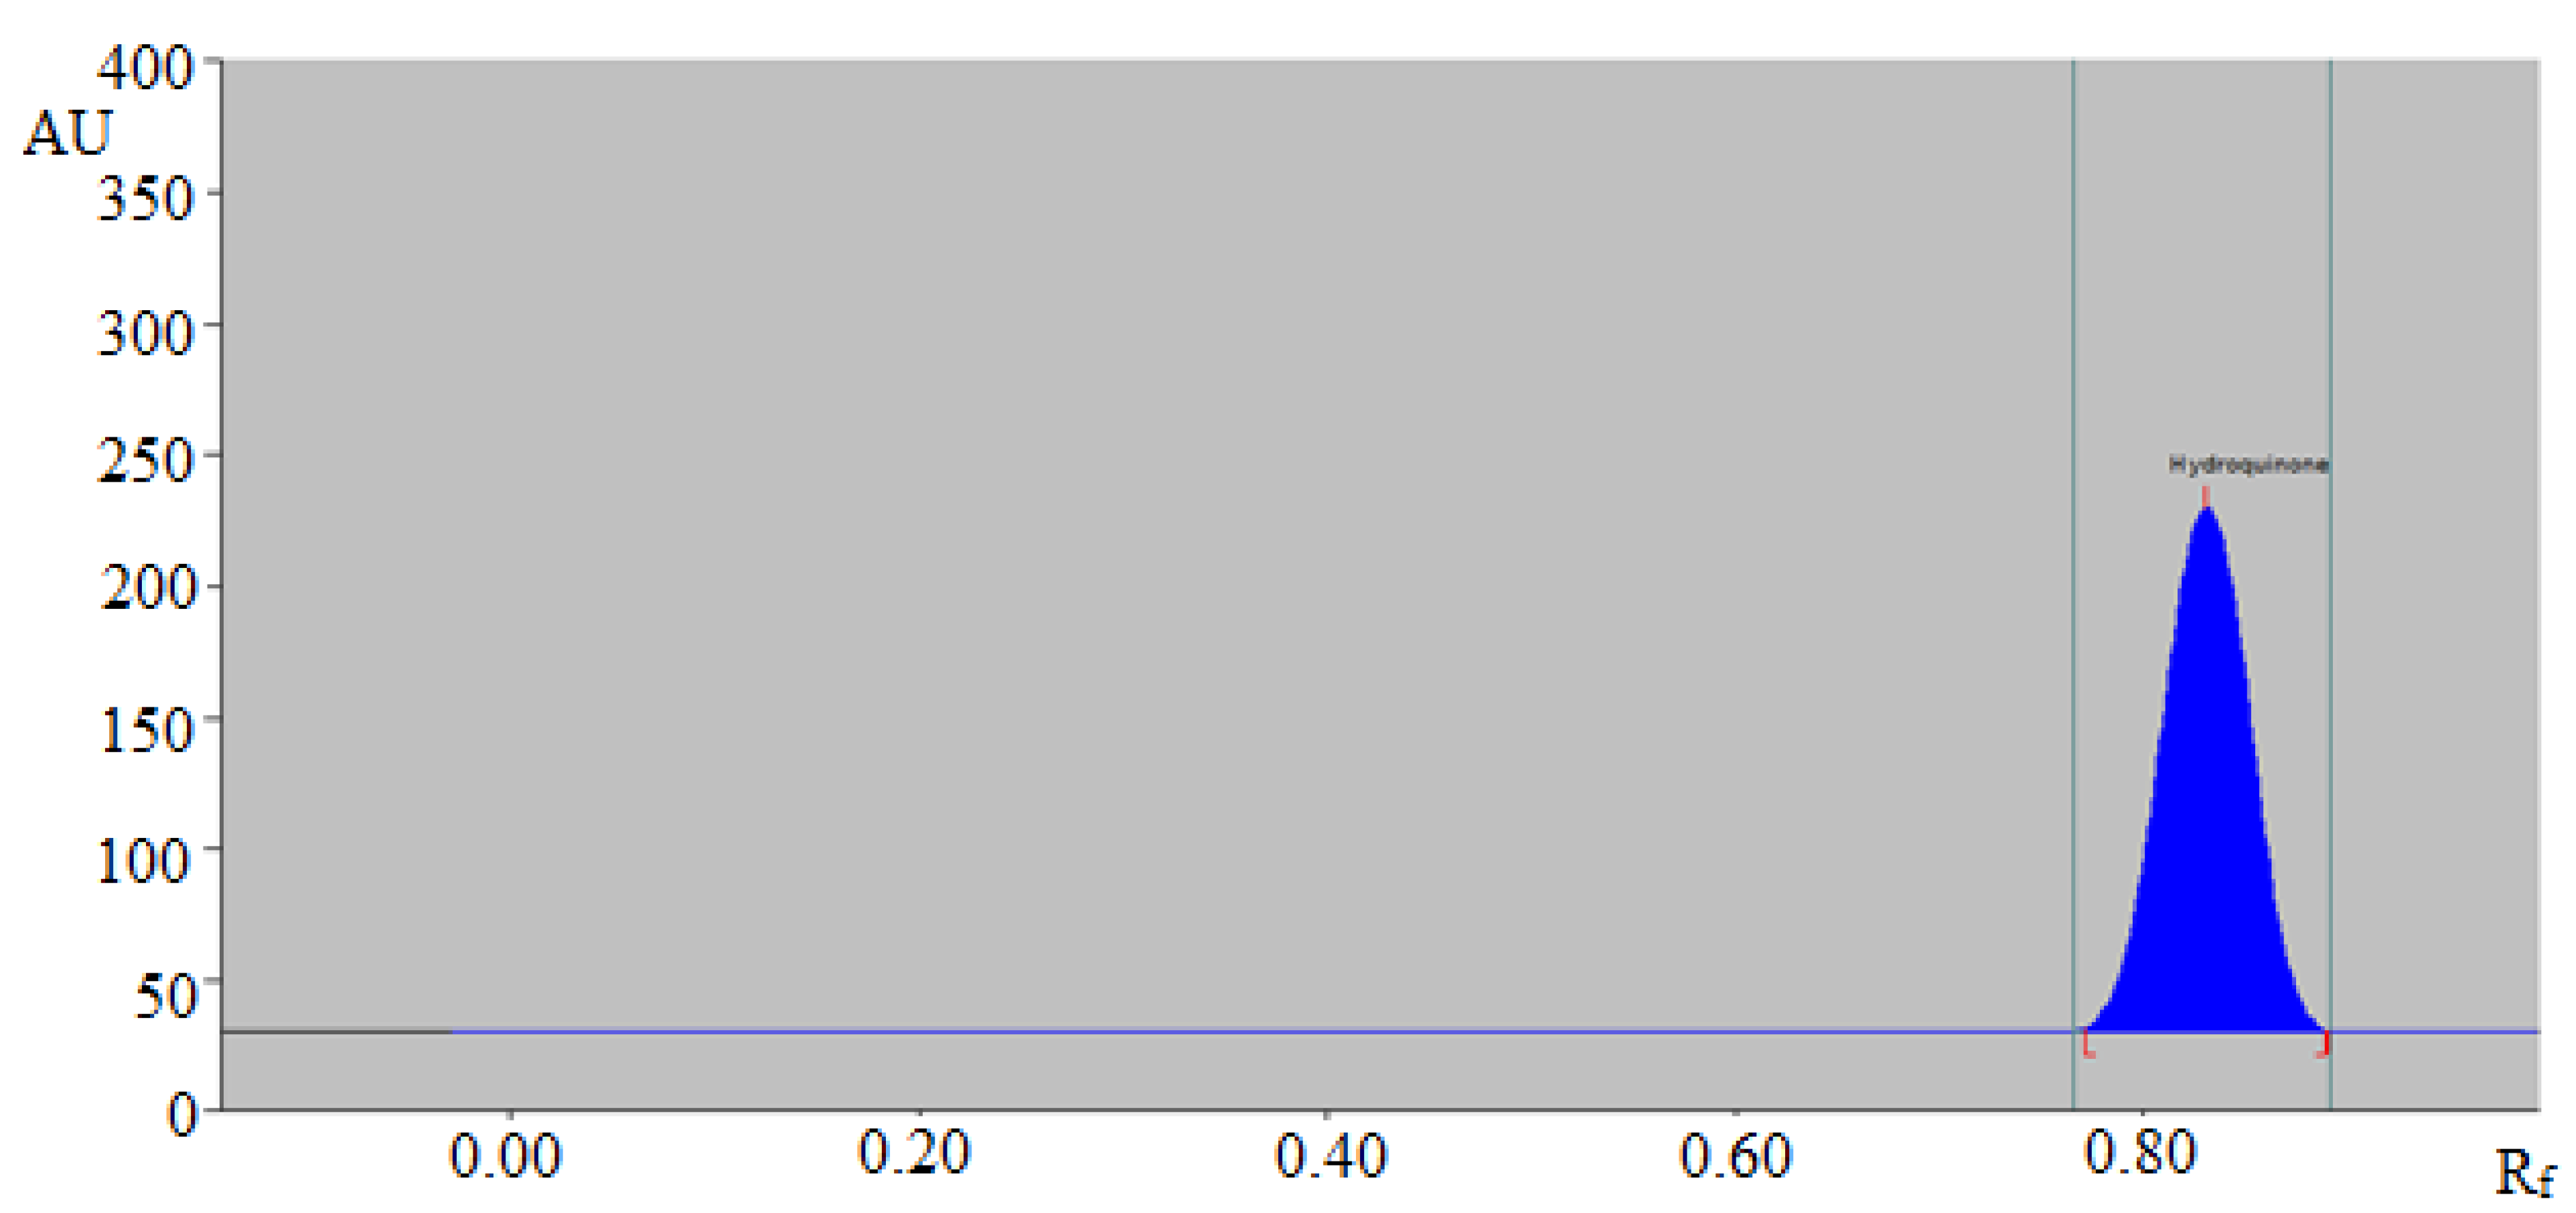
2.2. Chromatography
2.3. HDQ Calibration Curve and Preparation of Quality Control Samples
2.4. Sample Processing for HDQ Determination in CWCs
2.5. Validation Parameters
2.6. Quantitative Analysis of HDQ in CWCs
2.7. Greenness Evaluation
3. Results and Discussion
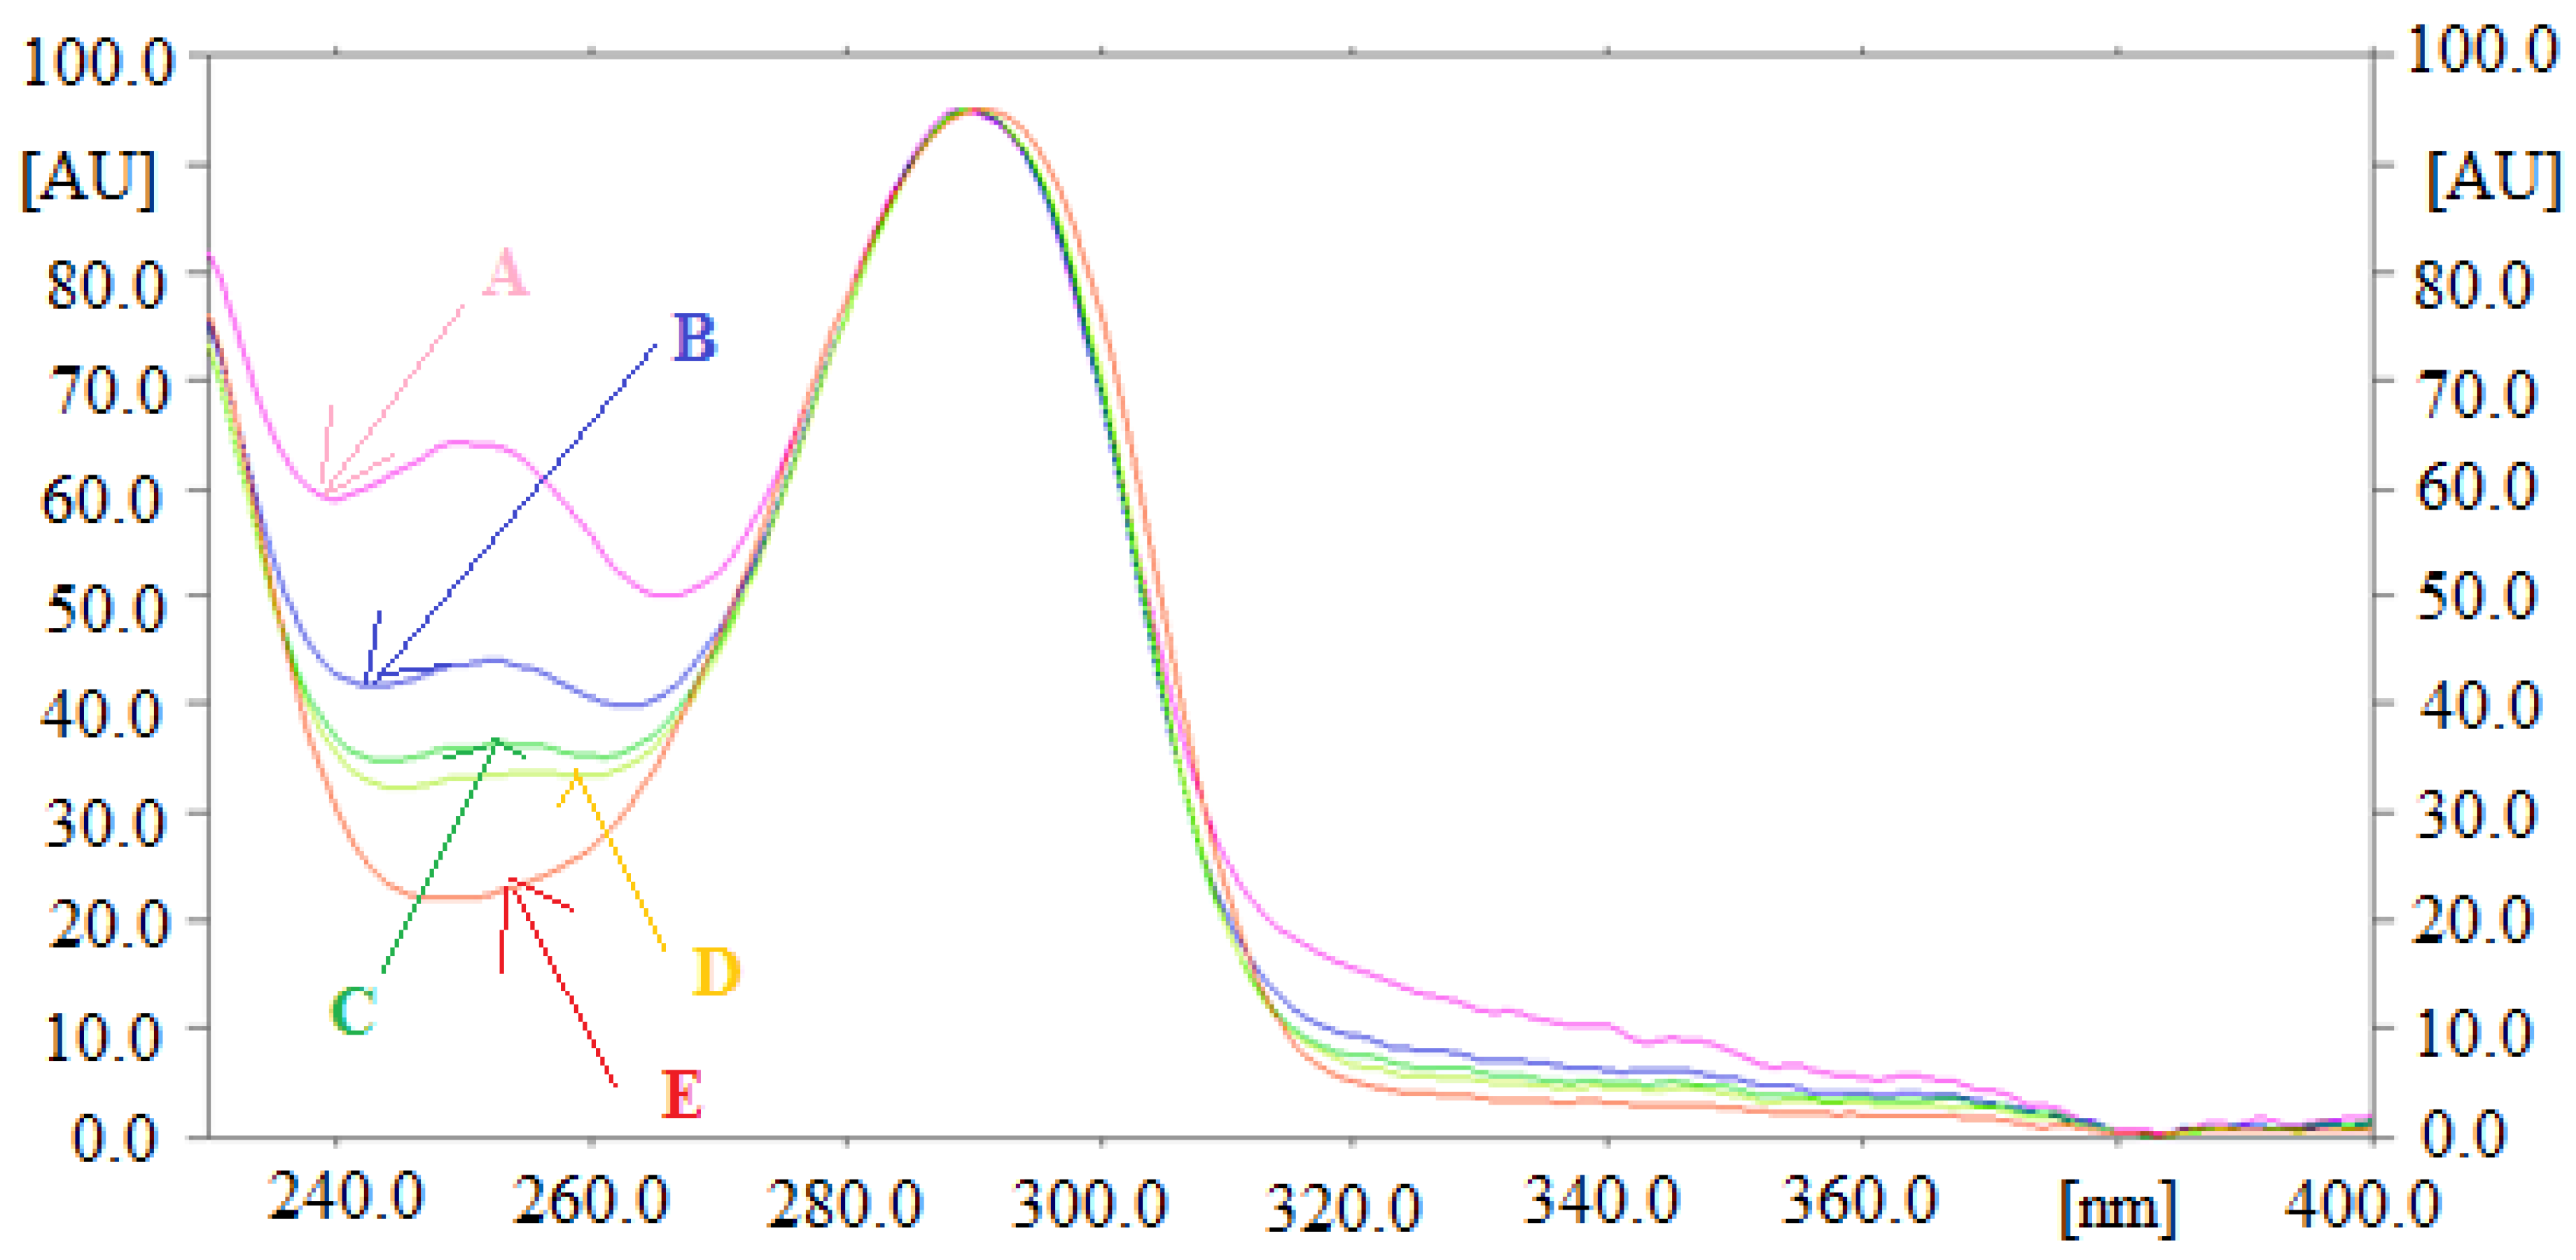
3.1. Method Development
3.2. Validation Parameters
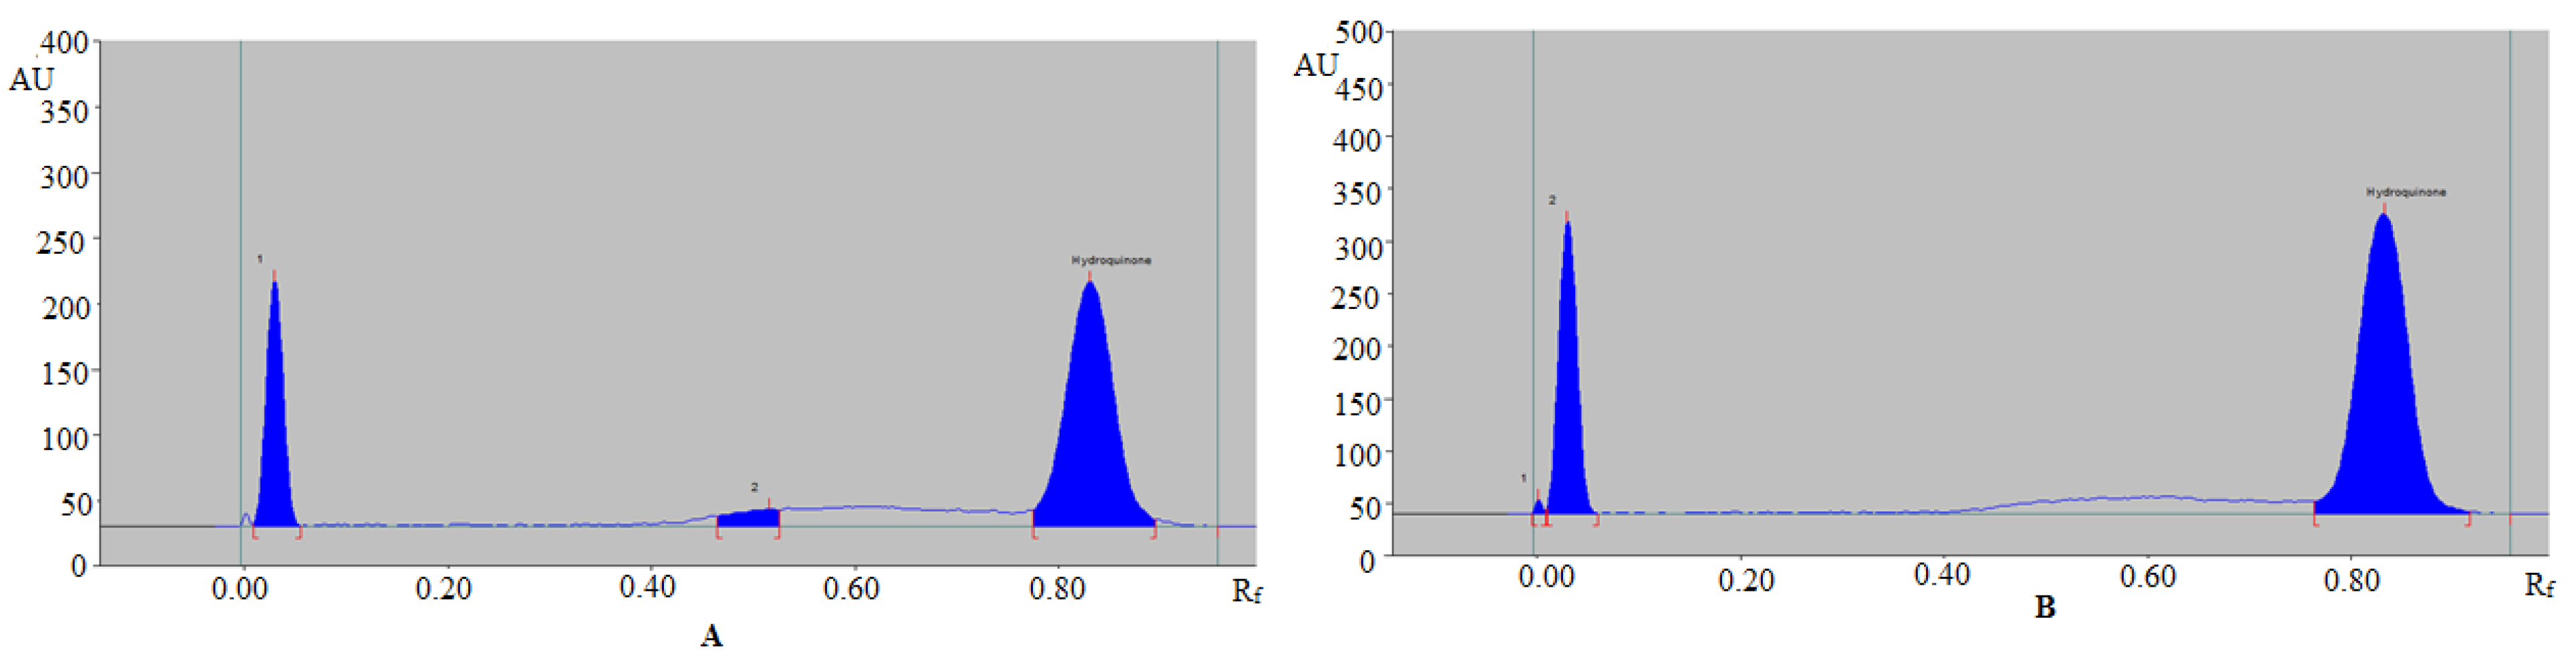
3.3. Analysis of HDQ Contents in CWCs
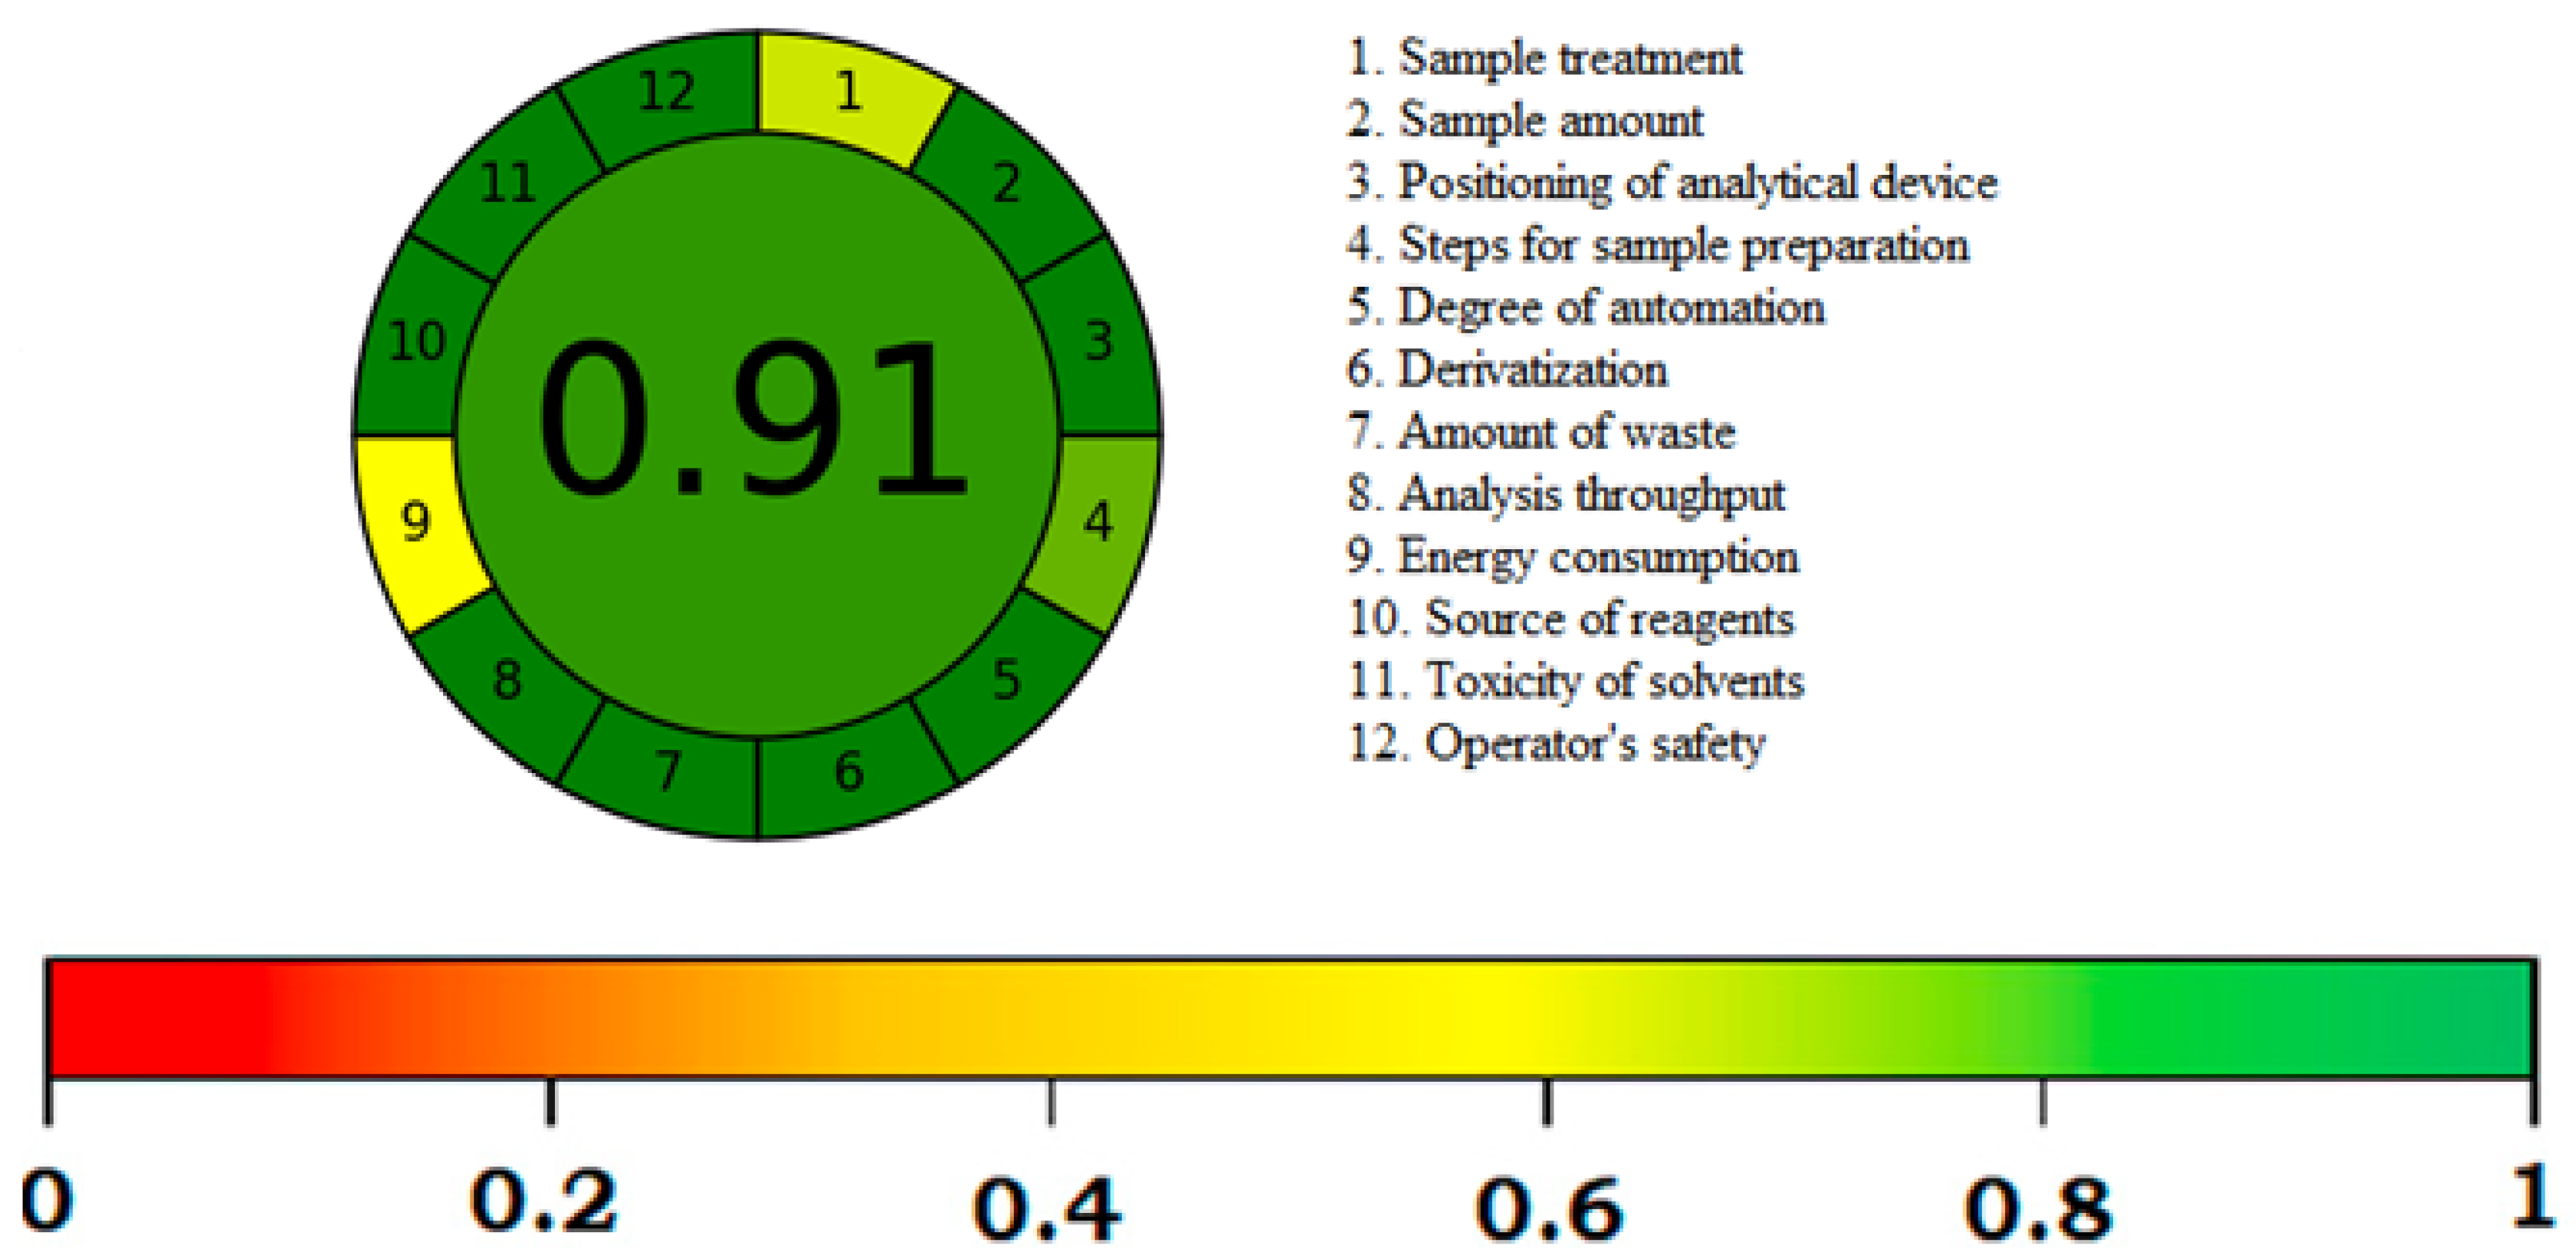
3.4. Greenness Assessment
- Sample treatment: 0.61
- Positioning of analytical device: 1.00
- Steps for sample preparation: 1.00
- Degree of automation: 0.80
- Derivatization: 1.00
- Amount of waste: 1.00
- Analysis throughput: 1.00
- Energy consumption: 1.00
- Sample treatment: 0.51
- Source of reagent: 1.00
- Toxicity of solvents: 1.00
- Operator’s safety: 1.00
4. Conclusions
Author Contributions
Funding
Institutional Review Board Statement
Informed Consent Statement
Data Availability Statement
Acknowledgments
Conflicts of Interest
References
- Alqasoumi, S.I.; Al-Rehaily, A.J.; Shakeel, F.; Abdel-Kader, M.S. Stability-indicating densitometric HPTLC method for qualitative and quantitative analysis of hydroquinone in commercial whitening creams. J. Planar Chromatogr. 2011, 24, 48–52. [Google Scholar] [CrossRef]
- Sheth, V.M.; Pandya, A.G. Melasma: A comprehensive update: Part I. J. Am. Acad. Dermatol. 2011, 65, 689–697. [Google Scholar] [CrossRef] [PubMed]
- Palumbo, A.; d’Ischia, M.; Misuraca, G.; Prota, G. Mechanism of inhibition of melanogenesis by hydroquinone. Biochem. Biophys. Acta 1991, 1073, 85–90. [Google Scholar] [CrossRef]
- Rachmin, I.; Ostrowski, S.M.; Weng, Q.Y.; Fisher, D.I. Topical treatment strategies to manipulate human skin pigmentation. Adv. Drug Deliv. Rev. 2020, 153, 65–71. [Google Scholar] [CrossRef] [PubMed]
- Nordin, F.N.M.; Aziz, A.; Zakaria, Z.; Radzi, C.W.J.W.M. A systematic review on the whitening products and their ingredients for safety, health risk, and halal status. J. Cosmet. Dermatol. 2021, 20, 1050–1060. [Google Scholar] [CrossRef] [PubMed]
- Spencer, M.C.; Becker, S.W. A hydroquinone effect. Clin. Med. 1963, 70, 1111–1114. [Google Scholar] [PubMed]
- Peters, M.M.C.G.; Jones, T.W.; Monks, T.J.; Lau, S.S. Cytotoxicity and cell-proliferation induced by the nephrocarcinogen hydroquinone and its nephrotoxic metabolite 2,3,5- (tris-glutathion-S-yl) hydroquinone. Carcinogenesis 1997, 18, 2393–2401. [Google Scholar] [CrossRef] [PubMed][Green Version]
- Katsambas, A.; Antoniou, C.H. Melasma. Classification and treatment. J. Eur. Acad. Dermatol. Venereol. 1995, 4, 217–223. [Google Scholar] [CrossRef]
- Mohamed, A.; Mohamed, M. Topical hydroquinone in the treatment of some hyperpigmentary disorders. Int. J. Dermatol. 1998, 37, 449–450. [Google Scholar]
- Odumosu, P.O.; Ekwe, T.O. Identification and spectrophometric determination of hydroquinone levels in some cosmetic creams. Afr. J. Pharm. Pharmacol. 2010, 45, 231–234. [Google Scholar]
- Uddin, S.; Rauf, A.; Kazi, T.G.; Afridi, H.I.; Lutfullah, G. Highly sensitive spectrometric method for determination of hydroquinone in skin lightening creams: Application in cosmetics. Int. J. Cosmet. Sci. 2011, 33, 132–137. [Google Scholar] [CrossRef] [PubMed]
- Elferjani, H.S.; Ahmida, N.H.S.; Ahmida, A. Determination of hydroquinone in some pharmaceutical and cosmetic preparations by spectrophotometric method. Int. J. Sci. Res. 2017, 6, 2119–2214. [Google Scholar]
- Moldovan, Z.; Popa, D.E.; David, I.G.; Buleandra, M.; Badea, I.A. A derivative spectrometric method for hydroquinone determination in the presence of kojic acid, glycolic acid, and ascorbic acid. J. Spectrosc. 2017, 2017, 6929520. [Google Scholar] [CrossRef]
- Firth, J.; Rix, I. Determination of hydroquinone in skin-toning creams using high-performance liquid chromatography. Analyst 1986, 111, 129–132. [Google Scholar] [CrossRef]
- Gagliardi, L.; Amato, A.; Cavazzutti, G.; Chimenti, F.; Bolasco, A.; Tonelli, D. Identification and quantification of hydroquinone and some of its ethers in cosmetic products by reversed-phase high-performance liquid chromatography. J. Chromatogr. 1987, 404, 267–272. [Google Scholar] [CrossRef]
- Borremans, M.; De-Beer, J.; Goeyens, L. Experimental and statistical validation of HPLC analysis of hydroquinone and its 4-methoxyphenol, 4-ethoxyphenol and 4-benzloxyphenol ethers in cosmetic products. Chromatographia 1999, 50, 346–352. [Google Scholar] [CrossRef]
- Lin, C.H.; Sheu, J.Y.; Wu, H.L.; Huang, Y.L. Determination of hydroquinone in cosmetic emulsion using microdialysis sampling coupled with high-performance liquid chromatography. J. Pharm. Biomed. Anal. 2005, 38, 414–419. [Google Scholar] [CrossRef] [PubMed]
- Rychlinska, I.; Nowak, S. Quantitative determination of arbutin and hydroquinone in different plant materials by HPLC. Not. Bot. Horti Agrobot. 2012, 40, 109–113. [Google Scholar] [CrossRef]
- Siddique, S.; Parveen, Z.; Ali, Z.; Zaheer, M. Qualitative and quantitative estimation of hydroquinone in skin whitening cosmetics. J. Cosmet. Dermatol. Sci. Appl. 2012, 2, 224–228. [Google Scholar] [CrossRef]
- Amponsah, D.; Voegborlo, R.; Sebiawu, G.E. Determination of amount of hydroquinone in some selected skin lightening creams sold in the Ghanaian market. Int. J. Sci. Eng. Res. 2014, 5, 544–550. [Google Scholar]
- Zukepli, N.W.M.; Omar, W.S.A.W.; Zakaria, S.R. Assessment on hyroquinone in selected cosmetic cream and toner via high performance liquid chromatography and ultra-violet visible detector spectrometry. Malalysian J. Anal. Sci. 2015, 19, 824–830. [Google Scholar]
- Gimeno, P.; Maggio, A.F.; Bancilhon, M.; Lassu, N.; Gornes, H.; Brenier, C.; Lempereur, L. HPLC–UV method for the identification and screening of hydroquinone, ethers of hydroquinone and corticosteroids possibly used as skin-whitening agents in illicit cosmetic products. J. Chromatogr. Sci. 2016, 54, 343–352. [Google Scholar] [CrossRef] [PubMed]
- Agorku, E.S.; Kwaansa-Ansah, E.E.; Voegborlo, R.B.; Amegbletor, P.; Opoku, F. Mercury and hydroquinone content of skin toning creams and cosmetic soaps, and the potential risks to the health of Ghanaian women. SpringerPlus 2016, 5, 319. [Google Scholar] [CrossRef]
- Wang, L.H. Simultaneous determination of hydroquinone ethers in cosmetics after preconcentration at a carbon paste electrode. Analyst 1995, 120, 2241–2244. [Google Scholar] [CrossRef]
- Cruz, V.I.; Fatibello-Filho, O. Biosensor based on paraffin:graphite modified with sweet potato tissue for the determination of hydroquinone in cosmetic cream in organic phase. Talanta 2000, 52, 681–689. [Google Scholar] [CrossRef]
- Xu, G.; Li, B.; Luo, X. Carbon nanotube doped poly(3,4-ethylenedioxythiophene) for the electrocatalytic oxidation and detection of hydroquinone. Sens. Actuators B 2013, 176, 69–74. [Google Scholar] [CrossRef]
- Buleandra, M.; Rabinca, A.A.; Mihailciuc, C. Screen-printed Prussian Blue modified electrode for simultaneous detection of hydroquinone and catechol. Sens. Actuators B 2014, 203, 824–832. [Google Scholar] [CrossRef]
- Arago, M.; Arino, C.; Dago, A.; Diaz-Cruz, J.M.; Esteban, M. Simultaneous determination of hydroquinone, catechol and resorcinol by voltammetry using screen-printed electrodes and partial least square calibration. Talanta 2016, 160, 138–143. [Google Scholar] [CrossRef] [PubMed]
- Tashkhourian, J.; Daneshi, M.; Nami-Ana, F.; Behbahani, M.; Bagheri, A. Simultaneous determination of hydroquinone and catechol at gold nanoparticles mesoporous silica modified carbon paste electrode. J. Hazard. Mater. 2016, 318, 117–124. [Google Scholar] [CrossRef]
- Rueda, M.E.; Sarabia, L.A.; Herrero, A.; Ortiz, M.C. Optimisation of a flow injection system with electrochemical detection using the desirability function Application to the determination of hydroquinone in cosmetics. Anal. Chim. Acta 2003, 479, 173–184. [Google Scholar] [CrossRef]
- Sakodinskaya, I.K.; Desiderio, C.; Nardi, A.; Fanali, S. Micellar electrokinetic chromatographic study ofhydroquinone and some of its ethers. Determination of hydroquinone in skin-toning cream. J. Chromatogr. 1992, 596, 95–100. [Google Scholar] [CrossRef]
- Desiderio, C.; Ossicini, L.; Fanali, S. Analysis of hydroquinone and some of its ethers by using capillary electrochromatography. J. Chromatogr. A 2000, 887, 489–496. [Google Scholar] [CrossRef]
- Butwong, N.; Kunawong, T.; Luong, J.H.T. Simultaneous analysis of hydroquinone, arbutin, and ascorbyl glucoside using a nanocomposite of Ag@AgCl nanoparticles, Ag2S nanoparticles, multiwall carbon nanotubes, and chitosan. Nanomaterials 2020, 10, 1583. [Google Scholar] [CrossRef]
- Buledi, J.A.; Ameen, S.; Khand, N.H.; Solangi, A.R.; Taqwi, I.H.; Agheem, M.H.; Wazdan, Z. CuO nanostructured based electrochemical sensor for simultaneous determination of hydroquinone and ascorbic acid. Electroanalysis 2020, 32, 1600–1607. [Google Scholar] [CrossRef]
- Pato, A.H.; Balouch, A.; Alveroglu, E.; Buledi, J.A.; Lal, S.; Mal, D. A practical non-enzymatic, ultra-sensitive molybdenum oxide (MoO3) electrochemical nanosensor for hydroquinone and ascorbic acid. J. Electrochem. Soc. 2021, 168, 056503. [Google Scholar] [CrossRef]
- Alam, P.; Ezzeldin, E.; Iqbal, M.; Anwer, M.K.; Mostafa, G.A.E.; Alqarni, M.H.; Foudah, A.I.; Shakeel, F. Ecofriendly densitometric RP-HPTLC method for determination of rivaroxaban in nanoparticle formulations using green solvents. RSC Adv. 2020, 10, 2133–2140. [Google Scholar] [CrossRef]
- Alam, P.; Iqbal, M.; Ezzeldin, E.; Khalil, N.Y.; Foudah, A.I.; Alqarni, M.H.; Shakeel, F. Simple and accurate HPTLC-densitometry method for quantification of delafloxacin (a novel fluoroquinolone antibiotic) in plasma samples: Application to pharmacokinetic study in rats. Antibiotics 2020, 9, 134. [Google Scholar] [CrossRef] [PubMed]
- Ibrahim, F.A.; Elmansi, H.; Fathy, M.E. Green RP-HPLC method for simultaneous determination of moxifloxacin combinations: Investigation of the greenness for the proposed method. Microchem. J. 2019, 148, 151–161. [Google Scholar] [CrossRef]
- Abou-Taleb, N.H.; Al-Enany, N.M.; El-Sherbiny, D.T.; El-Subbagh, H.I. Digitally enhanced thin layer chromatography for simultaneous determination of norfloxacin tinidazole with the aid of Taguchi orthogonal array and desirability function approach: Greenness assessment by analytical eco-scale. J. Sep. Sci. 2020, 43, 1195–1202. [Google Scholar] [CrossRef] [PubMed]
- Abdelrahman, M.M.; Abdelwahab, N.S.; Hegazy, M.A.; Fares, M.Y.; El-Sayed, G.M. Determination of the abused intravenously administered madness drops (tropicamide) by liquid chromatography in rat plasma; an application to pharmacokinetic study and greenness profile assessment. Microchem. J. 2020, 159, 105582. [Google Scholar] [CrossRef]
- Duan, X.; Liu, X.; Dong, Y.; Yang, J.; Zhang, J.; He, S.; Yang, F.; Wang, Z.; Dong, Y. A green HPLC method for determination of nine sulfonamides in milk and beef, and its greenness assessment with analytical eco-scale and greenness profile. J. AOAC Int. 2020, 103, 1181–1189. [Google Scholar] [CrossRef]
- Pena-Pereira, F.; Wojnowski, W.; Tobiszewski, M. AGREE-Analytical GREEnness metric approach and software. Anal. Chem. 2020, 92, 10076–10082. [Google Scholar] [CrossRef] [PubMed]
- Nowak, P.M.; Koscielniak, P. What color is your method? Adaptation of the RGB additive color model to analytical method evaluation. Anal. Chem. 2019, 91, 10343–10352. [Google Scholar] [CrossRef]
- International Conference on Harmonization (ICH). Q2 (R1) Validation of Analytical Procedures-Text and Methodology; International Conference on Harmonization (ICH): Geneva, Switzerland, 2005. [Google Scholar]
- Foudah, A.I.; Shakeel, F.; Alqarni, M.H.; Alam, P. A rapid and sensitive stability-indicating RP-HPTLC method for the quantitation of flibanserin compared to green NP-HPTLC method: Validation studies and greenness assessment. Microchem. J. 2021, 164, 105960. [Google Scholar] [CrossRef]


| Parameters | Values |
|---|---|
| Linearity range (ng band−1) | 20–2400 |
| Regression equation | y = 12.133x + 316.50 |
| R2 | 0.9997 |
| Slope ± SD | 12.133 ± 0.870 |
| Intercept ± SD | 316.50 ± 8.14 |
| Standard error of slope | 0.35 |
| Standard error of intercept | 3.32 |
| 95% confidence interval of slope | 10.60–13.66 |
| 95% confidence interval of intercept | 302.19–330.80 |
| LOD ± SD (ng band−1) | 6.91 ± 0.23 |
| LOQ ± SD (ng band−1) | 20.73 ± 0.69 |
| Conc. (ng Band−1) | Parameters | Value |
|---|---|---|
| Rf | 0.83 ± 0.02 | |
| 600 | As | 1.03 ± 0.03 |
| N m−1 | 4987 ± 2.86 |
| Conc. (ng Band−1) | Conc. Found (ng Band−1) ± SD | Recovery (%) | CV (%) |
|---|---|---|---|
| 20 | 20.36 ± 0.13 | 101.80 | 0.63 |
| 600 | 588.98 ± 3.34 | 98.16 | 0.56 |
| 2400 | 2385.32 ± 6.58 | 99.38 | 0.28 |
| Conc. (ng Band−1) | Intraday Precision | Interday Precision | ||||
|---|---|---|---|---|---|---|
| Conc. (ng Band−1) ± SD | Standard Error | CV (%) | Conc. (ng Band−1) ± SD | Standard Error | CV (%) | |
| 20 | 19.67 ± 0.18 | 0.07 | 0.91 | 20.28 ± 0.20 | 0.08 | 0.98 |
| 600 | 603.65 ± 3.61 | 1.47 | 0.59 | 590.45 ± 4.12 | 1.68 | 0.69 |
| 2400 | 2567.54 ± 6.72 | 2.74 | 0.26 | 2391.23 ± 7.78 | 3.17 | 0.32 |
| Conc. (ng Band−1) | Mobile Phase Composition (Ethanol/Water) | Results | ||||
|---|---|---|---|---|---|---|
| Original | Used | Level | Conc. (ng Band−1) ± SD | % CV | Rf | |
| 62:38 | +2.0 | 604.74 ± 3.60 | 0.59 | 0.82 | ||
| 600 | 60:40 | 60:40 | 0.0 | 610.24 ± 3.80 | 0.62 | 0.83 |
| 58:42 | −2.0 | 615.63 ± 4.10 | 0.66 | 0.84 | ||
| Formulation | Formulation Ingredients | Label Amount of HDQ (%w·w−1) | Amount Found (%w·w−1) |
|---|---|---|---|
| CWC A | Parafinnum liquidum, methylparaben, polyoxyl-40-steaarte, propylene glycol, propylparaben, sodium lauryl sulphate, sodium metabisulphate, stearic acid, stearyl alcohol, and purified water | 2.00 | 1.23 ± 0.03 |
| CWC B | Emulgin B2, cetostearyl alcohol, paraffin oil, benzoic acid, glycerin, vitamin E, vitamin C, propylene glycol, citric acid, sodium lauryl sulphate, sodium metabisulphate, octyl methoxycinnamate, and purified water | 2.00 | 0.37 ± 0.01 |
| CWC C | Propylparaben, glyceryl monostearate, mineral oil, PEG-25 propylene glycol stearate, polyoxyl-40-steaarte, sodium metabisulphate, squalene, stearic acid, propylene glycol, and purified water | 2.00 | 0.81 ± 0.02 |
| CWC D | Ethanol, capryloyl glycine, C-13-14 isoparaffin, glycolic acid, kojic acid, laureth-7, lecithin, polyacrylamide, sodium hydroxide, squalene, xanthan gum, and purified water | 2.00 | 0.43 ± 0.02 |
Publisher’s Note: MDPI stays neutral with regard to jurisdictional claims in published maps and institutional affiliations. |
© 2021 by the authors. Licensee MDPI, Basel, Switzerland. This article is an open access article distributed under the terms and conditions of the Creative Commons Attribution (CC BY) license (https://creativecommons.org/licenses/by/4.0/).
Share and Cite
Alqarni, M.H.; Alam, P.; Shakeel, F.; Foudah, A.I.; Alshehri, S. Highly Sensitive and Ecologically Sustainable Reversed-Phase HPTLC Method for the Determination of Hydroquinone in Commercial Whitening Creams. Processes 2021, 9, 1631. https://doi.org/10.3390/pr9091631
Alqarni MH, Alam P, Shakeel F, Foudah AI, Alshehri S. Highly Sensitive and Ecologically Sustainable Reversed-Phase HPTLC Method for the Determination of Hydroquinone in Commercial Whitening Creams. Processes. 2021; 9(9):1631. https://doi.org/10.3390/pr9091631
Chicago/Turabian StyleAlqarni, Mohammed H., Prawez Alam, Faiyaz Shakeel, Ahmed I. Foudah, and Sultan Alshehri. 2021. "Highly Sensitive and Ecologically Sustainable Reversed-Phase HPTLC Method for the Determination of Hydroquinone in Commercial Whitening Creams" Processes 9, no. 9: 1631. https://doi.org/10.3390/pr9091631
APA StyleAlqarni, M. H., Alam, P., Shakeel, F., Foudah, A. I., & Alshehri, S. (2021). Highly Sensitive and Ecologically Sustainable Reversed-Phase HPTLC Method for the Determination of Hydroquinone in Commercial Whitening Creams. Processes, 9(9), 1631. https://doi.org/10.3390/pr9091631