Article

Thermal Analysis and Energy Efficiency Improvements in Tunnel Kiln for Sustainable Environment

1
Department of Mechanical Engineering, University of Engineering and Technology Lahore, Lahore 54000, Pakistan
2
Department of Mechanical Engineering, National University of Singapore, Singapore 117575, Singapore
3
Department of Agricultural Engineering, Bahauddin Zakariya University, Multan 60800, Pakistan
4
Department of Chemistry, Faculty of Science, Universiti Teknologi Malaysia, Johor Bahru 81310 UTM, Malaysia
5
Department of Mechanical Engineering, College of Engineering and Technology, University of Sargodha, Sargodha 40100, Pakistan
6
School of Chemical Engineering, Yeungnam University, Gyeongsan 712-749, Korea
7
Department of Materials Engineering, KU Leuven, 3001 Leuven, Belgium
8
Sustainable Process Integration Laboratory–SPIL, NETME Centre, Faculty of Mechanical Engineering, Brno University of Technology–VUT Brno, Technická 2896/2, 616 69 Brno, Czech Republic
9
Department of Chemical Engineering, Lahore Campus, COMSATS University Islamabad (CUI), Punjab 54000, Pakistan
*
Authors to whom correspondence should be addressed.
Processes 2021, 9(9), 1629; https://doi.org/10.3390/pr9091629
Submission received: 16 July 2021 / Revised: 31 August 2021 / Accepted: 4 September 2021 / Published: 9 September 2021

Abstract

:
Kiln is a prime need in the ceramics industry, where energy loss is a major part which consumes about 60% production cost through thermal energy for different applications. Higher density of fired and tunnel kiln refractory material lowers the thermal diffusivity and the proper selection of fired material minimizes the energy loss along the kiln. In particular, this research analysed the results of a heat recovery system comprised of a metallic recuperator which gives around 8% energy savings in natural gas consumption. In this work, detailed power quality analysis of low-power factor motors of a tunnel kiln was carried out and a power factor improvement solution was suggested to save electrical energy with payback period of 0.8 y. The motor operating at a low-power factor consumes more reactive power which does not produce beneficial work. A low-power factor around 0.4 causes network power loss, increases in transformer loss and voltage drops. The solution with accumulative capacitance power of 148.05 uF was installed to achieve the power factor to 0.9. Flu gas analyzer was installed to monitor the range of O2 in pre-heating, oxidation, and firing zones of the kiln which should be ≥8% and 3%, respectively. Regression analysis for thermal energy consumption of a tunnel kiln is done to find the forecast thermal energy consumption. This analysis can be used to find operational efficiency, supporting decisions regarding dependent variable of thermal energy consumption and independent variable of production. This research is very helpful for the ceramics industry to mitigate the energy loss at SMEs as well as in mass production level.

1. Introduction

Firing and drying process of ceramics manufacturing requires intensive thermal energy consumption. These processes can be improved by improving the product quality, lowering the process time, and promoting the economic and environmental heat gain. The main process that employs the intensive use of natural gas is the firing of sanitary ware. By limit the use of thermal energy consumption, accurate design of tunnel kiln was incorporated [1]. The different methods for the optimization of kiln performance have been adopted. The clear prediction of thermal energy formulation in kiln operations had been proposed [2].
The mass and energy balance throughout the kiln is based on the economic evaluation of the system [3]. Energy flow against the entire length of the kiln depends on the heat distribution and air and gas flow rates in all zones was incorporated [4]. Exhaust emissions of the kiln depends on the physio-chemical properties of the gases and flow rate; this point is very critical for a tunnel kiln [5]. Energy cost analysis and techno-economic analysis of the gas consumption of furnaces were expressed [6]. The emission gas analysis of NOx and Sox were explained [7]. The cost comparison of alternative fuels and conventional fuels were well defined [8]. The improved operation for firing process and pressing techniques by means of LCA approach was introduced [9]. The fuel cost minimization in improving the energy consumption per unit brick by 2.7% lowered their standard operation and the optimization approach was adopted [10]. The numerical simulation to optimize the biological waste water treatment process was expressed [11]. The performance of the kiln is analyzed by numerical model. In the tunnel kiln, 10% of thermal fuel savings can be achieved after installing heat recovery burners in the entire kiln. The modeling approach to validate the waste integration to water system and environment low impact and its advantages compared with available outdated technologies were outlined [12].
For convective heat transfer, coefficient correlation along the tunnel kiln was expressed [13]. The numerical simulation of the tunnel kiln for governing the heat transfer phenomenon and the study of heat fluxes and temperature profiles were carried out [14]. The detailed study of heat pattern and temperature profile was discussed [15]. The typical process of ceramics kiln is purely time dependent. The assessment strategies for different control of ceramics manufacturing are very complex. The approach of lumped and distributed numerical analysis under time-dependent operating parameters is well defined [16]. The investigation of hydrogen production by different process parameters under best energy efficiency formation was incorporated by modelling the entire plant [17]. Recently, augmentation techniques with diverse attack angles head-to-head tunnel kiln wall by using guide vanes was conducted [18].
Experimentally, the pressure drops and entire heat transfer for ten dissimilar patterns of brick settings were examined. The results were achieved by using extensive range of Reynold numbers from 11,867 to 25,821. Under convective heat transfer and pressure drop of different brick settings, the different results were discussed. The average Nusselt numbers were greatly influenced by attack angle. The extreme augmentation of about 94.5% was gained from longitudinal specific bricks arrangement in the middle column setting two at the attack angle of 135 °C and Reynold number = 22,407. The empirical correlation and of Nusselt number were examined under independent factors specific range as a purpose of the brick settings, Reynold number, diverse attack angle. A mathematical model used for simulation of roof tiles in the kiln manufacturing process was introduced [19]. The experimental results revealed that the required mean flow velocity must be in the range of 20 m/s by using tiles of roofs showing specific numerical simulation to envisage moisture contents, temperature profile in the hollow setting of ceramic bricks during the procedure of drying in industry [20]. In the preheating zone of the tunnel kiln two axial flows in mixing ware by means of side nozzle is examined. By using the CFD computational fluid dynamic tool fluent, a 3-D temperature field between two tunnel kiln cars was used. The investigation of maximum difference temperature and distribution of the pressure are evaluated using contours was introduced. It was examined that by increasing the mixing quality, the impulse flow rate goes to 4 N. The typical behavior of injection velocity, nozzle position of gas, and flow pattern had been analysed [21].
By using the suitable thermal insulation, it was revealed that approximately 35% of energy gain and reduction of temperature inside the wall from 249.34 °C to 79.49 °C can be achieved [22]. Recovered air mass flow optimization study revealed that reduction of natural gas by 4.6% daily consumption can be achieved by passing the air to pre heat the sanitary ware from cooling to preheating zone [23]. In ceramics manufacturing, the efficiency of a tunnel kiln is not more than 30% due to its convective and radiation losses. The mass ratio between tunnel kiln car and fired material should be more than 50%. Different thermal properties of fired material and constructive material can influence the specific energy losses [24]. The simulation of a dimension-less model in preheating zone predicting gas flow, evaporation of bound water, and normative heat transfer between gas was developed. The temperature profile results in entering the ambient air in preheating zone and not entering the preheating zone to monitor the quality of the fired bricks examined [25].
AC induction motors usually work with a load much less as compared to their maximum rating. Many surveys show that the average load factor for these motors is 57–68% of their ratings, and machine often operate with more less load, even in between 3–16% [20]. It was observed that 44% of motors installed in industrial sector are loaded at less than 40% of their rated power [26]. It is observed that AC motors have the highest efficiency at 75% of load [27]. The main purpose is to save energy by improving the power factor of the motor of the tunnel kiln [28]. This can be achieved by decreasing the distribution losses and improving the electrical load operation for a better energy efficiency level. The power factor improvement of an industrial AC motor can be achieved by installing the power factors. For industrial operation, AC induction motors are widely used. It is estimated that 70–80% is the average efficiency of the electricity consumed by these motors in the whole world. Power factor correction is gained by adding the capacitive load to offset the inductive load in the power network [29,30]. By reducing the tunnel channel height, aerodynamic characteristics such as pressure and velocity can be changed by modeling. The uniform velocity distribution along the tunnel length was visualized in a simulation. [31]. The experimental analysis and thermodynamics calculation of a kiln for ceramic porcelain tiles was carried out [32]. Exergy analysis of ceramics kilns expressed that 83% of accumulative energy input of kiln was demolished and only 10% of exergy input can be controlled in the physio-chemical transformation of the entire ceramic configuration. Over 61% of heat recovery can be achieved by increasing the entire energy performance of the kiln [33]. Specific energy consumption of table ware ceramics kiln was analyzed and determined to be 19,363 MJ/t. It was observed that there is a linear relation between kiln loading capacity and thermal energy consumption LPG, an increase in one kg of product of ceramics per m3 loading can reduce the energy consumption by 0.67 kg LPG per kg. Therefore, it was observed that increasing the loading capacity of the kiln, reducing the actual heat capacity, and repairing the kiln insulator which reduce the specific thermal energy consumption of the kiln [34].
The investigation of the sanitary ware ceramics industry tunnel kiln was done, and it was observed that 76% of thermal energy consumed in this particular kiln. The rest of the energy was consumed in the drying process of the ceramics industry [35]. Best available techniques (BAT) for energy efficiency for ceramics production such as installation of superlative burners to reduce the thermal energy of the entire kiln, a large number of well-controlled burners which can optimize the temperature profile in entire tunnel kiln, installation of metallic recuperator heat exchangers to save thermal energy consumption, introduction of high loading rate and reduction in kiln energy consumption, and introduction of environmental management structure to monitor the flu gas regularly were mentioned [36]. The convective heat transfer analysis of tunnel kiln was investigated, and three turbulence models were accounted for in this study: k-e, k-w and RNG k-w. It was observed that 17% of convective heat transfer enhanced by the longitudinal bricks arrangement and 27% was enhanced by transverse lattice setting arrangement of bricks in the tunnel kiln [37]. The regression analysis depends on the dependent and independent variable and their correlation, interception and slope [38].
The thermogravimetric analysis of gaseous fuels with high volatile matter was discussed to enhance the system efficiency [39]. A parametric study of inside pressure and its study was well defined [40]. Turbulence flow of gaseous fluid and its characteristic with solid particles in the enclosed chamber were introduced [41]. The detailed analysis of nano particles and their energy distributive with respect to solar thermal power was defined [42]. Development of solid-based absorbent and effective carbon capture applications with respect to a sustainable environment was discussed [43]. Evaporator cooling and its effect on environmental sustainability in Pakistan was introduced for form house [44]. Environmental sustainability is very important because greenhouse gases such as CO and CO2 continuously damage the ozone layer. The stack analysis of kilns is very important to monitor CO and CO2 [45]. The detail of heat transfer mechanism in heat exchangers was discussed. In the kiln, it is very important to maintain the pressure draught for air and fuel chemistry. The main factor is that by increasing the heat transfer, there will be a high range of pressure drop [46].
Techno-economic analysis of thermal energy consumption gives a better idea to predict future energy consumption demand. There is almost 8% savings, which has been achieved after installing the heat recovery system. a detailed analysis of thermal energy consumption of the tunnel kiln has been carried out, and the results of pre, post and forecast are mentioned in this paper. Thermal energy consumption from July 2019 to January 2020 is expressed in a linear relation. Thermal energy consumption in July 19 was 4190 MMBtu, whereas in August 2019, the thermal energy consumption was 4158 MMBtu. January 2020, the thermal energy consumption is slighter higher i.e., 4199 MMBtu. The production values from July 2019 to January 2020 are in the range of 178t to 195t. The techno-economic analysis predicts the future thermal energy consumption, which gives the statistic view for a tunnel kiln. The forecast future consumption from Febuary-2020 to September 2020 is in the range of 4150 to 4189 MMBtu.
In the present research, thermal energy consumption analysis for pre- and post-heat recovery system at the tunnel kiln were conducted. Power quality analysis of tunnel kiln motors were also conducted to suggest a power factor improvement solution with a payback period of 0.8 months. Regression analysis for thermal energy consumption of the tunnel kiln was also done to find the forecast thermal energy consumption.

2. Materials and Methods

The chemical composition of ceramics body comprises aluminum oxide Al2O3 (15%), P-I (14%), potash S-2 gulf (17%), potash feldspar S-3 (4%), TA clay (22%), China clay D.W (13%), Black clay HK ¾ (10%), and A A-7 (5%). These composition materials with described percentages are mixed in ball mills for 13 h to prepare the ceramics body for firing in the tunnel kiln. Results of shrinkage for six batches showed good compromise between fired maturity and shrinkage. Porcelain material has the highest level of fired shrinkage compared to stoneware. The set standard for the test of shrinkage was 10.5 ± 1.5% for diameter wise, and 8 ± 1% for length wise. The mechanical strength of green, glazed, and unglazed batches is mentioned below.
Table 1 shows the properties of ceramics bodies which were fired in tunnel kiln. The set testing standard for the green body, un-glazed, and glazed batches were 50 ± 10, 850 ± 100. Experimentally, it is observed that when the ceramics body is heated up, its size and volume is increased in small increments, which is called thermal expansion. The values of thermal expansion for six batches are mentioned below. The set testing standard for thermal expansion was 0.38 ± 0.02. tunnel kiln car heating capacity is taken Cp 980 J/kgK, density ρ car 1250 kg/m3, thermal conductivity λ car 1 W/m K, total cycle time of tunnel kiln 70 h, height of the tunnel kiln car h car 1.1 m, initial temperature 303 K, length 2.25 m, useful length 1.08 m, velocity of the kiln car 3.0 m/h.
Table 2 shows the properties of natural gas and air in the tunnel kiln, in which detail of gas fuel and air contents is discussed. This table helps to identify the air flow mass rate in the tunnel kiln.

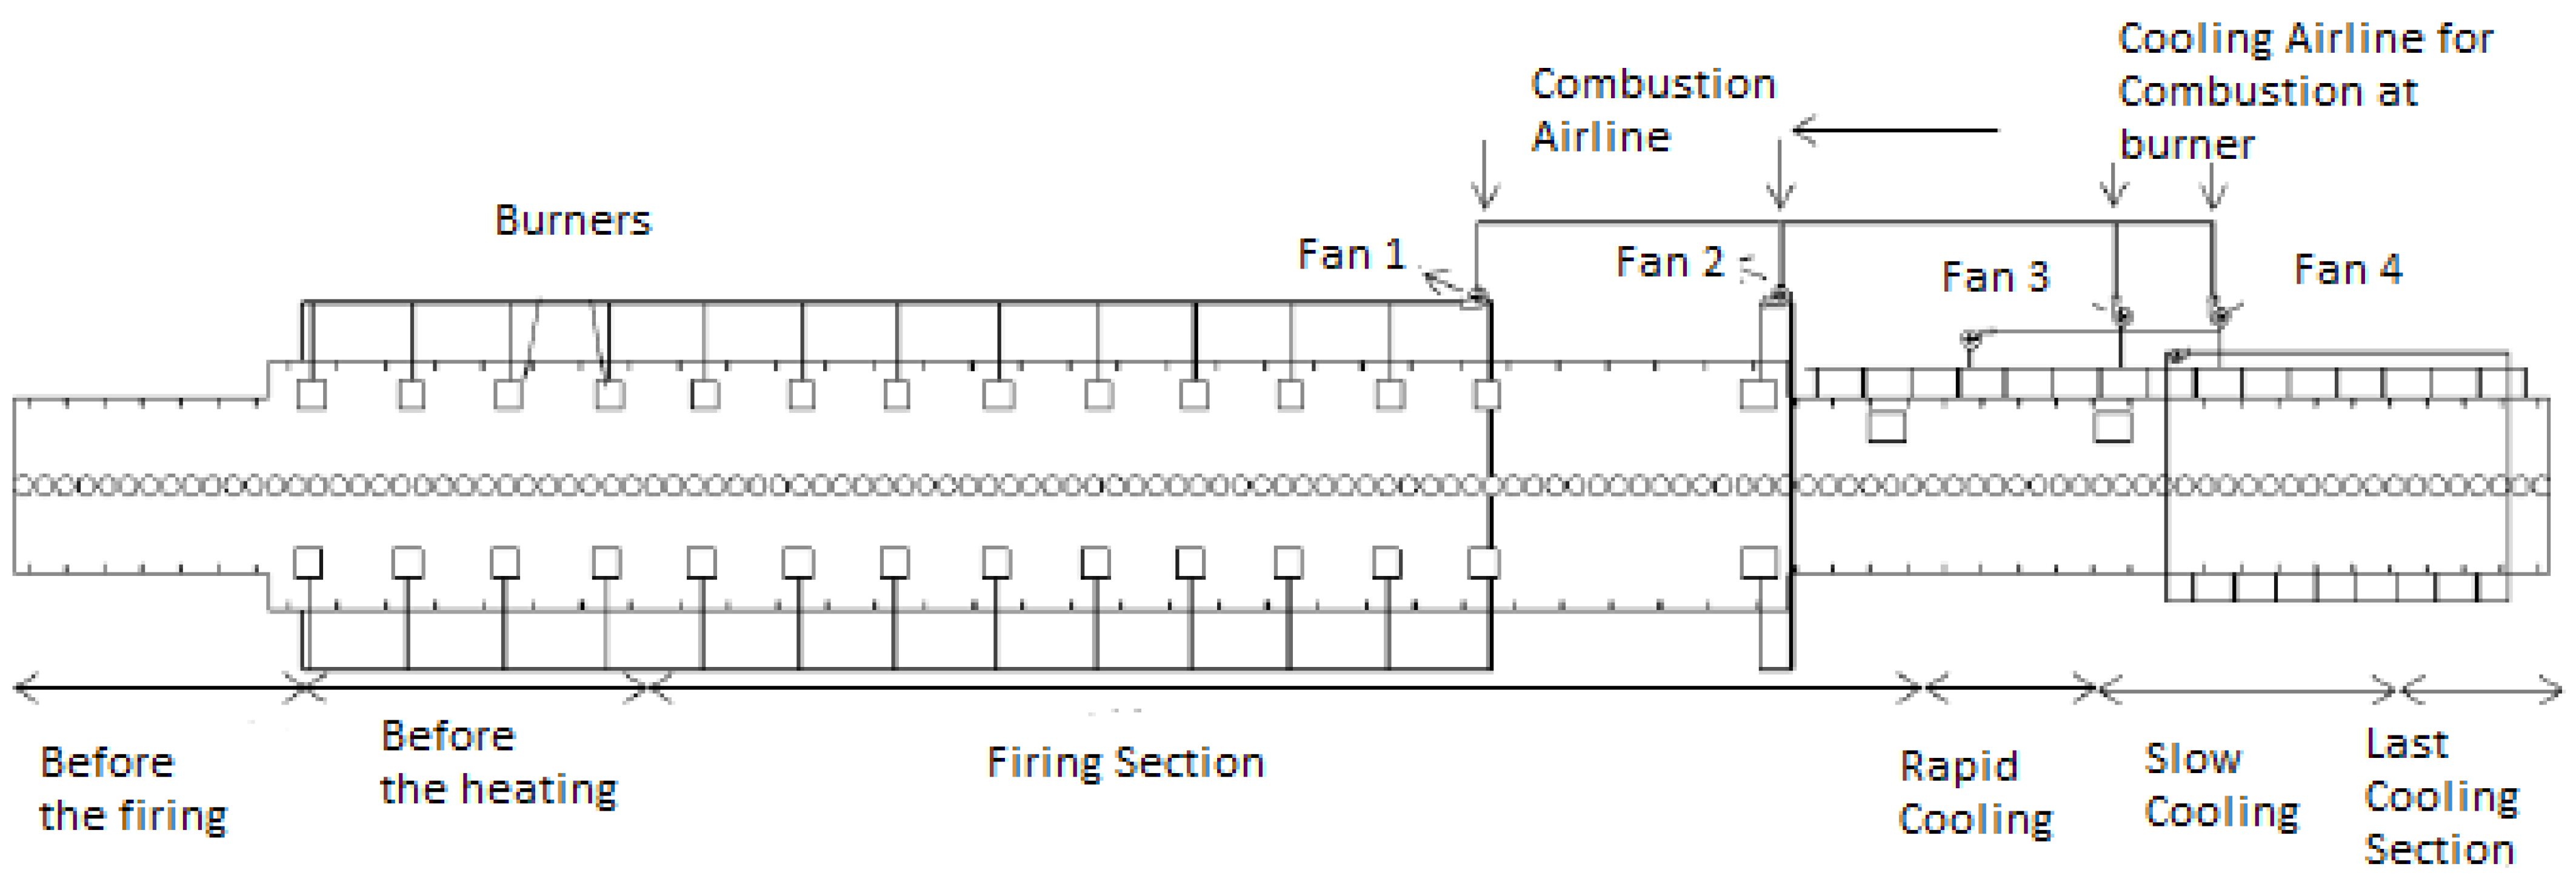
2.1. Experimental Setup

The recovered air optimization from cooling zone to firing zone resulted in reduction of natural gas consumption. This mechanism provides the waste heat recovery using the air of 167 °C from tunnel kiln cooling zone to preheating zone burners. Detail of the installed system is mentioned in the Figure 1.
The experimental setup is of a tunnel kiln of the ceramics industry under steady-state condition. Some assumptions are made to conduct the analysis, i.e., gas forms are ideal, combustion during the analysis is complete, and ambient temperature is 30 °C. For preheating zone of kiln, the combustion air, the tunnel kiln is equipped with a metallic radiation recuperator with separate design for two groups which is arranged above the cooling zone. The recuperator is shielded against the combustion ducts by the ceiling with bay. It consists of heat-resistant steel tubes and has a collecting box on either end. The recuperator is attached by a tunnel iron structure by two bracket plates. The plates near the burning zone rest loosely on two angles at the furnace roof so as to allow free expansion, while the rear end is rigidly mounted.

2.2. Experimental Procedure and Calculations

2.2.1. Conservation of Energy, Mass and Equation of Species in Preheating and Firing Zone

The Preheating Zone
Mass balance of air is given as follows:
m ˙ a ( x + Δ x ) = m ˙ a ( x ) m ˙ a ( x ) ( w ( x ) w ( x + Δ x ) )
Typical heat transfer equation in the tunnel kiln preheating zone is written below
d ( m ˙ a . C p a . T a ) d x = h s w . S b ( T a T b ) + h w . S w ( T a T W ) + ( C p H 2 O ( T S w T a ) + L V H 2 O ) m ˙ s w d w d x
The above equation gives the proper idea of heat loss by air in the preheating zone which is always equal to the sanitary ware heat transfer and inner area of the kiln by the method of convection method, plus the heat loss due to evaporation of water from sanitary ware and heat absorbed by the evaporated water.
The water evaporation from sanitary ware is expressed by the diffusion of the moisture that is equal to:
G b d w d x = S b π 2 D 4 . S w L S A W
Diffusion coefficient is governed as:
D = ε . D H 2 O τ
D is the coefficient of diffusion for water vapours and tortuosity of the sanitary ware is equal to
τ = 1 ε 0.2
The Firing Zone
Firing zone mass balance of the tunnel kiln is expressed as:
m ˙ a ( x ) = m ˙ G B ( x ) + m ˙ a ( x + Δ x )
where in the location of group burners:
m ˙ G B ( x ) = C f t ( m ˙ a c o m b + m ˙ G N )
Mass balance between two group of burners:
m ˙ G B = 0
In the firing zone, the heat loss by the air and gained by the air is equal to the accumulative heat transfer between the sanitary ware and air and in between the wall and air, in addition to heat released by natural gas combustion:
d ( m ˙ a . C p a . T a ) d x = h b . S s w ( T s w T a ) + h w . S w ( T w T a ) + Q c o m b
The heat equation in the burner group location:
Q c o m b = C f t . m ˙ G B . P C L + C f t . m ˙ a c o m b . C p
And in between the group of two burners:
  Q c o m b = 0  
The Cooling Zone
Air mass balance in the cooling zone is expressed below
m ˙ a ( x ) = m ˙ a ( x + Δ x ) + m ˙ a i , e
whereas, in the equation, the last term is the air mass flux that is injected in the cooling zone. Air mass flux m ˙ a i   is greater than zero, and the air mass extracted m ˙ a e   in the cooling zone is less than zero.
The heat mass balance in the cooling zone of tunnel kiln is expressed as
d ( m ˙ a . C p a . T a ) d x = h b . S s w ( T a T b ) + h w . S w ( T w T a ) + Q a i , e
In the above equation, the heat attained by the air is equal to convective heat transfer between the sanitary ware, air and wall, plus a source at the right side of equation.
At cooling zone injection position of the tunnel kiln
Q a i = m ˙ a i · C p a · T a m b
At the extraction position of cooling zone of the tunnel kiln
Q a e = m ˙ a e · C p a · T a e

2.2.2. Air to Fuel Ratio in Preheating and Firing Zone

Pre-heating zone (Group I gas): 32 ± 5 Nm3/h
Group II gas air flow: 40 ± 5 Nm3/h
Group II gas fuel flow: 590 ± 30 Nm3/h
Firing zone (Group III gas) air flow: 105 ± 5 Nm3/h
Firing zone (Group III gas) fuel flow: 1000 ± 50 Nm3/h
Tunnel kiln temperature range: 150 °C~1300 °C
The air to fuel ratio of entire combustion is as follows
Air/fuel ratio which is 13.77 in peak firing zone and 9.54 in the post firing zone, for the ratio in the peak combustion, the equation can be expressed as
(0.9194 CH4 + 0.0353 C2H6 + 0.009 C3H8 + 0.0038 C4H10 + 0.0011 C5H12 + 0.026 N2 + 0.0048 CO2) + 13.77 (0.20590 O2 + 0.7748 N2 + 0.019 H2O+0.0003 CO2)
The air in the combustion chamber is determined as
(75.75 N2, 23.01 O2, 1.19 H2O, 0.02 CO2)
The air in the combustion chamber is determined as
(75.75 N2, 23.01 O2, 1.19 H2O, 0.02 CO2)
(0.9194 CH4 + 0.0353 C2H6 + 0.009 C3H8 + 0.0038 C4H10 + 0.0011 C5H12 + 0.026 N2 + 0.0048 CO2) + 9.54 (0.20590 O2 + 0.7748 N2+0.019 H2O + 0.0003 CO2)
The air in the combustion chamber is determined as
(75.75 N2, 23.01 O2, 1.19 H2O, 0.02 CO2)
The rates of all contents of material in physical energy is stated below,
Ėni ph = ṁi hi = ṁi cpi Ti
‘h’ is expressed as enthalpy and ‘T’ is the required temperature and ‘cp’ is expressed as specific heat capacity, where ‘i’ means ith components in equation mentioned above,
Ėphfuel = ṁ fuel (LHV)
Highest activity which can be obtained by mass and heat transfer is known as exergy, and by this, the system reaches equilibrium with the environmental conditions. Due to the effect of irreversibility the exergy can be destroyed or consumed that can arise in the system as divergent to energy conservation.
The exergy equation of concerned material is expressed in the general way mentioned below,
Ėx = Ėxph + Ėxch
By this analysis we know that ‘Ėxch’ is expressed as the chemical exergy rate and ‘Ėxph’ is known as physical exergy rate and
The physical exergy equation of formed gas can be stated as
Ėxph = ṁi [(hi − ho)] − To (si − so)]
where si, p, and R are the gas constant and ‘o’ is expressed as the environmental state in the equation above.
Ėxphgas = mi [ cp (Ti − To) − To In (Ti/To)] + RTo In (Pi/Po)]
The overall gas content specific chemical exergy is calculated in the equation mentioned below
ē ex ch = ∑ Xk’ ϵ − 0k + RTo ∑ Xk’ ln Xk’
Molar gas constant is denoted by R and ‘x’ is molar rate. Specific chemical exergy of hydrocarbon fuel such as ‘Ca Hb’ is formulated.

3. Results and Discussion

3.1. Thermal Analysis of Tunnel Kiln

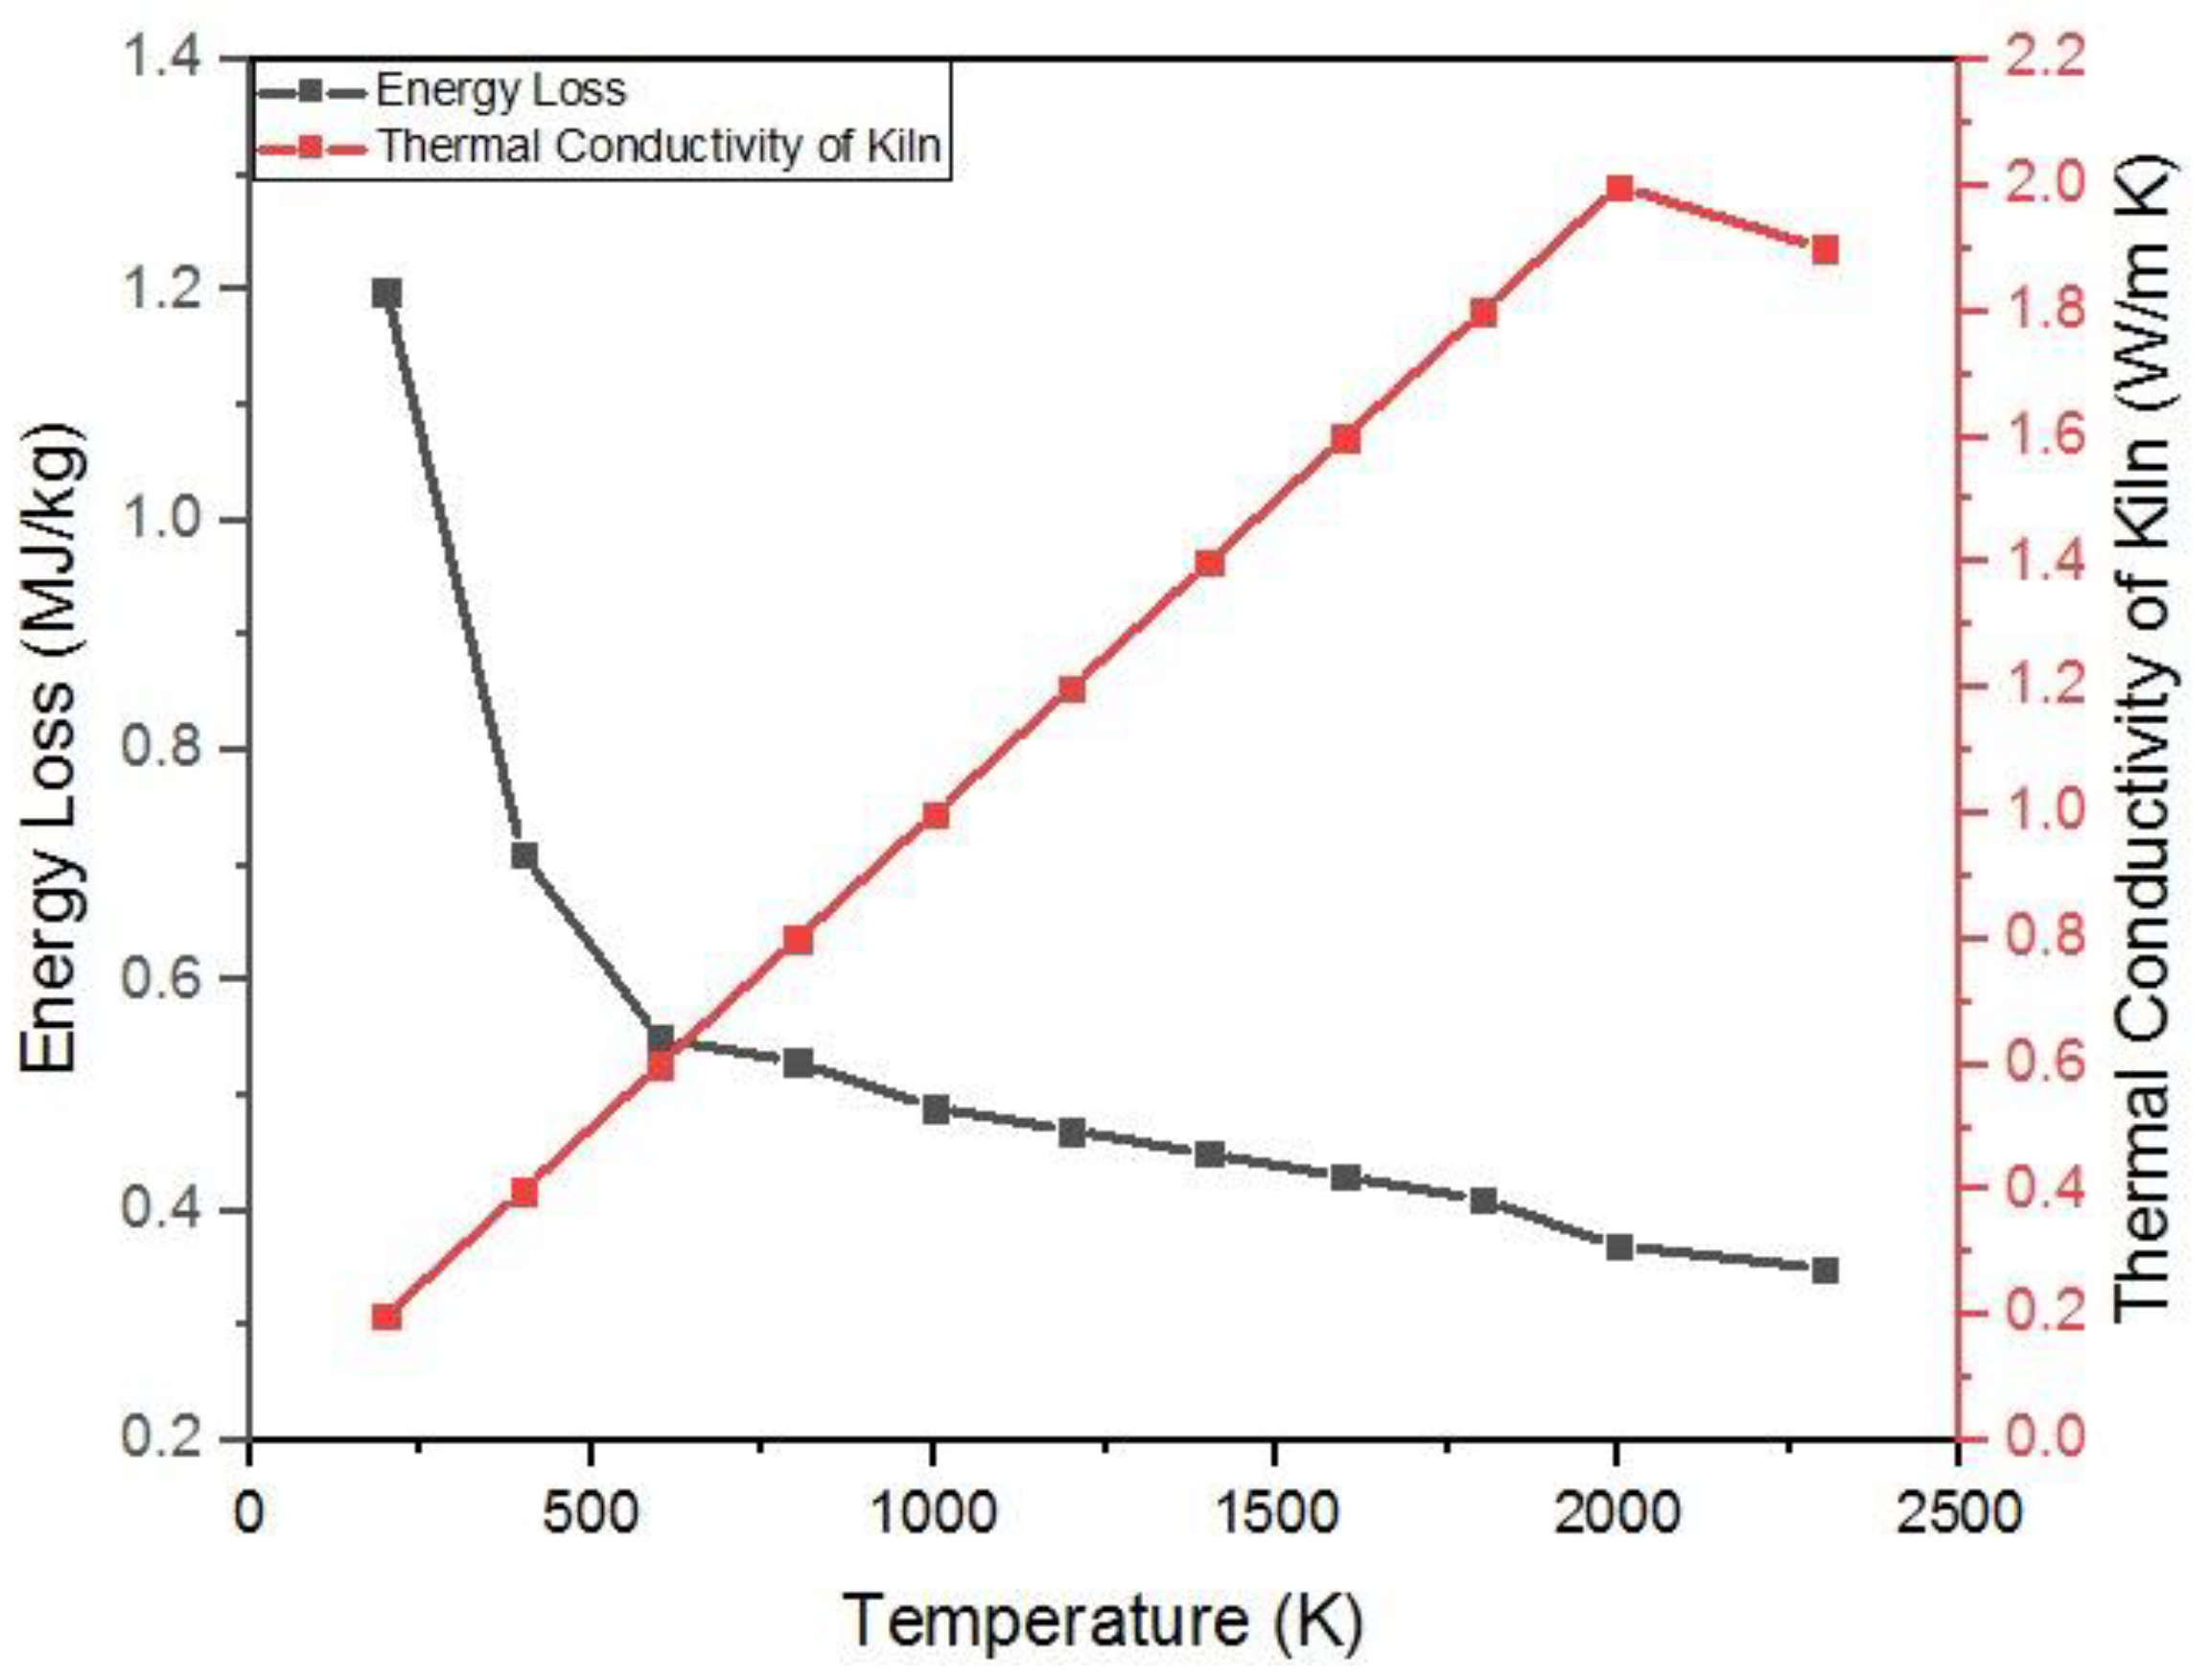
3.1.1. Effect of Thermal Conductivity and Energy Loss for different Temperature Profiles of Tunnel Kiln

In Figure 2, the conductivity of the tunnel kiln car is examined with respect to energy loss. The tunnel kiln furniture is made up of the refractory material and constructive material and the selected kiln is also made of refractory blocks and steel structure. Experimentally, it is observed that by increasing the conductivity of the tunnel kiln, car energy loss increased. It is observed that the thermal conductivity of insulated material is less than the constructed material. Thermal conductivity of the material is ranged from 0.02 W/m K to 2 W/m K. The thermal conductivity of the material of the tunnel kiln is 0.5 W/m K at 1300 °C, and the energy loss will be 0.43 MJ/kg. Therefore, by this graph, it is clear that if the thermal conductivity is low, there is low energy loss in the tunnel kiln. In general, the most important part of this research is to conserve energy.

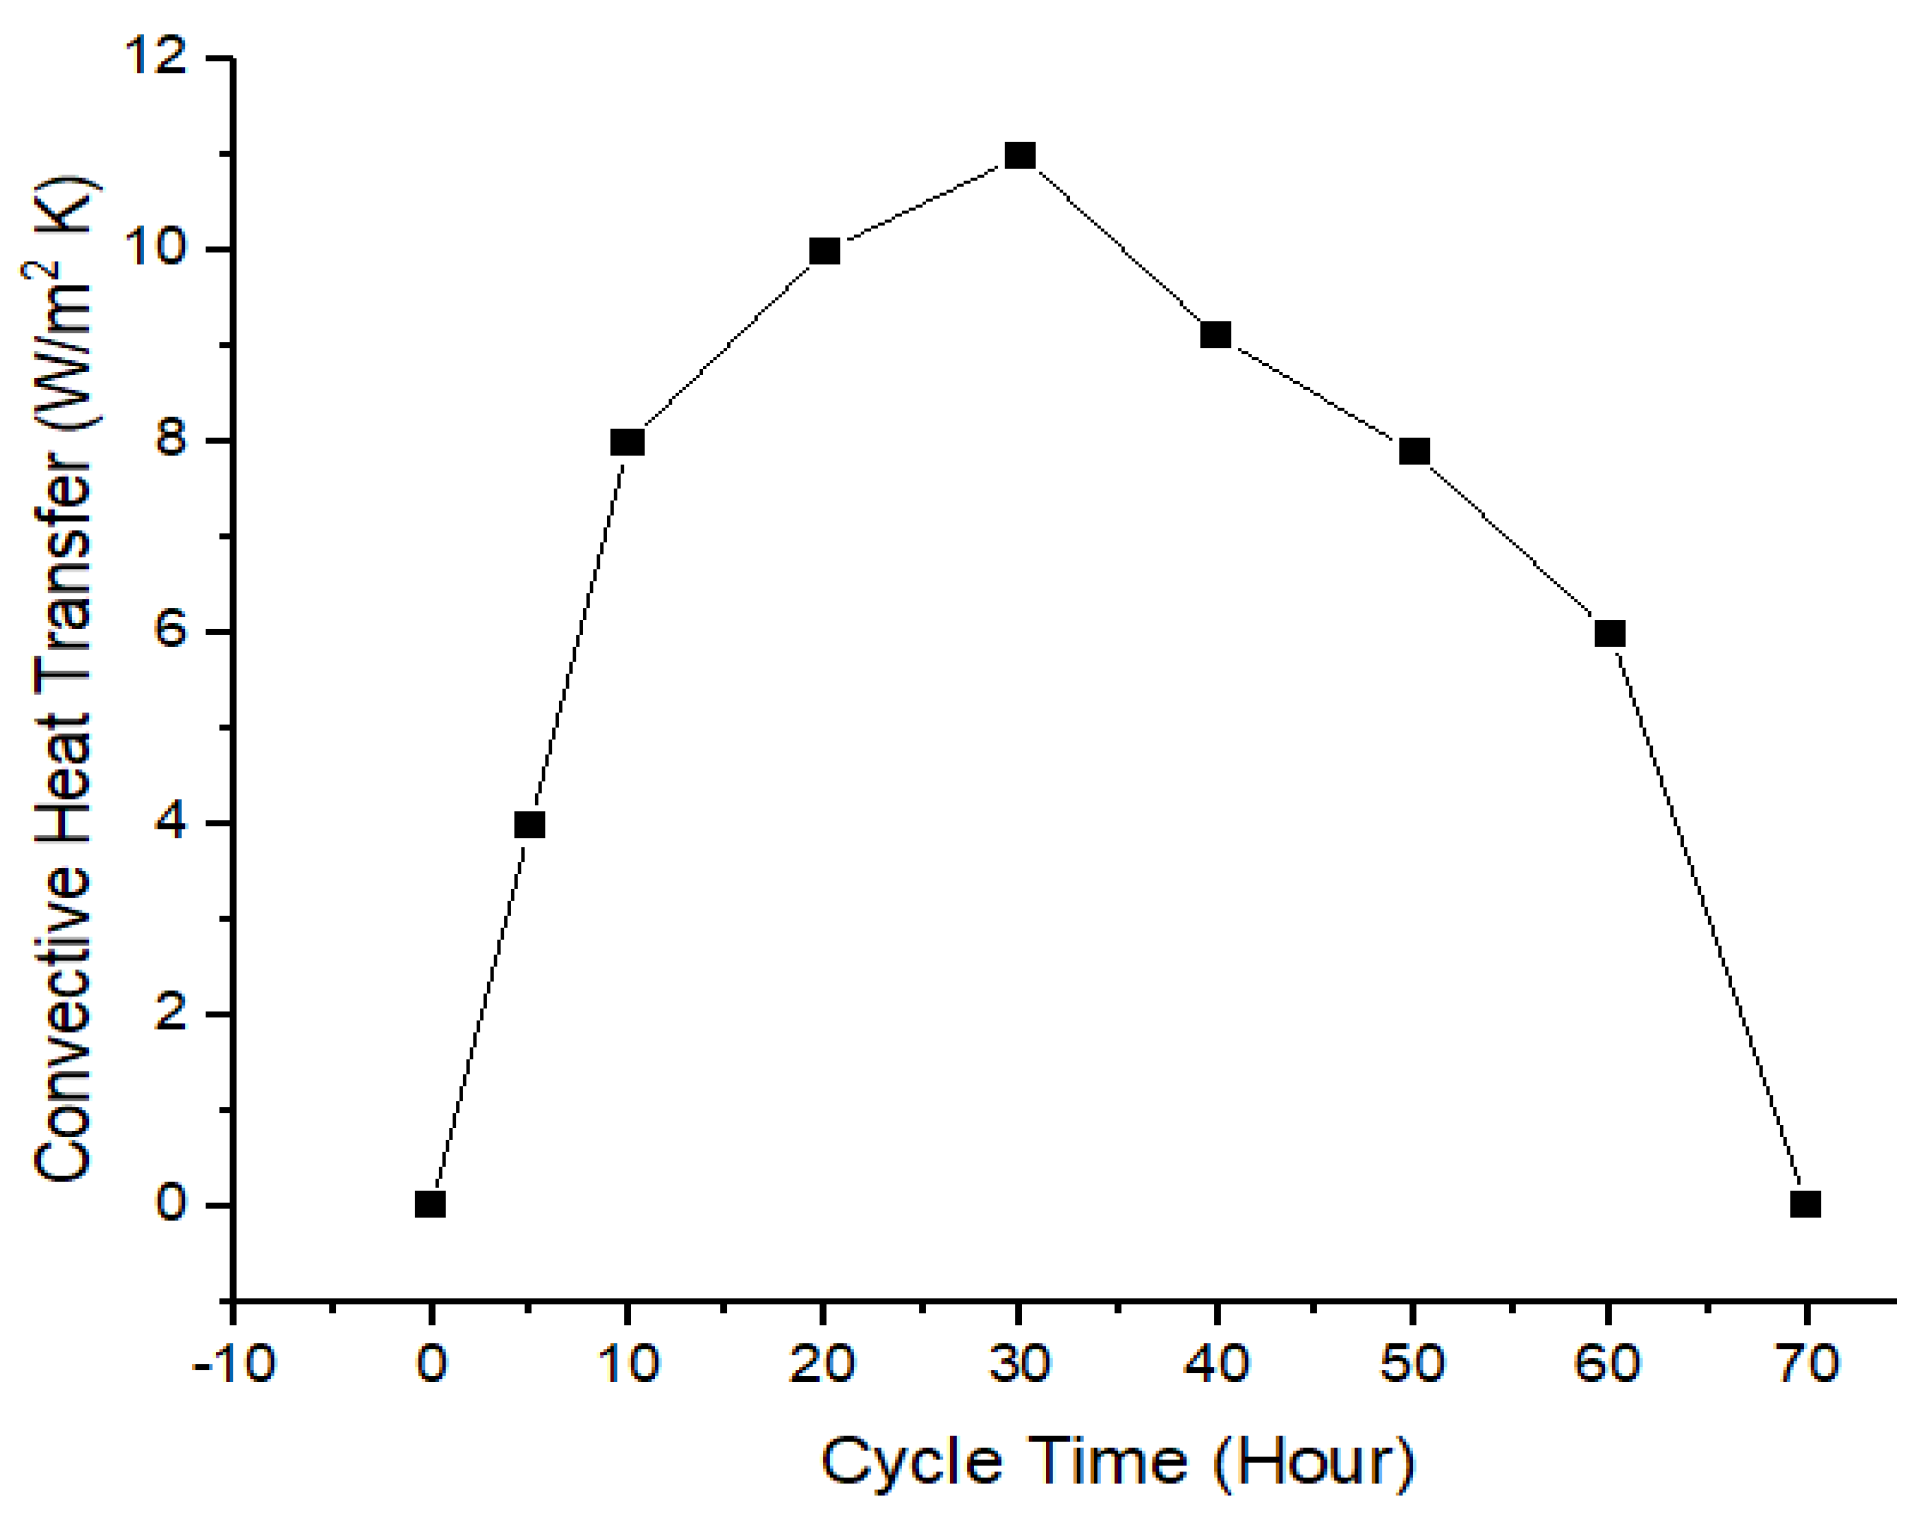
3.1.2. Effect of Heat Transfer for Different Cycle Times of Kiln

Figure 3, represents the heat transfer along the cycle time for a tunnel kiln. After 10 h, heat transfer value was 8 W/m2 K, whereas after 20 h, the heat transfer was increased only 20% i.e., 10 W/m2 K. After 30 h in firing zone, the heat transfer value was quite similar and only 1 W/m2 K increment was observed. Convective heat transfer will increase by increasing the temperature of the tunnel kiln.

3.1.3. Effect of Pressure of Tunnel Kiln for Pre and Post Heat Recovery System

Figure 4 explained the effect of pressure at the pre- and post-heat recovery system. The recommended standard value for kiln draft pressure inside is 1.0 mm H2O, so to maintain the pressure up to the standard value, installation of the heat recovery system some experiments were performed. After installation of the heat recovery system, it was observed that the kiln pressure range was under range. Before installing the heat recovery system, the values of kiln pressure were 0.85, 0.88, 0.87, 0.84, 0.85, 0.89 mm H2O which was not appropriate for standard operating of the tunnel kiln. However, after installing the heat recovery system, the pressure inside the tunnel kiln was 1.06, 1.02, 1.01, 1.05, 1.06 mmH2O which was under range as per standard for the tunnel kiln. It is mandatory to maintain the kiln pressure up to 1.0 mmH2O for complete draught inside the kiln. If the range of the kiln pressure is not up to standard limit, the natural gas flow will be disturbed.

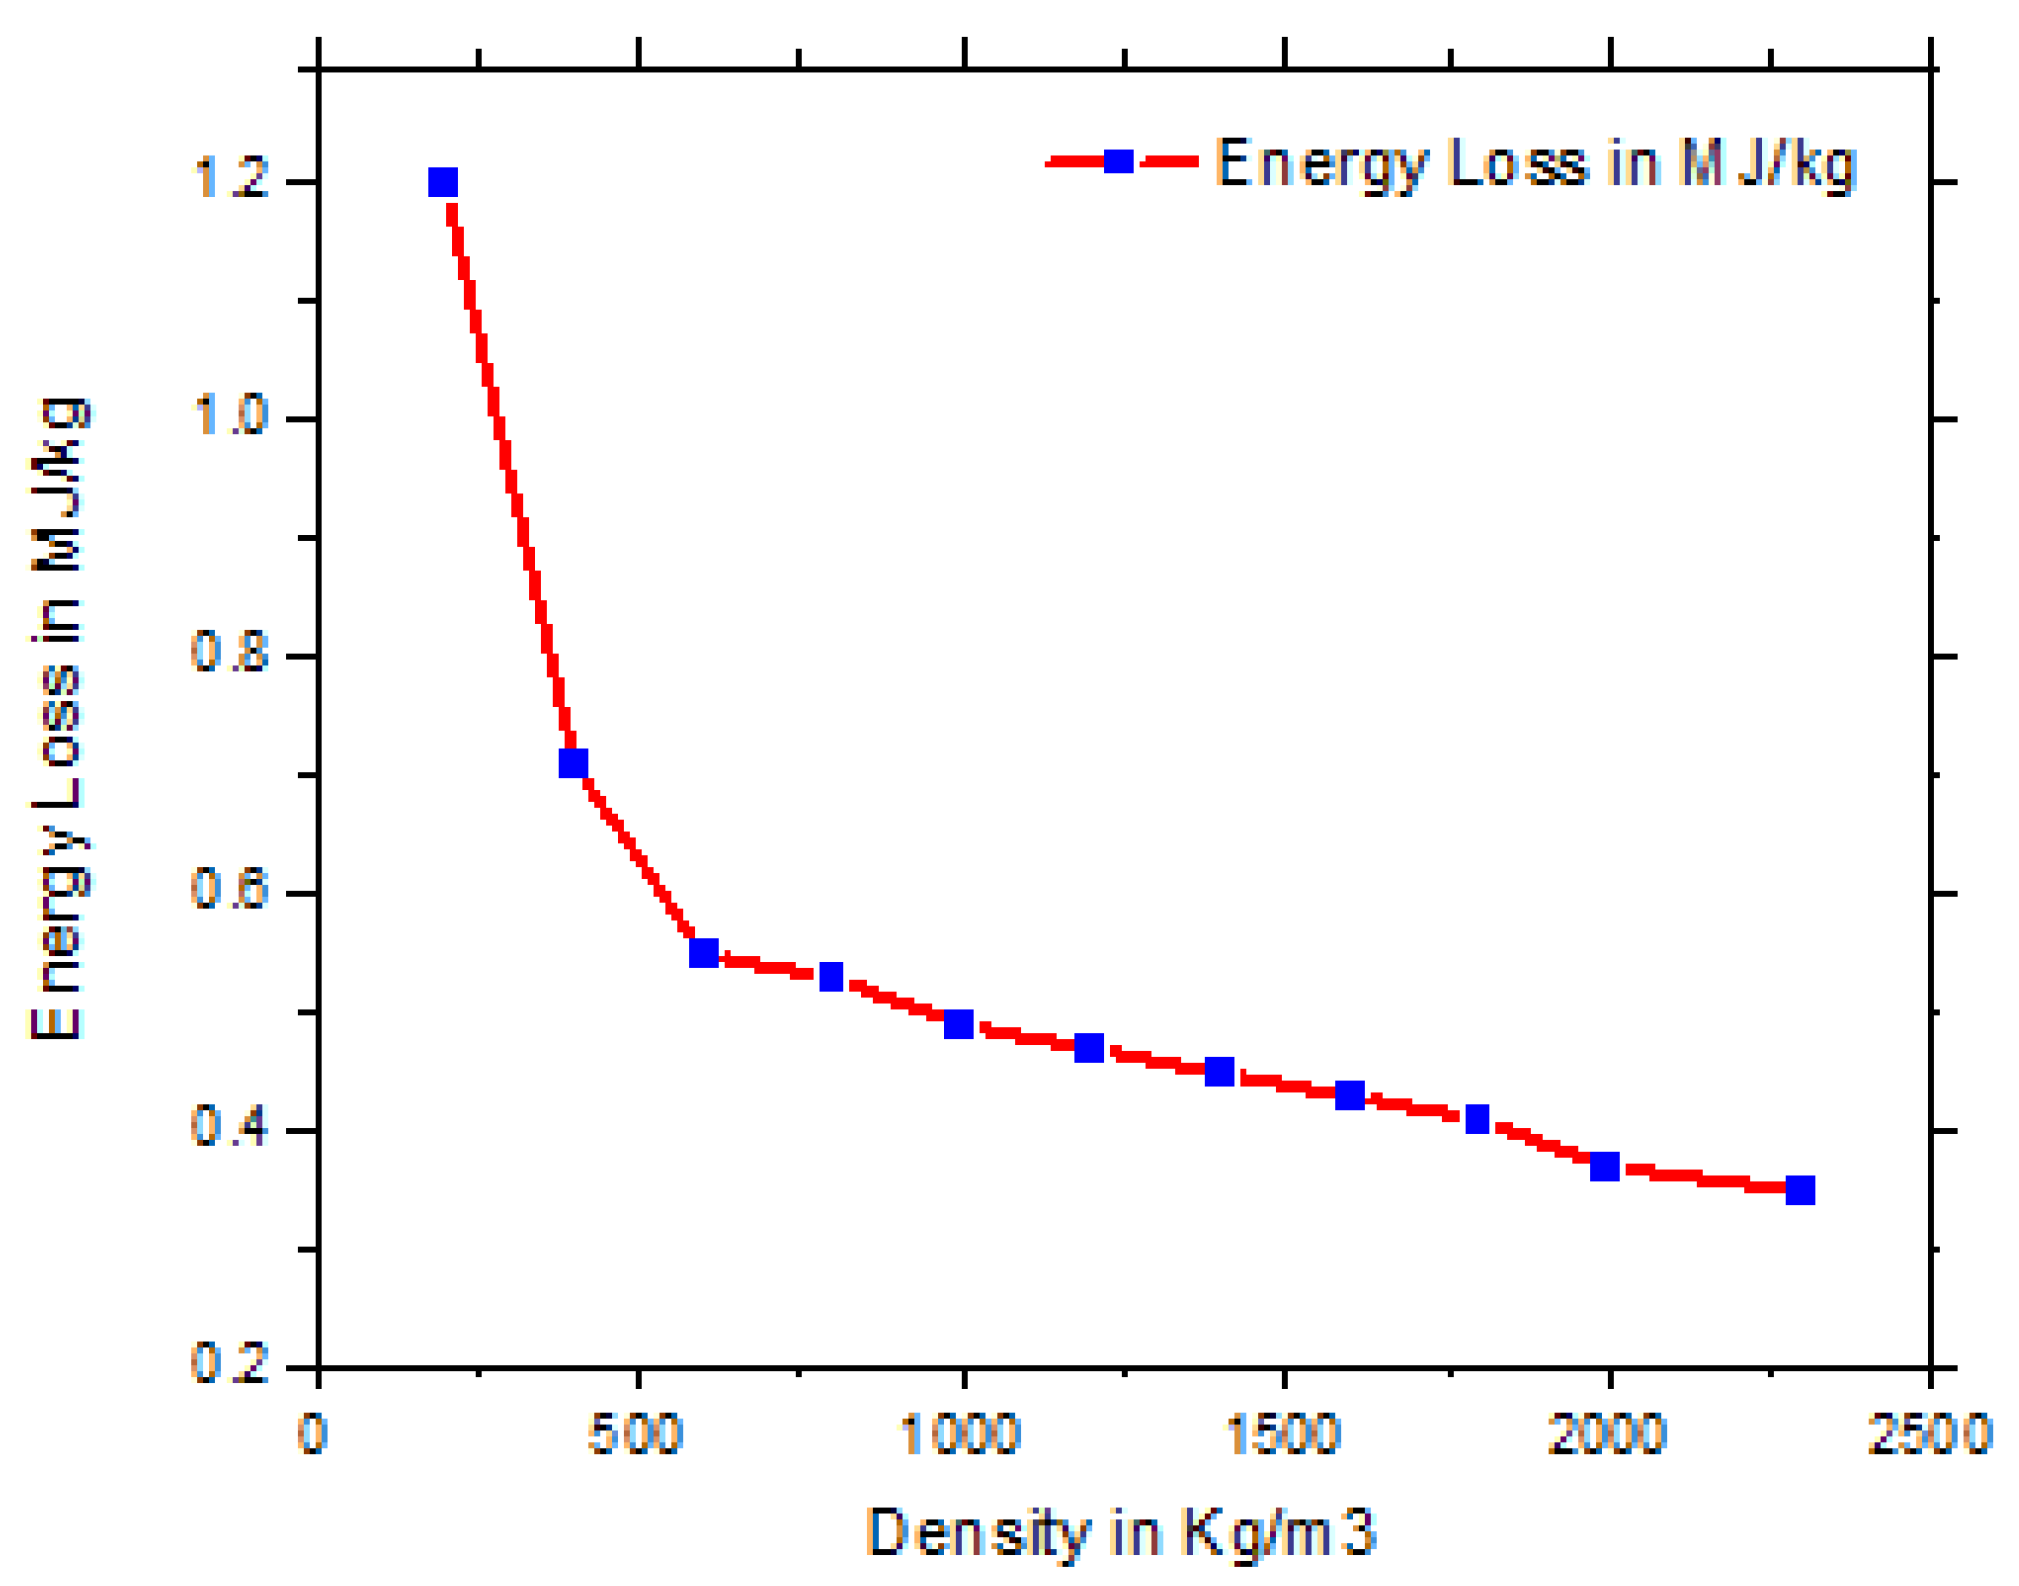
3.1.4. Effect of Density of Ceramics Material of Tunnel Kiln on Energy Loss

In Figure 5, it is observed that by increasing the density of refractory material, the energy loss decreased. Industrial data showed that the density of the material fired in the tunnel kiln was higher than 2000 kg/m3. By increasing the density of the fired material, higher conductive resistance occurs. If the solid density increased, the thermal diffusivity of the car will be decreased. As a result, by increasing the density of material, the heat transfer along the kiln car will decrease and energy loss will minimize. In Figure 5, it is observed that an increase in density of ceramics material will result in the energy loss being decreased. One other recommendation is that if we reduce the slab size of the tunnel kiln car and increase the density of the tunnel kiln car, then thermal energy consumption along the kiln will reduce. If there is a proper selection of material having a density of 2000 kg/m3, the energy loss will be minimized, i.e., 0.39 MJ/kg.

3.1.5. Effect of Temperature Profile and Natural Gas Consumption of Tunnel Kiln

The thermal energy consumption along the temperature profile of the tunnel kiln is mentioned in the Figure 6. By increasing the temperature of kiln, the thermal energy consumption of tunnel kiln is in an increasing trend. The thermal capacity of the burner installed in the tunnel kiln is 2000 kcal/h. The total length of the ceramics kiln is taken 100 m, which includes 30 m pre-heating zone, 20 m firing zone, 30 m cooling zone. Total 44 tunnel kiln cars were traveling in the kiln. The process is totally sequential because the process of the tunnel kiln is always continuous. Different products are loaded on the tunnel kiln cars, which is heated up at the maximum temperature and cooled down at ambient temperature. Natural gas consumption along the tunnel kiln temperature is explained below. In Figure 6, thermal energy consumption along the temperature profile of the tunnel kiln is explained. There are three zone of the tunnel kiln i.e., pre-heating, oxidation and firing zone. Thermal energy consumption at the temperature of 202 °C to 560 °C in preheating is 0.591 MMBtu/h. Thermal energy consumption at a temperature of 742 °C to 939 °C in oxidation zone is (0.739~0.750) MMBtu/h. Thermal energy consumption at a temperature of 1076 °C to 1183 °C in firing is 1.846~1.898 MMBtu/h.

3.1.6. Flu Gas Analysis in Pre-Heating and Firing Zone

Experimentally, oxygen analysis was done by Flu-gas analyser, which has a basic O2 and CO sensing probe. The Measuring range of the instrument for O2 is up to 29 percent volumetrically and for CO, the measuring range is up.to 2000 ppm with a resolution of one ppm [38]. Table 3 describes the experimental values of different zones in the tunnel kiln which have been compared with the international standard. The level of O2 was analysed before installation of heat recovery system in oxidation, preheating, reduction, and firing zones of the tunnel kiln. It was observed that the level of O2 before installation of the heat recovery system was out of range. The standard values for O2 in the pre-heating and oxidation zone should not be greater than ≥8%. O2 must be zero in this zone. The standard values for O2 in firing zone should not be greater than 3%. It has been shown in the below table that the O2 in firing zone was a little bit out of range before installing the heat recovery system. It was observed that the level of O2, after installation of the heat recovery system are in range. The standard values for O2 in the pre-heating and oxidation zone should not be greater than or equal to 8%. The standard values for O2 must be zero in this zone. The standard values for O2 in the firing zone should not greater than 3%. It has been shown in the below table that the O2 in natural zone is in range after installing the heat recovery system.

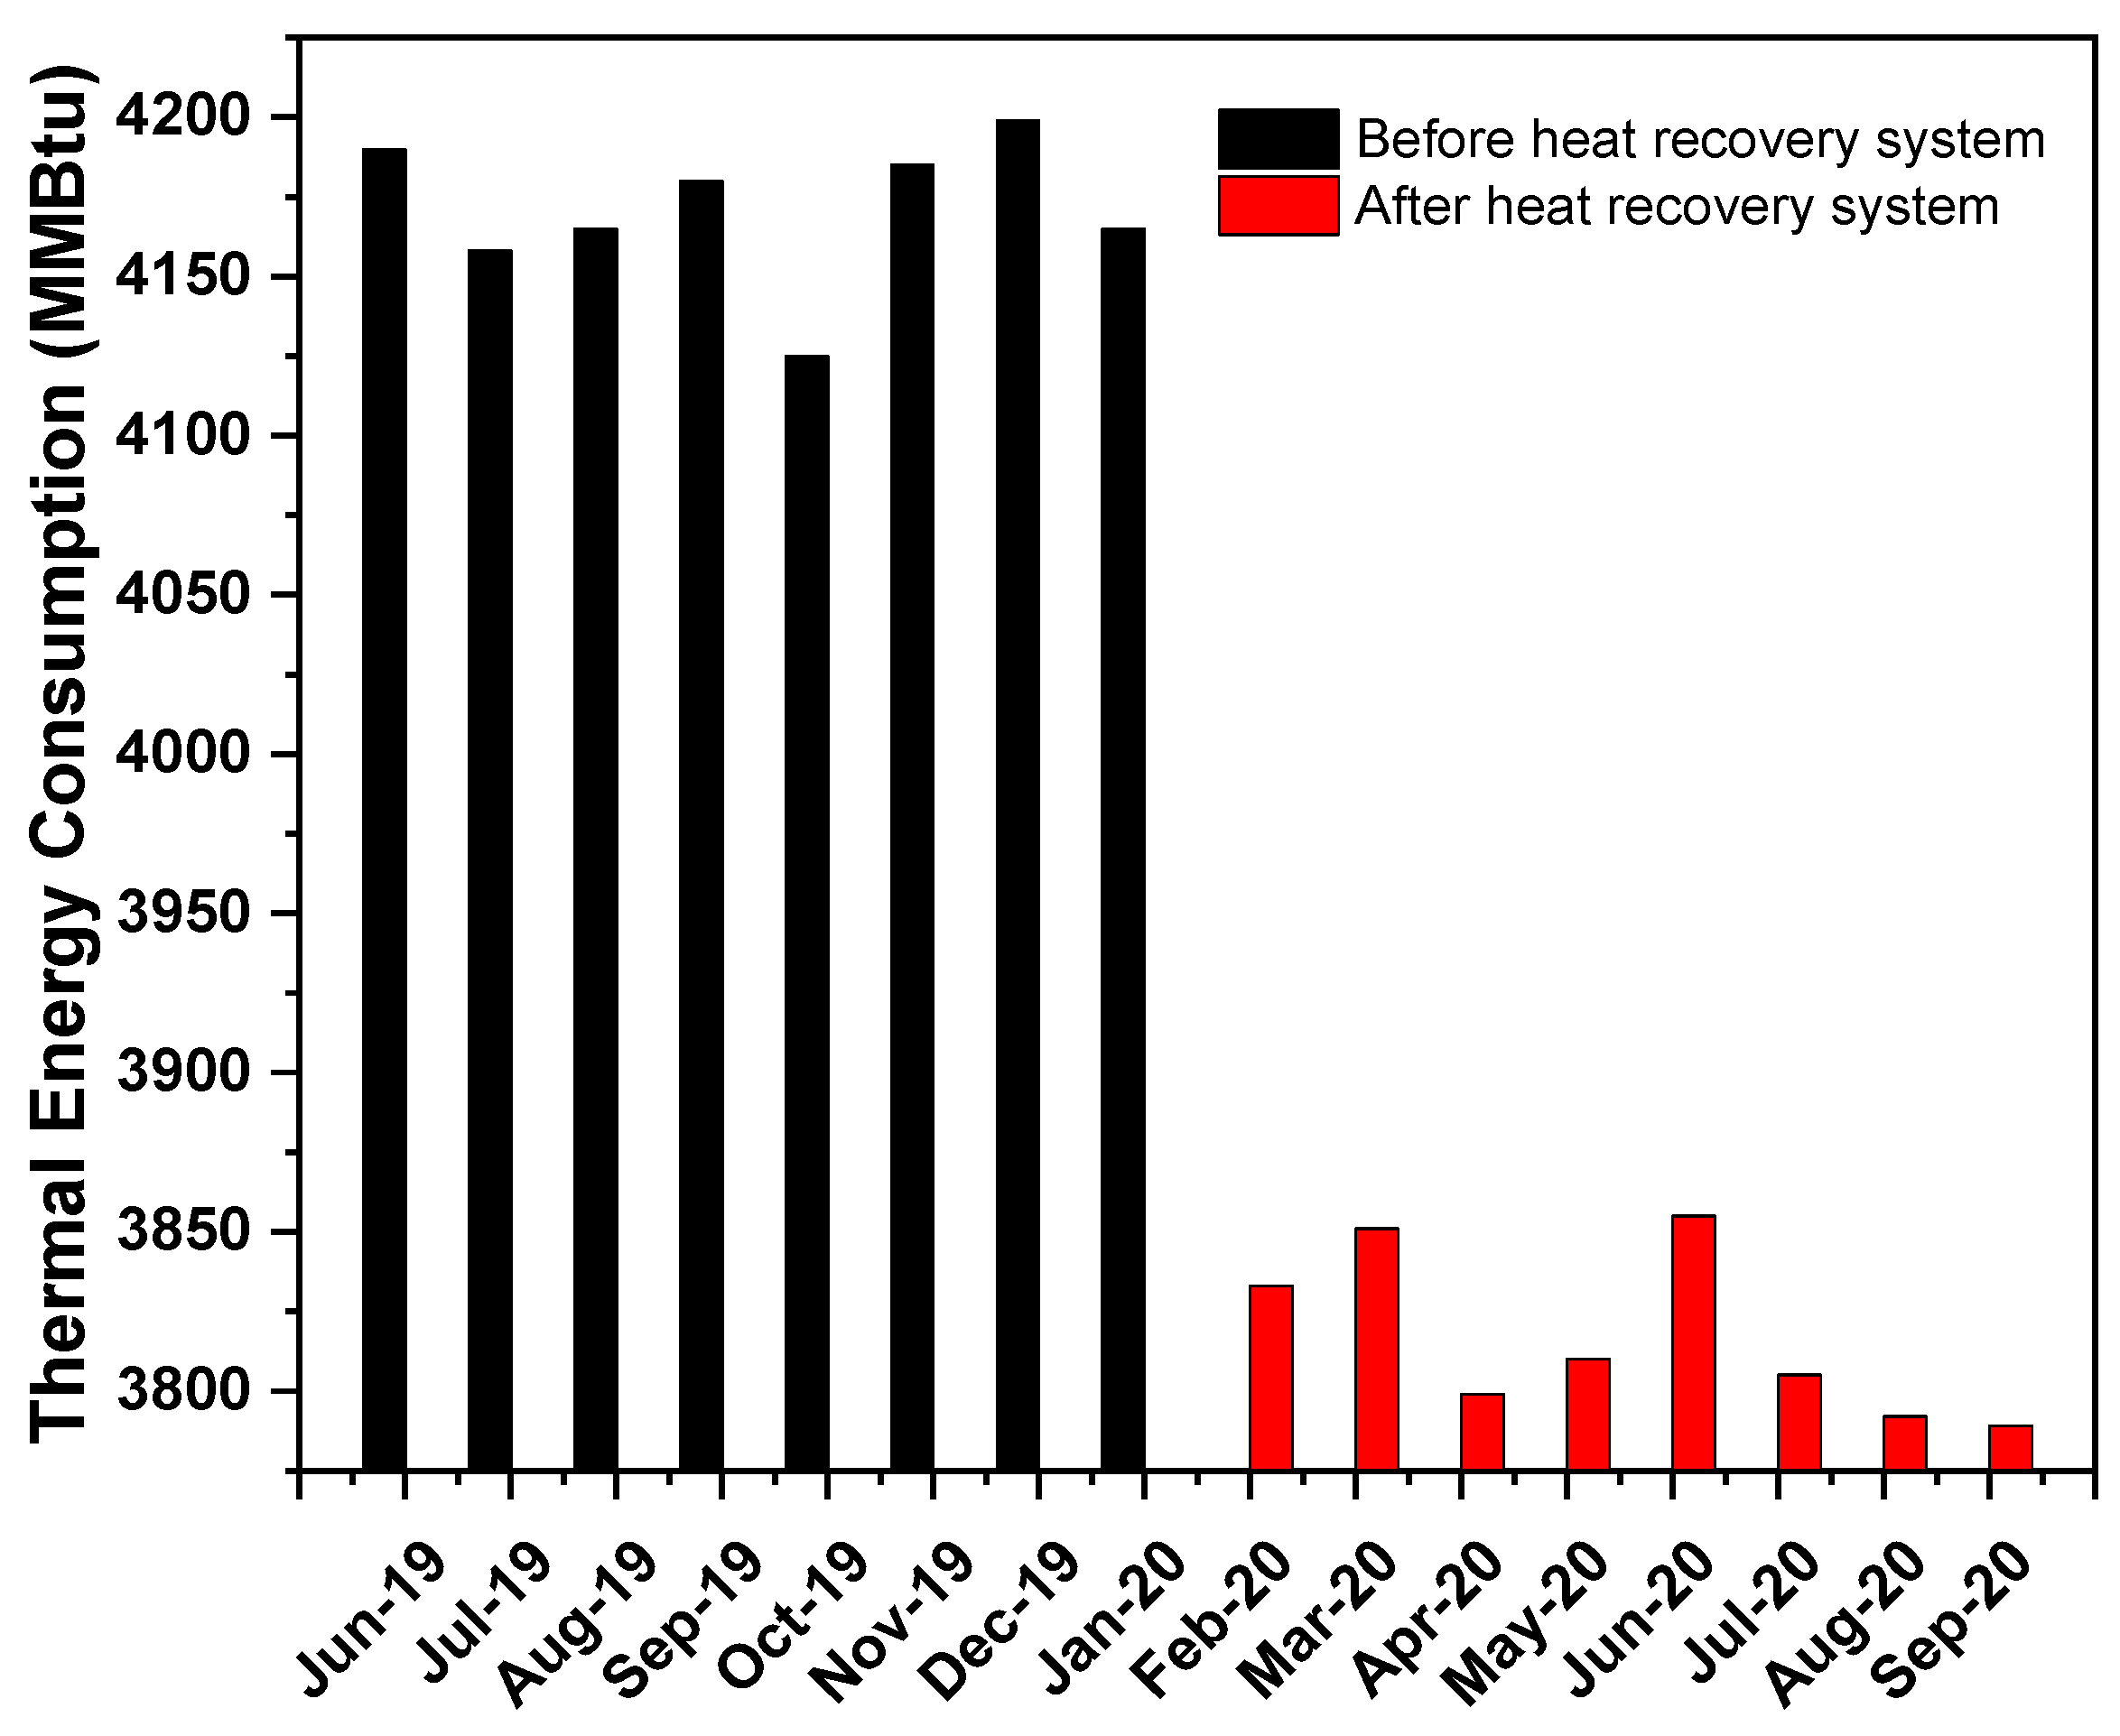
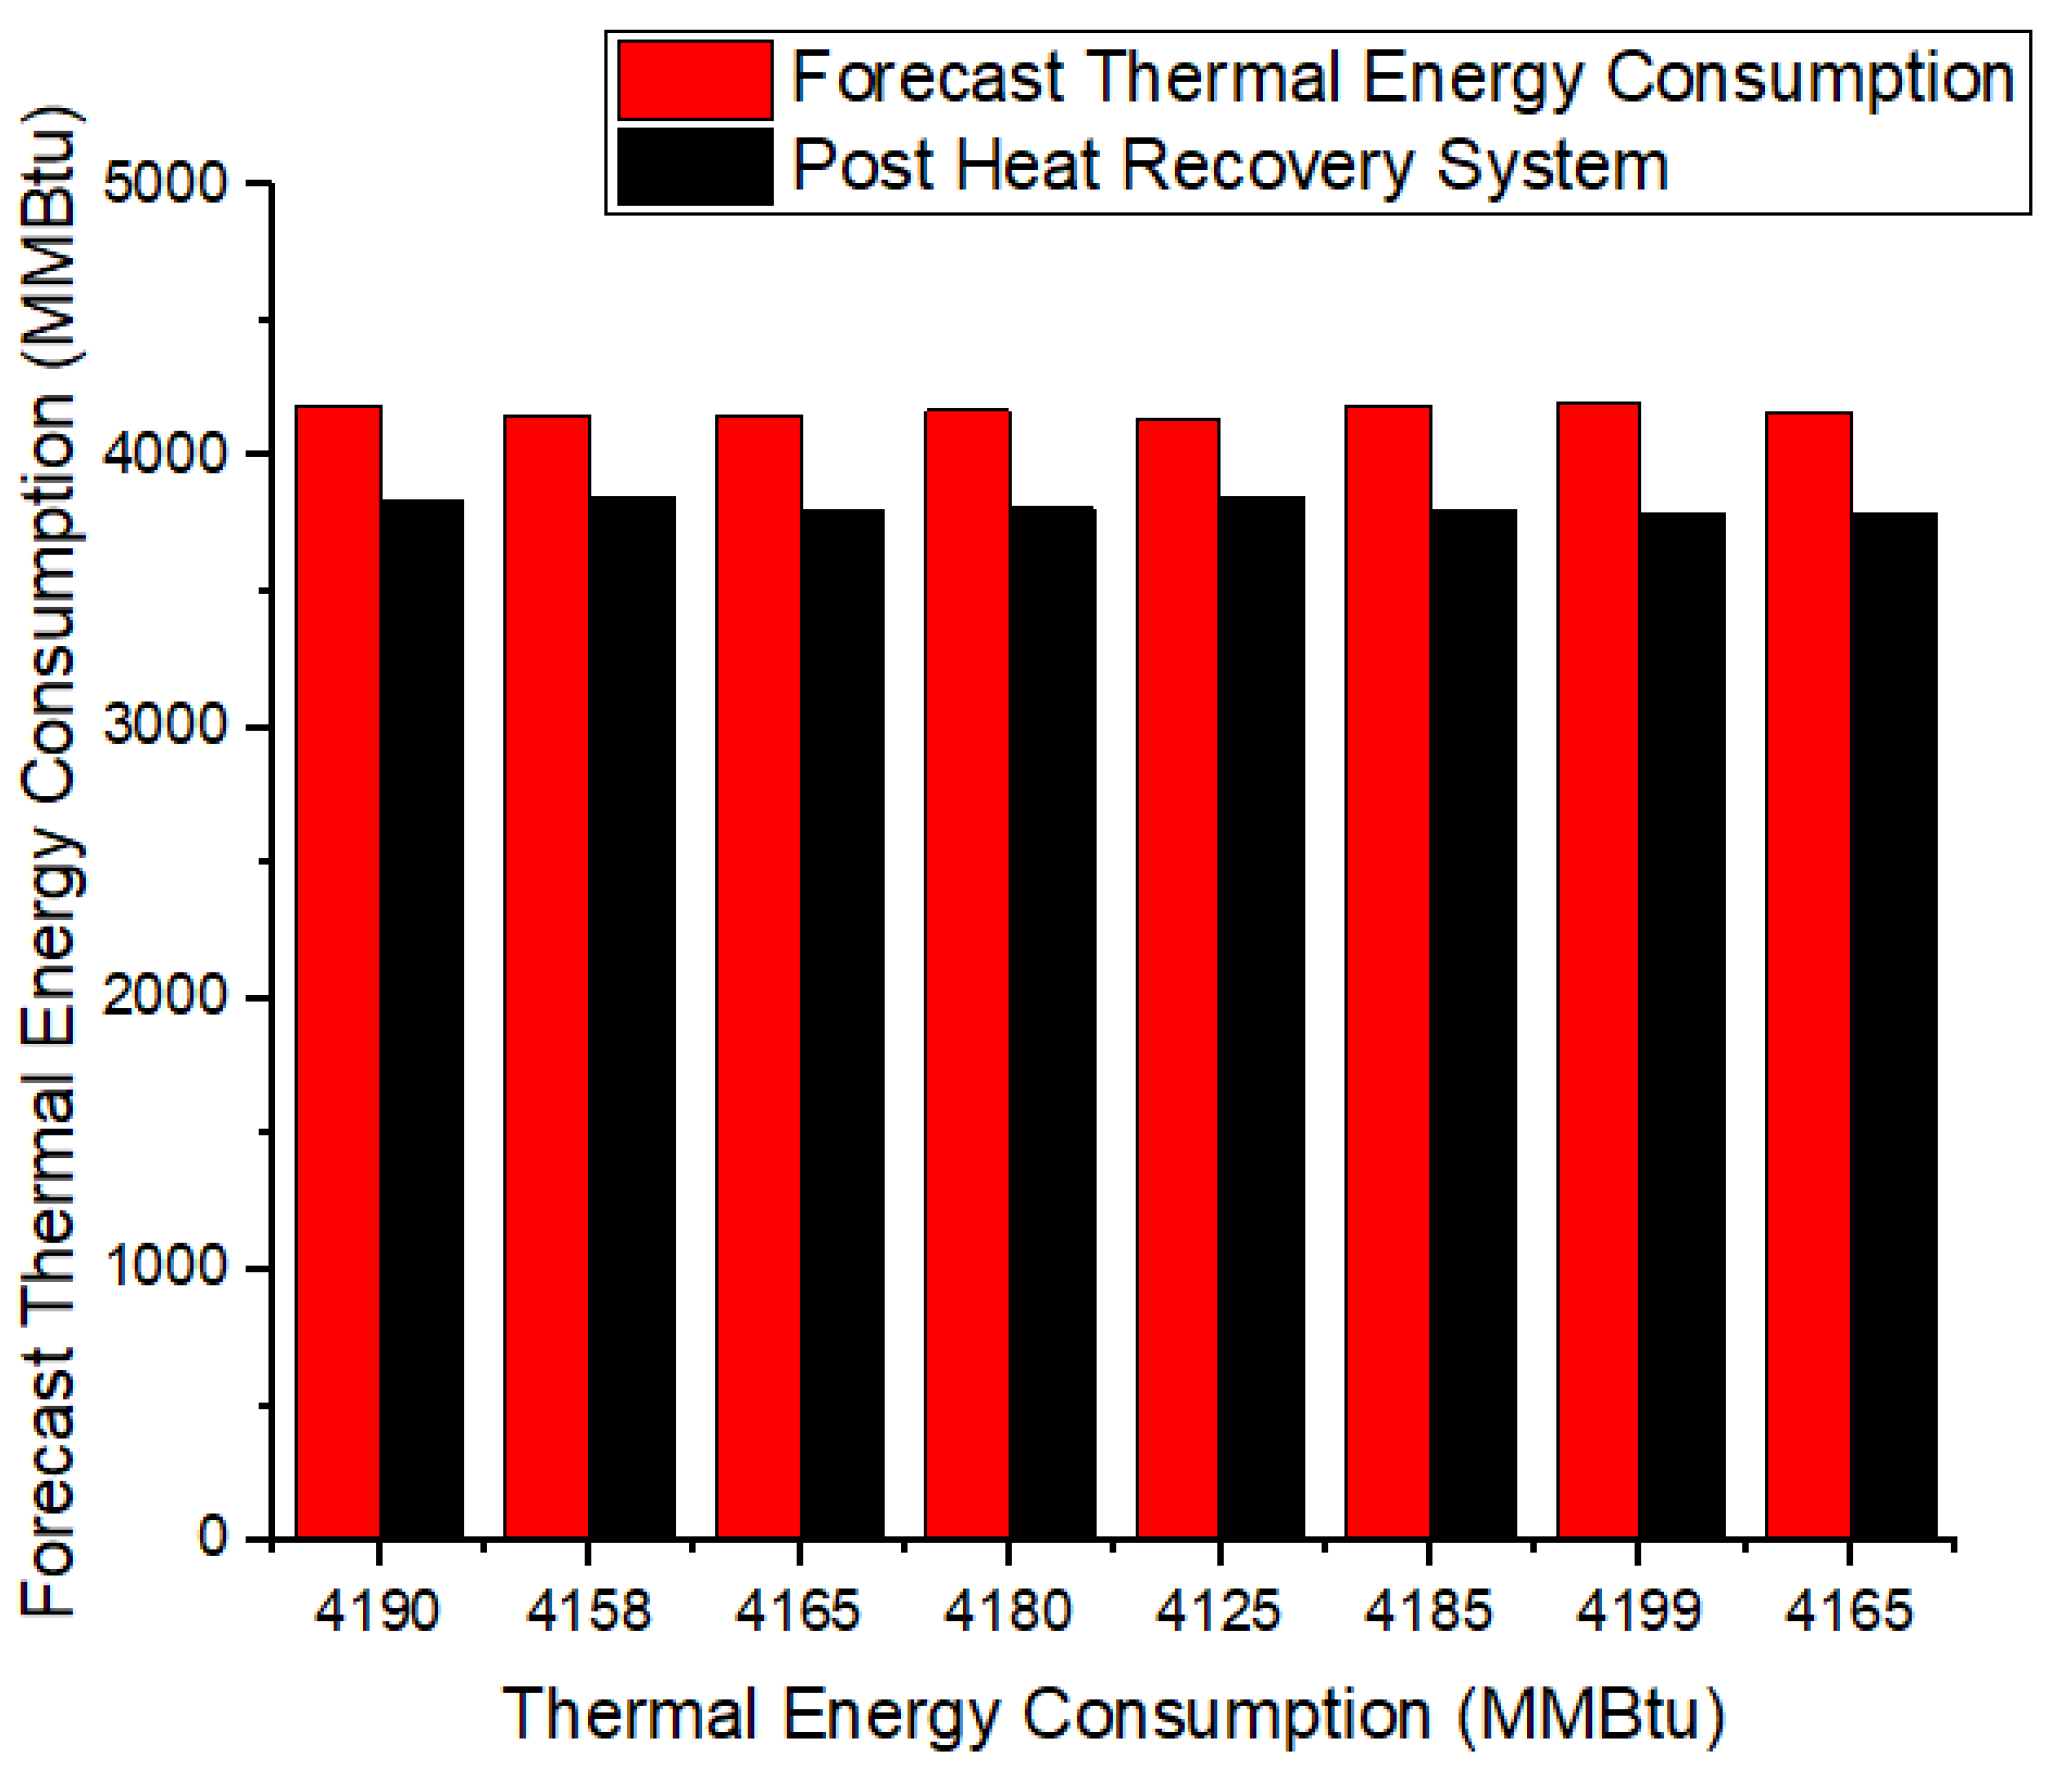
3.1.7. Thermal Analysis of Pre and Post Heat Recovery System

The detailed analysis of exergy and energy approach is performed on the system of the selected tunnel kiln. The waste heat recovery is achieved by adding the recovered air mass from cooling zone to preheating zone of tunnel kiln. The energy consumption required for the firing zone of the tunnel kiln is determined under normal conditions. Before installing the heat recovery system, the natural gas consumption and combustion air are 5.80 m3/h and 0.33 m3/h. The total consumption of natural gas in the tunnel kiln was 4171 MMBtu per month before installing the heat recovery system.
Heat recovery system gives the decrease in natural gas consumption to 0.29 m3/h and 8% natural gas saving has been achieved. The heat recovery system was installed in February 2020. For the preheating of the combustion air tunnel, the kiln is equipped with a metallic radiation recuperator with separate design for two groups which is arranged above the cooling zone. The recuperator is shielded against the combustion ducts from the ceiling with bay. It consists of heat-resistant steel tubes and has a collecting box on either end. The recuperator is attached with a tunnel iron structure by two bracket plates. The plates near the burning zone rest loosely on two angles at the furnace roof so as to allow free expansion, while the rear end is rigidly mounted.
Figure 7 shows the comparison of thermal energy consumption before and after installing the heat recovery system. The detailed analysis of thermal consumption is carried out, and thermal energy consumption in June 2019 was 4190 MMBtu and thermal consumption in July 2019 was 4158 MMBtu, which is 7.63% lower. Thermal energy consumption in August 2019 was 4165 MMBtu, which is 5.96% lower. The average value of thermal energy consumption after installing the heat recovery system is 8.5% lower, which is a significant value. The values of February-2020 to September-2020 are at low trends in terms of thermal energy consumption.

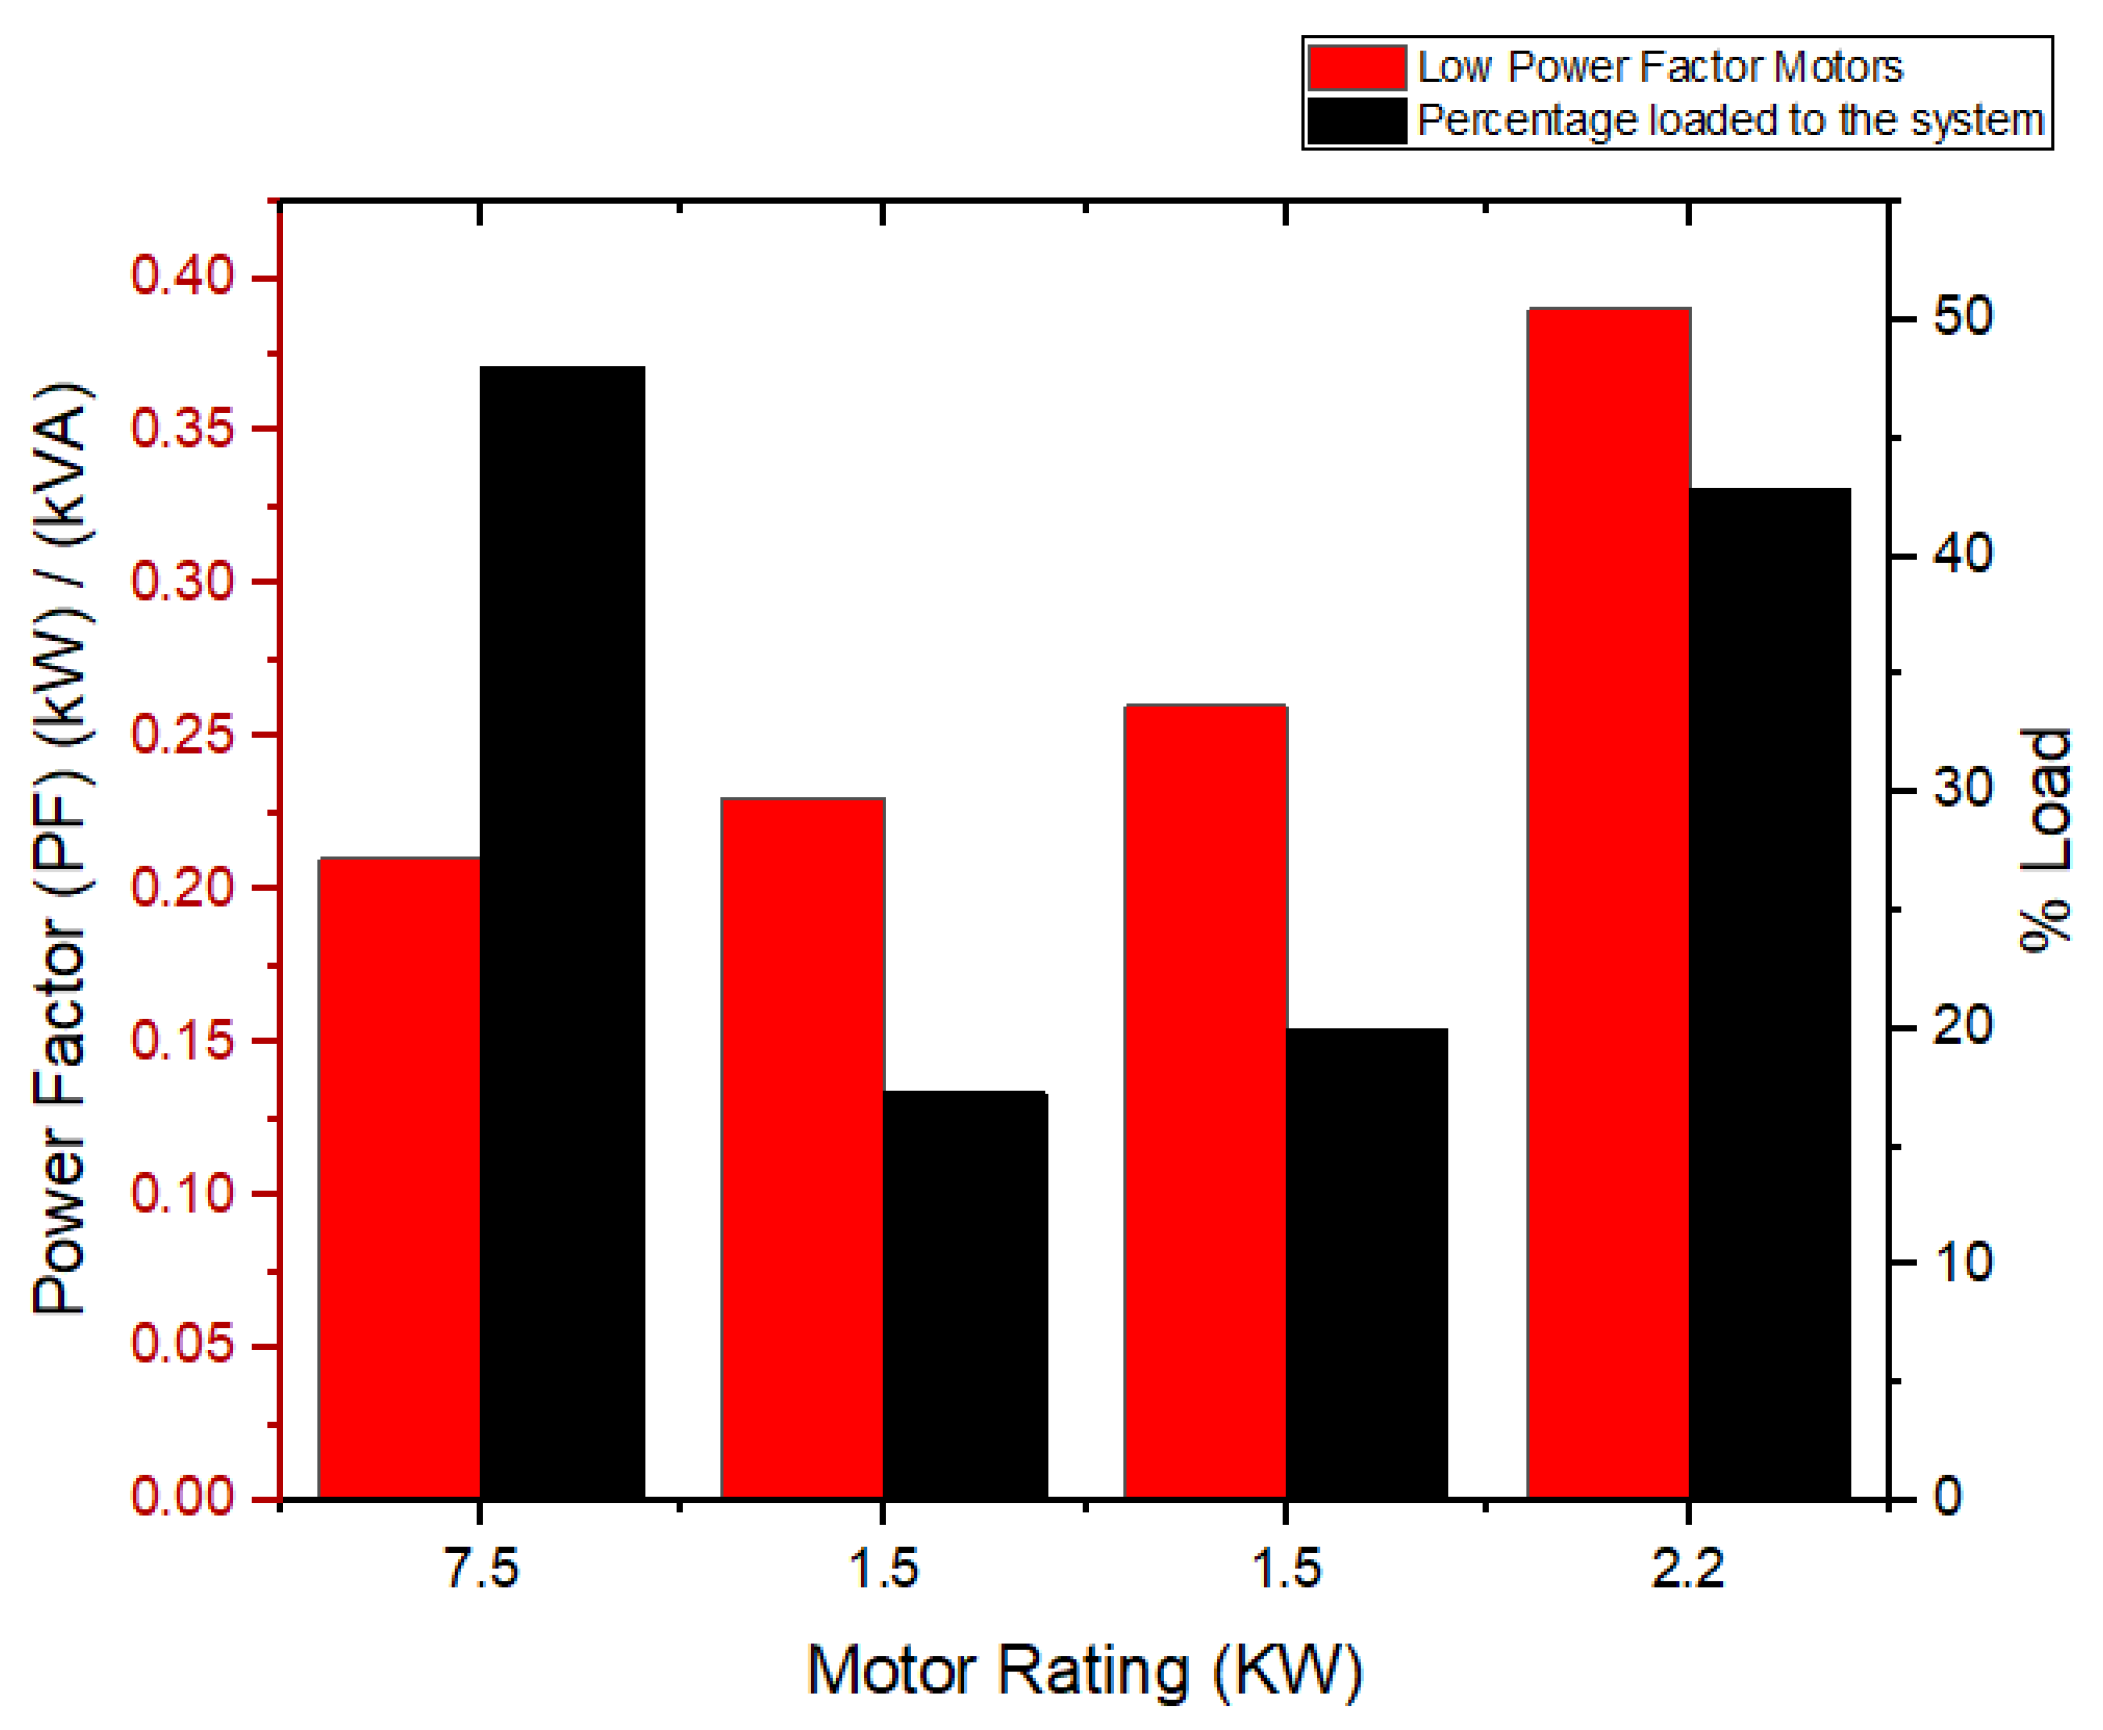
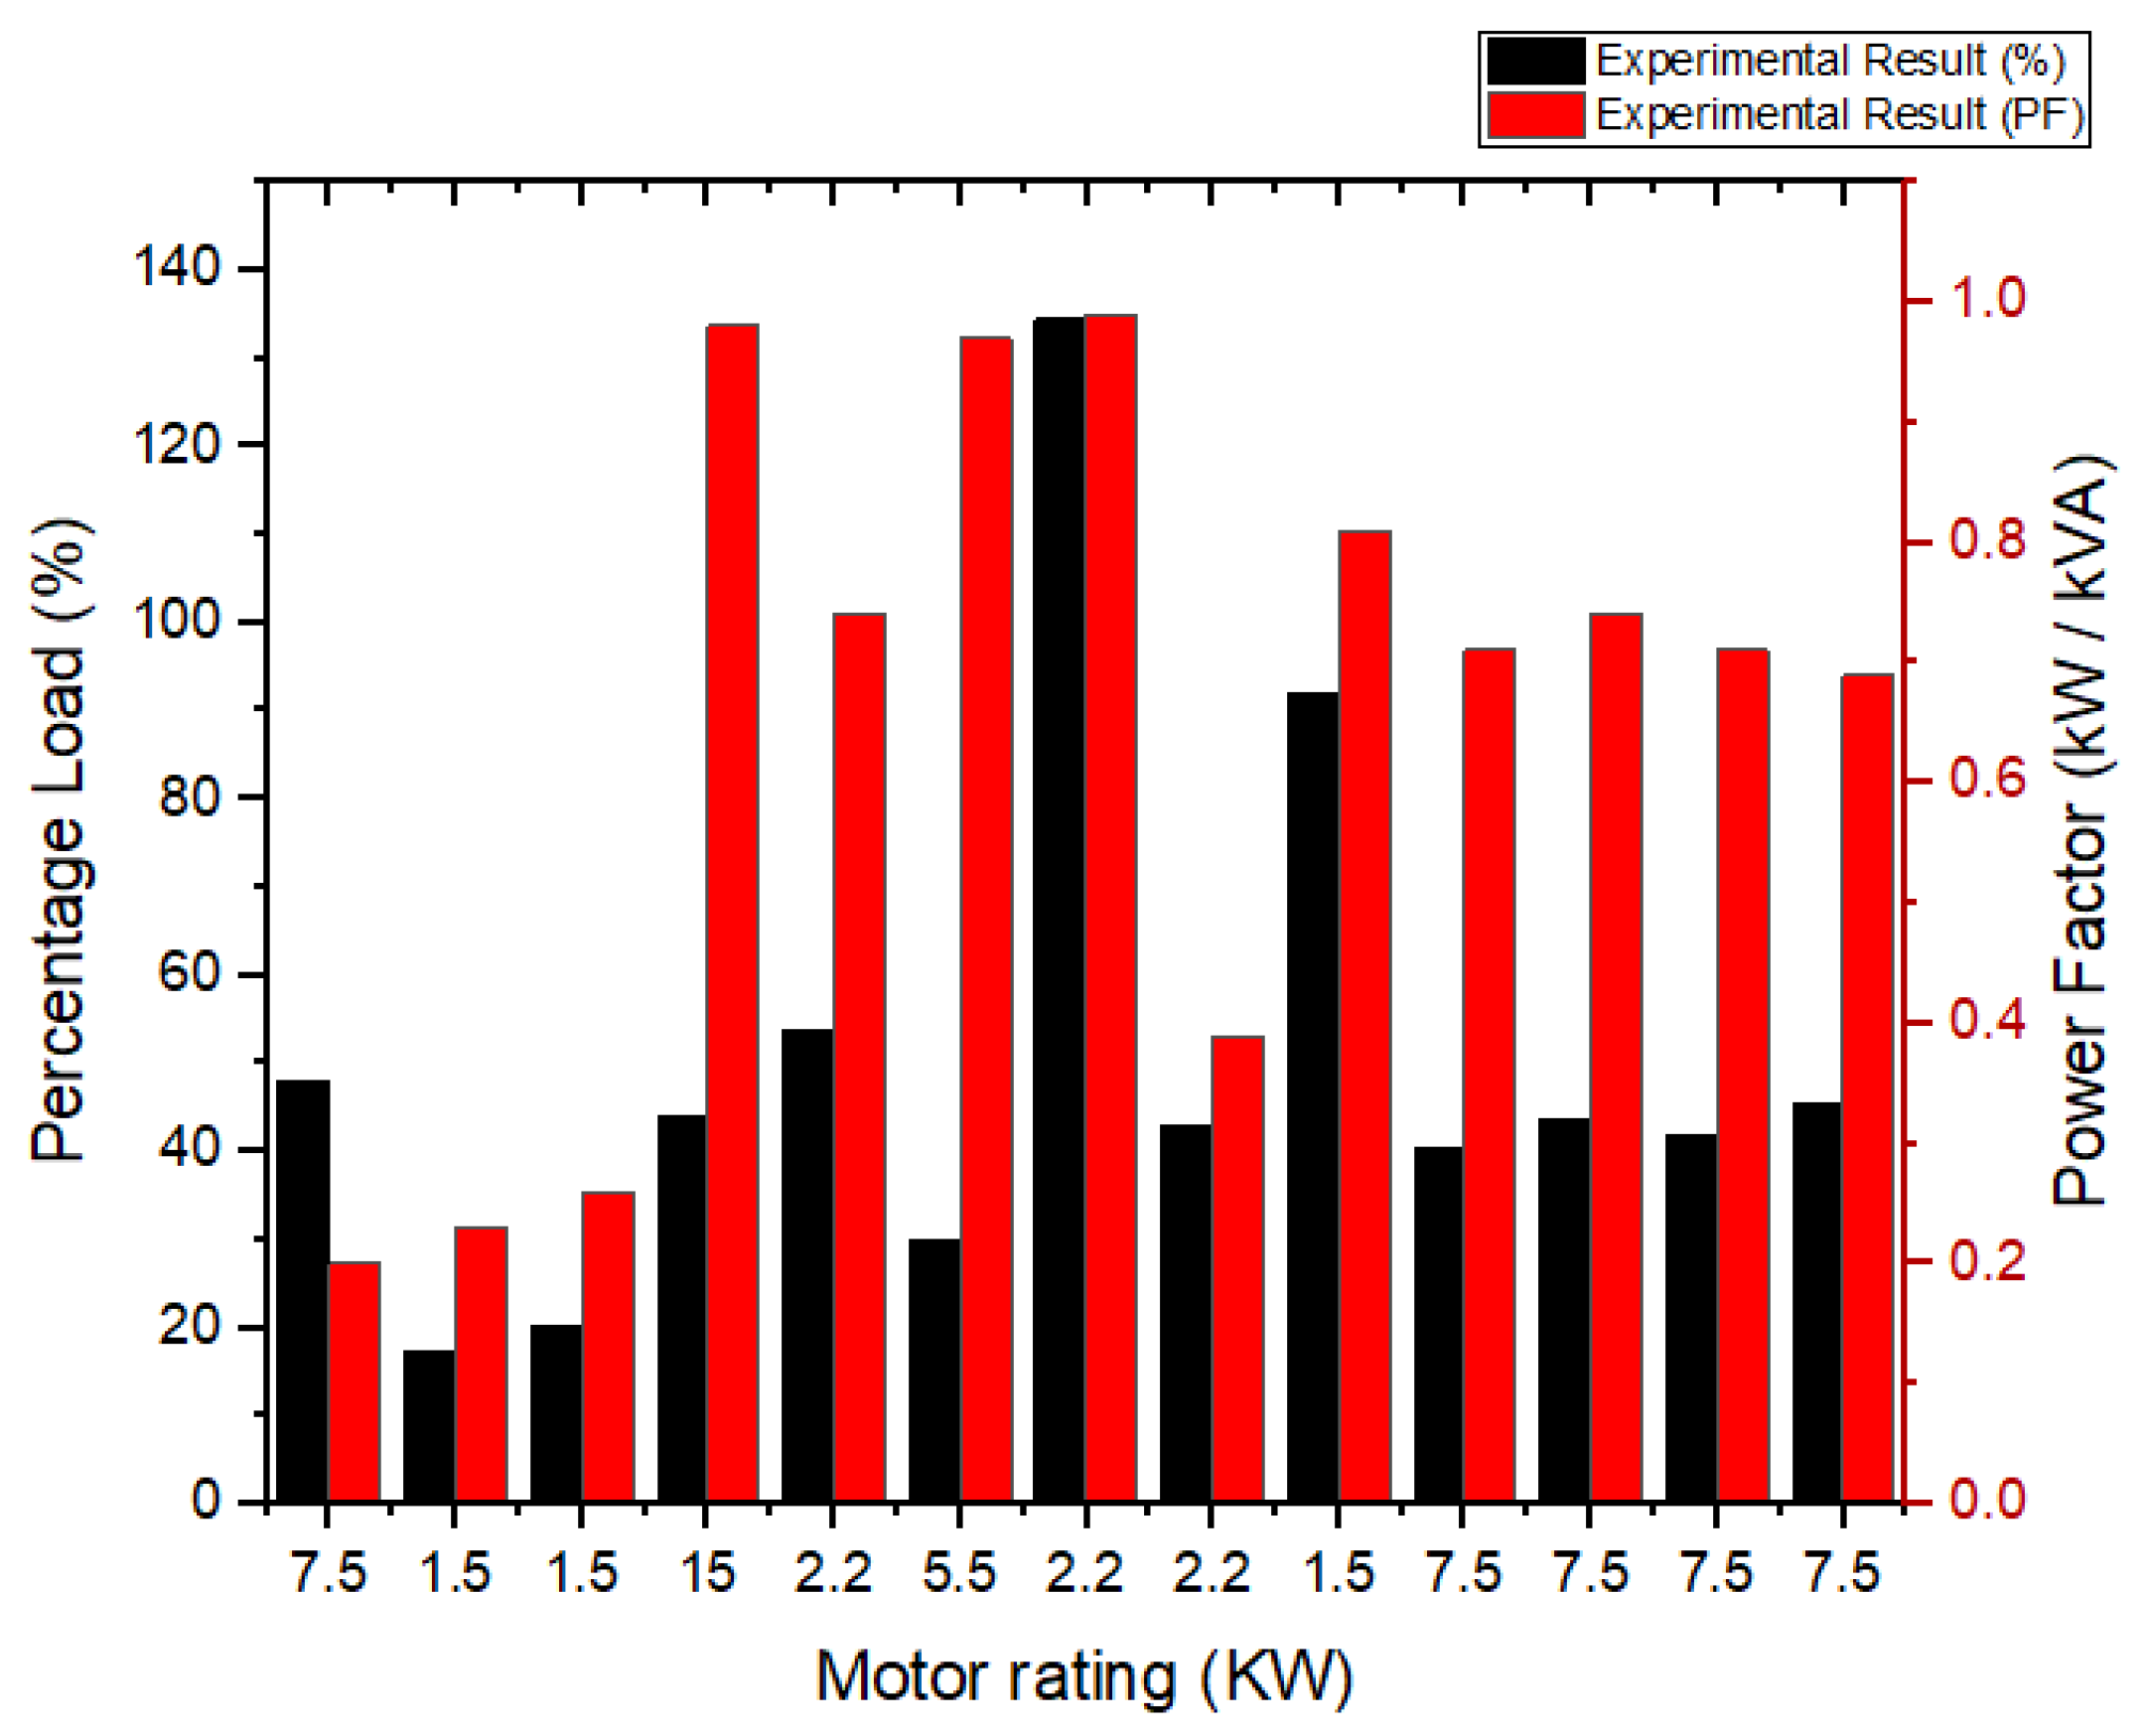
3.2. Power Quality Analysis of Tunnel Kiln Motors

In Figure 8, detailed power quality analysis of all the motors was carried out at field. Motors of entry fan, combustion air fan 1, 2, and 3 have a low power factor and 8%, 17.27%, 20%, and 42.86% loaded. These motors were found oversized and underloaded which were replaced with more energy efficient, properly sized motors. To save energy, a power factor improvement was suggested, and there was a potential to save 8% energy by investing in a payback period of 0.8 y.
Efficiency of induction motors varies with the variation of load. Some motors utilize power efficiently at rated conditions. However, other induction motors waste a huge portion of energy when they run normally. Efficiency of the motor can be described by power factor (PF) at specific load scaling from 0 to 1. The motor operating at a low power factor consumes high reactive power, which does not give useful work. A low power factor increases the network loss, transformer losses and voltage drop in the system. Power supply companies impose penalties to industrial consumers on low power factor running loads. Industrial consumers encourage electricity supplier to improve their power factor for different reasons. The power factor is the ratio of real power P(kW) and S (kVA) total drawn power of the motor. The closer the ratio of P/S to one, the higher will be the efficiency.
Power factor is corrected by adding opposite reactive power by adding capacitors in parallel to load. The circuit impedance with a power factor compensation capacitor is required to improve the power factor of motor system. Capacitance C(F) is the value of capacitor needed to add to raise the power factor to 0.95, which gives the significant savings.
In Table 4, reactive power of capacitor is calculated, Capacitor of 49.47, 20.53, 37.32, and 40.73 uF value is required for 7.5, 1.5, 1.5, and 2.2 kW to improve the power factor of required motors. The current power factor of these low power factors is 0.20, 0.23, 0.26, and 0.39 which needs to improve by using these capacitor banks.
In Figure 9, the detailed quality analysis has been done to evaluate the real, apparent, and reactive power of the tunnel kiln motors. The rated power and the percentage-loaded condition is analysed to find the power factor of the tunnel kiln motors which are under normal conditions. Thirteen motors of different ratings are analysed to find the results of percentage loading. Motor ratings of 7.5 kW are around 40-48% loaded at the tunnel kiln. The detailed power quality analysis is performed to check the quality index of the tunnel kiln motors. Motor ratings of 2.2 kW are 22-58% loaded at the tunnel kiln. The electrical load of the motors covers around 30% load of the total energy consumption of the tunnel kiln.
Major barriers which affects the implementation of motor efficiency measures are operational issues and allocation of resources in the industry. Power factor improvement systems increases the system efficiency as well as the electrical energy savings. Capacitors of 49.47, 20.53, 37.32, and 40.73 uF value are required for 7.5, 1.5, 1.5, and 2.2 kW to improve the power factor upto 0.95 of tunnel kiln motors. The cost of power factor improvement for these low-power factor motors is 110,000 pkr including all taxes, and the typical annual savings achieved after installation is about 162,153 pkr per annum. These motors are running continuously 24 h/d and 350 d/y. The kiln remains closed for annual maintenance and cleaning for 2 w/y. Simple payback can be achieved by dividing the investment cost of the power factor improvement system and savings per annum. This solution is viable to achieve the power factor improvement up to 0.95 with a suitable payback period of 0.8 y.

3.3. Techno-Economic Analysis of Tunnel Kiln System

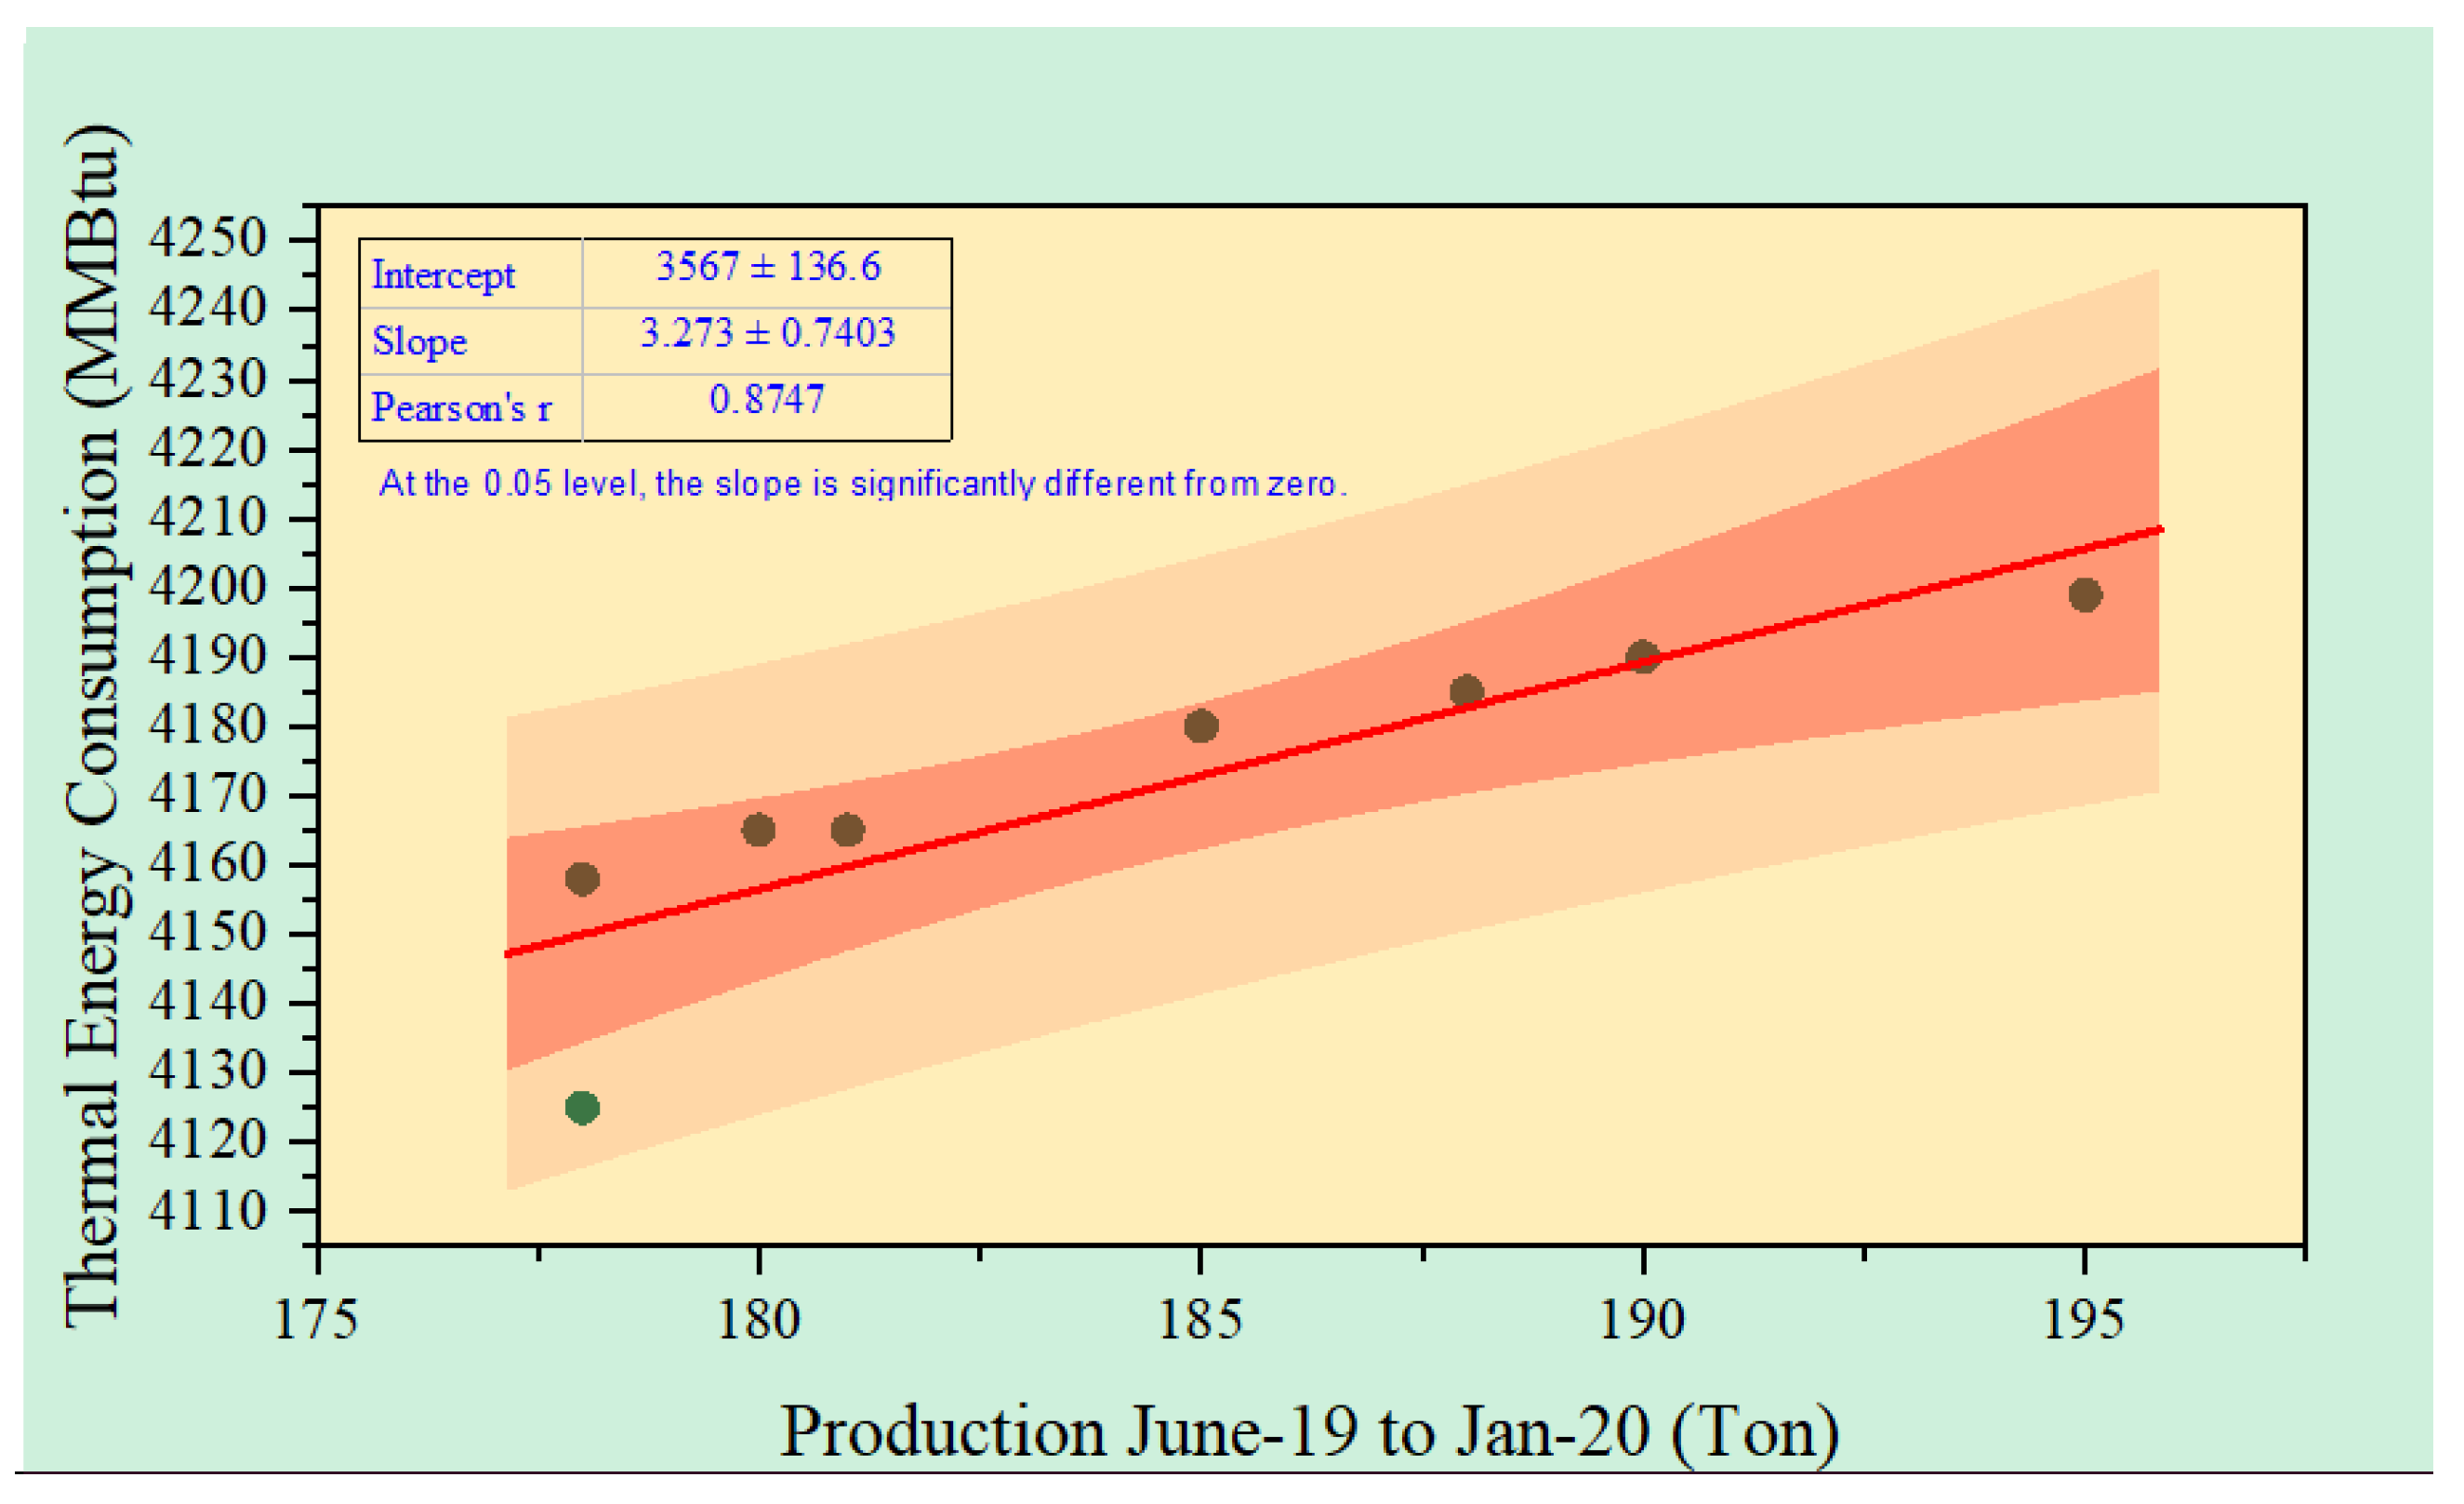
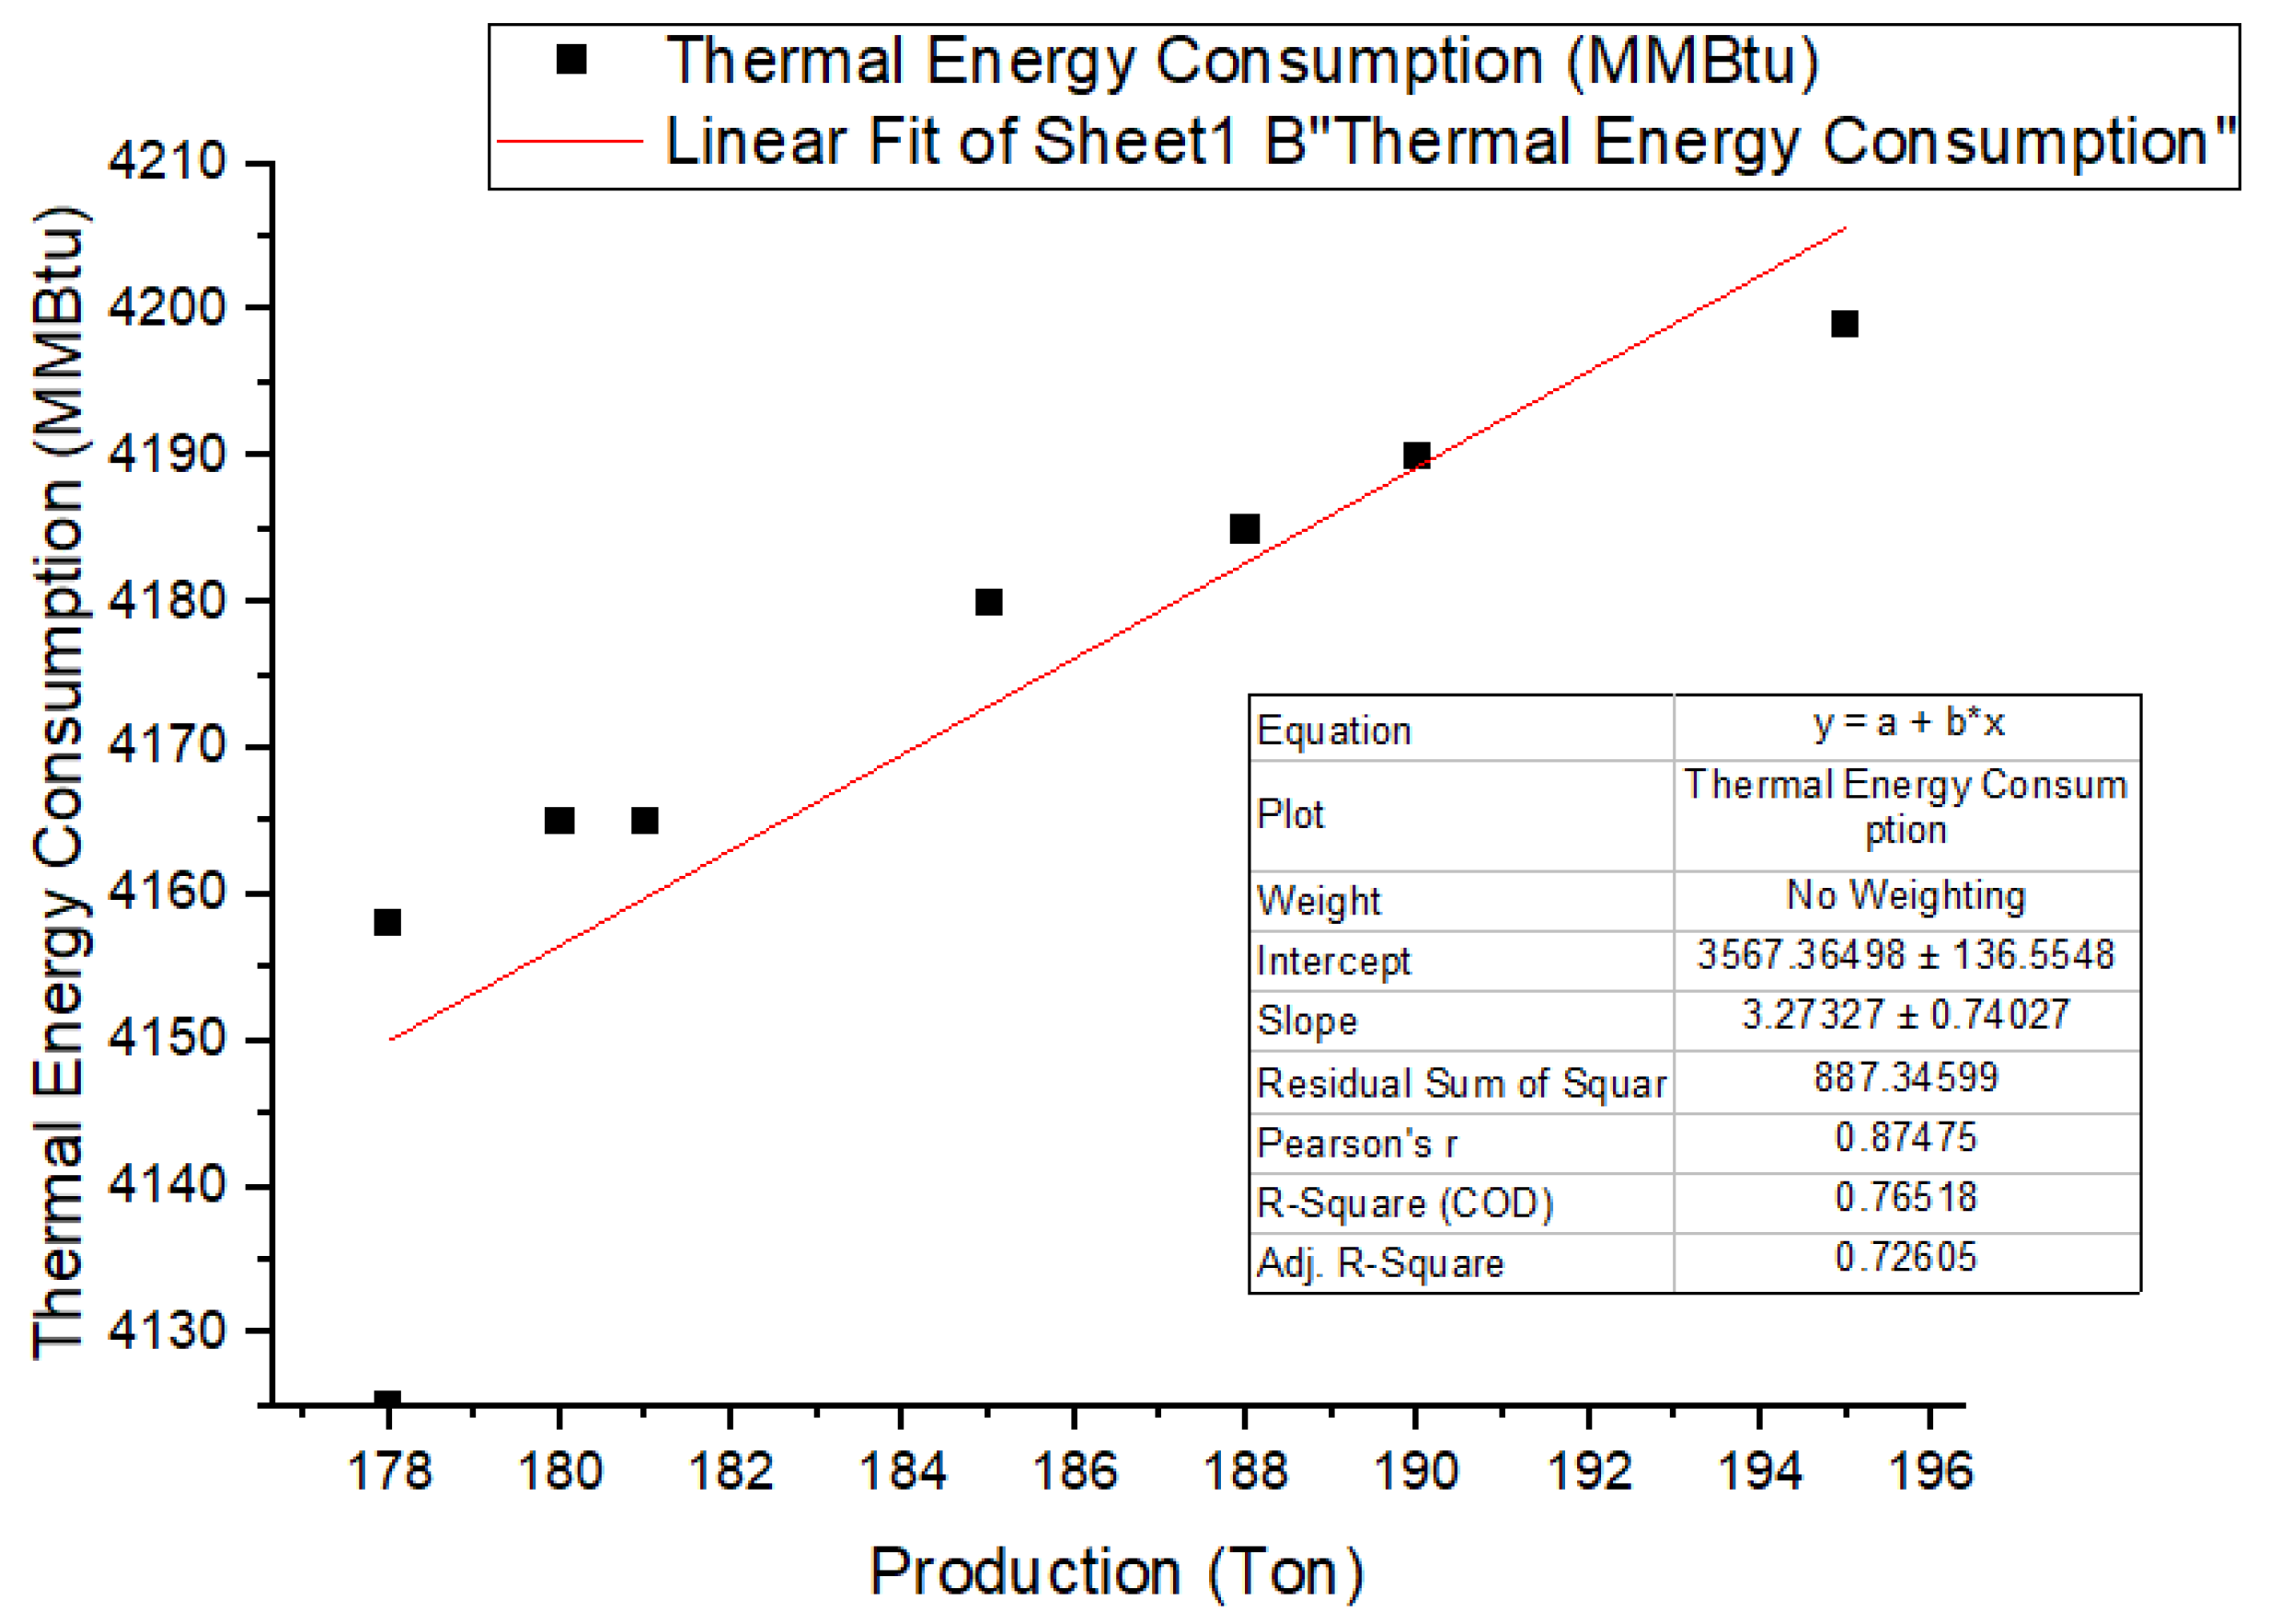
3.3.1. Regression Analysis of Thermal Consumption of Tunnel Kiln

In Figure 10, techno-economic analysis of thermal energy consumption and its production data of tunnel kiln ceramics was analysed. It is observed that the regression during the set period of June 2019 to January 2020 was examined critically. The regression line during this period is linear and the values of the dependent variable (thermal energy consumption) are denoted with Y-axis, and value of production independent variable is denoted with X-axis. The regression expression is mentioned below is y = 3.2799x + 3567.4. The correlation between X-variable and Y-variable is R = 3.2733, Interception between X-variable and Y-variable is 3567.4 [47]. Regression analysis for thermal energy consumption of the tunnel kiln is useful to finding the forecast consumption. This analysis can be used to find predict analytics, operational efficiency, and supporting decisions regarding two dependent and independent variables.
In Figure 10, the relationship of production (Tons) and thermal energy consumption (MMBtu) of studied tunnel kiln is linear. Thermal energy consumption from July 2019 to January 2020 is expressed in linear relation. Thermal energy consumption in July 19 was 4190 MMBtu, whereas in August 19, the thermal energy consumption was 4158 MMBtu. While in January 20 the thermal energy consumption is only slighter higher, i.e., 4199 MMBtu. The production values from July 2019 to January 2020 are in the range of 178 t to 195 t. The techno-economic analysis predicts the future thermal energy consumption, which gives the statistic view for the tunnel kiln.

3.3.2. Regression of Production Data

In Figure 11, detailed regression analysis of production data for the months of June 2019 to January 2020 is done. The figure shows the linear trend across the thermal consumption and production of tunnel kiln. The slope value of the analysis is 3.273 ± 0.7403, intercept value is 3567 ± 136.6, and the regression value is 0.8747.

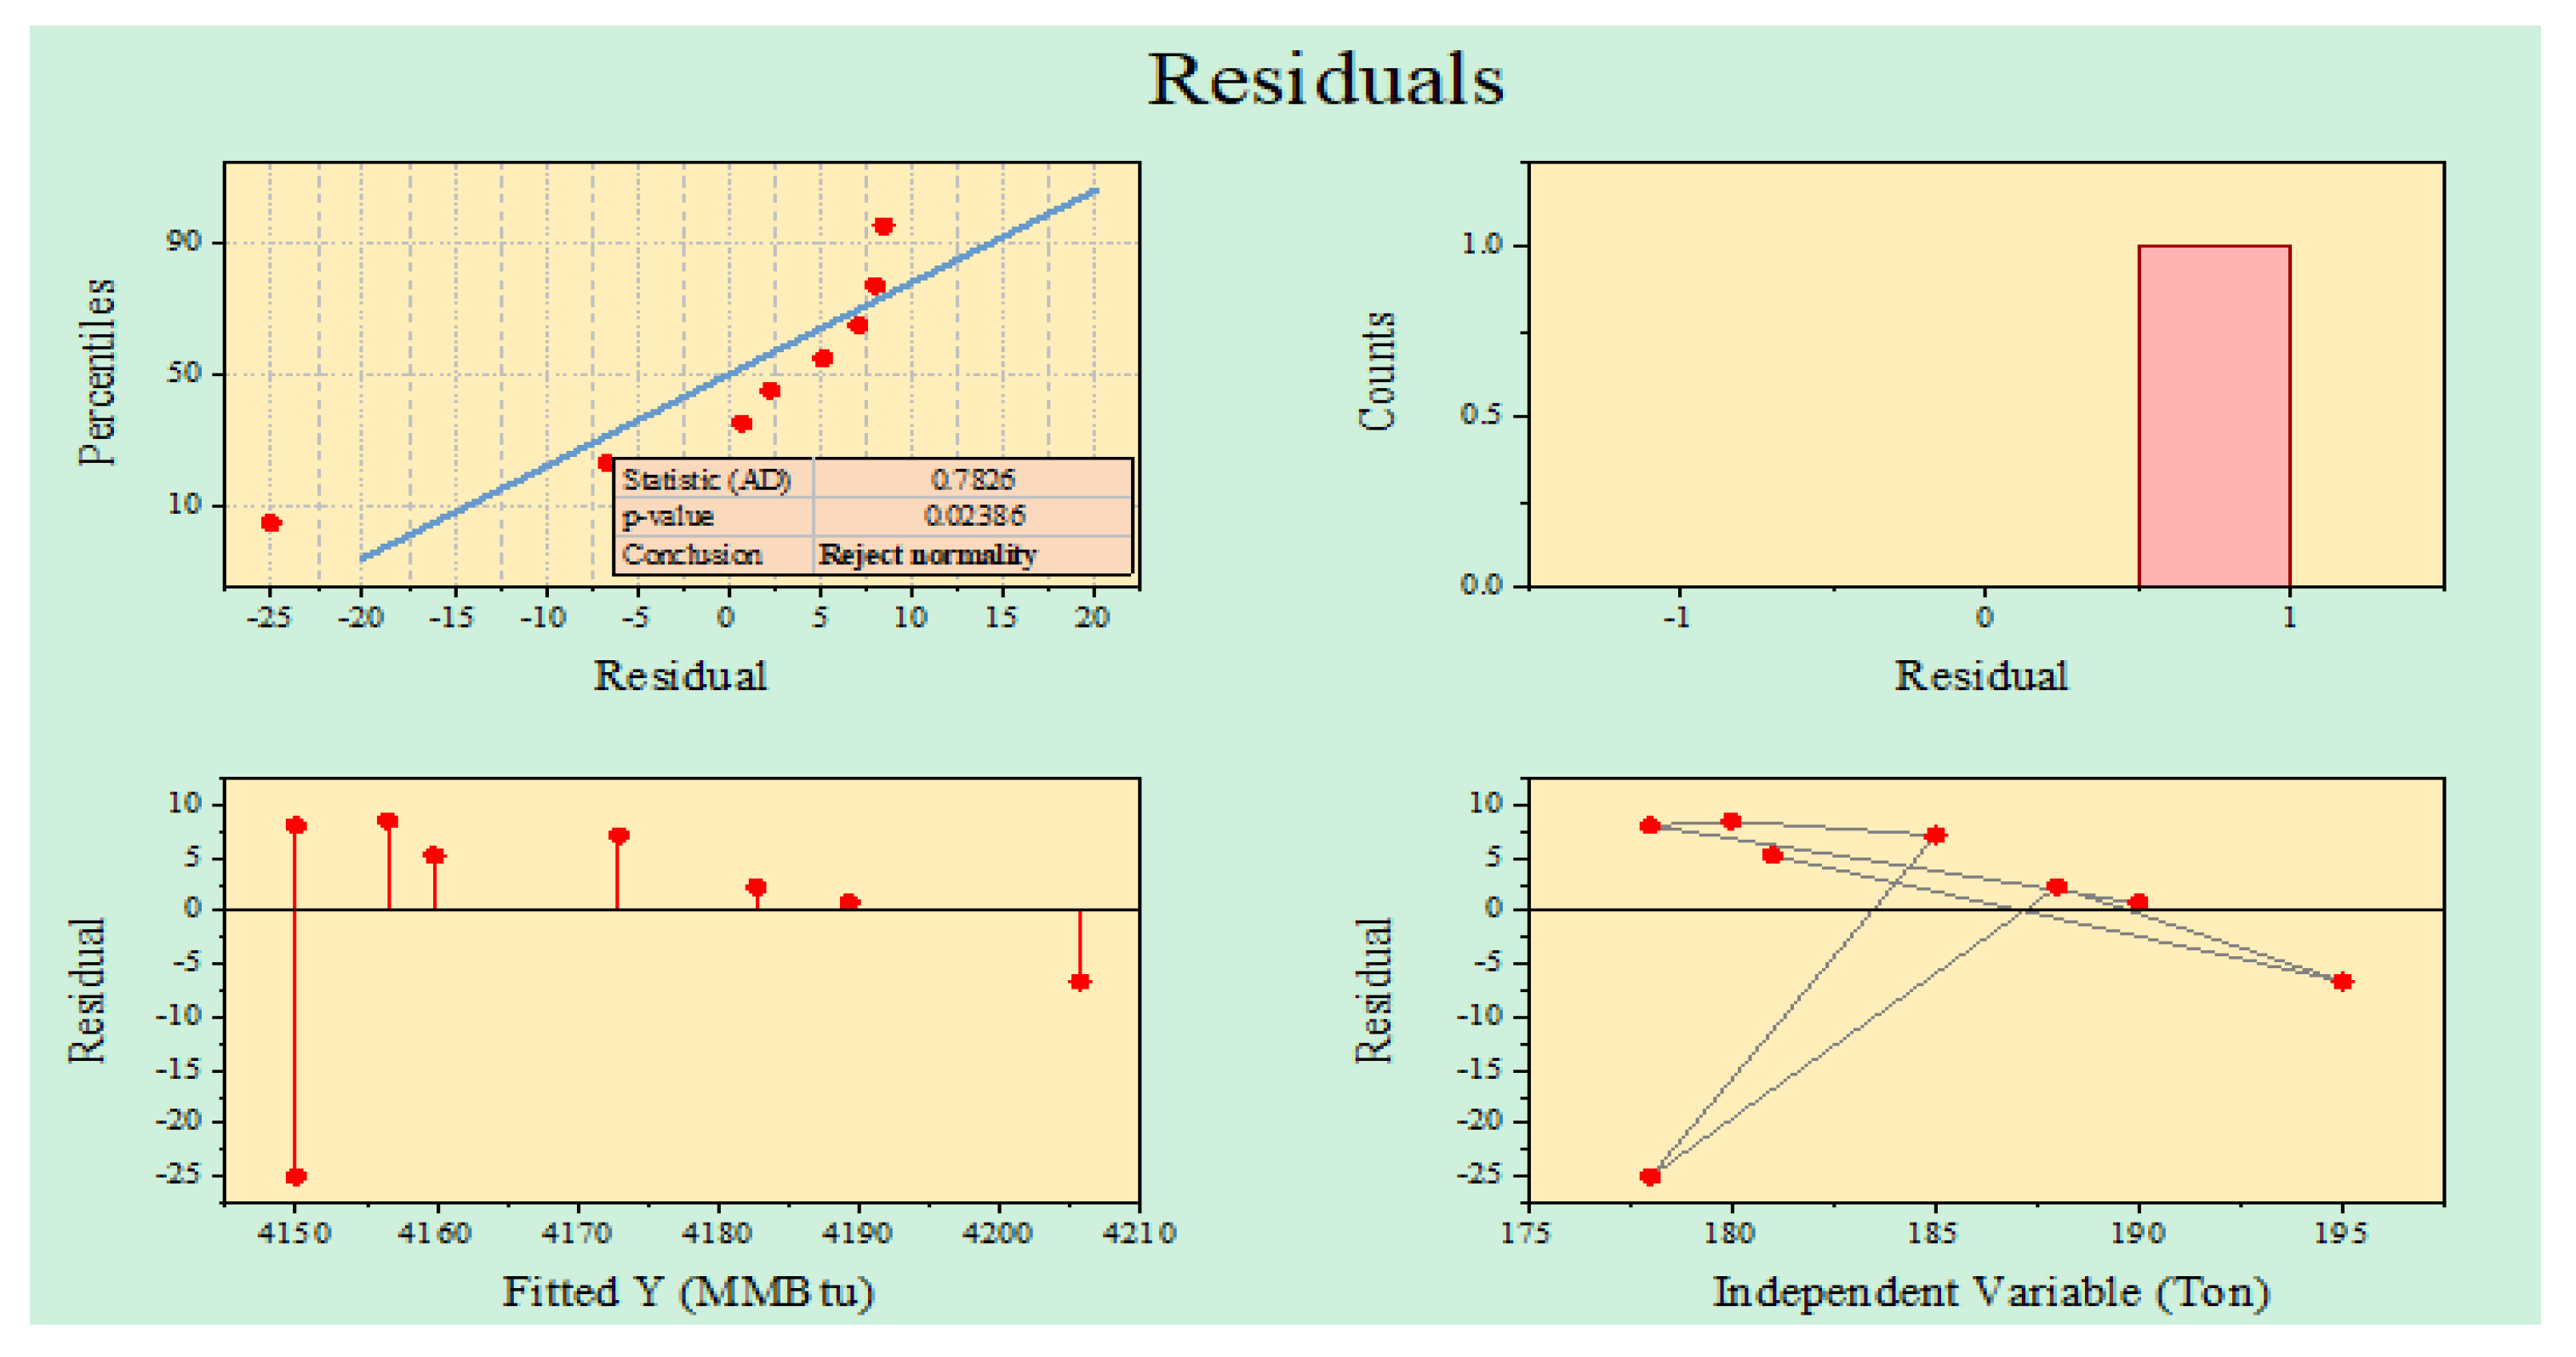
3.3.3. Residual Analysis of Regression

In Figure 12, residual analysis of regression is carried out, and value of percentile 0 to 90 and residual −25 to +25 is selected for better outcome of results. The independent value of production and dependent value of thermal energy consumption is selected for residual analysis.
Figure 13 shows the comparison of forecast thermal energy consumption and post heat recovery energy consumption. This comparison gives the clear idea of significant savings in thermal energy consumption after installing the heat recovery system on tunnel kiln.
In Table 5, the detailed analysis of thermal energy consumption of the tunnel kiln has been carried out, the results of pre-, post- and forecast are mentioned. Techno-economic analysis of thermal energy consumption gives a better idea to predict future energy consumption demand. There is almost 8% savings, which has been achieved after installing the heat recovery system. Thermal energy consumption from July 2019 to January 2020 is expressed in linear relation. Thermal energy consumption in July 2019 was 4190 MMBtu, whereas in August 2019, the thermal energy consumption was 4158 MMBtu. In January 2020, the thermal energy consumption is only slighter higher i.e., 4199 MMBtu. The production values from July 2019 to January 2020 are in the range of 178 t to 195 ton. The techno-economic analysis predicts future thermal energy consumption, which gives a statistic view for the tunnel kiln. The forecast future consumption from February 2020 to September 2020 is in the range of 4150 to 4189 MMBtu.
In Table 6, the detailed summary output of first regression is analyzed. The multiple regression is a significant relation of two set independent and dependent variable which is 0.121283. Variation analysis of 16 Nos observations has been analysed, and significant value of regression is achieved i.e, 0.6545557.
In Table 7, the residual output and probability output of thermal energy consumption have been analyzed. This analysis helps to predict the future energy consumption in the tunnel kiln. The values of predicted percentile and residuals are mentioned below.

4. Conclusions

Installing the heat recovery system on the cooling zone to preheat the ware of pre-heating zone of the tunnel kiln gives 8% natural gas consumption. O2 analysis after installing the heat recovery system is in range which clearly depicts that the combustion efficiency is improved after installing the heat recovery system. Mechanical strength, shrinkage (diameter, length wise), and thermal expansion of proper selected ceramics body material are in range of standard values. Density of selected material i.e., (2.1~2.3 g/cm3) gives better results to improve the thermal energy consumption along the tunnel kiln. Detailed power quality analysis of low power factor motors of the tunnel kiln was carried out and a power factor improvement solution was suggested to save electrical energy with a payback period of 0.8 y. Regression analysis for thermal energy consumption of the tunnel kiln is done to find the forecast thermal energy consumption of the tunnel kiln. This analysis gives the predicted analytics, regarding dependent variable thermal energy consumption and independent production variables. The model will be validated with a numerical simulation. It is necessary to re-investigate the experimental setup of the kiln and continue this study for a variable air velocity and inlet gas at different zones. The results obtained with simulation should be compared with experimental results.

Author Contributions

Conceptualisation, methodology, visualisation, writing—original draft S.A.H. and M.F. supervision, M.A. and N.H.; validation, F.R. and M.A.; data curation, Z.U.R.T.; formal analysis, M.S.; investigation, I.H.; writing—original draft, M.A.S., M.A.Q. and N.H.; writing—review and editing, A.B. and N.H.; visualisation, F.R. and A.B.; project administration, A.B.; funding acquisition, A.B. All authors have read and agreed to the published version of the manuscript.

Funding

This research received no external funding.

Institutional Review Board Statement

Not applicable.

Informed Consent Statement

Not applicable.

Acknowledgments

The authors would like to acknowledge the project “Sustainable Process Integration Laboratory–SPIL funded by EU CZ Operational Programme Research and Development, Education, Priority1: Strengthening capacity for quality research” (Grant No. CZ.02.1.01/0.0/0.0/15_003/0000456). The project LTACH19033 “Transmission Enhancement and Energy Optimised Integration of Heat Exchangers in Petrochemical Industry Waste Heat Utilisation”, under the bilateral collaboration of the Czech Republic and the People’s Republic of China (parteners Xi’an Jiaotong University and Sinopec Research Institute Shanghai; SPIL VUT, Brno University of Technology and EVECO sro, Brno), programme INTER-EXCELLENCE, INTER-ACTION of the Czech Ministry of Education, Youth and Sports.

Conflicts of Interest

The authors declare no conflict of interest.

References

  1. Gabaldón-Estevan, D.; Mezquita, A.; Ferrer, S.; Monfort, E. Unwanted effects of European Union environmental policy to promote a post-carbon industry. The case of energy in the European ceramic tile sector. J. Clean. Prod. 2016, 117, 41–49. [Google Scholar] [CrossRef] [Green Version]
  2. Kaya, S.; Mançuhan, E.; Küçükada, K. Modelling and optimization of the firing zone of a tunnel kiln to predict the optimal feed locations and mass fluxes of the fuel and secondary air. Appl. Energy 2009, 86, 325–332. [Google Scholar] [CrossRef]
  3. Imran, M.; Muhammad, H.A.; Sher, F.; Farooq, M.; Baik, Y.-J.; Rehman, Z. Exergoeconomic optimization of a binary geothermal power plant. In Thermodynamic Analysis and Optimization of Geothermal Power Plants; Elsevier: Amsterdam, The Netherlands, 2021; pp. 315–326. [Google Scholar] [CrossRef]
  4. Arslan, M.; Farooq, M.; Naqvi, M.; Sultan, U.; Tahir, Z.-U.-R.; Nawaz, S.; Waheed, N.; Naqvi, S.R.; Ali, Q.; Tariq, M.S.; et al. Impact of varying load conditions and cooling energy comparison of a double-inlet pulse tube refrigerator. Processes 2020, 8, 352. [Google Scholar] [CrossRef] [Green Version]
  5. Imran, S.; Korakianitis, T.; Shaukat, R.; Farooq, M.; Condoor, S.; Jayaram, S. Experimentally tested performance and emissions advantages of using natural-gas and hydrogen fuel mixture with diesel and rapeseed methyl ester as pilot fuels. Appl. Energy 2018, 229, 1260–1268. [Google Scholar] [CrossRef]
  6. Ashraf, H.; Sultan, M.; Shamshiri, R.; Abbas, F.; Farooq, M.; Sajjad, U.; Md-Tahir, H.; Mahmood, M.; Ahmad, F.; Taseer, Y.; et al. CDynamic Evaluation of Desiccant Dehumidification Evaporative Cooling Options for Greenhouse Air-Conditioning Application in Multan (Pakistan). Energies 2021, 14, 1097. [Google Scholar] [CrossRef]
  7. Hassan, Z.U.; Usman, M.; Asim, M.; Kazim, A.H.; Farooq, M.; Umair, M.; Imtiaz, M.U.; Asim, S.S. Use of diesel and emulsified diesel in CI engine: A comparative analysis of engine characteristics. Sci. Prog. 2021, 104, 00368504211020930. [Google Scholar] [CrossRef]
  8. Farooq, M.; Almustapha, M.; Imran, M.; Saeed, M.; Andresen, J.M. In-situ regeneration of activated carbon with electric potential swing desorption (EPSD) for the H2S removal from biogas. Bioresour. Technol. 2018, 249, 125–131. [Google Scholar] [CrossRef] [Green Version]
  9. Peng, J.; Zhao, Y.; Jiao, L.; Zheng, W.; Zeng, L. CO2 emission calculation and reduction options in ceramic tile manufacture-the Foshan case. Energy Procedia 2012, 16, 467–476. [Google Scholar] [CrossRef] [Green Version]
  10. Mezquita, A.; Boix, J.; Monfort, E.; Mallol, G. Energy saving in ceramic tile kilns: Cooling gas heat recovery. Appl. Therm. Eng. 2014, 65, 102–110. [Google Scholar] [CrossRef]
  11. Wu, X.; Yang, Y.; Wu, G.; Mao, J.; Zhou, T. Simulation and optimization of a coking wastewater biological treatment process by activated sludge models (ASM). J. Environ. Manag. 2016, 165, 235–242. [Google Scholar] [CrossRef]
  12. Milani, M.; Montorsi, L.; Stefani, M. An integrated approach to energy recovery from biomass and waste: Anaerobic digestion–gasification–water treatment. Waste Manag. Res. 2014, 32, 614–625. [Google Scholar] [CrossRef] [PubMed]
  13. Almeida, G.D.S.; da Silva, J.B.; e Silva, C.J.; Swarnakar, R.; Neves, G.A.; de Lima, A.G.B. Heat and mass transport in an industrial tunnel dryer: Modeling and simulation applied to hollow bricks. Appl. Therm. Eng. 2013, 55, 78–86. [Google Scholar] [CrossRef]
  14. Oba, R.; Possamai, T.S.; Nunes, A.T.; Nicolau, V.P. Numerical simulation of tunnel kilns applied to white tile with natural gas. In Proceedings of the 21st Brazilian Congress of Mechanical Engineering, Natal, Brazil, 24–28 October 2011. [Google Scholar]
  15. Han, J.; Sun, Q.; Xing, H.; Zhang, Y.; Sun, H. Experimental study on thermophysical properties of clay after high temperature. Appl. Therm. Eng. 2017, 111, 847–854. [Google Scholar] [CrossRef]
  16. Sun, R.; Ismail, T.M.; Ren, X.; El-Salam, M.A. Numerical simulation of gas concentration and dioxin formation for MSW combustion in a fixed bed. J. Environ. Manag. 2015, 157, 111–117. [Google Scholar] [CrossRef]
  17. Refaey, H.; Abdel-Aziz, A.A.; Ali, R.; Abdelrahman, H.; Salem, M. Augmentation of convective heat transfer in the cooling zone of brick tunnel kiln using guide vanes: An experimental study. Int. J. Therm. Sci. 2017, 122, 172–185. [Google Scholar] [CrossRef]
  18. Mercati, S.; Milani, M.; Montorsi, L.; Paltrinieri, F. Design of the steam generator in an energy conversion system based on the aluminum combustion with water. Appl. Energy 2012, 97, 686–694. [Google Scholar] [CrossRef]
  19. Redemann, T.; Specht, E. Mathematical model to investigate the influence of circulation systems on the firing of ceramics. Energy Procedia 2017, 120, 620–627. [Google Scholar] [CrossRef]
  20. Araújo, M.V.; Santos, R.; Da Silva, R.M.; De Lima, A.B. Drying of industrial hollow ceramic brick: Analysis of the moisture content and temperature parameters. Defect Diffus. Forum 2017, 380, 72–78. [Google Scholar] [CrossRef]
  21. Al-Hasnawi AG, T.; Refaey, H.; Redemann, T.; Attalla, D.M.; Specht, E. CFD simulation of flow mixing in tunnel kilns by air side injection. ASME J. Therm. Sci. Eng. Appl. 2017, 10, 031007. [Google Scholar] [CrossRef]
  22. Gomez, R.S.; Porto, T.R.N.; Magalhães, H.L.F.; Moreira, G.; André, A.M.M.C.N.; Melo, R.B.F.; Lima, A.G.B. Natural gas intermittent kiln for the ceramic industry: A transient thermal analysis. Energies 2019, 12, 1568. [Google Scholar] [CrossRef] [Green Version]
  23. Soussi, N.; Kriaa, W.; Mhiri, H.; Bournot, P. Reduction of the energy consumption of a tunnel kiln by optimization of the recovered air mass flow from the cooling zone to the firing zone. Appl. Therm. Eng. 2017, 124, 1382–1391. [Google Scholar] [CrossRef]
  24. Zhang, Y.; Wang, J.; Redemann, T.; Specht, E. Thermal behavior of kiln cars while traveling through a tunnel kiln. Adv. Mech. Eng. 2015, 7, 1687814015588468. [Google Scholar] [CrossRef] [Green Version]
  25. Mancuhan, E.; Kucukada, K.; Alpman, E. Mathematical modeling and simulation of the preheating zone of a tunnel kiln. J. Therm. Sci. Technol. 2011, 31, 79–86. [Google Scholar]
  26. Agamloh, E.B. The partial-load efficiency of induction motors. IEEE Trans. Ind. Appl. 2009, 45, 332–340. [Google Scholar] [CrossRef]
  27. Hurst, J.; Dominguez, H. Raising the standard for electric motor efficiency. Intech-Res. Triangle Park NC- 2007, 54, 30. [Google Scholar]
  28. Challenge, M. Determining electric motor load and efficiency. Program of the US Department of Energy. 1997.
  29. Parihar, V.R.; Thakare, S.; Ghanode, A. Improving Power Quality of Induction Motors using Capacitor Bank. Int. J. Innov. Res. Electr. Electron. Instrum. Control Eng. 2018, 6, 37–45. [Google Scholar] [CrossRef]
  30. Gnacinski, P.; Tarasiuk, T. Energy-efficient operation of induction motors and power quality standards. Electr. Power Syst. Res. 2016, 135, 10–17. [Google Scholar] [CrossRef]
  31. Dmytrochenkova, E.; Tadlya, K. Analysis of aerodynamic characteristics in the tunnel kiln channel when changing the geometric characteristics of the channel. Innov. Solut. Mod. Sci. 2019, 6, 37–47. [Google Scholar] [CrossRef]
  32. Ferrer, S.; Mezquita, A.; Aguilella, V.; Monfort, E. Beyond the energy balance: Exergy analysis of an industrial roller kiln firing porcelain tiles. Appl. Therm. Eng. 2019, 150, 1002–1015. [Google Scholar] [CrossRef]
  33. Chuenwong, K.; Chiarakorn, S.; Sajjakulnukit, B. Specific energy consumption and carbon intensity of ceramic tablewares: Small enterprises (SEs) in Thailand. J. Clean. Prod. 2017, 147, 395–405. [Google Scholar] [CrossRef]
  34. Damrongsak, D.; Wongsapai, W.; Thinate, N. Factor impacts and target setting of energy consumption in Thailand’s hospital building. Chem. Eng. Trans. 2018, 70, 1585–1590. [Google Scholar] [CrossRef]
  35. Salminen, E.; Mjöberg, J.; Anhava, J. Nordic Ceramics Industry: Best Available Technique (BAT); Nordic Council of Ministers: Copenhagen, Denmark, 2019. [Google Scholar]
  36. Abou-Ziyan, H.Z.; Almesri, I.F.; Alrahmani, M.A.; Almutairi, J.H. Convective heat transfer coefficients of multifaceted longitudinal and transversal bricks of lattice setting in tunnel kilns. J. Therm. Sci. Eng. Appl. 2018, 10, 051014. [Google Scholar] [CrossRef]
  37. Pal, M.; Bharati, P. Introduction to Correlation and Linear Regression Analysis. In Applications of Regression Techniques; Springer: Singapore, 2019; pp. 1–18. [Google Scholar] [CrossRef]
  38. Kaisan, M.; Anafi, F.; Nuszkowski, J.; Kulla, D.; Umaru, S. Exhaust emissions of biodiesel binary and multi-blends from Cotton, Jatropha and Neem oil from stationary multi cylinder CI engine. Transp. Res. Part D Transp. Environ. 2017, 53, 403–414. [Google Scholar] [CrossRef]
  39. Siddiqi, M.H.; Liu, X.-M.; Hussain, M.A.; Qureshi, T.; Waqas, M.; Farooq, M.; Iqbal, T.; Nawaz, S.; Nawaz, S. Evolution of kinetic and hydrothermal study of refused derived fuels: Thermo-gravimetric analysis. Energy Rep. 2021, 7, 1757–1764. [Google Scholar] [CrossRef]
  40. Riaz, F.; Farooq, M.; Imran, M.; Lee, P.S.; Chou, S.K. CEnergy analysis of a new combined cooling and power system for low-temperature heat utilization. In Energy Sustainability; American Society of Mechanical Engineers: New York, NY, USA, 2020. [Google Scholar] [CrossRef]
  41. Ijaz, M.; Farhan, M.; Farooq, M.; Moeenuddin, G.; Nawaz, S.; Soudagar, M.E.M.; Saqib, H.M.; Ali, Q. Numerical investigation of particles characteristics on cyclone performance for sustainable environment. Part. Sci. Technol. 2021, 39, 495–503. [Google Scholar] [CrossRef]
  42. Sattar, A.; Farooq, M.; Amjad, M.; Saeed, M.A.; Nawaz, S.; Mujtaba, M.; Anwar, S.; El-Sherbeeny, A.M.; Soudagar, M.E.M.; Filho, E.P.B.; et al. Performance Evaluation of a Direct Absorption Collector for Solar Thermal Energy Conversion. Energies 2020, 13, 4956. [Google Scholar] [CrossRef]
  43. Mumtaz, H.; Farhan, M.; Amjad, M.; Riaz, F.; Kazim, A.H.; Sultan, M.; Farooq, M.; Mujtaba, M.; Hussain, I.; Imran, M.; et al. Biomass waste utilization for adsorbent preparation in CO2 capture and sustainable environment applications. Sustain. Energy Technol. Assess. 2021, 46, 101288. [Google Scholar] [CrossRef]
  44. Shahzad, K.; Sultan, M.; Bilal, M.; Ashraf, H.; Farooq, M.; Miyazaki, T.; Sajjad, U.; Ali, I.; Hussain, M. Experiments on Energy-Efficient Evaporative Cooling Systems for Poultry Farm Application in Multan (Pakistan). Sustainability 2021, 13, 2836. [Google Scholar] [CrossRef]
  45. Kashif, M.; Awan, M.; Nawaz, S.; Amjad, M.; Talib, B.; Farooq, M.; Nizami, A.; Rehan, M. Untapped renewable energy potential of crop residues in Pakistan: Challenges and future directions. J. Environ. Manag. 2020, 256, 109924. [Google Scholar] [CrossRef]
  46. Imran, M.; Pambudi, N.A.; Farooq, M. Thermal and hydraulic optimization of plate heat exchanger using multi objective genetic algorithm. Case Stud. Therm. Eng. 2017, 10, 570–578. [Google Scholar] [CrossRef]
  47. Chatterjee, S.; Hadi, A.S. Regression Analysis by Example; John Wiley & Sons: Hoboken, NJ, USA, 2015. [Google Scholar]
Figure 1. Tunnel kiln schematic diagram with heat recovery system.
Processes 09 01629 g001
Figure 2. Thermal conductivity and energy loss in tunnel kiln.
Processes 09 01629 g002
Figure 3. Convective heat transfer coefficient vs. firing cycle time.
Processes 09 01629 g003
Figure 4. Experimental analysis of kiln pressure.
Processes 09 01629 g004
Figure 5. Energy loss against density of ceramics material of the tunnel kiln.
Processes 09 01629 g005
Figure 6. Temperature profile along thermal energy consumption (mmBTU/h).
Processes 09 01629 g006
Figure 7. Thermal energy consumption before and after heat recovery system.
Processes 09 01629 g007
Figure 8. Motor (kW) vs. percentage load of motors.
Processes 09 01629 g008
Figure 9. Tunnel kiln motors power and percentage loading.
Processes 09 01629 g009
Figure 10. Regression analysis of thermal consumption of tunnel kiln.
Processes 09 01629 g010
Figure 11. Regression of production data.
Processes 09 01629 g011
Figure 12. Residual analysis of regression.
Processes 09 01629 g012
Figure 13. Forecast analysis of thermal consumption.
Processes 09 01629 g013
Table 1. Properties of ceramics body material.
Batch NoMechanical StrengthThermal
Expansion
Density
Fired
Material
Shrinkage
GreenUnglazedGlazedDia Length
Unitskg/cm2kg/cm2kg/cm2mmg/cm3%%
15892714280.392.2510.08.3
25885313940.372.289.88.0
35984713660.382.269.27.8
45984714030.372.310.08.0
55886414200.382.369.47.9
66083313700.382.299.97.8
Table 2. Properties of natural gas and air in the tunnel kiln.
Gas FuelAir
FormulaVolume (%)Mass (%)Lower
Heating
Value MJ/kg
ɣfFormulaVolume (%)Mass (%)
CH491.9484.4450.051.0308N277.4875.75
C2H63.536.0847.521.0488O220.5923.01
C3H80.902.2746.341.0548H2O (g)1.901.19
C4H100.381.2645.371.0578CO20.030.05
C6H120.110.4544.911.0596
N22.664.26
CO20.481.21
Table 3. Percentage O2 in the tunnel kiln pre- and post-heat recovery system.
ZonePositionPre Heat
Recovery System %
Post Heat
Recovery
System %
International Standard
ISO-90001 (Quality), and
Standard Operating Manual of Tunnel Kiln
Pre-heatingTop118.6≥8%
Bottom9.98.4≥8%
OxidationTop10.58.9≥8%
Bottom11.28.2≥8%
FiringTop4.23.13%
Bottom3.92.93%
Table 4. Power factor improvement for low-power factor motors of the tunnel kiln.
Sr #Motor
Rating
Real
Power
Apparent
Power
Reactive
Power
Current
Power
Factor
Desired
Power
Factor
S
(Revised)
Q
(Revised)
Qc Required
C(f)
kWP
(kW)
S2
(kVA)
Q2
(kVAR)
cosθ2cosθ1S1
(kVA)
Q1
(kVAR)
Qc (kVAR)uF
17.50.062.472.470.020.950.060.202.4549.47
21.50.251.071.100.230.950.270.091.0120.53
31.50.301.101.140.260.950.320.101.0437.32
42.20.942.182.370.390.950.990.312.0640.73
Table 5. Comparison of thermal energy consumption pre-post-heat recovery system and forecast analysis.
Pre Heat
Recovery System
Post Heat
Recovery System
Forecast
Techno-
Economic
(Regression)
MonthThermal Energy ConsumptionMonthThermal Energy
Consumption
Thermal Energy
Consumption
(MMBtu)(MMBtu)(MMBtu)
June 20194190February 202038334189
July 20194158March 202038514150
August 20194165April 202037994154
September 20194180May 202038104169
October 20194125June 202038554139
November 20194185July 202038054183
December 20194199August 202037924199
January 20204165September 202037894163
Table 6. Summary output first regression.
Statistics of Regression
Multiple
Regression
0.121283
Square
Regression
0.014709
Adjusted
Square
Regression
−0.05566
Observed
Standard
Error
189.4868
Observations16
ANOVA (Analysis of Variation)
dfSSMSFSignificance F
Regression17504.5807504.580.2090100.654557
Residual14502673.85735905.27
Total15510178.437
CoefficientsStandard
Error
t StatP-valueLower
95%
Upper 95%Lower 95.0%Upper 95.0%
Intercept4732.181615.7632.9287590.0109981266.715668197.6531266.718197.
Production (Tons)−3.914498.562328−0.4571760.654557−22.278866314.4498−22.27814.44
Table 7. Residual Output and Probility Output.
RESIDUAL OUTPUT PROBABILITY OUTPUT
ObservationPredicted Thermal
Energy
Consumption (mmBTU)
ResidualsStandard
Residuals
PercentileThermal
Energy
Consumption (mmBTU)
14000.173558189.82644211.0369532753.1253789
24043.233027114.76697290.6269305129.3753792
34031.489535133.51046450.72931943515.6253799
44000.173558179.82644210.98232688821.8753805
53976.686575148.31342520.81018266228.1253810
63972.772078212.22792241.1593244734.3753833
73957.114089241.88591121.32133534840.6253851
83988.430066176.56993360.96453775946.8753855
94004.088055−171.088055−0.93459223753.1254125
104011.91705−160.917049−0.87903170859.3754158
113992.344564−193.344563−1.05617150265.6254165
123976.686575−166.686574−0.9105485471.8754165
133996.259061−141.259060−0.77164721778.1254180
143984.515569−179.515569−0.98062870284.3754185
153996.259061−204.259060−1.11579345790.6254190
163968.85758−179.857580−0.98249698696.8754199
Publisher’s Note: MDPI stays neutral with regard to jurisdictional claims in published maps and institutional affiliations.

