
Solubility of Luteolin and Other Polyphenolic Compounds in Water, Nonpolar, Polar Aprotic and Protic Solvents by Applying FTIR/HPLC

 ,
,  ,
,  and
and 
Abstract
:1. Introduction
2. Materials and Methods
2.1. Chemicals
2.2. Sample Preparation
2.3. FTIR Spectroscopy
2.4. HPLC Analysis
3. Results
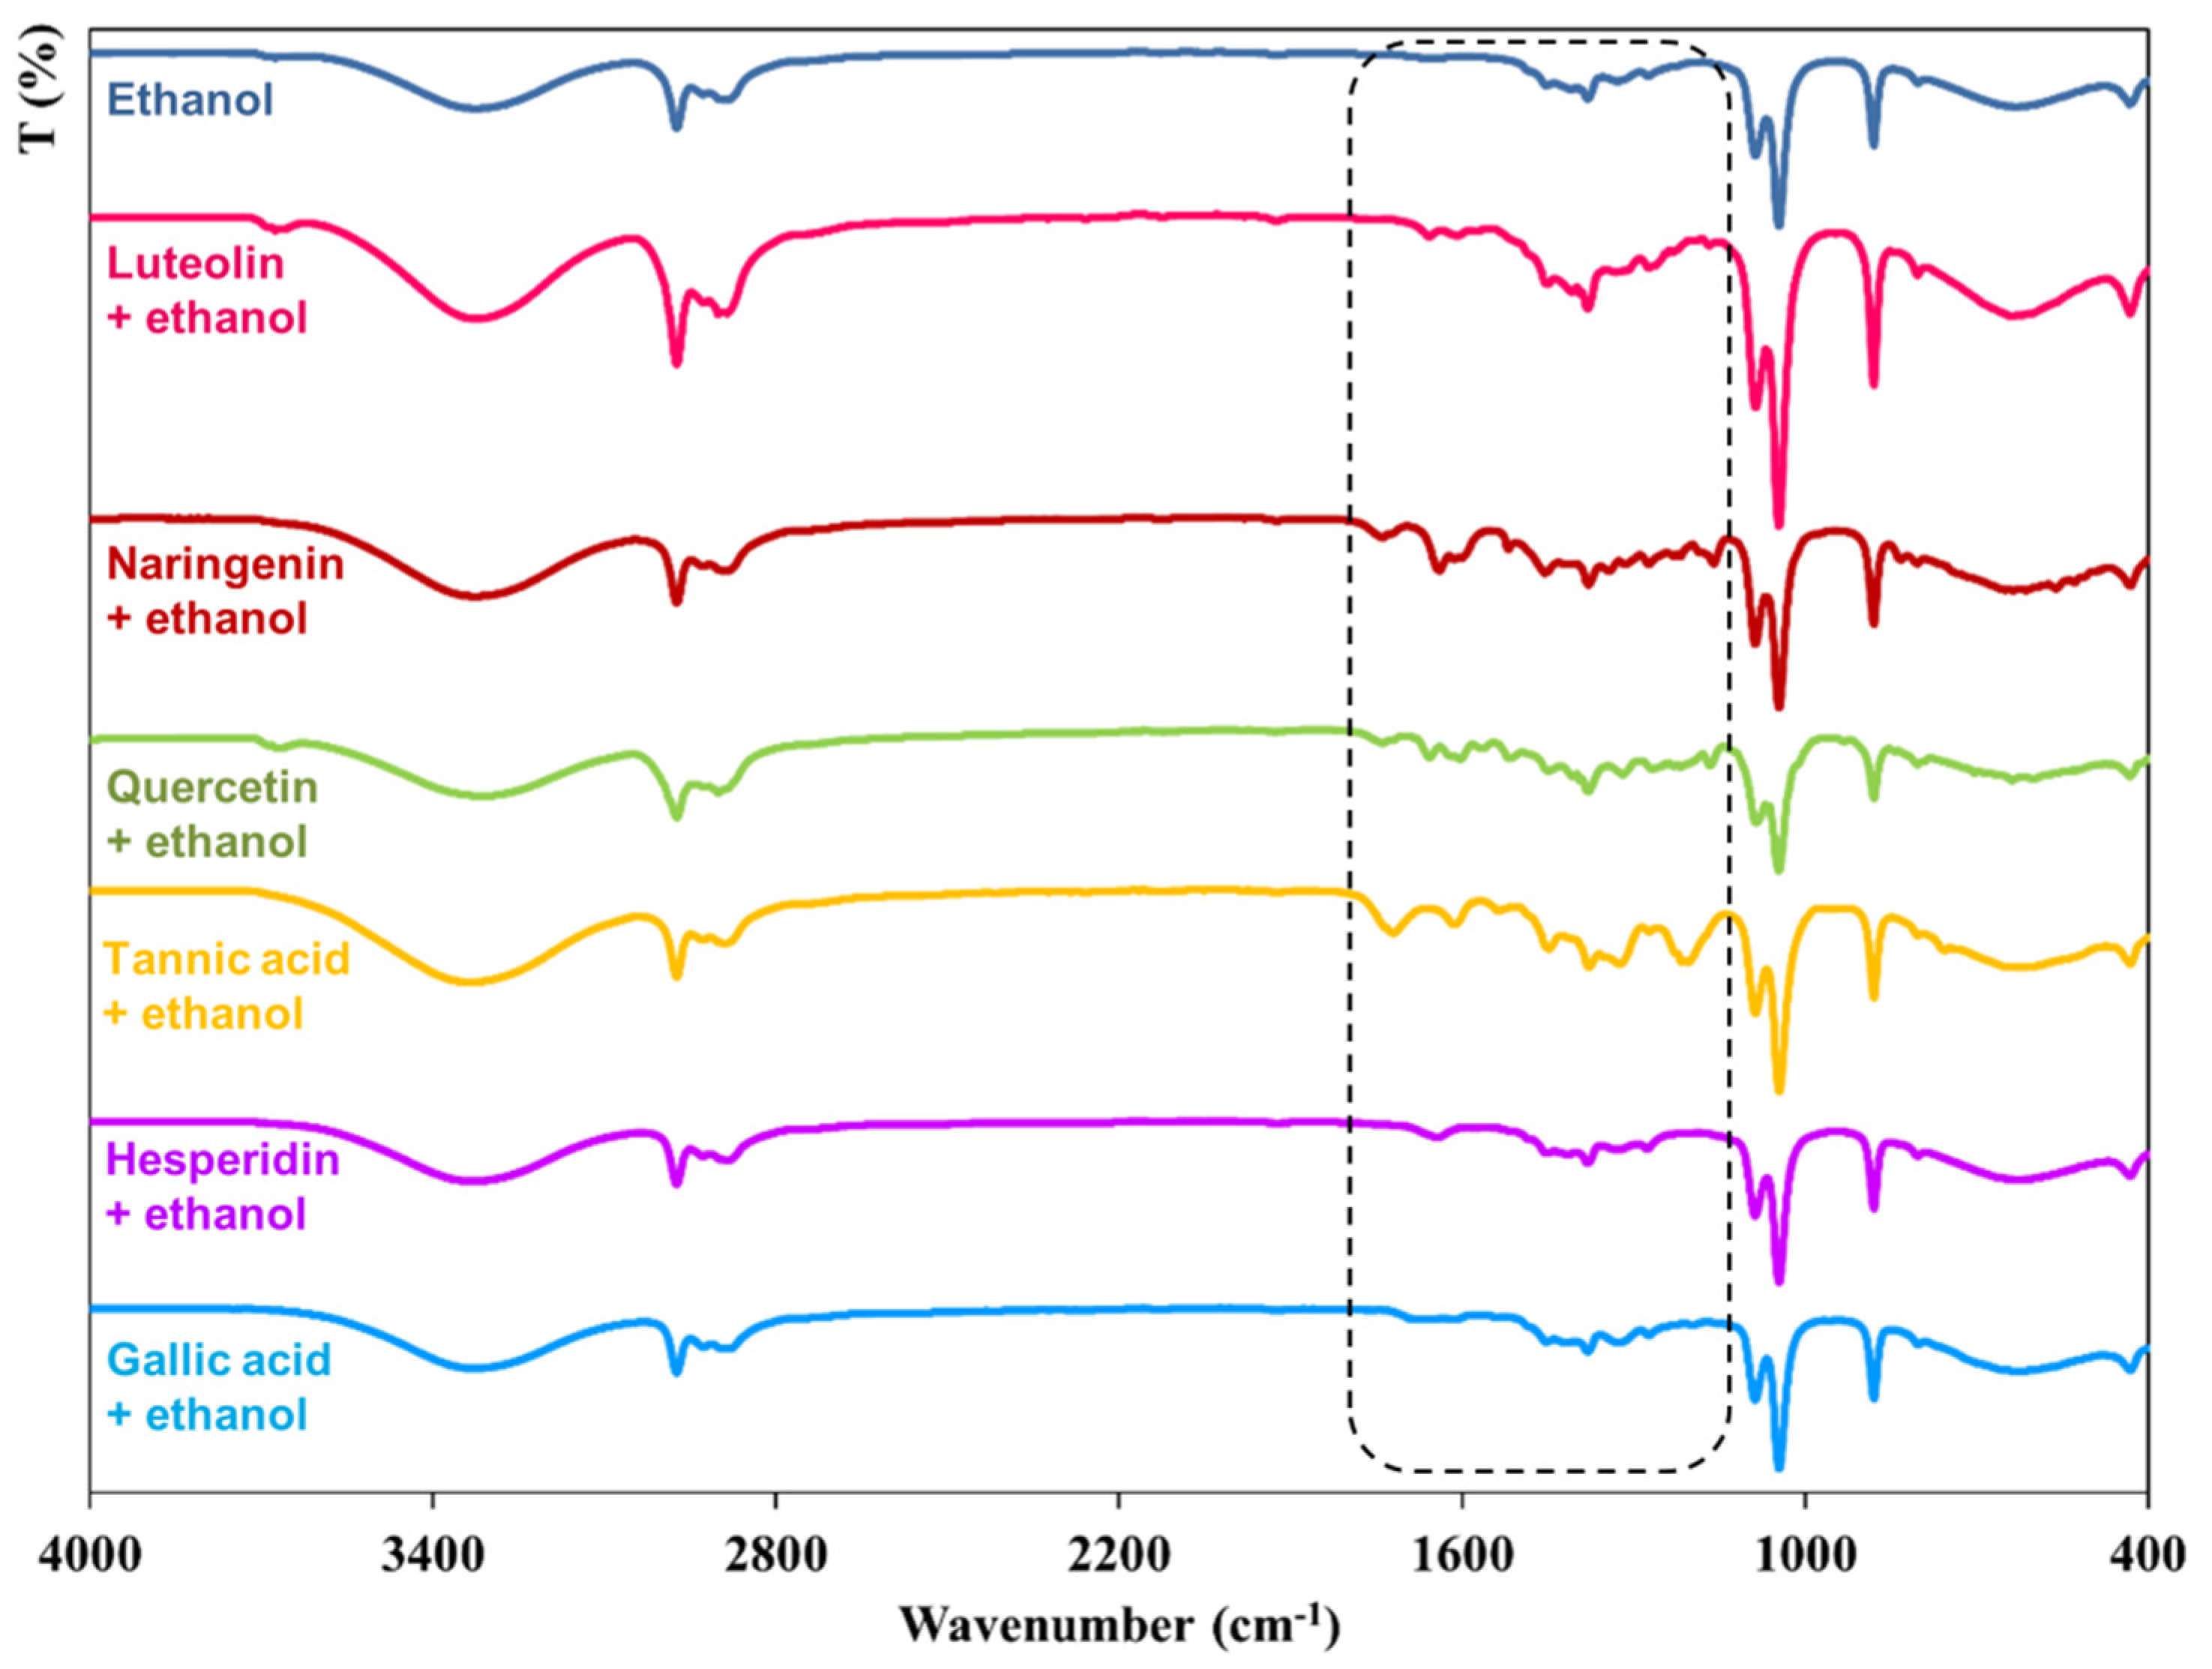
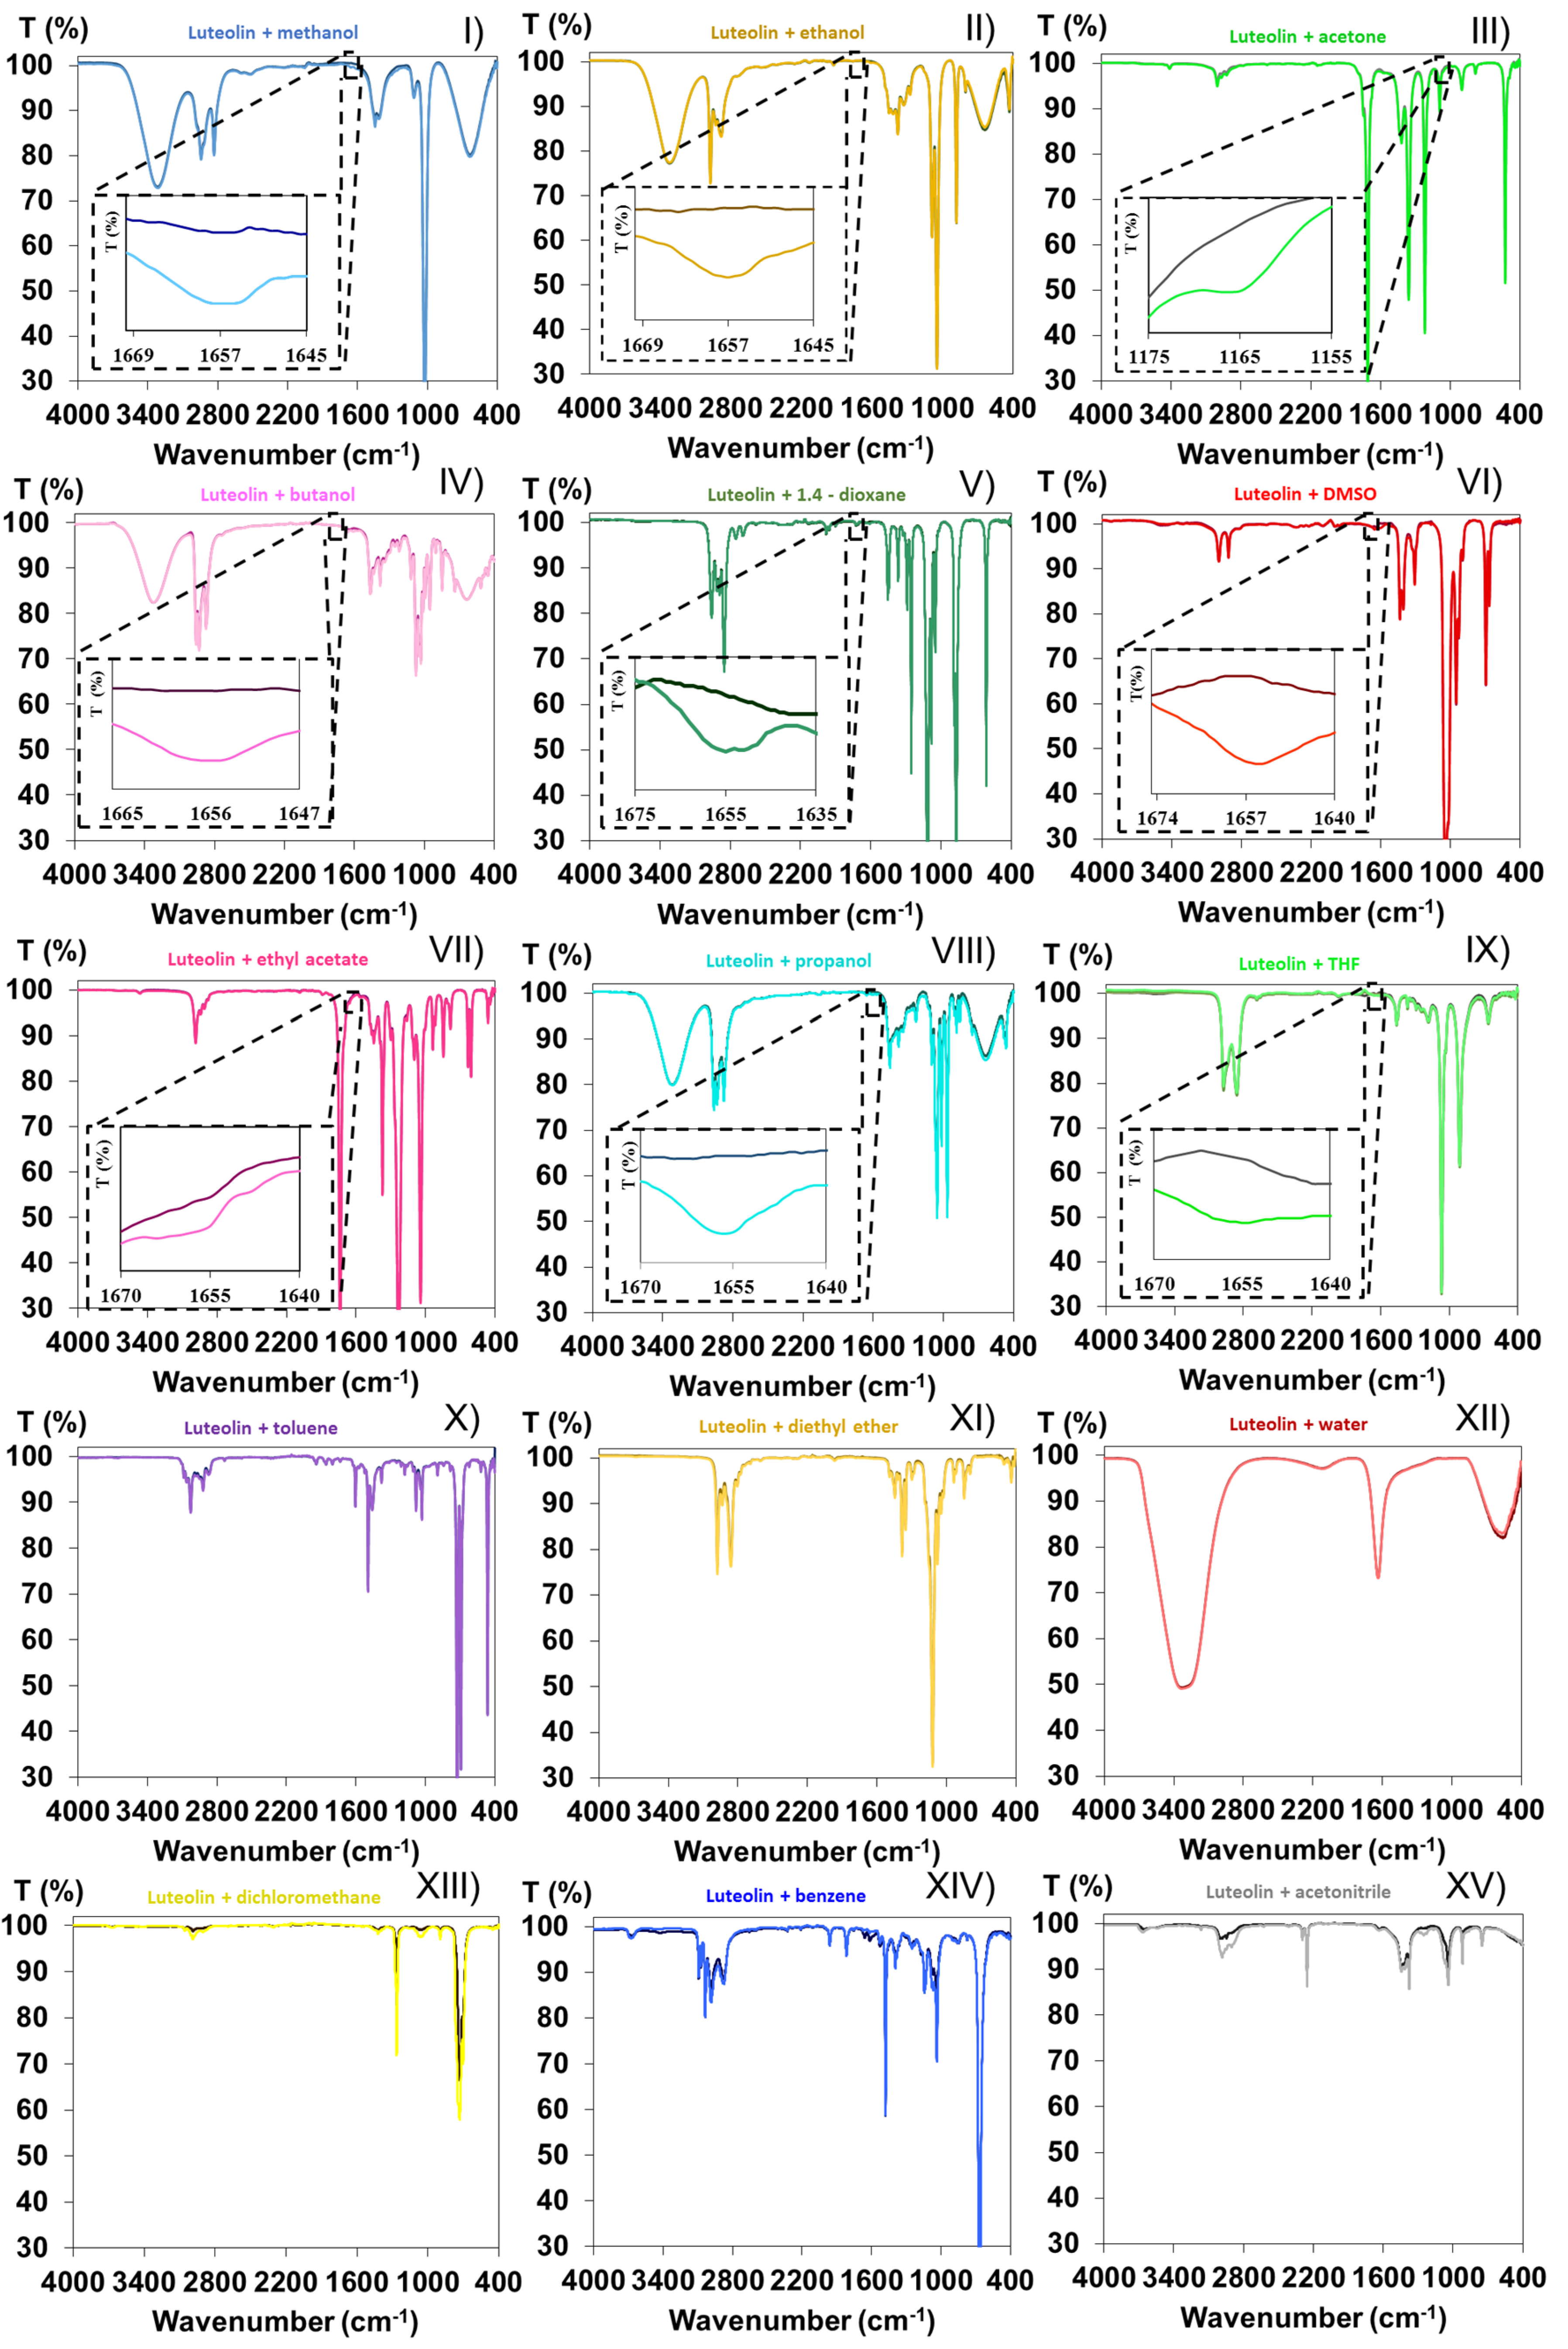
3.1. FTIR Spectroscopy
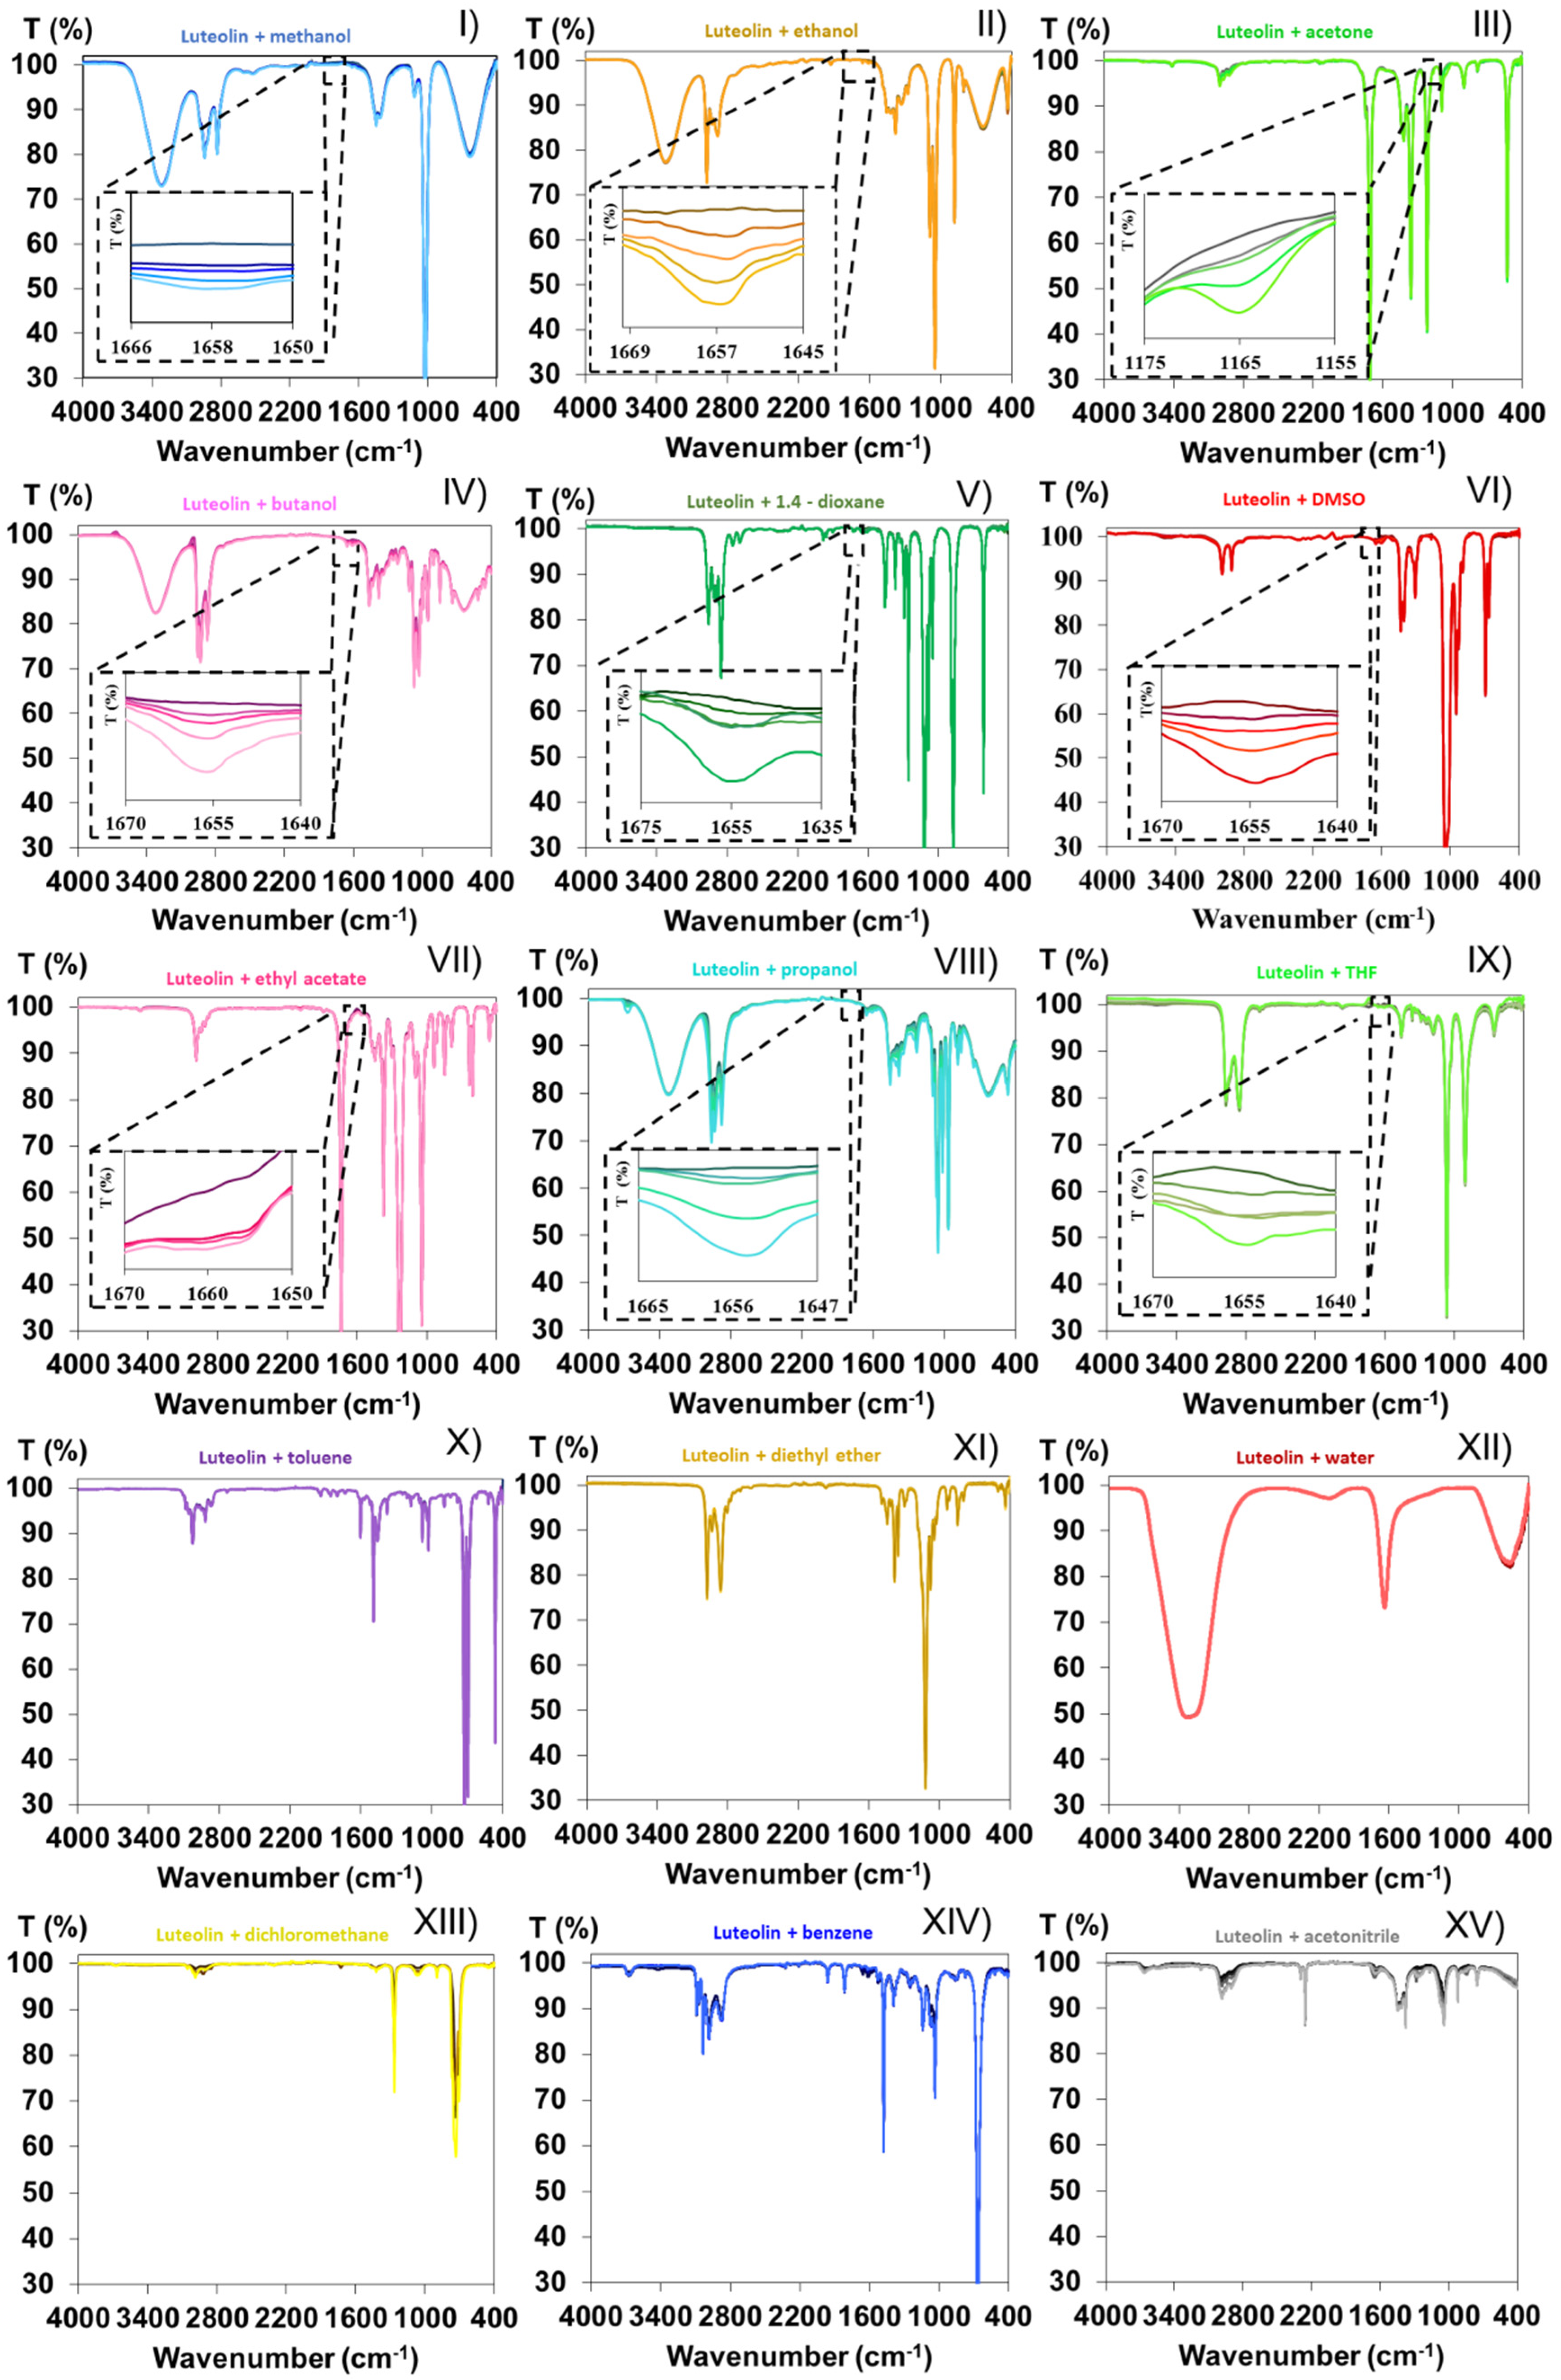
3.1.1. Luteolin Analysis in Presence of Different Solvents
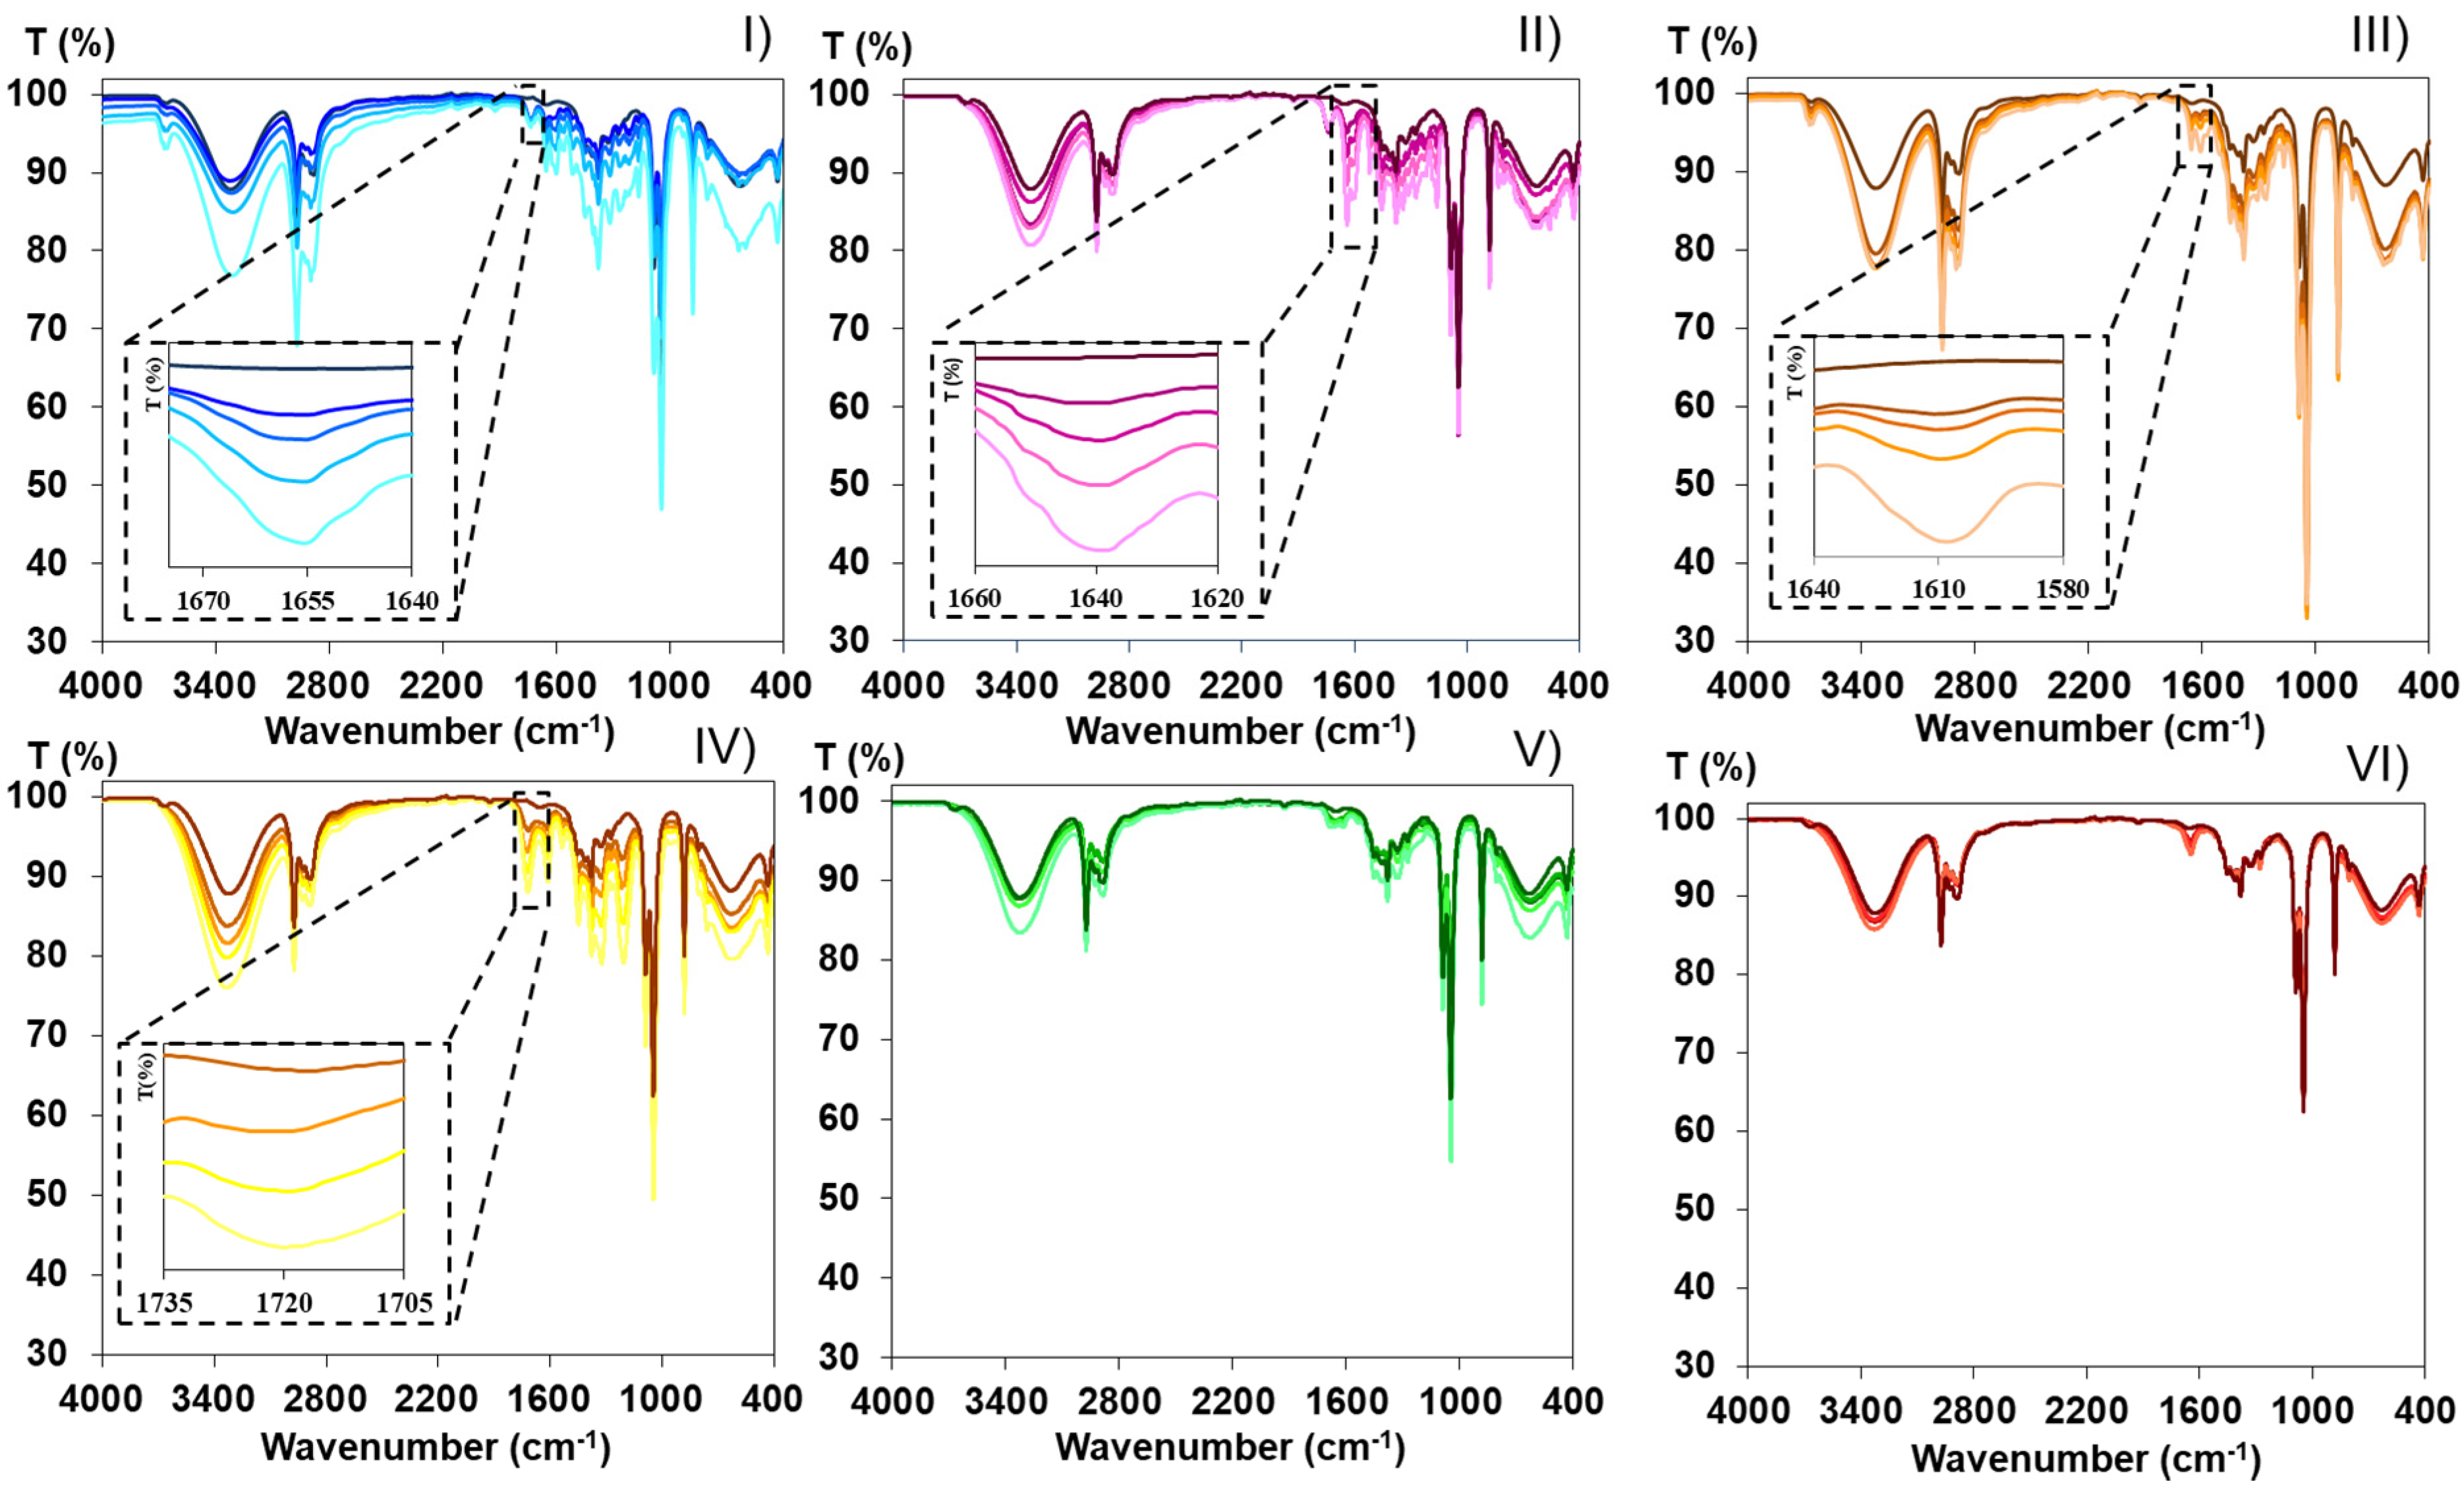
3.1.2. Correlation of Flavonoids and Phenolic Compounds Concentration and Transmittance
3.2. HPLC Analysis of Luteolin Solubility
4. Conclusions
Supplementary Materials
Author Contributions
Funding
Institutional Review Board Statement
Informed Consent Statement
Data Availability Statement
Acknowledgments
Conflicts of Interest
References
- Daneshfar, A.; Baghlani, M.; Sarabi, R.S.; Sahraei, R.; Abassi, S.; Kaviyan, H.; Khezeli, T. Solubility of citric, malonic, and malic acids in different solvents from 303.2 to 333.2 K. Fluid Phase Equilib. 2012, 313, 11–15. [Google Scholar] [CrossRef]
- Martínez, F.; Jouyban, A.; Acree, W.E. Pharmaceuticals solubility is still nowadays widely studied everywhere. Pharm. Sci. 2017, 23, 1–2. [Google Scholar] [CrossRef] [Green Version]
- Noubigh, A.; Aydi, A.; Mgaidi, A.; Abderrabba, M. Measurement and correlation of the solubility of gallic acid in methanol plus water systems from (293.15 to 318.15) K. J. Mol. Liq. 2013, 187, 226–229. [Google Scholar] [CrossRef]
- Manzoor, M.F.; Ahmad, N.; Ahmed, Z.; Siddique, R.; Zeng, X.A.; Rahaman, A.; Muhammad Aadil, R.; Wahab, A. Novel extraction techniques and pharmaceutical activities of luteolin and its derivatives. J. Food Biochem. 2019, 43, e12974. [Google Scholar] [CrossRef]
- Gómez, E.; Requejo, P.F.; Tojo, E.; Macedo, E.A. Recovery of flavonoids using novel biodegradable choline amino acids ionic liquids based ATPS. Fluid Phase Equilib. 2019, 493, 1–9. [Google Scholar] [CrossRef]
- Feizi, S.; Jabbari, M.; Farajtabar, A. A systematic study on solubility and solvation of bioactive compound chrysin in some water + cosolvent mixtures. J. Mol. Liq. 2016, 220, 478–483. [Google Scholar] [CrossRef]
- Luo, Y.; Shang, P.; Li, D. Luteolin: A Flavonoid that has multiple cardio-protective effects and its molecular mechanisms. Front. Pharmacol. 2017, 8, 692. [Google Scholar] [CrossRef] [PubMed] [Green Version]
- Lin, Y.; Shi, R.; Wang, X.; Shen, H.-M. Luteolin, a Flavonoid with Potential for Cancer Prevention and Therapy. Curr. Cancer Drug Targets 2008, 8, 634–646. [Google Scholar] [CrossRef]
- Koleva, V.; Simeonov, E. Solid liquid extraction of phenolic and flavonoid compounds from Cotinus coggygria and concentration by nanofiltration. Chem. Biochem. Eng. Q. 2015, 28, 545–551. [Google Scholar] [CrossRef]
- Truong, D.H.; Nguyen, D.H.; Ta, N.T.A.; Bui, A.V.; Do, T.H.; Nguyen, H.C. Evaluation of the use of different solvents for phytochemical constituents, antioxidants, and in vitro anti-inflammatory activities of severinia buxifolia. J. Food Qual. 2019, 2019, 1–9. [Google Scholar] [CrossRef] [Green Version]
- Shakeel, F.; Alshehri, S.; Ibrahim, M.A.; Elzayat, E.M.; Altamimi, M.A.; Mohsin, K.; Alanazi, F.K.; Alsarra, I.A. Solubility and thermodynamic parameters of apigenin in different neat solvents at different temperatures. J. Mol. Liq. 2017, 234, 73–80. [Google Scholar] [CrossRef]
- Zi, J.; Peng, B.; Yan, W. Solubilities of rutin in eight solvents at T = 283.15, 298.15, 313.15, 323.15, and 333.15 K. Fluid Phase Equilib. 2007, 261, 111–114. [Google Scholar] [CrossRef]
- Ferreira, O.; Pinho, S.P. Solubility of flavonoids in pure solvents. Ind. Eng. Chem. Res. 2012, 51, 6586–6590. [Google Scholar] [CrossRef]
- Zhang, H.; Wang, M.; Chen, L.; Liu, Y.; Liu, H.; Huo, H.; Sun, L.; Ren, X.; Deng, Y.; Qi, A. Structure-solubility relationships and thermodynamic aspects of solubility of some flavonoids in the solvents modeling biological media. J. Mol. Liq. 2017, 225, 439–445. [Google Scholar] [CrossRef]
- Stalikas, C.D. Extraction, separation, and detection methods for phenolic acids and flavonoids. J. Sep. Sci. 2007, 30, 3268–3295. [Google Scholar] [CrossRef] [PubMed]
- Ben Ahmed, Z.; Yousfi, M.; Viaene, J.; Dejaegher, B.; Demeyer, K.; Mangelings, D.; Heyden, Y. Vander Determination of optimal extraction conditions for phenolic compounds from: Pistacia atlantica leaves using the response surface methodology. Anal. Methods 2016, 8, 6107–6114. [Google Scholar] [CrossRef]
- Peng, B.; Yan, W. Solubility of luteolin in ethanol + water mixed solvents at different temperatures. J. Chem. Eng. Data 2010, 55, 583–585. [Google Scholar] [CrossRef]
- Xiao, M.; Yan, W.; Zhang, Z. Solubilities of apigenin in ethanol + water at different temperatures. J. Chem. Eng. Data 2010, 55, 3346–3348. [Google Scholar] [CrossRef]
- Shakeel, F.; Haq, N.; Alshehri, S.; Ibrahim, M.A.; Elzayat, E.M.; Altamimi, M.A.; Mohsin, K.; Alanazi, F.K.; Alsarra, I.A. Solubility, thermodynamic properties and solute-solvent molecular interactions of luteolin in various pure solvents. J. Mol. Liq. 2018, 255, 43–50. [Google Scholar] [CrossRef]
- Zhang, L.; Song, L.; Zhang, P.; Liu, T.; Zhou, L.; Yang, G.; Lin, R.; Zhang, J. Solubilities of naringin and naringenin in different solvents and dissociation constants of naringenin. J. Chem. Eng. Data 2015, 60, 932–940. [Google Scholar] [CrossRef]
- Großhans, S.; Rüdt, M.; Sanden, A.; Brestrich, N.; Morgenstern, J.; Heissler, S.; Hubbuch, J. In-line Fourier-transform infrared spectroscopy as a versatile process analytical technology for preparative protein chromatography. J. Chromatogr. A 2018, 1547, 37–44. [Google Scholar] [CrossRef] [PubMed]
- Bertrand, A.; Morel, S.; Lefoulon, F.; Rolland, Y.; Monsan, P.; Remaud-Simeon, M. Leuconostoc mesenteroides glucansucrase synthesis of flavonoid glucosides by acceptor reactions in aqueous-organic solvents. Carbohydr. Res. 2006, 341, 855–863. [Google Scholar] [CrossRef] [PubMed]
- Common Solvents Used in Organic Chemistry: Table of Properties. Available online: https://organicchemistrydata.org/solvents/ (accessed on 20 October 2021).
- Unsalan, O.; Erdogdu, Y.; Gulluoglu, M.T. FT-Raman and FT-IR spectral and quantum chemical studies on some flavonoid derivatives: Baicalein and Naringenin. J. Raman Spectrosc. 2009, 40, 562–570. [Google Scholar] [CrossRef]
- Michniewicz, N.; Muszyński, A.S.; Wrzeszcz, W.; Czarnecki, M.A.; Golec, B.; Hawranek, J.P.; Mielke, Z. Vibrational spectra of liquid 1-propanol. J. Mol. Struct. 2008, 887, 180–186. [Google Scholar] [CrossRef]
- Xu, W.F.; Zhang, Z.Y.; Wang, Q.; Zhu, H.J.; Zheng, C.L. Research of the dyeing thermodynamics and supramolecular structure of luteolin on wool fabric. Wool Text. J. 2015, 43, 6–9. [Google Scholar]
- Smith, B.C. The C-O Bond, Part I: Introduction and the Infrared Spectroscopy of Alcohols. Spectroscopy 2017, 32, 14–21. [Google Scholar]
- Roy, S.; Mallick, S.; Chakraborty, T.; Ghosh, N.; Singh, A.K.; Manna, S.; Majumdar, S. Synthesis, characterisation and antioxidant activity of luteolin-vanadium (II) complex. Food Chem. 2015, 173, 1172–1178. [Google Scholar] [CrossRef]
- Baranović, G.; Šegota, S. Infrared spectroscopy of flavones and flavonols. Reexamination of the hydroxyl and carbonyl vibrations in relation to the interactions of flavonoids with membrane lipids. Spectrochim. Acta Part A Mol. Biomol. Spectrosc. 2018, 192, 473–486. [Google Scholar] [CrossRef]
- Silva, S.D.; Feliciano, R.P.; Boas, L.V.; Bronze, M.R. Application of FTIR-ATR to Moscatel dessert wines for prediction of total phenolic and flavonoid contents and antioxidant capacity. Food Chem. 2014, 150, 489–493. [Google Scholar] [CrossRef]
- Zhong, Y.; Chen, Y.; Feng, X.; Sun, Y.; Cui, S.; Li, X.; Jin, X.; Zhao, G. Hydrogen-bond facilitated intramolecular proton transfer in excited state and fluorescence quenching mechanism of flavonoid compounds in aqueous solution. J. Mol. Liq. 2020, 302, 112562. [Google Scholar] [CrossRef]
- Zhang, J.; Zhang, P.; Ma, K.; Han, F.; Chen, G.; Wei, X. Hydrogen bonding interactions between ethylene glycol and water: Density, excess molar volume, and spectral study. Sci. China Ser. B Chem. 2008, 51, 420–426. [Google Scholar] [CrossRef]
- Peng, B.; Zi, J.; Yan, W. Measurement and correlation of solubilities of luteolin in organic solvents at different temperatures. J. Chem. Eng. Data 2006, 51, 2038–2040. [Google Scholar] [CrossRef]
- Vicente, F.A.; Santos, J.H.P.M.; Pereira, I.M.M.; Gonçalves, C.V.M.; Dias, A.C.R.V.; Coutinho, J.A.P.; Ventura, S.P.M. Integration of aqueous (micellar) two-phase systems on the proteins separation. BMC Chem. Eng. 2019, 1, 4. [Google Scholar] [CrossRef] [Green Version]
- Melucci, D.; Zappi, A.; Poggioli, F.; Morozzi, P.; Giglio, F.; Tositti, L. ATR-FTIR spectroscopy, a new non-destructive approach for the quantitative determination of biogenic silica in marine sediments. Molecules 2019, 24, 3927. [Google Scholar] [CrossRef] [Green Version]
- Pandey, S.; Pandey, P.; Tiwari, G.; Tiwari, R.; Rai, A.K. FTIR spectroscopy: A tool for quantitative analysis of ciprofloxacin in tablets. Indian J. Pharm. Sci. 2012, 74, 86–90. [Google Scholar] [CrossRef] [Green Version]
- Sylvestre N’cho, J.; Fofana, I.; Hadjadj, Y.; Beroual, A. Review of physicochemical-based diagnostic techniques for assessing insulation condition in aged transformers. Energies 2016, 9, 367. [Google Scholar] [CrossRef]


| Chemical Structure | CAS Number | Purity (wt %) | Supplier | |
|---|---|---|---|---|
| Luteolin | 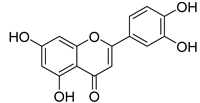 | 491-70-3 | 97.0% | Abcr GmbH |
| (±)-Naringenin | 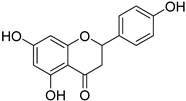 | 67604-48-2 | ≥95.0% | Aldrich |
| Quercetin | 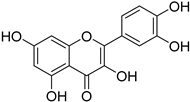 | 117-39-5 | ≥95.0% | Sigma |
| Hesperidin |  | 520-26-3 | ≥80.0% | Sigma |
| Gallic acid |  | 149-91-7 | ≥97.5% | Sigma Aldrich |
| Tannic acid |  | 1401-55-4 | ≥87.5% | Sigma Aldrich |
| Solvent | CAS Number | Purity (wt %) | Supplier |
|---|---|---|---|
| Methanol | 67-56-1 | ≥99.8% | Honeywell |
| Ethanol | 64-17-5 | ≥99.9% | Carlo Erba |
| n-Propanol | 71-23-8 | ≥99.5% | Kemika |
| 1-Butanol | 71-36-3 | ≥99.5% | Merck |
| Ethyl acetate | 141-78-6 | ≥99.9% | Honeywell |
| Acetonitrile | 75-05-8 | ≥99.9% | Honeywell |
| Diethyl ether | 60-29-7 | ≥99.7% | Merck |
| Acetone | 67-64-1 | ≥99.5% | Honeywell |
| Toluene | 108-88-3 | ≥99.5% | Merck |
| Dimethyl sulfoxide | 67-68-5 | ≥99.9% | Merck |
| 1.4-Dioxane | 123-91-1 | ≥99.0% | Honeywell |
| Tetrahydrofuran | 109-99-9 | ≥99.9% | Honeywell |
| Dichloromethane | 75-09-2 | ≥99.5% | Merck |
| Benzene | 71-43-2 | ≥99.0% | Sigma–Aldrich |
| IR Vibration Peaks at Specific Wavenumbers (cm−1) | ||||||
|---|---|---|---|---|---|---|
| Solvent | O-H | C-H | C=O | C-C | C-O-C | C-OH |
| Ethanol | 3325 | 2973–2901 | / | 1656–1609 | 1169 | 1045 |
| Methanol | 3325 | 2994–2832 | / | 1654–1611 | 1168 | 1022 |
| 1.4–Dioxane | / | 2959–2852 | / | 1655–1609 | 1116 | / |
| Ethyl acetate | / | 2984 | 1737 | 1656 | 1233 | / |
| Acetone | / | 3003 | 1710 | 1358–1219 | / | / |
| DMSO | / | 2989-2911 | / | 1655–1603 | 1251–1230 | / |
| THF | / | 2973–2857 | / | 1660–1604 | 1066 | / |
| Butanol | 3324 | 2959–2873 | / | 1658–1608 | / | 1071 |
| Propanol | 3324 | 2952–2877 | / | 1658–1608 | / | 1053 |
Publisher’s Note: MDPI stays neutral with regard to jurisdictional claims in published maps and institutional affiliations. |
© 2021 by the authors. Licensee MDPI, Basel, Switzerland. This article is an open access article distributed under the terms and conditions of the Creative Commons Attribution (CC BY) license (https://creativecommons.org/licenses/by/4.0/).
Share and Cite
Rajhard, S.; Hladnik, L.; Vicente, F.A.; Srčič, S.; Grilc, M.; Likozar, B. Solubility of Luteolin and Other Polyphenolic Compounds in Water, Nonpolar, Polar Aprotic and Protic Solvents by Applying FTIR/HPLC. Processes 2021, 9, 1952. https://doi.org/10.3390/pr9111952
Rajhard S, Hladnik L, Vicente FA, Srčič S, Grilc M, Likozar B. Solubility of Luteolin and Other Polyphenolic Compounds in Water, Nonpolar, Polar Aprotic and Protic Solvents by Applying FTIR/HPLC. Processes. 2021; 9(11):1952. https://doi.org/10.3390/pr9111952
Chicago/Turabian StyleRajhard, Saša, Lucija Hladnik, Filipa A. Vicente, Stanko Srčič, Miha Grilc, and Blaž Likozar. 2021. "Solubility of Luteolin and Other Polyphenolic Compounds in Water, Nonpolar, Polar Aprotic and Protic Solvents by Applying FTIR/HPLC" Processes 9, no. 11: 1952. https://doi.org/10.3390/pr9111952
APA StyleRajhard, S., Hladnik, L., Vicente, F. A., Srčič, S., Grilc, M., & Likozar, B. (2021). Solubility of Luteolin and Other Polyphenolic Compounds in Water, Nonpolar, Polar Aprotic and Protic Solvents by Applying FTIR/HPLC. Processes, 9(11), 1952. https://doi.org/10.3390/pr9111952