
Retrieval of Aerosol Optical Thickness with Custom Aerosol Model Using SKYNET Data over the Chiba Area

Center for Environmental Remote Sensing, Chiba University, 1-33 Yayoicho, Inage-ku, Chiba 263-8522, Japan
*
Author to whom correspondence should be addressed.
Atmosphere 2021, 12(9), 1144; https://doi.org/10.3390/atmos12091144
Submission received: 26 July 2021
/
Revised: 27 August 2021
/
Accepted: 2 September 2021
/
Published: 5 September 2021
(This article belongs to the Special Issue Aerosol, Cloud, Precipitation Processes and Interactions Observed with Ground-Based Remote Sensing Measurements)
Abstract
:The retrieval of the aerosol optical thickness (AOT) from remotely-sensed data relies on the adopted aerosol model. However, the method of this technique has been rather limited because of the high variability of the surface albedo, in addition to the spatial variability in the aerosol properties over the land surfaces. To overcome unsolved problems, we proposed a method for the visibility-derived AOT estimation from SKYNET-based measurement and daytime satellite images with a custom aerosol model over the Chiba area (35.62° N, 140.10° E), which is located in the greater Tokyo metropolitan area in Japan. Different from conventionally-used aerosol models for the boundary layer, we created a custom aerosol model by using sky-radiometer observation data of aerosol volume size distribution and refractive indices, coupled with spectral response functions (SPFs) of satellite visible bands to alleviate the wide range of path-scattered radiance. We utilized the radiative transfer code 6S to implement the radiative transfer calculation based on the created custom aerosol model. The concurrent data from ground-based measurement are used in the radiative analysis, namely the temporal variation of AOT from SKYNET. The radiative estimation conducted under clear-sky conditions with minimum aerosol loading is used for the determination of the surface albedo, so that the 6S simulation yields a well-defined relation between total radiance and surface albedo. We made look-up tables (LUTs) pixel-by-pixel over the Chiba area for the custom aerosol model to retrieve the satellite AOT distribution based on the surface albedo. Therefore, such a reference of surface albedo generated from clear-sky conditions, in turn, can be employed to retrieve the spatial distribution of AOT on both clear and relatively turbid days. The value for the AOTs retrieved using the custom aerosol model is found to be stable than conventionally-used typical aerosol models, indicating that our method yields substantially better performance.
1. Introduction
Atmospheric aerosol has a pivotal role in both air pollution and radiation budget studies [1,2,3]. Since aerosol optical thickness (AOT) plays an important role in describing the exchange of radiation between ground and atmosphere, the precise monitoring of its spatiotemporal changes is indispensable for a better understanding of the influence of both natural and anthropogenic activities [4,5,6]. Moreover, the distribution of aerosol properties and their variability is essential to understand their lifetime and behavior (including its emission, transport, and deposition) in the atmosphere, and thereby reveal their influence on the climate system.
Although AOT retrievals have widely been estimated from the radiative transfer RT code-based physical models and in-scene-based corrections [7], there still exist several inherent limitations. One of the greatest challenges of this latter method is the measurement of AOT that can vary both spatially and temporally even under clear-sky conditions. The accuracy of atmospheric correction can be adversely affected by the errors of AOT distribution. To eliminate atmospheric effects, previous studies mainly applied the RT code-based models (RTMs) [8], such as the Second Simulation of a Satellite Signal in the Solar Spectrum (6S) and MODerate resolution atmospheric TRANsmission (MODTRAN) [9]. The RT code-based method, on the other hand, suffers from the lack of a priori, physical information to perform atmospheric corrections, especially when applied to low spectral resolution, multispectral sensors [10]. In urban areas with a complex underlying surface, such as the Chiba area, a low spatial resolution AOT is unable to meet the environmental monitoring needs. Although high spatial resolution satellite images can be useful for obtaining AOT distribution in wide regions, the lack of accurate knowledge on the optical characteristics of surface reflectance often leads to uncertainties in the retrieval of AOTs [11]. Furthermore, physical parameters generated by the specific aerosol model must be recomputed every time the aerosol model is changed, creating the best suitable aerosol model is relatively rare.
Fortunately, during the past two decades ground-based remote sensing networks, namely Sky-radiometer Network (SKYNET), have been rapidly expanded throughout the world [12,13,14,15,16]. The strength of these networks is the ease of acquiring information from the ground through the standardization of measurements and data processing, which allows multi-year studies. Since AOT is an indicator of air pollution, this advantage is particularly important in East Asia, because in most countries, including Japan, air pollution has increased in recent years, whereas the trend analysis using aerosol optical properties from ground-based remote sensing networks could use much longer data [17,18,19,20,21]. Ground-based measurements are especially well suited for detailed long-term monitoring of the AOTs at a particular location [22,23,24]. The variability characterized by such measurements is strongly site-specific and the spatial coverage offered by ground-based networks is not necessarily sufficient to evaluate the variability at a scale that is significant for the climate. In this regard, satellite-based measurements have the advantage of broad and continuous observation, with the ability to collect large-range aerosol information and obtain their yearly spatiotemporal distributions [25]. Therefore, it is useful to fully grasp the large-scale-coverage distribution of aerosol particles and even retrieve the movement of aerosol optical properties from both ground stations and satellite images [26,27,28].
In this study, we retrieved AOT from SKYNET with a custom aerosol model and gave some spatiotemporal analyses of aerosols in Chiba, Japan. Instead of the conventional aerosol models (rural, urban, and maritime), we created a custom aerosol model by using SKYNET-based observation data combing with spectral response functions (SPFs) of satellite visible bands. We utilized the radiative transfer code 6S with the created custom aerosol model for generating surface albedo from a clear test image of Himawari-8. A specific place has the same surface optical properties at the same observation time so that the clear-day image observed in a season is utilized to optimize the reflectance distribution. The radiative transfer code is operated under plausible atmospheric conditions, and the clear test image is prepared by applying the AOT distribution based on the radiation transfer calculation. We made LUTs over the Chiba area to retrieve AOTs based on the reference surface albedo. Section 2 describes the study area and the datasets we used. Section 3 provides the method to derive the AOT spatiotemporal variability and aerosol retrieval process. Section 4 shows qualitative and quantitative results. Section 5 and Section 6 presents the discussion and conclusions, respectively.
2. Research Area and Datasets
2.1. Research Area
The measurements were conducted under clear-sky conditions at the Center for Environmental Remote Sensing (CEReS 35.62° N, 140.10° E), Chiba University. The Chiba campus is located about 30 km south of central Tokyo, along the east coast of Tokyo Bay, as illustrated in Figure 1. Long-term ground-based measurement of aerosol optical properties and monthly sampling of aerosol particles have been conducted at CEReS. This observation site is located on the east side of Tokyo Bay, surrounded by urban or industrial districts. East and southward, however, there are extended regions of farmland or forest. Since the observation site (CEReS) is located around 3 km from the seashore along the eastern side of Tokyo Bay, the atmospheric aerosols are influenced by both maritime and urban particles during seasonal change [29]. This situation makes observation site ideal for covering the influence of both urban aerosols (predominantly from the northside and east side of the site) and maritime aerosols (predominantly from the southside and westside of the site).
2.2. SKYNET-Based Observation
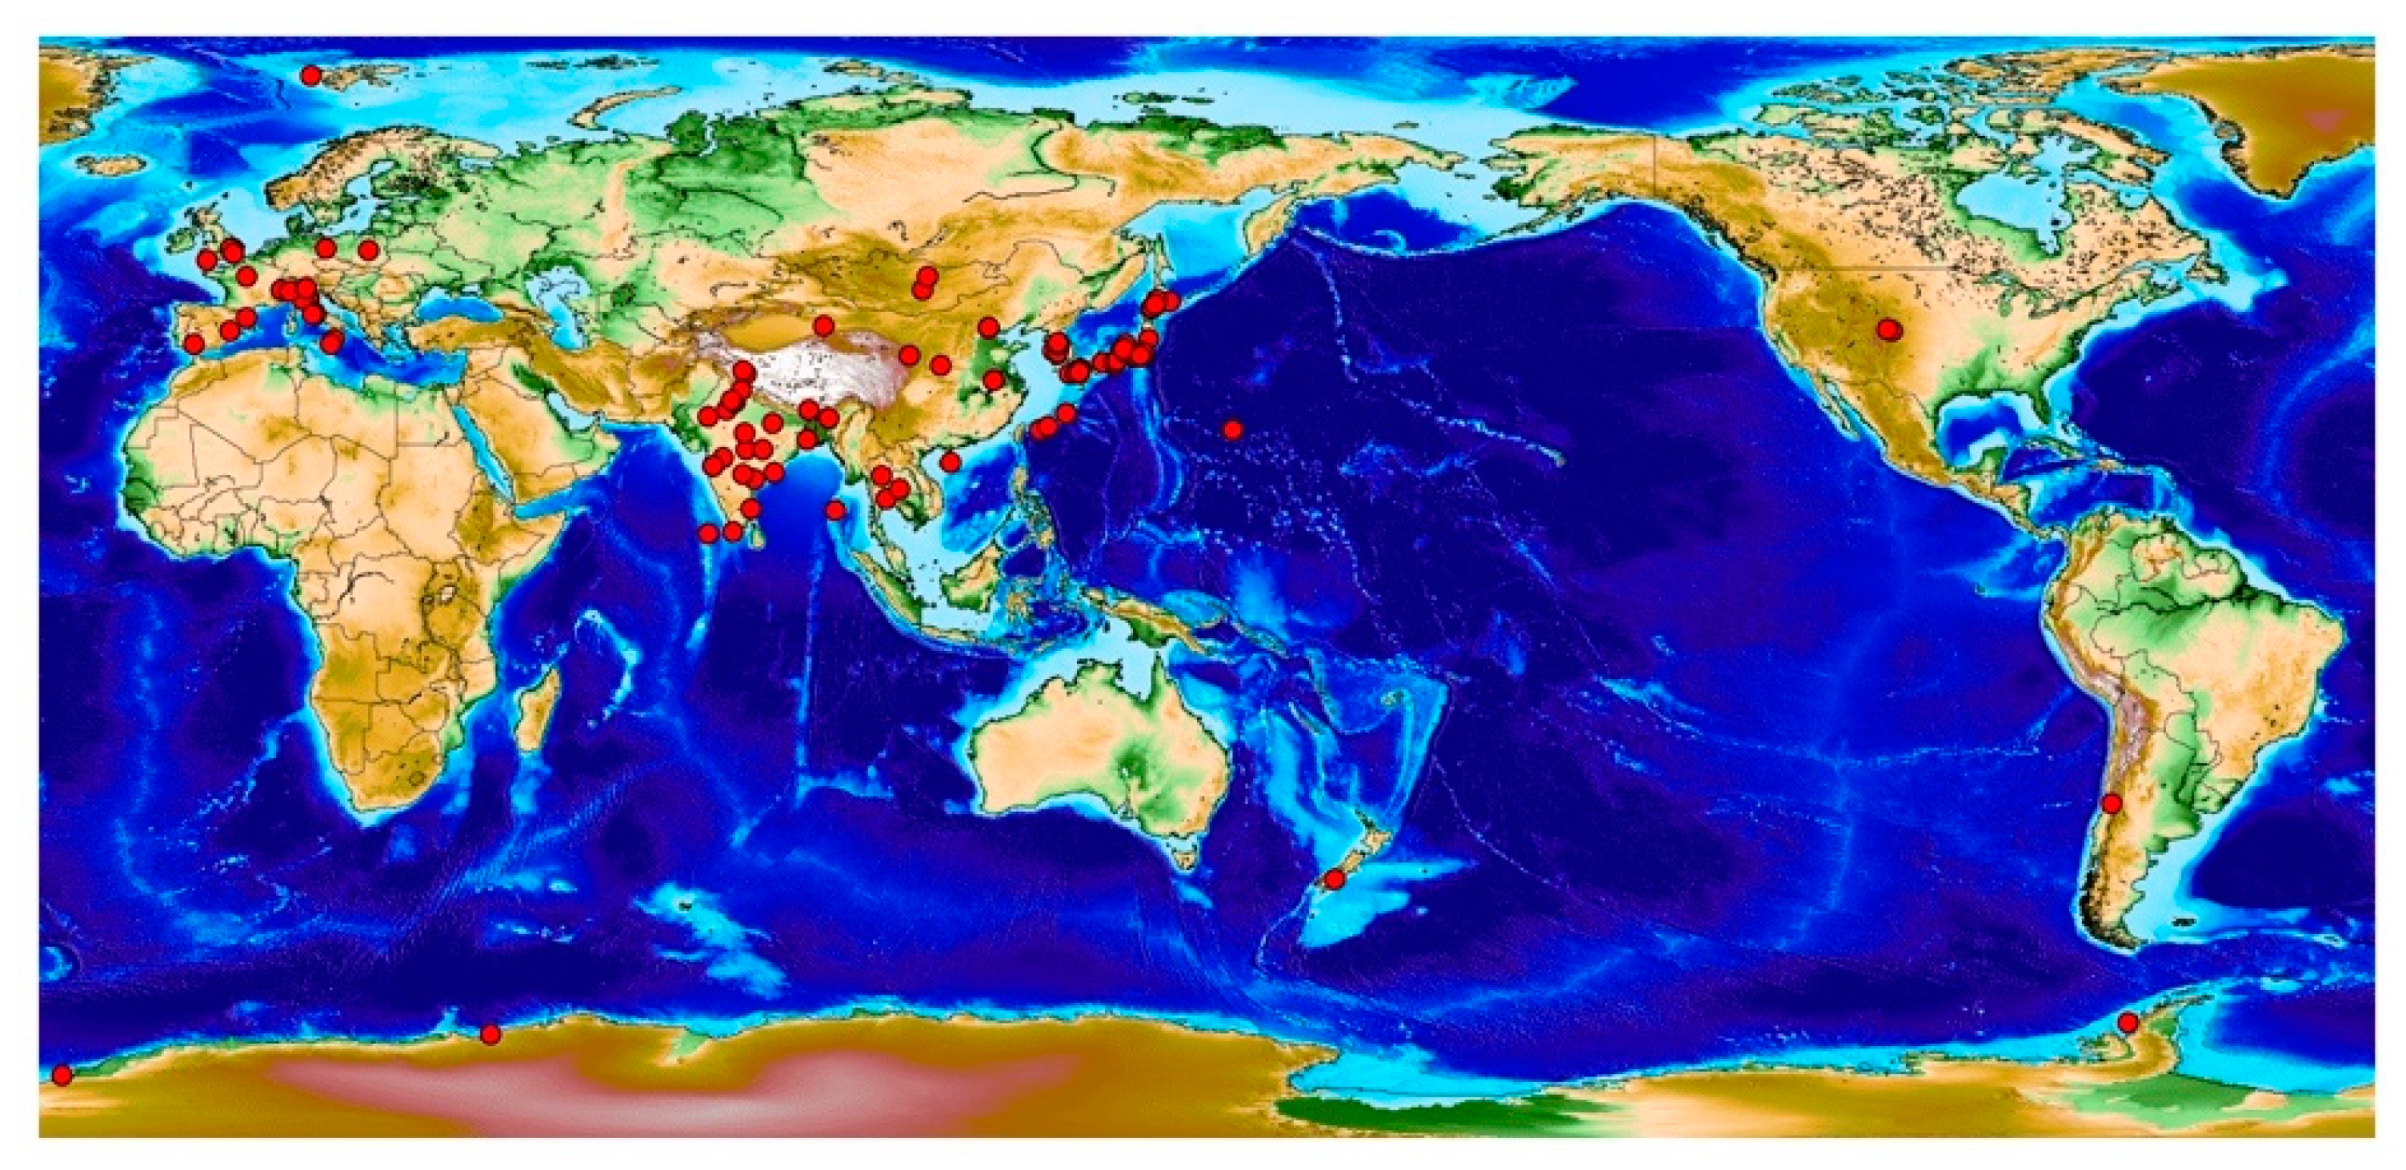
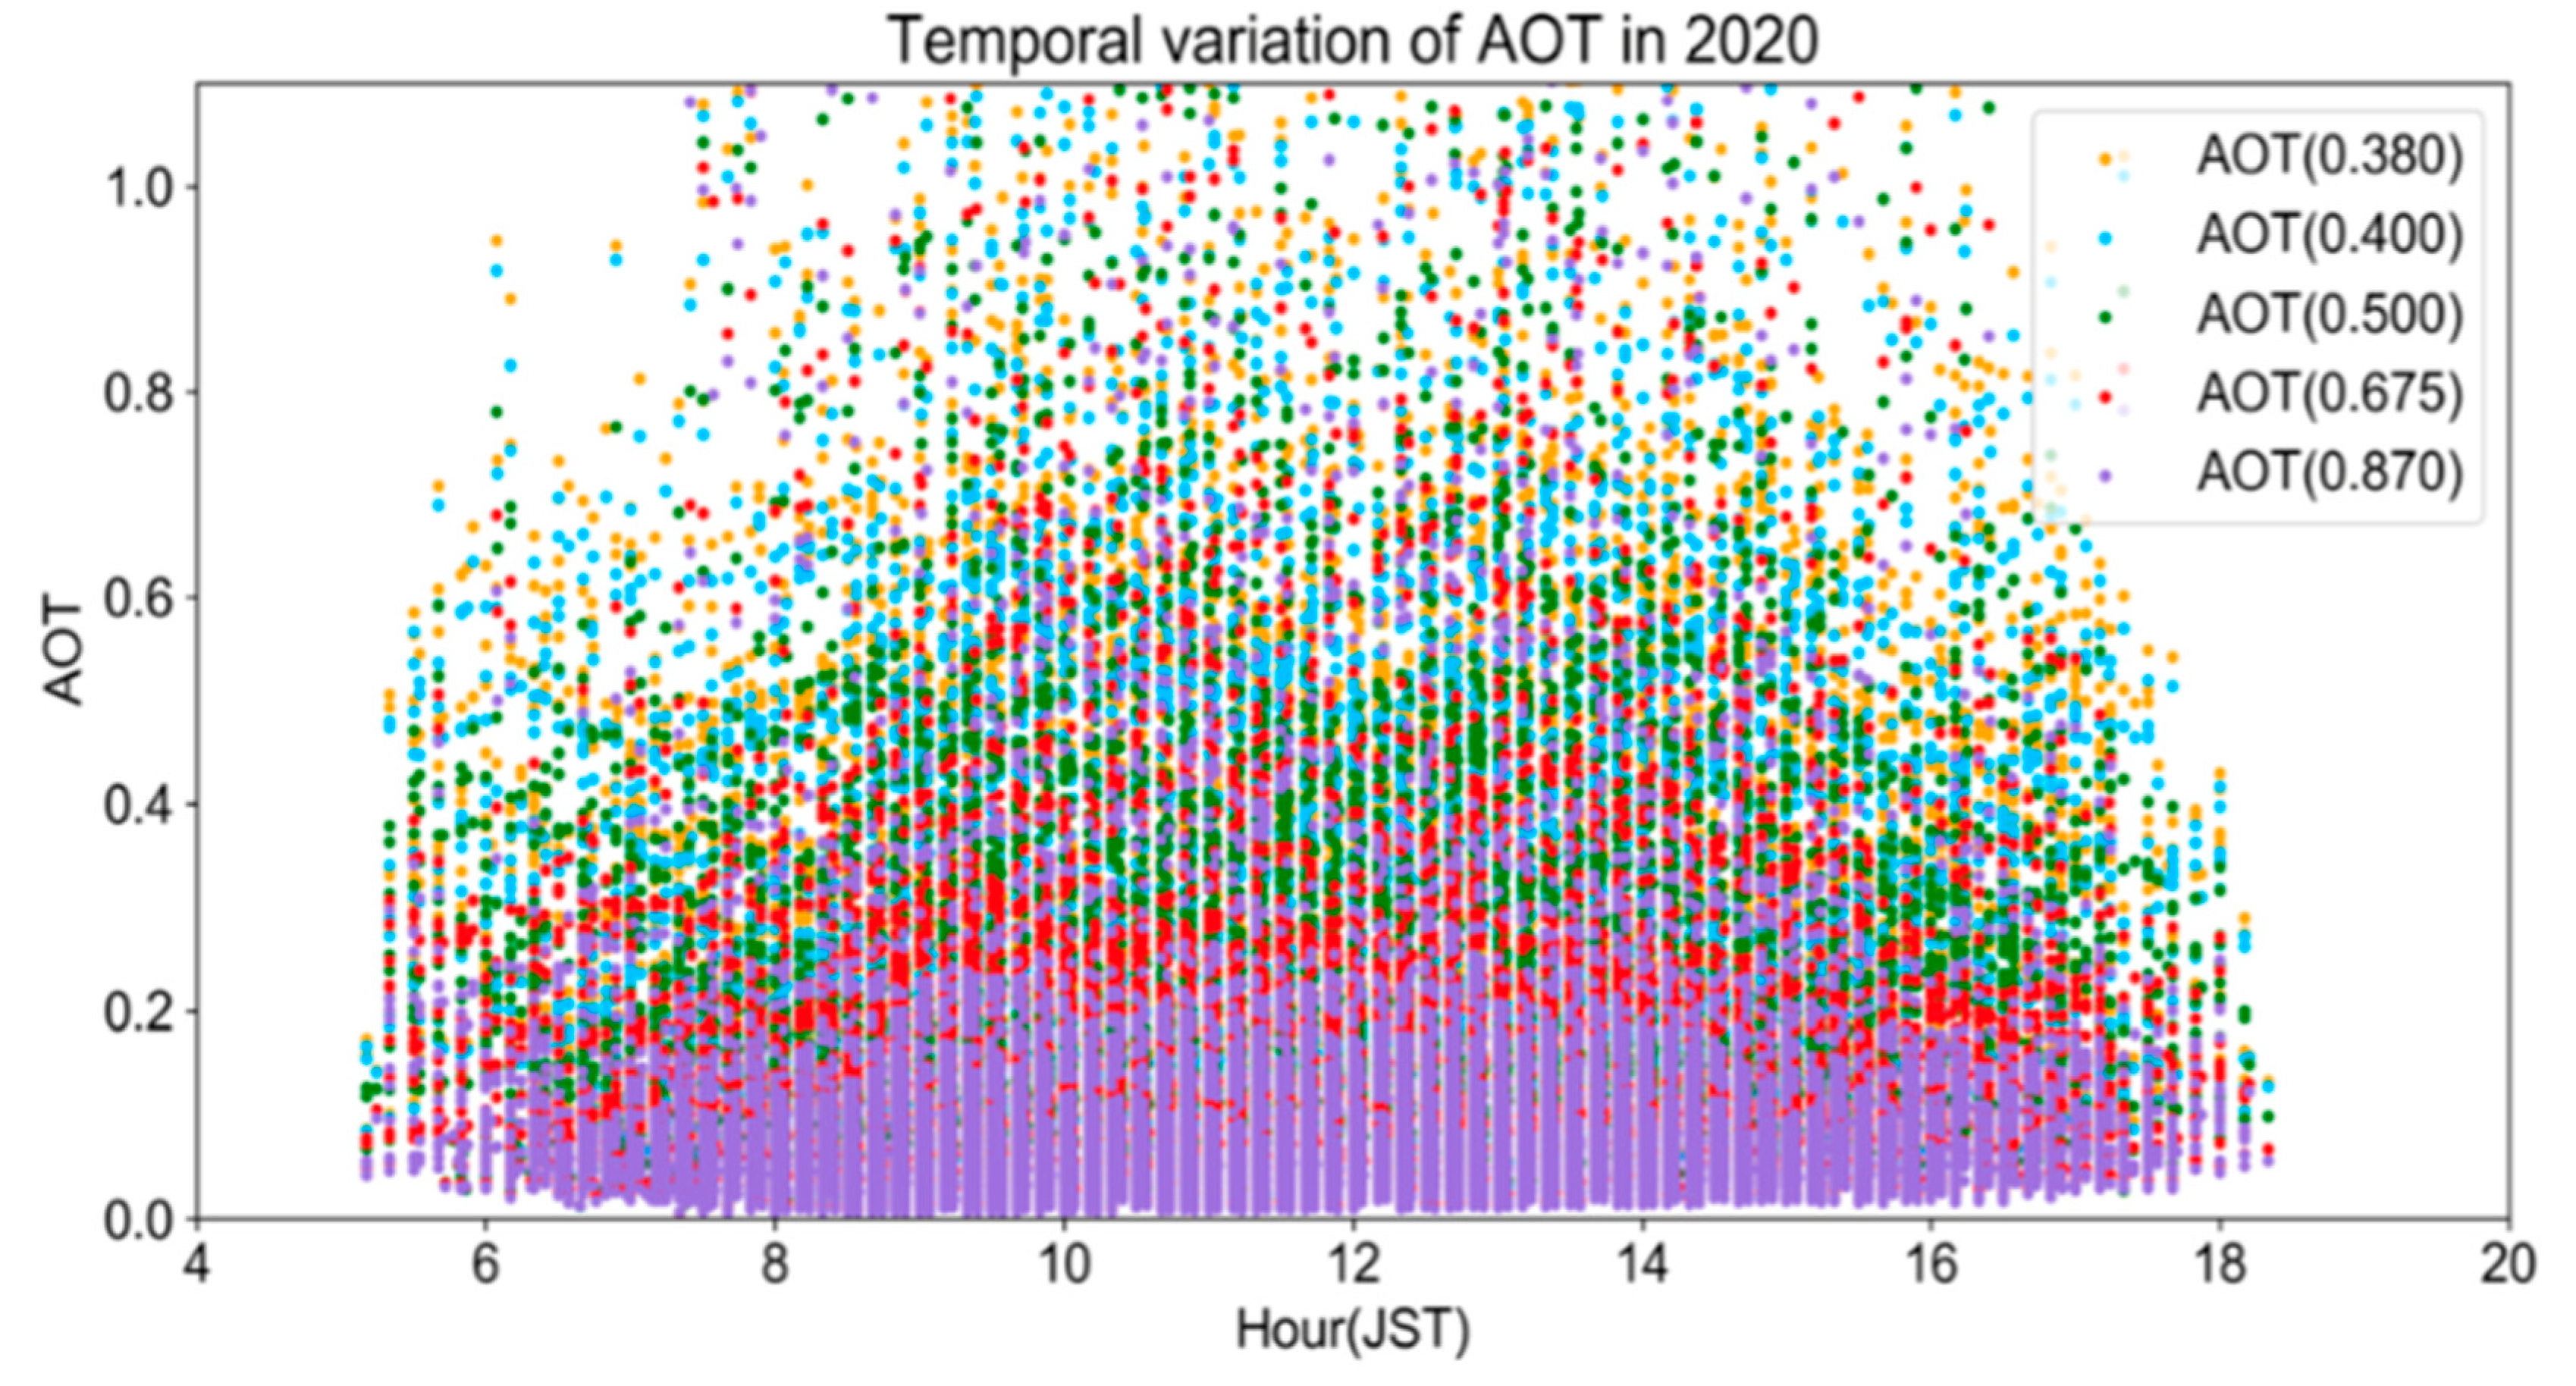
The data reported in this study are based on continuous observations using SKYNET data. SKYNET is a ground-based network of sky-radiometer that is used to retrieve direct solar irradiance and radiance, providing long-term and continuous datasets of spectral AOTs with low uncertainty (less than 0.02) in a global range [30,31]. It can carry out spectral measurements of spectral direct and diffuse intensities at predefined scattering angles and wavelengths. Figure 2 shows the sky-radiometer sites as recognized by the International SKYNET Committee (ISC). Users established regional sub-network groups in China, Europe, India, Japan, South Korea, Mongolia, and Southeast Asia for data analysis and formed the ISC to discuss international collaboration issues [13]. The SKYNET obtained solar direct radiance at seven standard wavelengths for 340, 380, 400, 500, 675, 870, and 1020 nm, which was processed by sky-radiometer (Model: POM-02) [32,33,34]. The con-current data from ground-based measurements are used in the analysis, namely the temporal variation of AOT from a sky-radiometer located at the rooftop of CEReS, Chiba University. In this study, the custom aerosol model is optimized with the help of sky-radiometer coupled with the satellite data. We mainly used AOT values and refractive index data with various standard wavelengths derived from sky-radiometer. The values of the AOT and Ångström exponent are determined for cloudless sky conditions during 15 h between 5:00 Japan Standard Time (JST) to 19:00 JST. (SKYNET data site: http://atmos3.cr.chiba-u.jp/skynet/data.html, accessed on 16 June 2021). As the advanced Himawari imager (AHI) sensor retrieved AOTs is at 550 nm, for unified comparison, SKYNET-based observations at 500 nm and 675 nm were used to estimate the AOT value at 550 nm based on the Ångström index equation [35].
2.3. Himawari-8 AHI
We used Himawari-8 image data to test the performance of the custom aerosol model. We described the analysis of spatiotemporal AOTs from multi-temporal images of the Himawari-8 geostationary meteorological satellite, which enabled us to better investigate the variability over a wide area. Himawari-8 is one of Japan’s new geostationary satellites that has been operated by the Japan Meteorological Agency (JMA) since July 2015 [36]. The Advanced Himawari Imager (AHI) sensor onboard Himawari-8 is superior to conventional imagers, as it has more visible and near-infrared wavelength bands, thereby enabling higher-dimensional terrestrial environment monitoring [37]. As a geostationary satellite, Himawari-8 records the surface and atmosphere of the earth at approximation 35,800 km high above the equator at around 140° E [38]. It also has a low spatial resolution of 500–2000 m but is capable of monitoring aerosol variations at the high temporal resolution of 2.5 min for the Japan area [39]. As compared with the observation from the low-Earth orbit such as MODIS, the advantage of Himawari-8 is the availability of much more frequent data, 10 min for the full disk [40]. The spectral response function (SRF) for the AHI sensor onboard this satellite, was used for the radiative transfer simulations.
In this study, we focused mainly on the daytime images of three visible bands centered at 0.47, 0.51, and 0.64 and applied the procedure of atmospheric correction on these bands to extract the information pertinent to the direct scattering of solar radiation from the land surface. Himawari-8 image data provided by CEReS was used. The CEReS data are generated by applying further geometric corrections to JMA data aiming at potential application to land surface observations, which require high geolocation accuracy [41,42,43]. Table 1 provides the relevant details on the used clear-sky test images from AHI observations.
2.4. Landsat-8 OLI
As auxiliary data, Landsat-8 Operational Land Imager (OLI) imagery was chosen for accuracy validation against the AOTs retrieved from the Himawari-8 AHI in this study. OLI is one of the sensors with multi-spectral bands onboard the Landsat-8 satellite, which was collected at a spatial resolution of 30 m with a reported circular positional error of 12 m [44]. In this study, cloudless OLI images of Landsat-8 visible bands from January to December in 2018, 2019, and 2020 were selected from the US Geological Survey (USGS: https://earthexplorer.usgs.gov/, accessed on 16 June 2021). The Himawari-8 satellite overpasses at 02:40 UTC, and the Landsat-8 satellite overpasses at 02:36 UTC. Assuming the local AOTs does not change significantly in a short period, the Landsat-8 OLI aerosol properties are used to validate the Himawari-8 AHI retrieved AOTs.
3. Materials and Methods
3.1. Custom Aerosol Model
The accuracy of AOTs retrieval depends on using the appropriate aerosol model. Moreover, the selection of the aerosol model directly affects the results of reference reflectance estimation. Since the location of Chiba city is along the Tokyo Bay, in the south part of the greater Tokyo metropolitan area, the aerosol property there is a mixture of urban and maritime aerosols [45]. Generally, northwest winds in the winter season cause the dominance of urban aerosols, whereas southwest winds in the summer season are that of sea salt particles. It is unacceptable to fix aerosol models from the empirical information for each observation case.
In this study, we employed the custom aerosol model for optimizing the matching result, which is defined by its size distribution functions (SDs), having its own complex refractive index dependent on wavelength and its own mono-modal lognormal size distribution. Major inputs optimized for the custom aerosol model are (i) spectral response functions (SPFs) of satellite visible bands, (ii) the real (mr) and imaginary (mi) part of the complex refractive index, (iii) aerosol volume size distribution, (iv) A list of radius from sky-radiometer (), and (v) A list of measurements from sky-radiometer for the radiuses as former (cm3/cm2/). In the custom aerosol model, the aerosol shape is assumed to be spherical, and the size distribution can be described by the lognormal model. Each component has a complex refractive index (real and imaginary parts may be wavelength dependent, but must be controlled by two parameters) and size distribution parameters (mode radius and width of the distribution). Although the actual aerosol mixture is usually more complex, the custom aerosol model forms a “quasi-complete” basis for aerosol parameterization, in that optical parameters of most aerosols, can be reasonably reproduced by linear combinations of the basis, even if the real situation of particle mixing is more complex.
3.2. Radiative Transfer Handled by 6S
Atmospheric aerosol remote sensing retrieval is conducted using the interrelationship between the observed atmospheric top radiance and surface reflectance. The estimation of the surface reflectance is one of the essential challenges in retrieving land aerosols from imagers. From the viewpoint of atmospheric studies, the precise knowledge of the surface albedo leads to the possibility of deriving the AOT distribution. The AOTs retrieval method developed in this study is based on a constructed look-up tables (LUTs) that calculated for plausible values of both AOTs and the surface reflectance for each of the AHI bands. For constructing LUTs, the surface reflectance at each wavelength is assumed to change between 0.05 (water body) and 0.6 (urban area), depending on the pixel location. In this study, the 6S radiative transfer model (Second Simulation of the Satellite Signal in the Solar Spectrum), which is based on the estimation of aerosol models for the boundary layer and the atmosphere radiation transmission process during the Sun–Ground–Sensor, was selected [46]. It is used with a spectral resolution of 2.5 nm, which can greatly improve the calculation accuracy of scattered aerosols and molecules, and radiation absorption characteristics [47]. The advantage of using the 6S model is its ability to estimate direct and diffuse components using a limited number of inputs for any spectral band within the entire solar domain [48].
Figure 3 illustrates radiance components required in the process of radiative transmission schematically. Among the four components, three components (direct reflection , indirect reflection , and path-radiance involving the surface scattering) are dependent on the surface albedo values, while the stands for the path radiance that is dependent only on the atmospheric conditions.
The major output from the 6S calculation is the total radiance, which can be expressed as:
Then,
where and represent the radiance reflected from the surface pixel directly and indirectly, respectively; refers to the path radiance due to multiple scattering; is the path radiance due to single scattering; is the path radiance from the single and multiple scattering in the atmosphere; and are the reflectance of the target pixel and the average reflectance around it. The values of, , and can be estimated from the 6S simulation. For each band, pixel-by-pixel values of the observed radiance can be calculated from the digital number (DN) values. In the present analysis, we omitted the consideration of the adjacency effect (= ). The components and do not depend on the ground reflectivity, and are determined solely by the atmospheric scattering. Thus, we have = +. In the calculation of using Equation (2), the reflectance dependence of each radiance component is determined by atmospheric conditions, the optical thickness at 550 nm, , and the aerosol model specified for the 6S calculation. The aerosol model determines the wavelength dependence of the aerosol extinction.
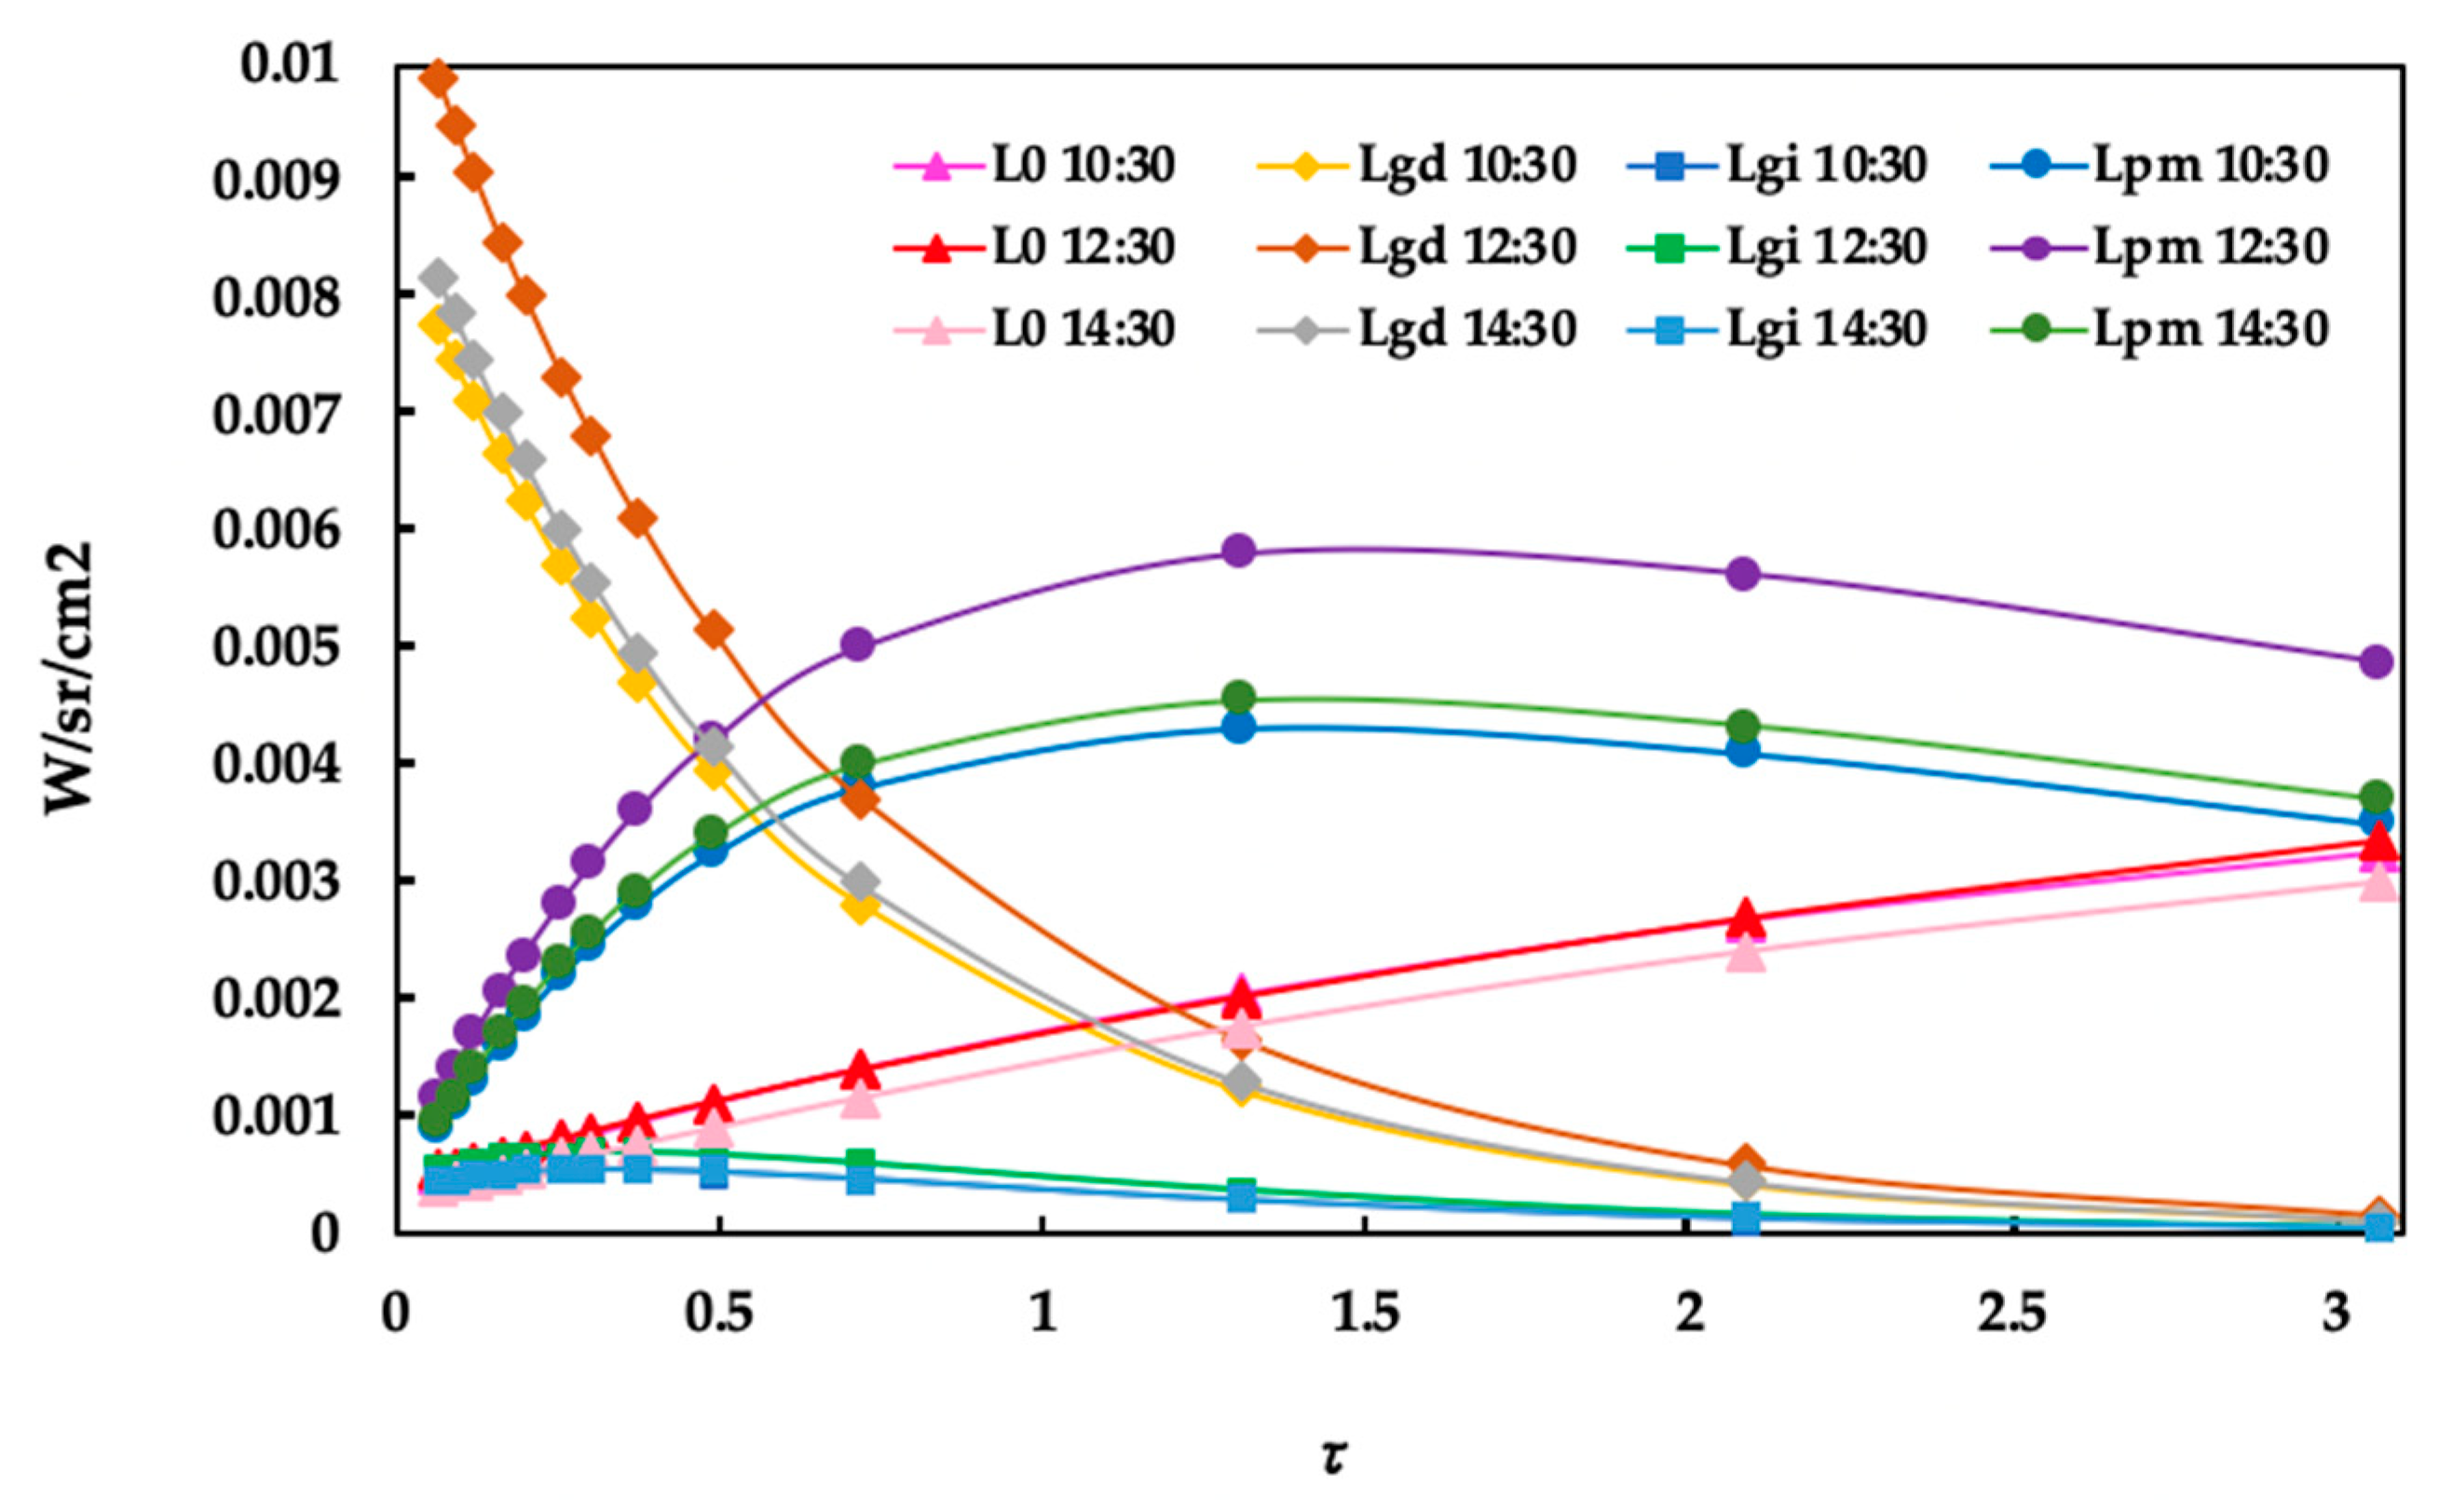
Figure 4 shows the various period results of the radiance components estimated from the 6S simulation, where surface reflectance is unity and ground reflected radiance is the dominant component of total radiance. The parameters required for the 6S radiative transfer code mainly include geometric parameters for the sun and satellite sensor, atmospheric model, aerosol type, solar angles, and aerosol optical thickness at 550 nm (Table 2). Both the sun zenith and sun azimuth are determined according to the selected Himawari-8 AHI data, and the specific values are shown in Table 1. The AOTs at 550 nm is widely used to describe the aerosol loading based on physical estimation [49]. As for the atmospheric model needed for the evaluation of Rayleigh scattering, we used the mid-latitude summer model between July and October, and the mid-latitude winter model during the other season. Auxiliary input parameters are the time and day of the year as well as the observation geometry, namely, the altitude of the observer, and latitude/longitude of the surface area. The AOT values for each wavelength provided from the sky-radiometer data at the time of satellite observation.
The Himawari-8 AHI acquisition date determines the atmospheric model, the Mid-Latitude Summer model covers July to October, and the Mid-Latitude Winter model during other seasons. The built-in aerosol models in the 6S radiative transfer model include custom, rural, maritime, and urban aerosol models. The AOTs were set to 0~1.0 for the 6S simulation, and the interval was 0.1. The first value was set to 0.1, because the 6S radiative transfer model calls an error when the AOT is 0, so it was modified to approximately 0. Under the cloudless sky, the AOT is generally below 1.0, and when the aerosol loading is small, satellite observations are mainly derived from surface reflectance. Therefore, it is crucial to determine the surface reflectance accurately to obtain high-quality aerosol properties from satellite observations.
Observed radiance can be further classified into the following three categories. (1): components scattered only in the atmosphere (, ), (2): component reflected around the target (’), and (3): component reflected around the target area (, , ’), respectively.
where indicates filter function, is solar irradiance at the top of the atmosphere. , and represent diffuse transmittance, transmittance and transmittance of gas molecule absorption respectively.denotes spherical albedo. and demonstrate ground surface reflectance and atmospheric reflectance. is wavelength and is zenith angel. Atmospheric correction parameters are formulated as follow:
where indicates input reflectance of 6S before correction. demonstrates apparent reflectance after correction.
3.3. Process of AOT Retrieval
We selected the clear-day image observed on a day with small aerosol loading for the determination of the pixel reflectance in the Chiba area. The present observations using the SKYNET have been carried out on cloud-free days. Thus, the observed aerosol quality does not necessarily represent the “typical” seasonal features of aerosol particles in the region, especially during the rainy season from June to July in Chiba. Nevertheless, the analysis of such a dataset is meaningful for obtaining basic reference of surface reflectance under clear-sky conditions, just as found in the cloud-free images from satellite observations. Here, we only selected the data with > 0.06, since very small aerosol loading leads to large uncertainties in the determination of these aerosol optical parameters. When the value of AOT is small (0.06 < < 0.1), the 6S simulation yields a well-defined relation between and . Thus, a reasonable distribution of (i.e., a surface albedo map) can be determined from the condition of =. To take the possible change of the
distribution into account we prepared such a clear image for each season. Then, we constructed a LUT to retrieve the AOTs for each pixel based on the pixel reflectance distribution. For each visible band, the pair of (, ) is calculated from DN pixel-by-pixel and stored in a LUT. The optical thickness can be specified by the AOT at 550 nm (), since the aerosol model dictates the dependence on the wavelength. This simulation is conducted by the 6S code, the range of being varied from 0 to 1 with a step of 0.1. In the application of the LUT, interpolation with a resolution of 0.01 is undertaken for . The value of AOTs can be obtained from the sky-radiometer data, together with the custom aerosol model (i.e., the wavelength dependence of AOT) for each test image. The application of a similar procedure to Landsat-8 imagery will be useful for investigating how the pixel size affects the accuracy of the atmospheric correction. Furthermore, the availability of Himawari-8 images every 10 min enables the study of bi-directional reflectance distribution function (BRDF) for the urban environment.
4. Results
4.1. Look Up Tables
Figure 5 represents the results with custom aerosol size distribution models, and the comparison among , , and obtained from the 6S simulation. The geometry is for the image of the Chiba area observed on 6 January 2020, when the aerosol loading was relatively small ( = 0.1 at 550 nm). The upper panels show the relationship between the apparent reflectance () and the surface reflectance () for various values of AOTs at 550 nm (). The lower panels, on the other hand, show the relation between the surface reflectance and AOT at 550 nm for various values of apparent reflectance. In general, - relationship changes with the wavelength. Here the result is shown only for Himawari-8 band 1. The sky-radiometer data observed at CEReS is used to constraint the aerosol model through the wavelength dependence of AOTs, and this study assumes a custom aerosol model can be applied to the whole Kanto area based on surface albedo under clear-sky conditions.
An important aspect found in Figure 5 is that the difference among aerosol models appears in the region of large optical thickness. When is small, on the contrary, it is possible to retrieve the value of target albedo that is more or less independent of the aerosol model. For the clear-sky condition (no cloud), the main contribution to the AOTs comes from the lower troposphere, especially from the boundary layer. The result is that custom aerosol models depend less on the aerosol model when is low, which indicates our method maintained low uncertainty in most cases. Under such a condition, the assumption that a value of the AOT measured by a sky-radiometer at a certain location within a satellite image represents the area is considered to be reasonable. This assumption is used here to derive the distribution of the surface albedo . Hereafter, this albedo distribution will be referred to as the “ map”. In this manner, the process of atmospheric correction is accomplished. As also inferred from Figure 5, the accuracy of can be estimated from the accuracy of . As demonstrate from LUTs, more or less similar values of the surface albedo can be obtained regardless of the type of aerosol model assumed in the atmospheric correction process.
4.2. Reference of Surface Albedo
In general, the surface albedo is a key parameter for satellite AOT retrievals. It is used to differentiate between signals from aerosols and the land surface. Kaufman et al. [50] found that an error of 0.01 of the surface albedo will lead to an AOT error of ~0.1. In this study, the surface reflectance was calculated using the minimum albedo over each season and the 6S radiative transfer code. The cloud shadows and terrain can lead to incorrect values of the minimum reflectance and can ultimately impact the retrieved AOT accuracy, so we chose clear-sky condition data for the test. For each pixel, we assumed the surface albedo value given in the map obtained from the clear-day image: thus, the AOT for that pixel can be determined from the pixel DN value using the LUT for custom aerosol model. The radiance observed by a satellite sensor is given as a digital number (DN), e.g., a value between 0 and 255 in the case of an 8-bit sensor. This study defined as a function of the DN, which, in turn, is related to the target albedo and the optical thickness :
where the function is determined from the sensor calibration, and the function g is given once the geometry of the satellite observation and the aerosol model is specified. Since the albedo of the surface is the key parameter in the AOTs retrieval, its accuracy directly affects the accuracy of the AOT distribution. We used the measurement of surface albedo under the clear-sky conditions as the reference, the minimum average DN for each pixel from Himawari-8 band 1 images (during 2018 to 2020) are shown in Figure 6. Seasonal variations are clearly seen for DN-pixel estimation. The curves are calculated for between 20 to 120, which define the dominant DN range in the Himawari-8 band 1 images. The value below 50 illustrates sea area, on the other hand, 50 to 120 indicates land area. It can be seen that the surface albedo value in the sea area is about ±0.005 and the accuracy is ±10% in the ratio, and the surface albedo value in the land area is about ±0.01 and the accuracy is ±5% in the ratio. When the value of is small, a unique value of the surface albedo can be determined regardless of the choice of the aerosol model.
The surface albedo “ map” is used to evaluate the AOT distribution from the satellite image observed on a relatively turbid day in the same season as the clear day. This map is used as a reference to retrieve the AOT distribution in the same season. We used the clear-day image observed on a day with small aerosol loading for the determination of the pixel reflectance in the Kanto area (34.75–36.50° N, 139.5–141.0° E). The functional relationship shown in LUT is used to obtain the value of from the known values of and in this case. The resulting distribution of the AOTs will be referred to as the “ map”. In band 1, the dominant range of is between 0.1 and 0.2, and these small values are mainly located in both the sea area in Tokyo Bay and inland. Pixels with high values surround Tokyo Bay, including the artificial island (named Sea Firefly) on the east side of the bay. A region with high is also found in the sea area, presumably indicating the presence of haze. In order to avoid such an effect of local weather conditions, it is desirable to employ a number of images obtained on different days to construct the map.
A comparison of images from the different aerosol models are shown in Figure 7. In the case of < 0.06, high albedo values are observed in both rural and custom models. When ≥ 0.06, low albedo values are observed in those three aerosol models. If no irregularities in the data are responsible for these low albedo values, the most plausible cause would be the local weather. The urban aerosol model is different from the other three models. This is ascribable to the larger absorption coefficient incorporated in the urban model than in other models. For example, when the relative humidity is less than 70%, the single scattering albedo is 0.64 at 550 nm for the urban model, whereas it is about 0.9 for the rural, maritime, and custom models.
4.3. Spatiotemporal Analysis and Characteristics of AOT Distribution
AOTs is defined as the integrated extinction coefficient of a suspended aerosol over the atmospheric vertical column; thus, AOTs can represent the concentration of aerosol particles and reflect the degree of air pollution indirectly [51]. Based on the obtained AOT retrievals, the spatiotemporal analysis of AOTs in the Chiba area was carried out in this study. The seasonal average AOTs in Chiba was calculated per pixel as shown in Figure 8 (the locations of CEReS are indicated by dots). In order to derive the distribution of AOTs, we chose images that are mostly free from the effect of clouds, but considerably affected by aerosols. For each pixel, the determination of is straightforward, since the LUTs calculated as mentioned above can be used to derive from each pixel using the corresponding DN (from the satellite data) and (from the image) values. The aerosol distribution map ( map) is constructed from the image observed on January 6, 2020. The Himawari-8 satellite images covering the region of Chiba were selected from 2020 for AOT retrieval with the combination of the custom aerosol model. Based on the spring (March, April, and May); summer (June, July, and August); autumn (September, October, and November); winter (December, January, and February), panels (a) to (d) illustrate the AOT distributions retrieved over the Chiba area from Himawari-8 visible images (band 1), assuming aerosol model as custom and geometrical condition for around 10:30 JST.
For the AOTs of the Chiba area in the seasons, it showed relatively high distribution in the north and west, low spatial distribution in the south and east, especially in the spring and summer. The seasonal variation of the retrieved parameters indicates the major impacts of dust particles in spring, sea salt particles in summer, and anthropogenic fine particles in winter. The results indicated that our method could simultaneously invert the spatial distribution of aerosols in the dark-pixel and bright-surface areas, with satisfying continuity. The aerosol model employed for this study is the custom. Since the relationship among the parameters varies according to the model, the value of changes even if the same pair of the input parameter (,) is used. The result of AOT distribution seasonal changes is shown in Figure 8, in which the value of is mapped in a range of 0 and 0.4. The optical thickness over most parts of the sea area in Tokyo Bay is found to be 0.2 or smaller.
The comparison of values of AOTs retrieved at 550 nm is shown in Figure 8 for pixels over both the Chiba city area and Tokyo Bay area. The AOT from Himawari-8 varies in the range 0.1~0.3 under relatively clear-sky conditions. The concurrent values from the sky-radiometer observation are < 0.2in January and <0.3 in July. To illustrate the performance on a hazy day, we used a retrieval result obtained over the Chiba area on 2 July 2020 as an example, which is shown in panel (c). The spatial trends of the Himawari-8 AHI, and sky-radiometer results exhibit good consistency. Low AOT values of less than 0.2 are found from December to January. In these winter months, relative humidity (RH) is relatively low in the daytime (on average, RH ¼ 34%) under stable, clear weather conditions. From February to April, AOT gradually increases, and values up to 0.2~0.3 last until September or October. High values of the Ångström exponent of 1.2 to 1.8 are observed during October and February from the sky-radiometer, while smaller values less than 1.0 are observed from March to May, and from July to August. The AOT values at both visible bands under hazy conditions are higher than those on a clean day. Asian dust and sea-salt particles (both are mostly coarse-mode particles) are aerosols that could give rise to such small values of Ångström exponent. Low values of Ångström exponent in spring months (March–May) are presumably ascribed to Asian dust particles [52]. In fact, a number of Asian-dust events in the spring period have been reported. For the summer months (July–August), sea-salt particles are considered influential to aerosol properties because of the westerly/southwesterly winds from the direction of Tokyo Bay. Regions with low AOTs appeared in the west of the south. Southern Chiba has sparse population densities, high degrees of urban greening, and relatively few factories. On the contrary, the relatively high value of ~0.2 appeared in the westmost region of Chiba (Tokyo), with the high concentrations of population and business activities. In the urban center area, the average AOTs was always relatively small, which may be because large factories such as power and chemical plants that can produce substantial amounts of pollutants are not located in the city center but on the edge of the city suburbs, and the observation time of the Himawari-8 AHI is 10:30 local time (JST). At this time, a considerable period passed since the peak period of work (around 09:00 JST). Under sunny and stable weather conditions, the pollutant gases mixtures with some particulate matters released by automobiles are influenced by heat force and vertical mixing as the temperature increases, resulting in aerosols that are easy to diffuse. Moreover, the areas with high AOTs in an urban city may be due to a large amount of solid dust produced by the local calcium carbonate plant during mining processes entering the atmosphere and combining with water molecules to form aerosol particles.
The wind direction is also one of the important factors for AOTs loading, especially in winter and summer. Major winds come from the northwest direction in winter and southwest direction in summer, transporting aerosols from Tokyo Bay. The AOT values of Tokyo Bay are lower than Chiba City, especially in winter. Northwest winds in winter generally cause the dominance of urban aerosols, and southwest winds in summer are that of sea salt particles. The seasonal variation of the retrieved AOTs indicates the major impacts of sea salt particles in summer, fine anthropogenic particles, and dust particles in winter. Furthermore, the seasonal trend is related to wind directions based on the whole year’s observation over the Chiba area. This study has examined the wavelength dependence of AOTs and found the applicability of a custom aerosol model for each season, especially the case of turbid days in summer. The choice of the image is relatively rare because of the rainy season, the number of cloudless satellite data is limited from mid-June to late-July. The seasonal variation of the retrieved parameters indicated the major impacts of dust particles in spring, sea salt particles in summer, and anthropogenic fine particles in winter.
Figure 9 shows the histograms of the distribution for Himawari-8 band 1. Aerosol models are rural, maritime, urban, and custom. The resolution of is 0.1 in the simulation. The average value of pixels in CEReS was 0.387 for the custom model, 0.365 for the maritime model, 0.354 for the rural model, and exceeded 1 for the urban model. The distribution turns out to be more compact for the urban model than for the other aerosol models (Figure 7 and Figure 9). We reconciled different passive remote sensing points of view and found that the AOT results observed under the urban model are larger than the values of the maritime model and rural model, which indicates that the urban model is not suitable for analyzing aerosol over the Chiba area. The result over the sea area is of course not free from the effect of the wind, since the albedo is dependent on the wind speed. The AOTs is somewhat larger along the seashore. The value of is under-estimated due to the presence of haze in the lower left part of Figure 9. On the artificial island, this study obtains > 0.2 because of the large . High values are also found in the urban area (near the center in Figure 9) for all aerosol models. The distribution, however, is not necessarily correlated with the map. In the vegetation areas inland, aerosol loading is relatively small, though the albedo values are similar to those in the sea region. It is possible that the aerosol model may change locally. During the winter season, the northwest wind prevails due to the pressure pattern (high in the west and low in the east), leading to the relative dominance of the inland (polluted) aerosols rather than the maritime aerosols.
5. Discussion
5.1. Accuracy Validation
To evaluate the performance of the custom aerosol model, the Himawari-8 AHI retrieved AOTs were validated against conventionally-used typical aerosol models in the Chiba area. For further comparison, the AOTs derived from Himawari-8 were also compared with the SKYNET observation data. The absolute errors created from the conventionally-used typical aerosol models, using the difference in albedo values from the custom aerosol model (right axis) and the relative error (left axis) for each digital number as indicated in Figure 10. Error and relative error are calculated by Equations (10) and (11):
For this part of the study, the custom aerosol model was used to calculate the error for comparison purposes. Figure 10 also clearly illustrates that the AOTs error increases as the DN value increases. In inland areas (DN > 50), the error between rural and maritime aerosol models may exceed 0.01~0.03. When the relative values for the error of the AOTs is small (<0.005), the absolute values for the error of the derived AOTs is always below 0.1. There is almost no difference in the relative errors from the rural and maritime aerosol models, and it seems that there is no effect. On the contrary, the relative error has a significant impact on the AOTs’ accuracy when DN is less than 50 (sea area). In this case (DN < 50), both rural and maritime aerosol model can lead to relative errors >10% or >70% for derived AOTs. As can be seen from the functional relationship between the ground surface albedo and the optical thickness in LUTs, the dependence on the aerosol model is insignificant when is low. High uncertainties were found for the conventionally-used typical aerosol models as shown in Figure 10, in contrast, the custom aerosol model is characterized by a small single scattering albedo (strong absorption) and SPFs, which yielded an error with much less bias. The errors of AOT retrieved are found to be stable than conventionally-used typical aerosol models, indicating that our method has achieved good performance.
Custom aerosol model-based AOT retrievals are comparable to SKYNET observation data as the ground truth (Figure 11). There is a good agreement between the AOT distributions from the coupled analysis of yearly mean values estimated from sky-radiometer and retrievals of Himawari-8 (0.1~0.3). Figure 12 shows the temporal variation of AOTs observed with the sky-radiometer from 2018 to 2020. Especially when the sun altitude is low, the temporal change of the AOT values provided the satisfying matches to the sky-radiometer. The similar behavior to the sky-radiometer, suggesting that there is a qualitative agreement between AOTs generated from the custom aerosol model-based method. The difference from the urban model is more significant than that of the rural and maritime models, but it is about 0.01 to 0.02 corresponding to the sea area and land area (Figure 7). Thus, the overall agreement between the results of the ground-based measurements is satisfactory with the values estimated from Himawari-8 AHI, especially under custom, rural, and maritime aerosol models with AOT < 0.4 in the Chiba area. Those results proved the feasibility of retrieving AOTs based on SKYNET observations.
Aerosol particles change rapidly under the influence of meteorological conditions, especially wind speed, humidity, and air temperature [53]. Aerosol loading is very small in winter due to the formation of the nocturnal boundary layer. Thus, at the surface level, high-level air pollution is often reported in winter, including the influence of PM2.5 from anthropogenic emission sources. In spring, higher wind speeds often result in a more turbid atmosphere near the surface area. As shown in Figure 8, higher aerosol loading occurs in summer and autumn. The effect of the hygroscopic growth of aerosol particles is effective in summer because of the high RH. The opposite tendency prevails in spring and winter. Small values of the Ångström exponent (ranging from 0.5 to 1.0) are also observed from March to April, under the influence of Asian dust. In general, close relations can be found between the Ångström exponent and wind system. The relative importance of the transported particles changes in accordance with the wind speed and large values of the Ångström exponent is often associated with fine-mode particles from local, anthropogenic aerosol sources. Wind direction is also influential. The south wind from Tokyo Bay leads to the prevalence of large size, sea salt particles. Relatively small values of the Ångström exponent are observed when the strong wind from the southwest direction transports sea-salt particles. In the 6S radiative transfer simulation, such influence of thin cirrus must be removed to properly evaluate the influence of aerosol particles in the lower troposphere. The continuous estimation of AOTs near the surface is considered to be useful for studying sources and sinks of aerosol particles in relation to the monitoring of the local environment.
5.2. A Case Analysis of Landsat-8 OLI
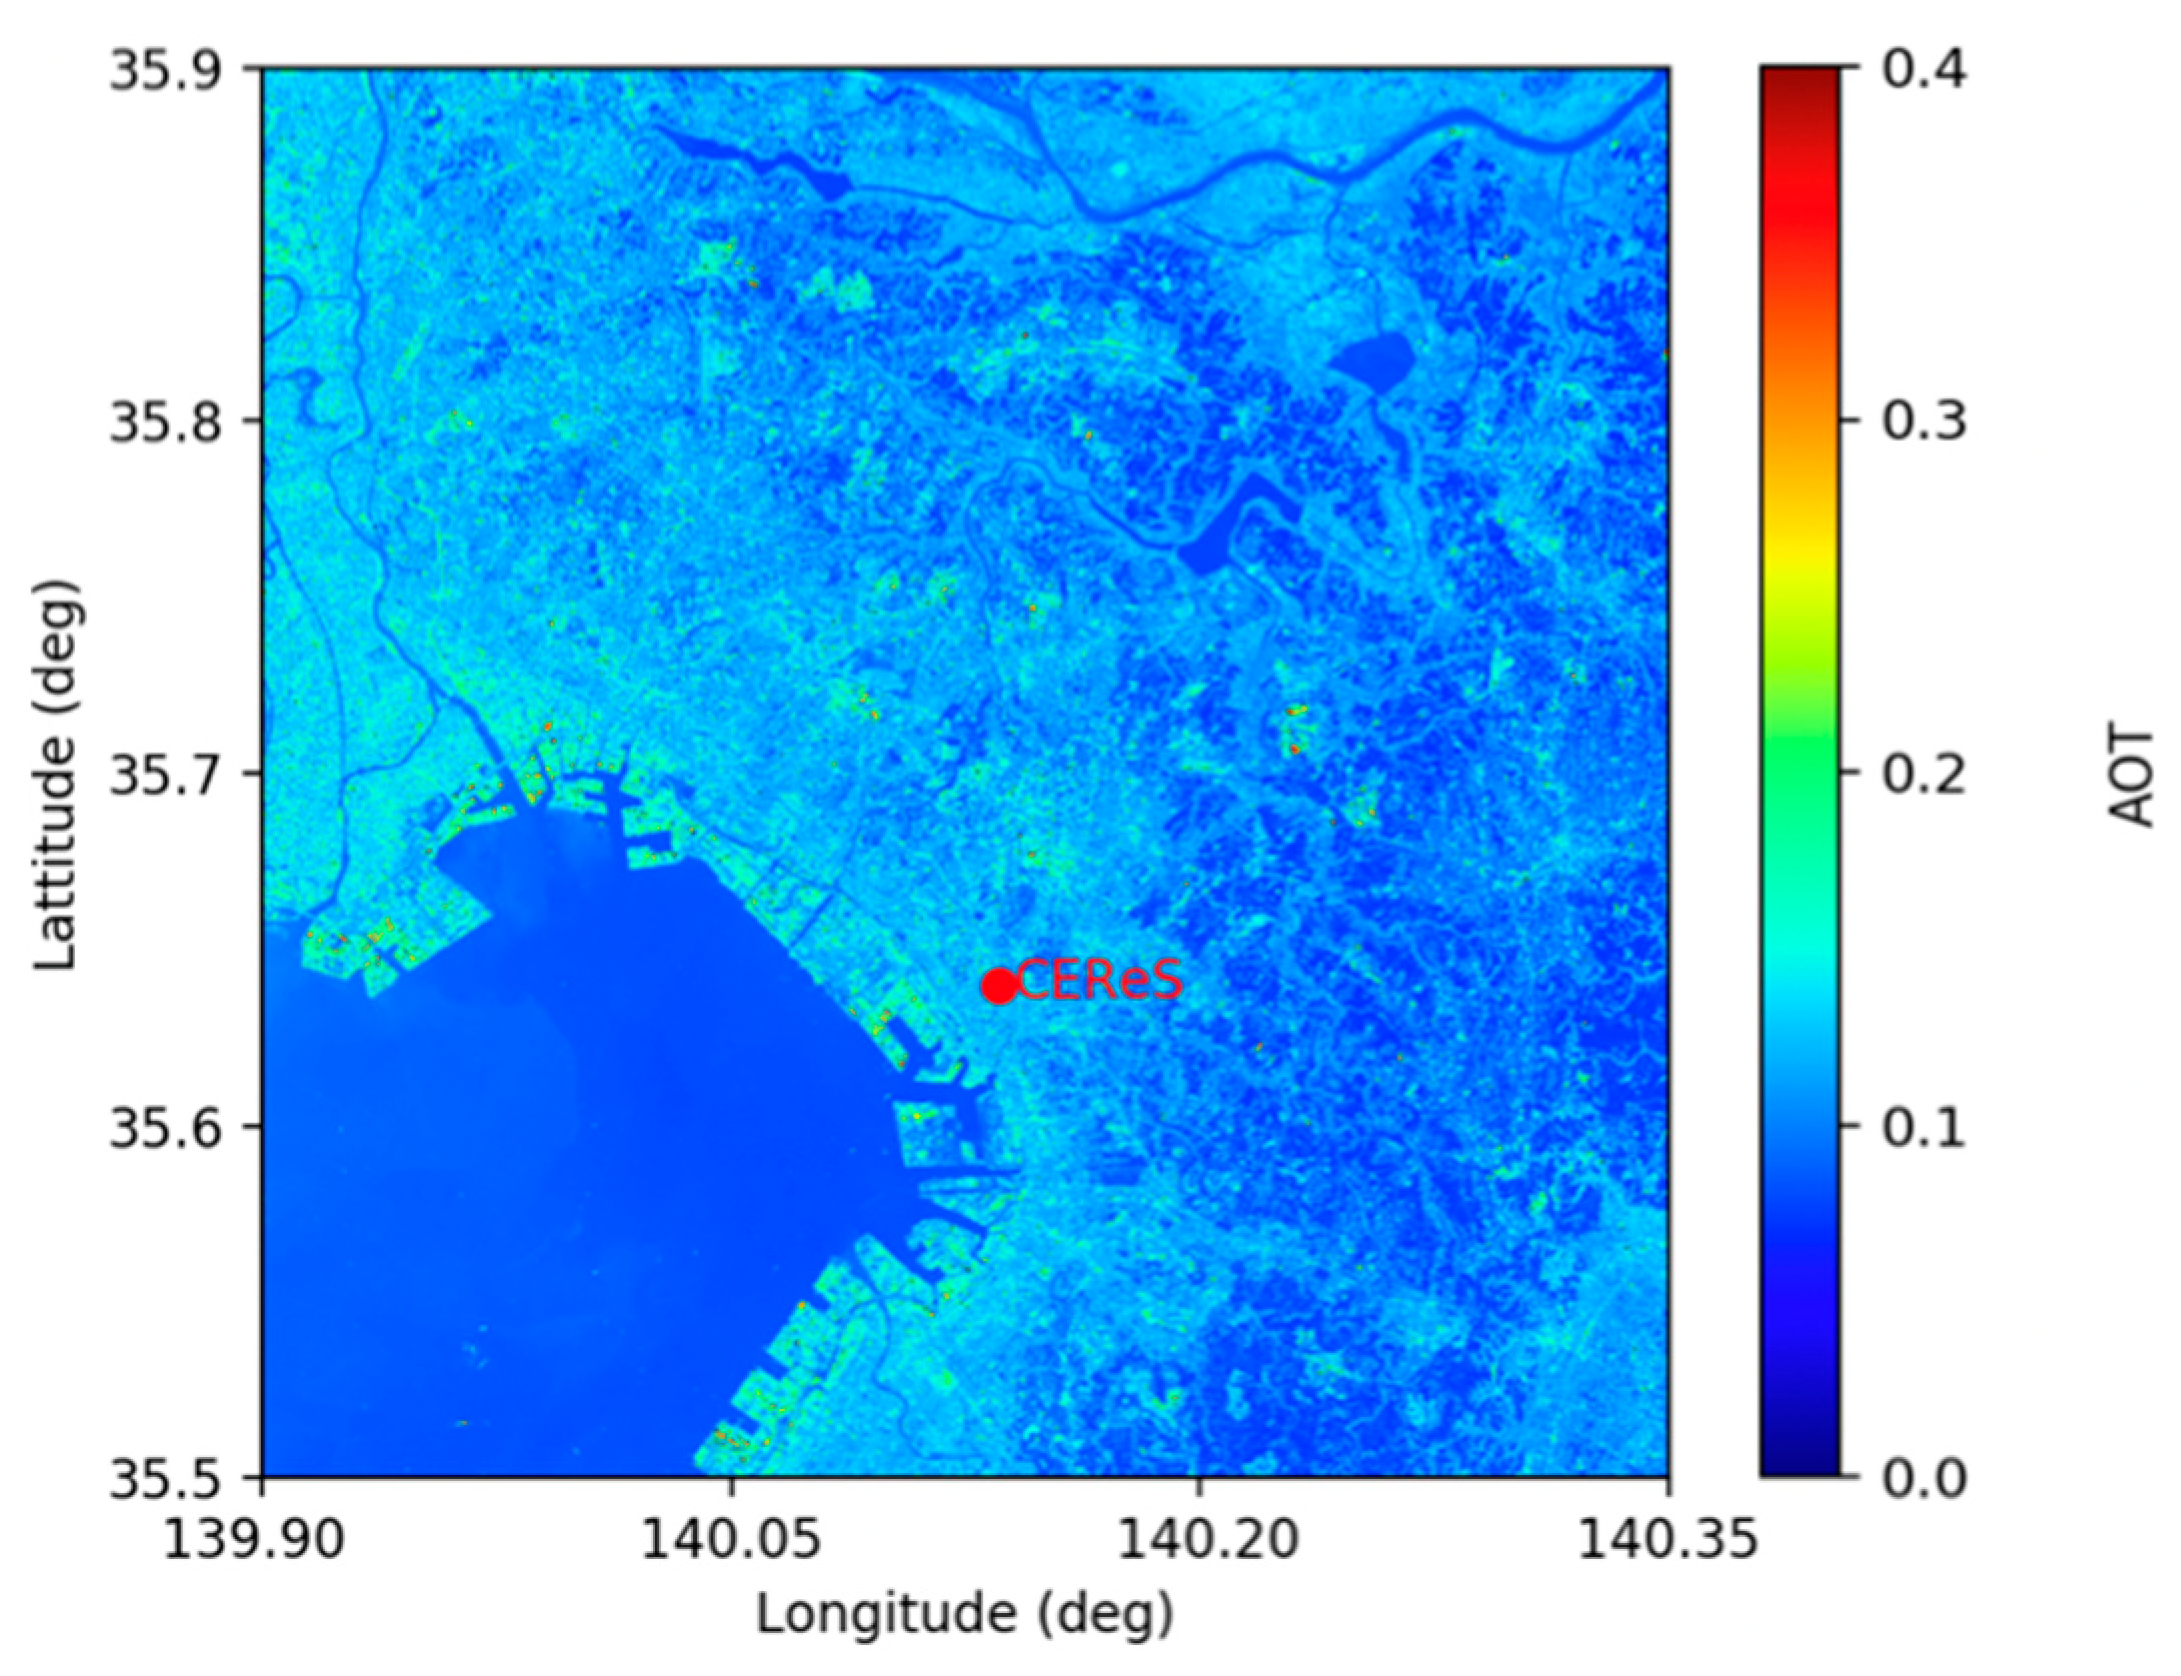
In this study, the combination of the ground-based and satellite-based measurements for the Landsat-8 OLI was tested. The AOTs retrieved from the Landsat-8 OLI at a medium-high spatial resolution of 30 m can provide a more detailed aerosol spatial distribution. The retrieved AOTs using custom aerosol model had good consistencies, Figure 13 shows a tentative result of AOT distributions for the visible images from Landsat-8 OLI visible bands observed on 6 January 2020.
Although the availability of clear-sky images from Landsat-8 is limited because of its long revisit time (16 days) [54,55], the fine resolution of its imagery (30 m per pixel) will be useful for dealing with the mixel (mixed pixel) problem inevitable for Himawari-8 imagery. The AOTs from Landsat-8 band 2 (482 nm) varies in the range 0.1~0.2, which reasonably agrees with the result found for Himawari-8 band 1 (470 nm). To reduce the error caused by the differences in spatial resolution between the aerosol products and retrieved AOTs, the retrieved AOTs with a spatial resolution of 30 m were resampled to 3 km, and the validations were matched spatially and temporally. Overall, the AOTs retrieved from the Landsat-8 OLI data can validate characteristics of aerosol distributions and better analyze the effects on AOTs of the meteorological conditions and other pollution sources. Therefore, the method proposed in this study can not only take advantage of the high retrieval accuracy of the Himawari-8 AHI, but also various satellite sensors.
6. Conclusions
In this study, we described the custom aerosol model for the extraction of the AOT distributions around the Chiba area from sky-radiometer with sufficient accuracy. We retrieved the spatiotemporal distribution of AOT with both SKYNET-based and satellite-based measurements, successfully examined the wavelength dependence of AOTs, and found the applicability of a custom aerosol model from the case studies in the Chiba area. The main conclusions were as follows:
- The AOT values in the Chiba area tend to be large (about 0.3) in spring due to the influence of yellow sand and air pollutants flying from the continent, and small (0.2 or less) in winter, matching the ground observation values. In this way, it was found that the optical characteristics of the surface albedo are considered to be an accurate reference to retrieve AOTs.
- The sky-radiometer data observed at CEReS is used to constraint the aerosol model through the wavelength dependence of AOTs, and we assumed custom aerosol model can be applied to the whole Kanto area based on surface albedo under clear-sky conditions. Additionally, the reference of surface albedo generated from clear-sky conditions can be employed to retrieve the spatial distribution of AOTs not only on clear but also relatively turbid days.
- The method proposed in this study can be used to establish a good reference for the analysis of various visible satellite images such as Himawari-8/AHI or Landsat-8/OLI to evaluate the AOT distribution over the Chiba area and potentially over similar urban areas.
- The versatility and reliability of the SKYNET-based measurement have provided information valuable for radiation studies, including the validation of satellite data. The validation results indicate that the proposed method can effectively generate reliable AOT distribution results.
We demonstrated how the ground-based remote sensing network with the custom aerosol model can be exploited for the detailed study of AOT distributions via high-temporal resolution imagery from satellite images. Although there is still room for improvement under thick cloud conditions, the SKYNET-based measurement with the custom aerosol model can lead to acceptable results.
Author Contributions
Conceptualization, Z.X., H.K. and H.I.; methodology, Z.X., H.K. and H.I.; software, Z.X.; validation, Z.X., H.K. and H.I.; formal analysis, Z.X., H.K. and H.I.; investigation, Z.X., H.K. and H.I.; resources, H.I.; data curation H.I.; writing—original draft preparation, Z.X.; writing—review and editing, Z.X., H.K. and H.I.; visualization, Z.X.; supervision, H.K. and H.I.; project administration, H.K. and H.I.; funding acquisition, H.I. All authors have read and agreed to the published version of the manuscript.
Funding
This research was supported by the Environment Research and Technology Development Fund (JPMEERF20192001 and JPMEERF20215005) of the Environmental Restoration and Conservation Agency of Japan, JSPS KAKENHI (grant numbers JP19H04235, JP20H04320, and JP21K12227), and the JAXA 2nd research announcement on the Earth Observations (grant number 19RT000351).
Institutional Review Board Statement
Not applicable.
Informed Consent Statement
Not applicable.
Data Availability Statement
The SKYNET observation data used in this study can be obtained from the SKYNET website, http://atmos3.cr.chiba-u.jp/skynet/data.html (accessed on 16 June 2021). The availability of satellite data products is mentioned in the text.
Acknowledgments
We are grateful to the Center for Environmental Remote Sensing (CEReS, Chiba University) for providing the SKYNET data, the Meteorological Satellite Center (MSC) of the Japan Meteorological Agency (JMA) for providing Himawari-8 images, the Earth Resources Observation and Science Center (EROS, USGS) for providing the Landsat-8 OLI images in this study. In addition, the authors thank the anonymous reviewers for providing invaluable comments on the original manuscript.
Conflicts of Interest
The authors declare no conflict of interest.
References
- Monks, P.S.; Granier, C.; Fuzzi, S.; Stohl, A.; Williams, M.L.; Akimoto, H.; Amann, M.; Baklanov, A.; Baltensperger, U.; Bey, I.; et al. Atmospheric composition change–global and regional air quality. Atmos. Environ. 2009, 43, 5268–5350. [Google Scholar] [CrossRef] [Green Version]
- Kuze, H. Multi-wavelength and multi-direction remote sensing of atmospheric aerosols and clouds. Remote. Sens.-Appl. 2012, 279–294. [Google Scholar] [CrossRef] [Green Version]
- Gao, J.H.; Woodward, A.; Vardoulakis, S.; Kovats, S.; Wilkinson, P.; Li, L.P.; Xu, L.; Li, J.; Yang, J.; Li, J.; et al. Haze, public health and mitigation measures in China: A review of the current evidence for further policy response. Sci. Total Environ. 2017, 578, 148–157. [Google Scholar] [CrossRef]
- Bach, H.; Verhoef, W.; Schneider, K. Coupling remote sensing observation models and a growth model for improved retrieval of (geo)-biophysical information from optical remote sensing data. In Remote Sensing for Agriculture, Ecosystems, and Hydrology II; International Society for Optics and Photonics: Bellingham, WA, USA, 2001. [Google Scholar] [CrossRef]
- Letu, H.; Yang, K.; Nakajima, T.Y.; Ishimoto, H.; Nagao, T.M.; Riedi, J.; Baran, A.J.; Ma, R.; Wang, T.; Shang, H.; et al. High-resolution retrieval of cloud microphysical properties and surface solar radiation using Himawari-8/AHI next-generation geostationary satellite. Remote. Sens. Environ. 2020, 239, 111583. [Google Scholar] [CrossRef]
- Vermote, E.; Justice, C.; Csiszar, I. Early evaluation of the VIIRS calibration, cloud mask and surface reflectance Earth data records. Remote Sens. Environ. 2014, 148, 134–145. [Google Scholar] [CrossRef] [Green Version]
- Gao, B.C.; Montes, M.J.; Davis, C.O.; Goetz, A.F.H. Atmospheric correction algorithms for hyperspectral remote sensing data of land and ocean. Remote Sens. Environ. 2009, 113, S17–S24. [Google Scholar] [CrossRef]
- Vermote, E.F.; Tanre, D.; Deuze, J.L.; Herman, M.; Morcette, J.-J. Second Simulation of the Satellite Signal in the Solar Spectrum, 6S: An overview. IEEE Trans. Geosci. Remote Sens. 1997, 35, 675–686. [Google Scholar] [CrossRef] [Green Version]
- Guanter, L. On the application of the MODTRAN4 atmospheric radiative transfer code to optical remote sensing. Int. J. Remote. Sens. 2009, 30, 1407–1424. [Google Scholar] [CrossRef]
- Manago, N.; Kuze, H. Seasonal variation of tropospheric aerosol properties by direct and scattered solar radiation spectroscopy. J. Quant. Spectrosc. Radiat. Transf. 2011, 112, 285–291. [Google Scholar] [CrossRef]
- She, L.; Xue, Y.; Yang, X.H.; Leys, J.; Guang, J.; Che, Y.H.; Fan, C.; Xie, Y.Q.; Li, Y. Joint retrieval of aerosol optical depth and surface reflectance over land using geostationary satellite data. IEEE Trans. Geosci. Remote Sens. 2018, 57, 1489–1501. [Google Scholar] [CrossRef]
- Irie, H.; Hoque, H.M.S.; Damiani, A.; Okamoto, H.; Fatmi, A.M.; Khatri, P.; Takamura, T.; Jarupongsakul, T. Simultaneous observations by sky radiometer and MAX-DOAS for characterization of biomass burning plumes in central Thailand in January–April 2016. Atmos. Meas. Tech. 2019, 12, 599–606. [Google Scholar] [CrossRef] [Green Version]
- Nakajima, T.; Campanelli, M.; Che, H.; Estellés, V.; Irie, H.; Kim, S.W.; Kim, J.; Liu, D.; Nishizawa, T.; Pandithurai, G.; et al. An overview of and issues with sky radiometer technology and SKYNET. Atmos. Meas. Tech. 2020, 13, 4195–4218. [Google Scholar] [CrossRef]
- Mukai, S.; Sano, I.; Holben, B.N. Aerosol properties over Japan determined by Sun/sky photometry. Water Air Soil Pollut. Focus 2005, 5, 133–143. [Google Scholar] [CrossRef]
- Uchiyama, A. Method to retrieve single scattering properties of aerosols using multi-wavelength scattering and absorption coefficient data measured by integrating nephelometer and absorption photometer. J. Meteorol. Soc. Jpn. Ser. II 2014, 92, 71–91. [Google Scholar] [CrossRef] [Green Version]
- Hoque, H.M.S.; Irie, H.; Damiani, A. First MAX-DOAS Observations of Formaldehyde and Glyoxal in Phimai, Thailand. J. Geophys. Res. Atmos. 2018, 123, 9957–9975. [Google Scholar] [CrossRef]
- Damiani, A.; Irie, H.; Horio, T.; Takamura, T.; Khatri, P.; Takenaka, H.; Nagao, T.; Nakajima, T.Y.; Cordero, R.R. Evaluation of Himawari-8 surface downwelling solar radiation by ground-based measurements. Atmos. Meas. Tech. 2018, 11, 2501–2521. [Google Scholar] [CrossRef] [Green Version]
- Sano, I.; Yamano, M.; Takamura, T.; Nakajima, T.; Holben, B. Calibration and validation of retrieved aerosol properties based on AERONET and SKYNET. Adv. Space Res. 2003, 32, 2159–2164. [Google Scholar] [CrossRef]
- Torres, O.; Bhartia, P.K.; Herman, J.R.; Sinyuk, A.; Ginoux, P.; Holben, B. A Long-Term Record of Aerosol Optical Depth from TOMS Observations and Comparison to AERONET Measurements. J. Atmos. Sci. 2002, 59, 398–413. [Google Scholar] [CrossRef] [Green Version]
- Khatri, P.; Takamura, T.; Nakajima, T.; Estellés, V.; Irie, H.; Kuze, H.; Campanelli, M.; Sinyuk, A.; Lee, S.-M.; Sohn, B.J.; et al. Factors for inconsistent aerosol single scattering albedo between SKYNET and AERONET. J. Geophys. Res. Atmos. 2016, 121, 1859–1877. [Google Scholar] [CrossRef] [Green Version]
- Wang, L.; Cai, K.; Si, Y.; Yu, C.; Zheng, H.; Li, S. Evaluation of Himawari-8 version 2.0 aerosol products against AERONET ground-based measurements over central and northern China. Atmospheric Environment. 2020, 224, 117357. [Google Scholar] [CrossRef]
- Irie, H.; Horio, T.; Damiani, A.; Nakajima, T.Y.; Takenaka, H.; Kikuchi, M.; Khatri, P.; Yumimoto, K. Importance of Himawari-8 aerosol products for energy management system. Earozoru Kenkyu 2017, 32, 95–100. [Google Scholar] [CrossRef]
- Li, Z.B.; Roy, D.P.; Zhang, H.K.; Vermote, E.F.; Huang, H.Y. Evaluation of Landsat-8 and Sentinel-2A aerosol optical depth retrievals across Chinese cities and implications for medium spatial resolution urban aerosol monitoring. Remote Sens. 2019, 11, 122. [Google Scholar] [CrossRef] [Green Version]
- Choi, Y.; Ghim, Y.S. Variations in major aerosol components from long-term measurement of columnar aerosol optical properties at a SKYNET site downwind of Seoul, Korea. Atmos. Environ. 2021, 245, 117991. [Google Scholar] [CrossRef]
- Zhong, B.; Wu, S.L.; Yang, A.X.; Ao, K.; Wu, J.H.; Wu, J.J.; Gong, X.S.; Wang, H.B.; Liu, Q.H. An Atmospheric Correction Method over Bright and Stable Surfaces for Moderate to High Spatial-Resolution Optical Remotely Sensed Imagery. Remote Sens. 2020, 12, 733. [Google Scholar] [CrossRef] [Green Version]
- Wilson, R.T.; Milton, E.J.; Nield, J.M. Are visibility-derived AOT estimates suitable for parameterizing satellite data atmospheric correction algorithms. Int. J. Remote. Sens. 2015, 36, 1675–1688. [Google Scholar] [CrossRef] [Green Version]
- Hadjimitsis, D.G. Aerosol optical thickness (AOT) retrieval over land using satellite image-based algorithm. Air Qual. Atmos. Health 2009, 2, 89–97. [Google Scholar] [CrossRef] [Green Version]
- Kumharn, W.; Janjai, S.; Irie, H.; Pilahome, O. Aerosol size distribution using Thailand ground-based instruments and climate variables. Theor. Appl. Climatol. 2020, 142, 599–611. [Google Scholar] [CrossRef]
- Lagrosas, N.; Bagtasa, G.; Manago, N.; Kuze, H. Influence of ambient relative humidity on seasonal trends of the scattering enhancement factor for aerosols in Chiba, Japan. Aerosol Air Qual. Res. 2019, 19, 1856–1871. [Google Scholar] [CrossRef] [Green Version]
- Li, Z.Q.; Xu, H.; Li, K.T.; Li, D.H.; Xie, Y.S.; Li, L.; Zhang, Y.; Gu, X.F.; Zhao, W.; Tian, Q.J.; et al. Comprehensive study of optical, physical, chemical, and radiative properties of total columnar atmospheric aerosols over China: An overview of Sun-Sky Radiometer Observation Network (SONET) measurements. Bull. Am. Meteorol. Soc. 2018, 99, 739–755. [Google Scholar] [CrossRef]
- Hashimoto, M.; Nakajima, T.; Dubovik, O.; Campanelli, M.; Che, H.; Khatri, P.; Takamura, T.; Pandithurai, G. Development of a new data-processing method for SKYNET sky radiometer observations. Atmos. Meas. Tech. 2012, 5, 2723–2737. [Google Scholar] [CrossRef] [Green Version]
- Uchiyama, A.; Matsunaga, T.; Yamazaki, A. The instrument constant of sky radiometers (POM-02), Part II: Solid view angle 2. Atmos. Meas. Tech. 2018, 11, 5389–5402. [Google Scholar] [CrossRef] [Green Version]
- Hoque, H.M.S.; Irie, H.; Damiani, A.; Momoi, M. Primary Evaluation of the GCOM-C Aerosol Products at 380 nm Using Ground-Based Sky Radiometer Observations. Remote Sens. 2020, 12, 2661. [Google Scholar] [CrossRef]
- Momoi, M.; Kudo, R.; Aoki, K.; Mori, T.; Miura, K.; Okamoto, H.; Irie, H.; Shoji, Y.; Uchiyama, A.; Ijima, O.; et al. Development of on-site self-calibration and retrieval methods for sky-radiometer observations of precipitable water vapor. Atmos. Meas. Tech. 2020, 13, 2635–2658. [Google Scholar] [CrossRef]
- Irie, H.; Kanaya, Y.; Akimoto, H.; Iwabuchi, H.; Shimizu, A.; Aoki, K. First retrieval of tropospheric aerosol profiles using MAX-DOAS and comparison with lidar and sky radiometer measurements. Atmos. Chem. Phys. 2008, 8, 341–350. [Google Scholar] [CrossRef] [Green Version]
- Japan Meteorological Agency. Himawari-8/9 Himawari Standard Data User’s Guide (ver.1.2). 2015. Available online: http://www.data.jma.go.jp/mscweb/en/himawari89/space_segment/hsd_sample/HS_D_users_guide_en_v12.pdf (accessed on 1 July 2021).
- Daisaku, U. Aerosol Optical Depth product derived from Himawari-8 data for Asian dust monitoring. Meteorol. Satell. Cent. Tech. Note 2016, 16, 56–63. [Google Scholar]
- Okuyama, A.; Takahashi, M.; Date, K.; Hosaka, K.; Murata, H.; Tabata, T.; Yoshino, R. Validation of Himawari-8/AHI radiometric calibration based on two years of in-orbit data. J. Meteorol. Soc. Japan. Ser. II 2018, 96, 91–109. [Google Scholar] [CrossRef] [Green Version]
- Letu, H.; Nagao, T.M.; Nakajima, T.Y.; Riedi, J.; Ishimoto, H.; Baran, A.J.; Shang, H.; Sekiguchi, M.; Kikuchi, M. Ice cloud properties from Himawari-8/AHI next- generation geostationary satellite: Capability of the AHI to monitor the DC cloud generation process. IEEE Trans. Geosci. Remote Sens. 2018, 57, 1–11. [Google Scholar] [CrossRef]
- Miura, T.; Nagai, S.; Takeuchi, M.; Ichii, K.; Yoshioka, H. Improved Characterisation of Vegetation and Land Surface Seasonal Dynamics in Central Japan with Himawari-8 Hypertemporal Data. Sci. Rep. 2019, 9, 1–12. [Google Scholar] [CrossRef] [Green Version]
- Yamamoto, Y.; Ichii, K.; Higuchi, A.; Takenaka, H. Geolocation Accuracy Assessment of Himawari-8/AHI Imagery for Application to Terrestrial Monitoring. Remote Sens. 2020, 12, 1372. [Google Scholar] [CrossRef]
- Jang, E.; Kang, Y.; Im, J.; Lee, D.W.; Yoon, J.; Kim, S.K. Detection and monitoring of forest fires using Himawari-8 geostationary satellite data in South Korea. Remote Sens. 2019, 11, 271. [Google Scholar] [CrossRef] [Green Version]
- Yumimoto, K.; Nagao, T.M.; Kikuchi, M.; Sekiyama, T.T.; Murakami, H.; Tanaka, T.Y.; Ogi, A.; Irie, H.; Khatri, P.; Okumura, H.; et al. Aerosol data assimilation using data from Himawari-8, a next-generation geostationary meteorological satellite. Geophys. Res. Lett. 2016, 43, 5886–5894. [Google Scholar] [CrossRef]
- Vermote, E.; Justice, C.; Claverie, M.; Franch, B. Preliminary analysis of the performance of the Landsat 8/OLI land surface reflectance product. Remote Sens. Environ. 2016, 185, 46–56. [Google Scholar] [CrossRef]
- Fukagawa, S.; Kuze, H.; Bagtasa, G.; Naito, S.; Yabuki, M.; Takamura, T.; Takeuchi, N. Characterization of seasonal variation of tropospheric aerosols in Chiba, Japan. Atmos. Environ. 2006, 40, 2160–2168. [Google Scholar] [CrossRef]
- Kotchenova, S.Y.; Vermote, E.F.; Matarrese, R.; Klemm, F.J. Validation of a vector version of the 6S radiative transfer code for atmospheric correction of satellite data. Part I: Path radiance. Appl. Opt. 2006, 45, 6762–6774. [Google Scholar] [CrossRef] [Green Version]
- Aminuddin, J.; Okude, S.I.; Lagrosas, N.; Manago, N.; Kuze, H. Real time derivation of atmospheric aerosol optical properties by concurrent measurements of optical and sampling instruments. Open J. Air Pollut. 2018, 7, 140. [Google Scholar] [CrossRef] [Green Version]
- Haifeng, H.; Jianrong, K.; Xiaoke, Z.; Kaiyuan, D. Atmospheric correction of SPOT satellite images based on radiation transfer model. In Proceedings of the 2010 International Conference on Computer Application and System Modeling (ICCASM 2010), Taiyuan, China, 22–24 October 2010; pp. V5-188–V5-191. [Google Scholar] [CrossRef]
- Schillings, C.; Mannstein, H.; Meyer, R. Operational method for deriving high resolution direct normal irradiance from satellite data. Sol. Energy 2004, 76, 475–484. [Google Scholar] [CrossRef]
- Kaufman, Y.J.; Tanré, D.; Remer, L.A.; Vermote, E.F.; Chu, A.; Holben, B.N. Operational remote sensing of tropospheric aerosol over land from EOS moderate resolution imaging spectroradiometer. J. Geophys. Res. Atmos. 1997, 102, 17051–17067. [Google Scholar] [CrossRef]
- Zhang, Q.; Quan, J.N.; Tie, X.X.; Li, X.; Liu, Q.; Gao, Y.; Zhao, D.L. Effects of meteorology and secondary particle formation on visibility during heavy haze events in Beijing, China. Sci. Total Environ. 2015, 502, 578–584. [Google Scholar] [CrossRef]
- Ångström, A. The parameters of atmospheric turbidity. Tellus 1964, 16, 64–75. [Google Scholar] [CrossRef] [Green Version]
- Kaufman, Y.J.; Tanré, D.; Gordon, H.R.; Nakajima, T.; Lenoble, J.; Frouin, R.; Grassl, H.; Herman, B.M.; King, M.D.; Teillet, P.M. Passive remote sensing of tropospheric aerosol and atmospheric correction for the aerosol effect. J. Geophys. Res. Atmos. 1997, 102, 16815–16830. [Google Scholar] [CrossRef] [Green Version]
- Jin, Y.; Hao, Z.; Chen, J.; He, D.; Tian, Q.; Mao, Z.; Pan, D. Retrieval of Urban Aerosol Optical Depth from Landsat 8 OLI in Nanjing, China. Remote Sens. 2021, 13, 415. [Google Scholar] [CrossRef]
- Sun, L.; Wei, J.; Bilal, M.; Tian, X.; Jia, C.; Guo, Y.; Mi, X. Aerosol optical depth retrieval over bright areas using Landsat 8 OLI images. Remote Sens. 2016, 8, 23. [Google Scholar] [CrossRef] [Green Version]
Figure 1.
Study area and location of the SKYNET site in Chiba University (35.62° N, 140.10° E), Japan. The observation site at Chiba University is located in the urban Chiba area, about 30 km southeast of Tokyo.
Figure 1.
Study area and location of the SKYNET site in Chiba University (35.62° N, 140.10° E), Japan. The observation site at Chiba University is located in the urban Chiba area, about 30 km southeast of Tokyo.
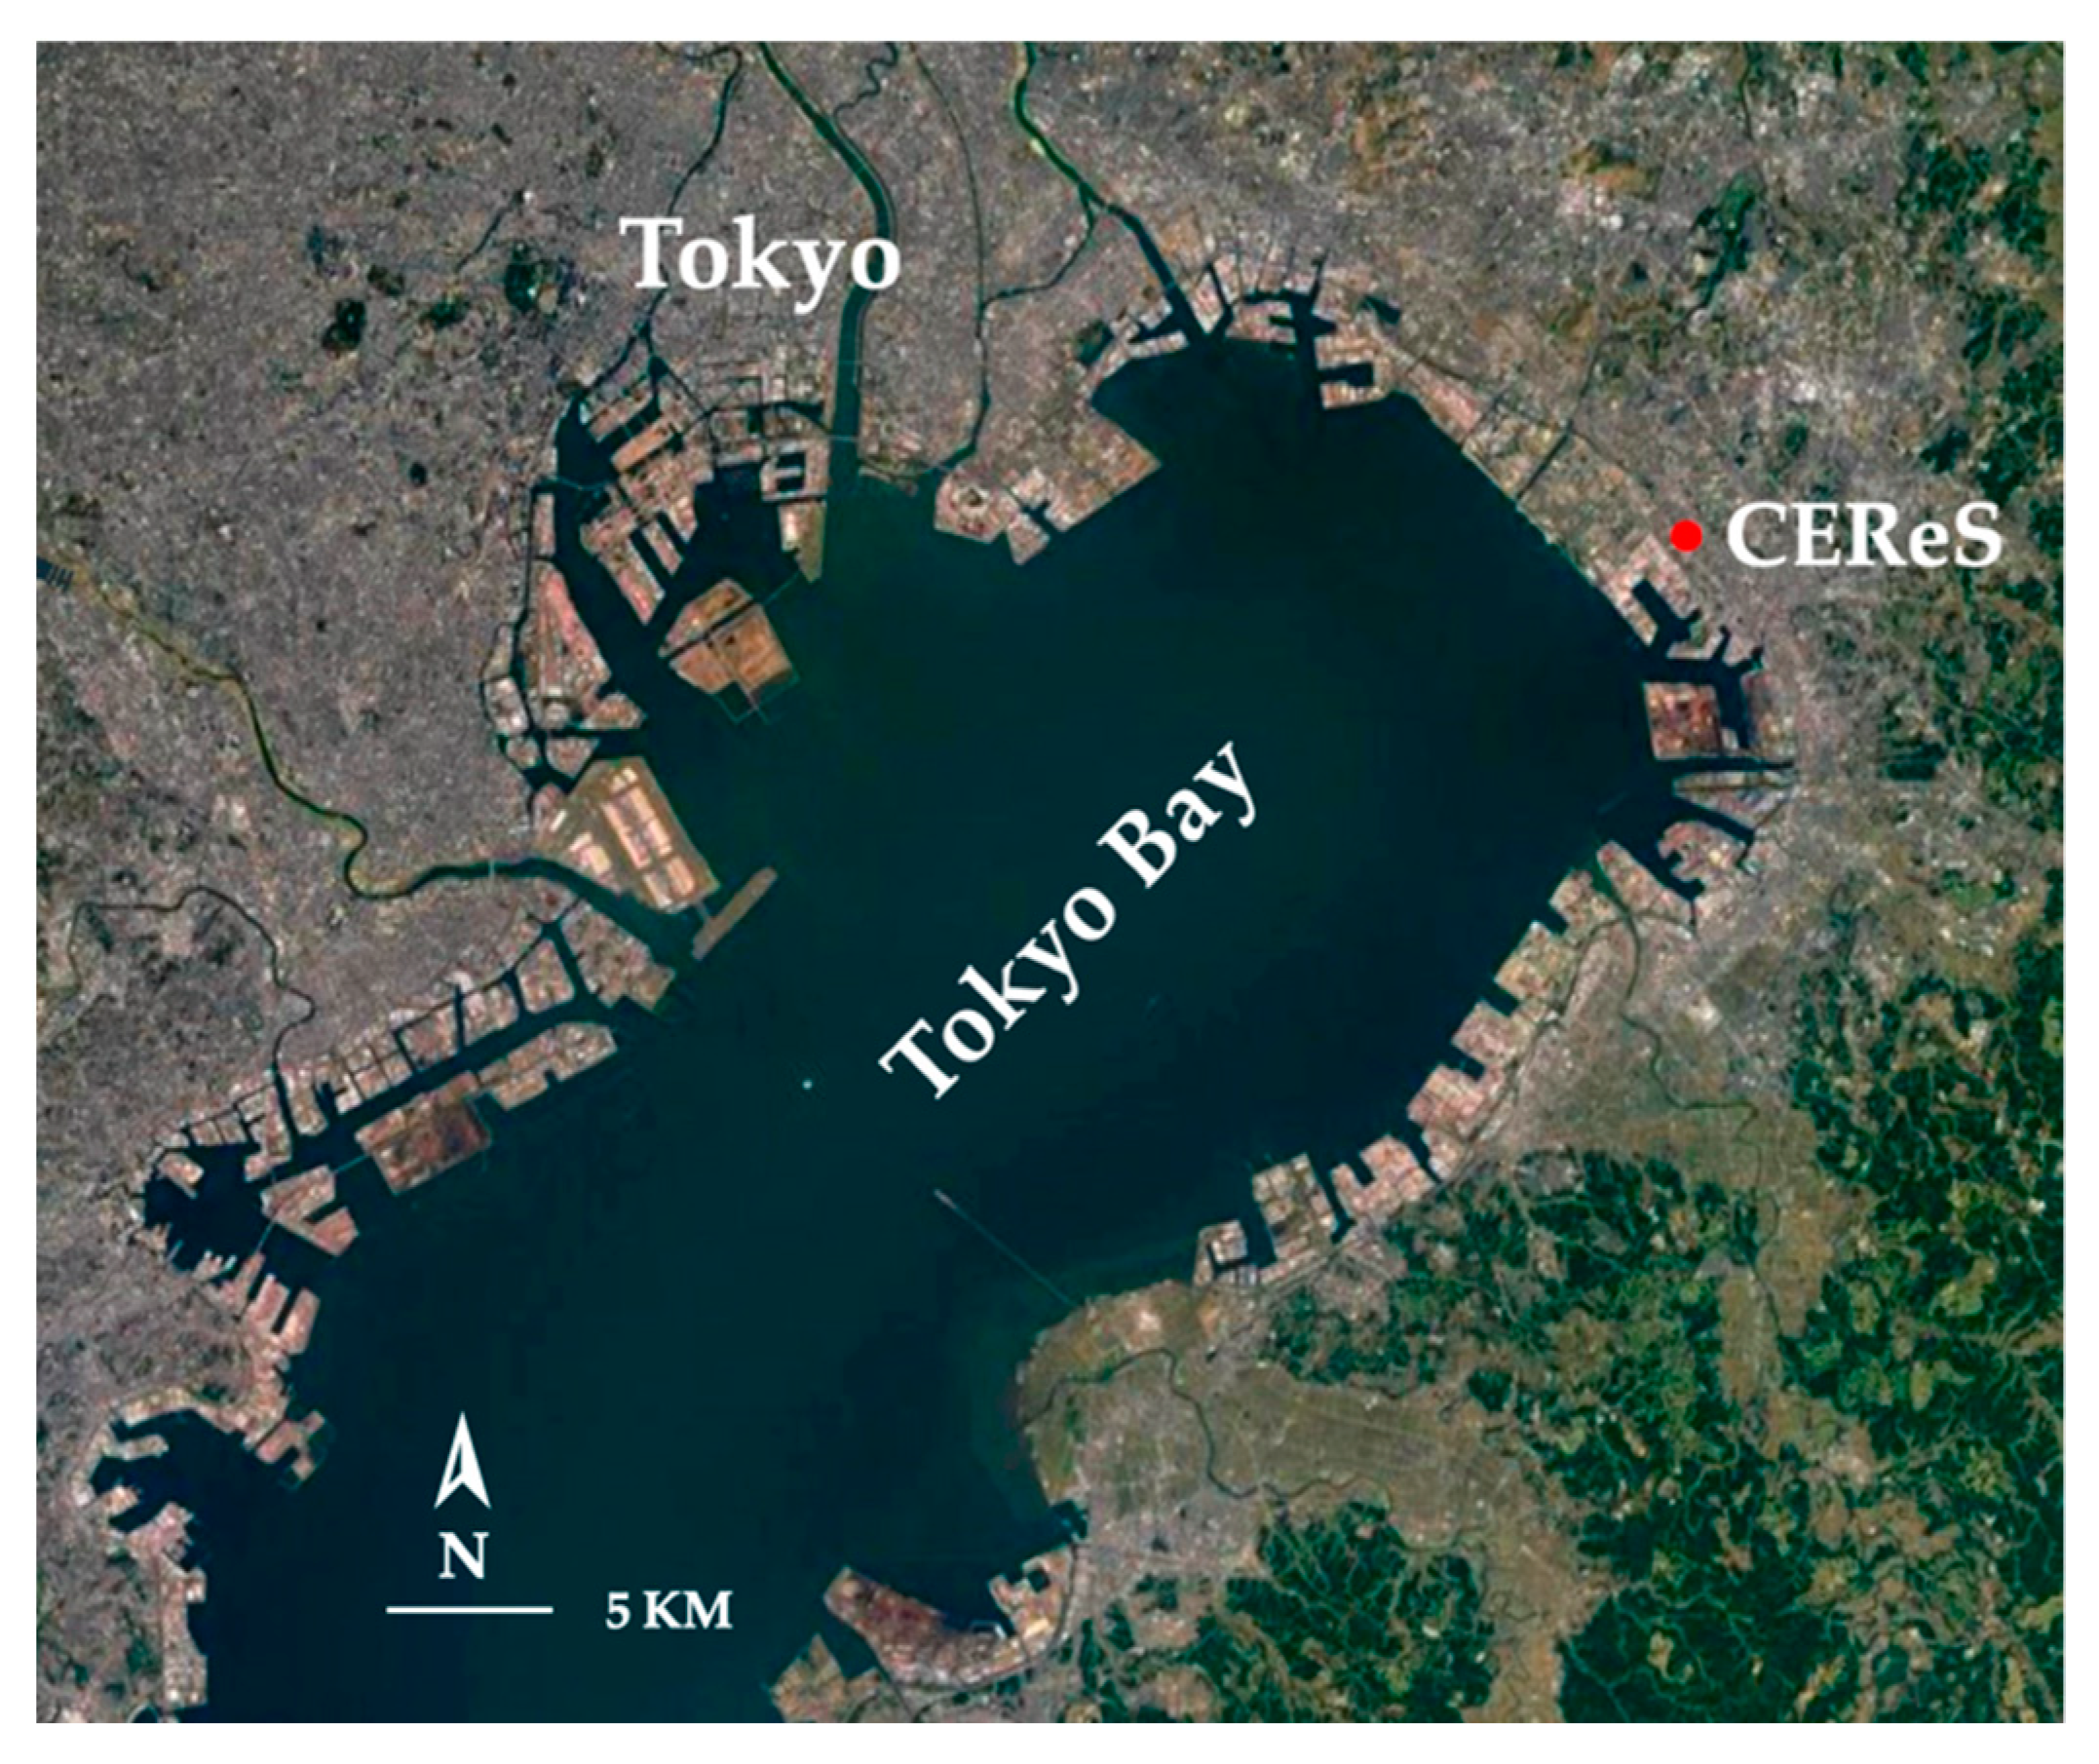
Figure 2.
Map of the global SKYNET sites.

Figure 3.
Radiances observed with a satellite sensor.
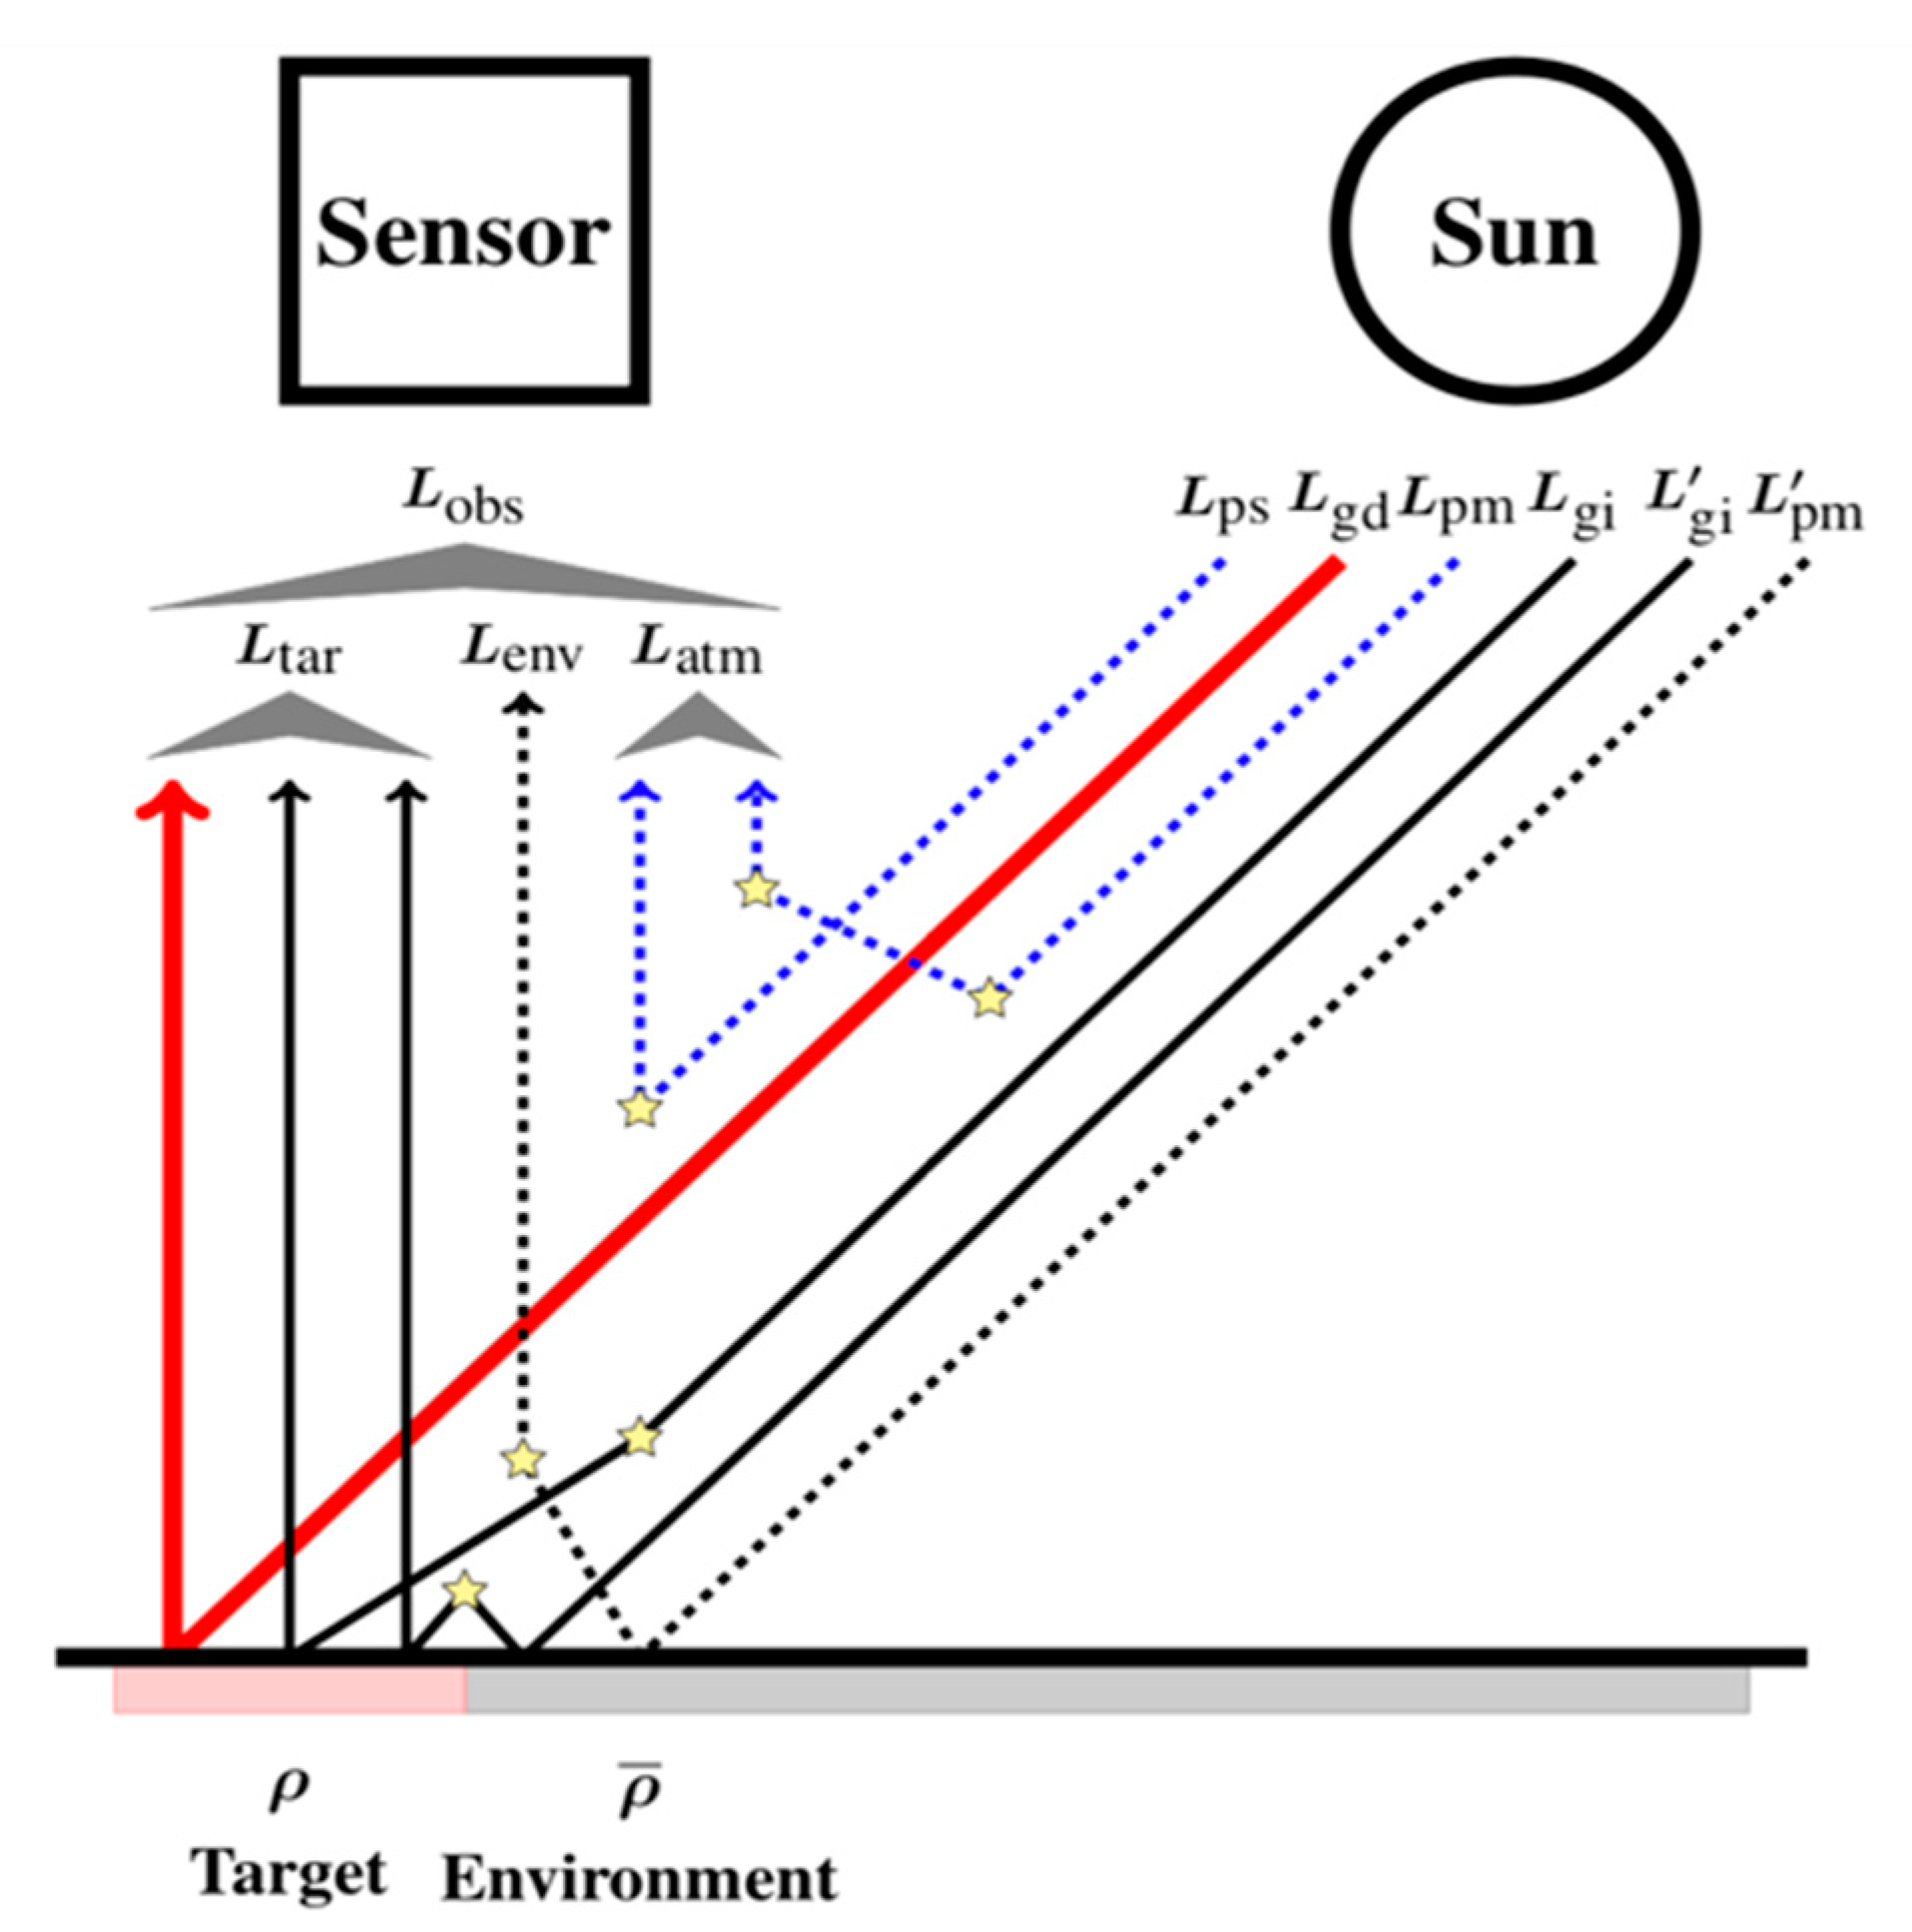
Figure 4.
Radiance components estimated from 6S simulation. Time series around noon (10:30, 12:30, 14:30, and JST) are plotted with , , , and at the CEReS site and built-in custom aerosol model (Data are from 2020).
Figure 4.
Radiance components estimated from 6S simulation. Time series around noon (10:30, 12:30, 14:30, and JST) are plotted with , , , and at the CEReS site and built-in custom aerosol model (Data are from 2020).

Figure 5.
LUTs calculated from the custom aerosol model, demonstrate the - relationship for custom aerosol model calculated for Himawari-8 band 1 image on 6 January 2020. The top panels show the relation between and, while bottom panels indicate the relation between and .
Figure 5.
LUTs calculated from the custom aerosol model, demonstrate the - relationship for custom aerosol model calculated for Himawari-8 band 1 image on 6 January 2020. The top panels show the relation between and, while bottom panels indicate the relation between and .
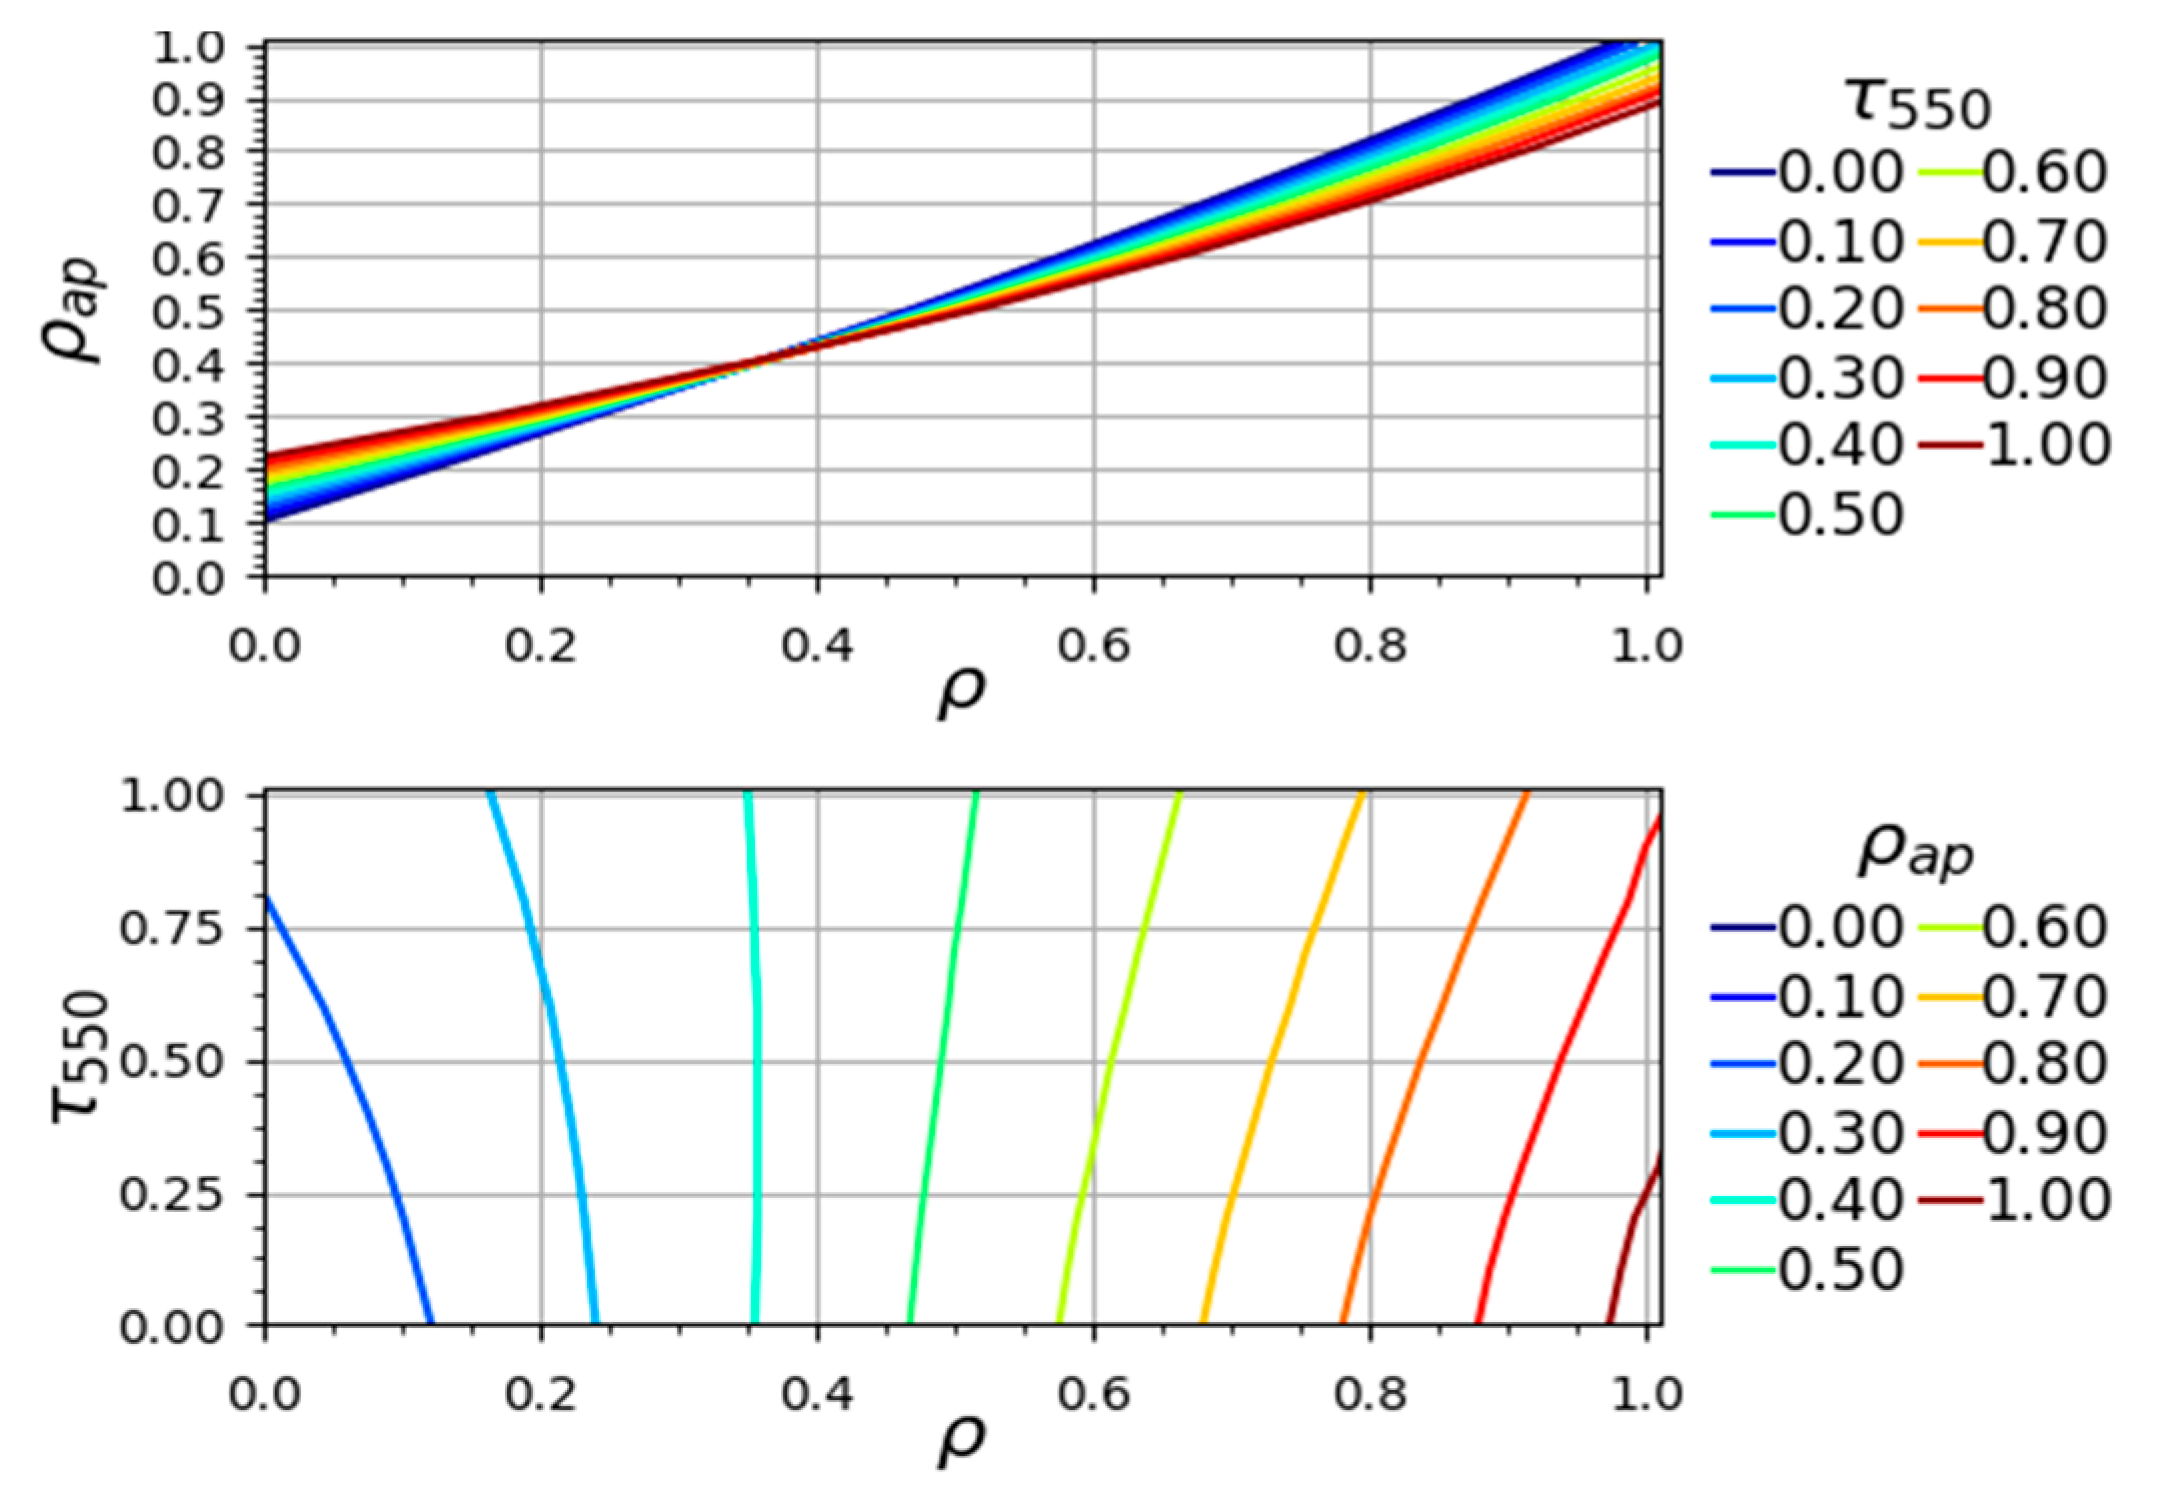
Figure 6.
The DN-pixel transformation curve from the custom aerosol model for a particular value of as measured by the sky-radiometer.
Figure 6.
The DN-pixel transformation curve from the custom aerosol model for a particular value of as measured by the sky-radiometer.
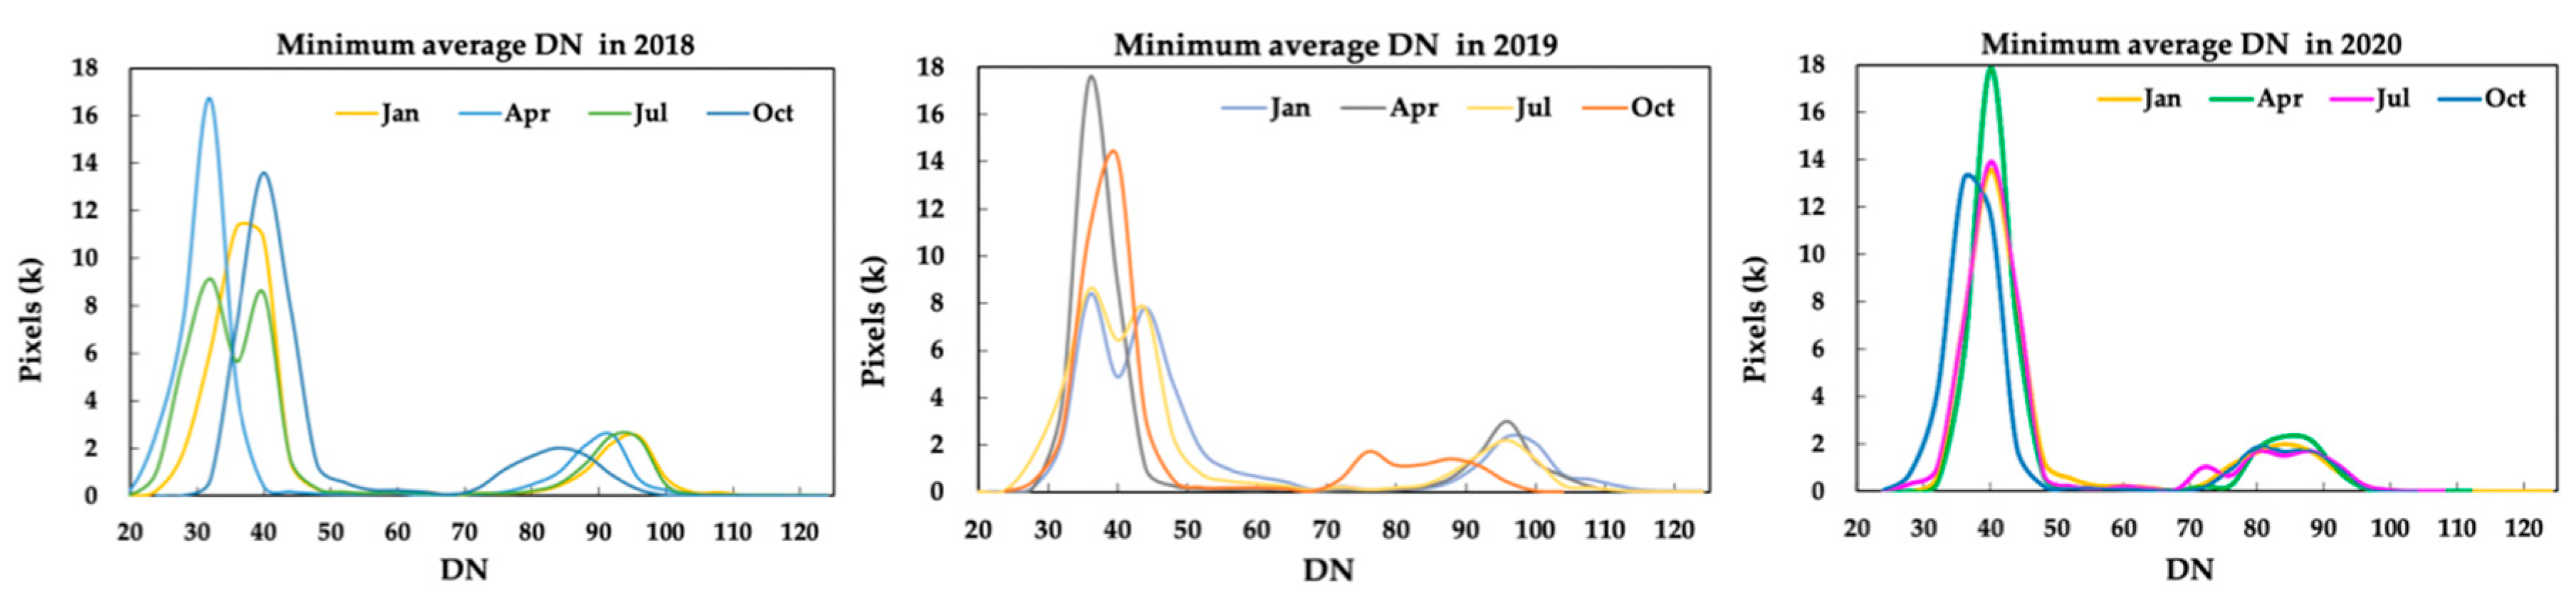
Figure 7.
Comparison of map from custom aerosol model and conventionally-used typical aerosol models (data from 2020).
Figure 7.
Comparison of map from custom aerosol model and conventionally-used typical aerosol models (data from 2020).

Figure 8.
Spatial distributions of the AOT retrieved from the Himawari-8 band 1 on clear-sky conditions: 6 January 2020 (a), 4 April 2020 (b), 2 July 2020 (c), and 2 October 2020 (d). All of the satellite images are acquired at 10:30 JST.
Figure 8.
Spatial distributions of the AOT retrieved from the Himawari-8 band 1 on clear-sky conditions: 6 January 2020 (a), 4 April 2020 (b), 2 July 2020 (c), and 2 October 2020 (d). All of the satellite images are acquired at 10:30 JST.
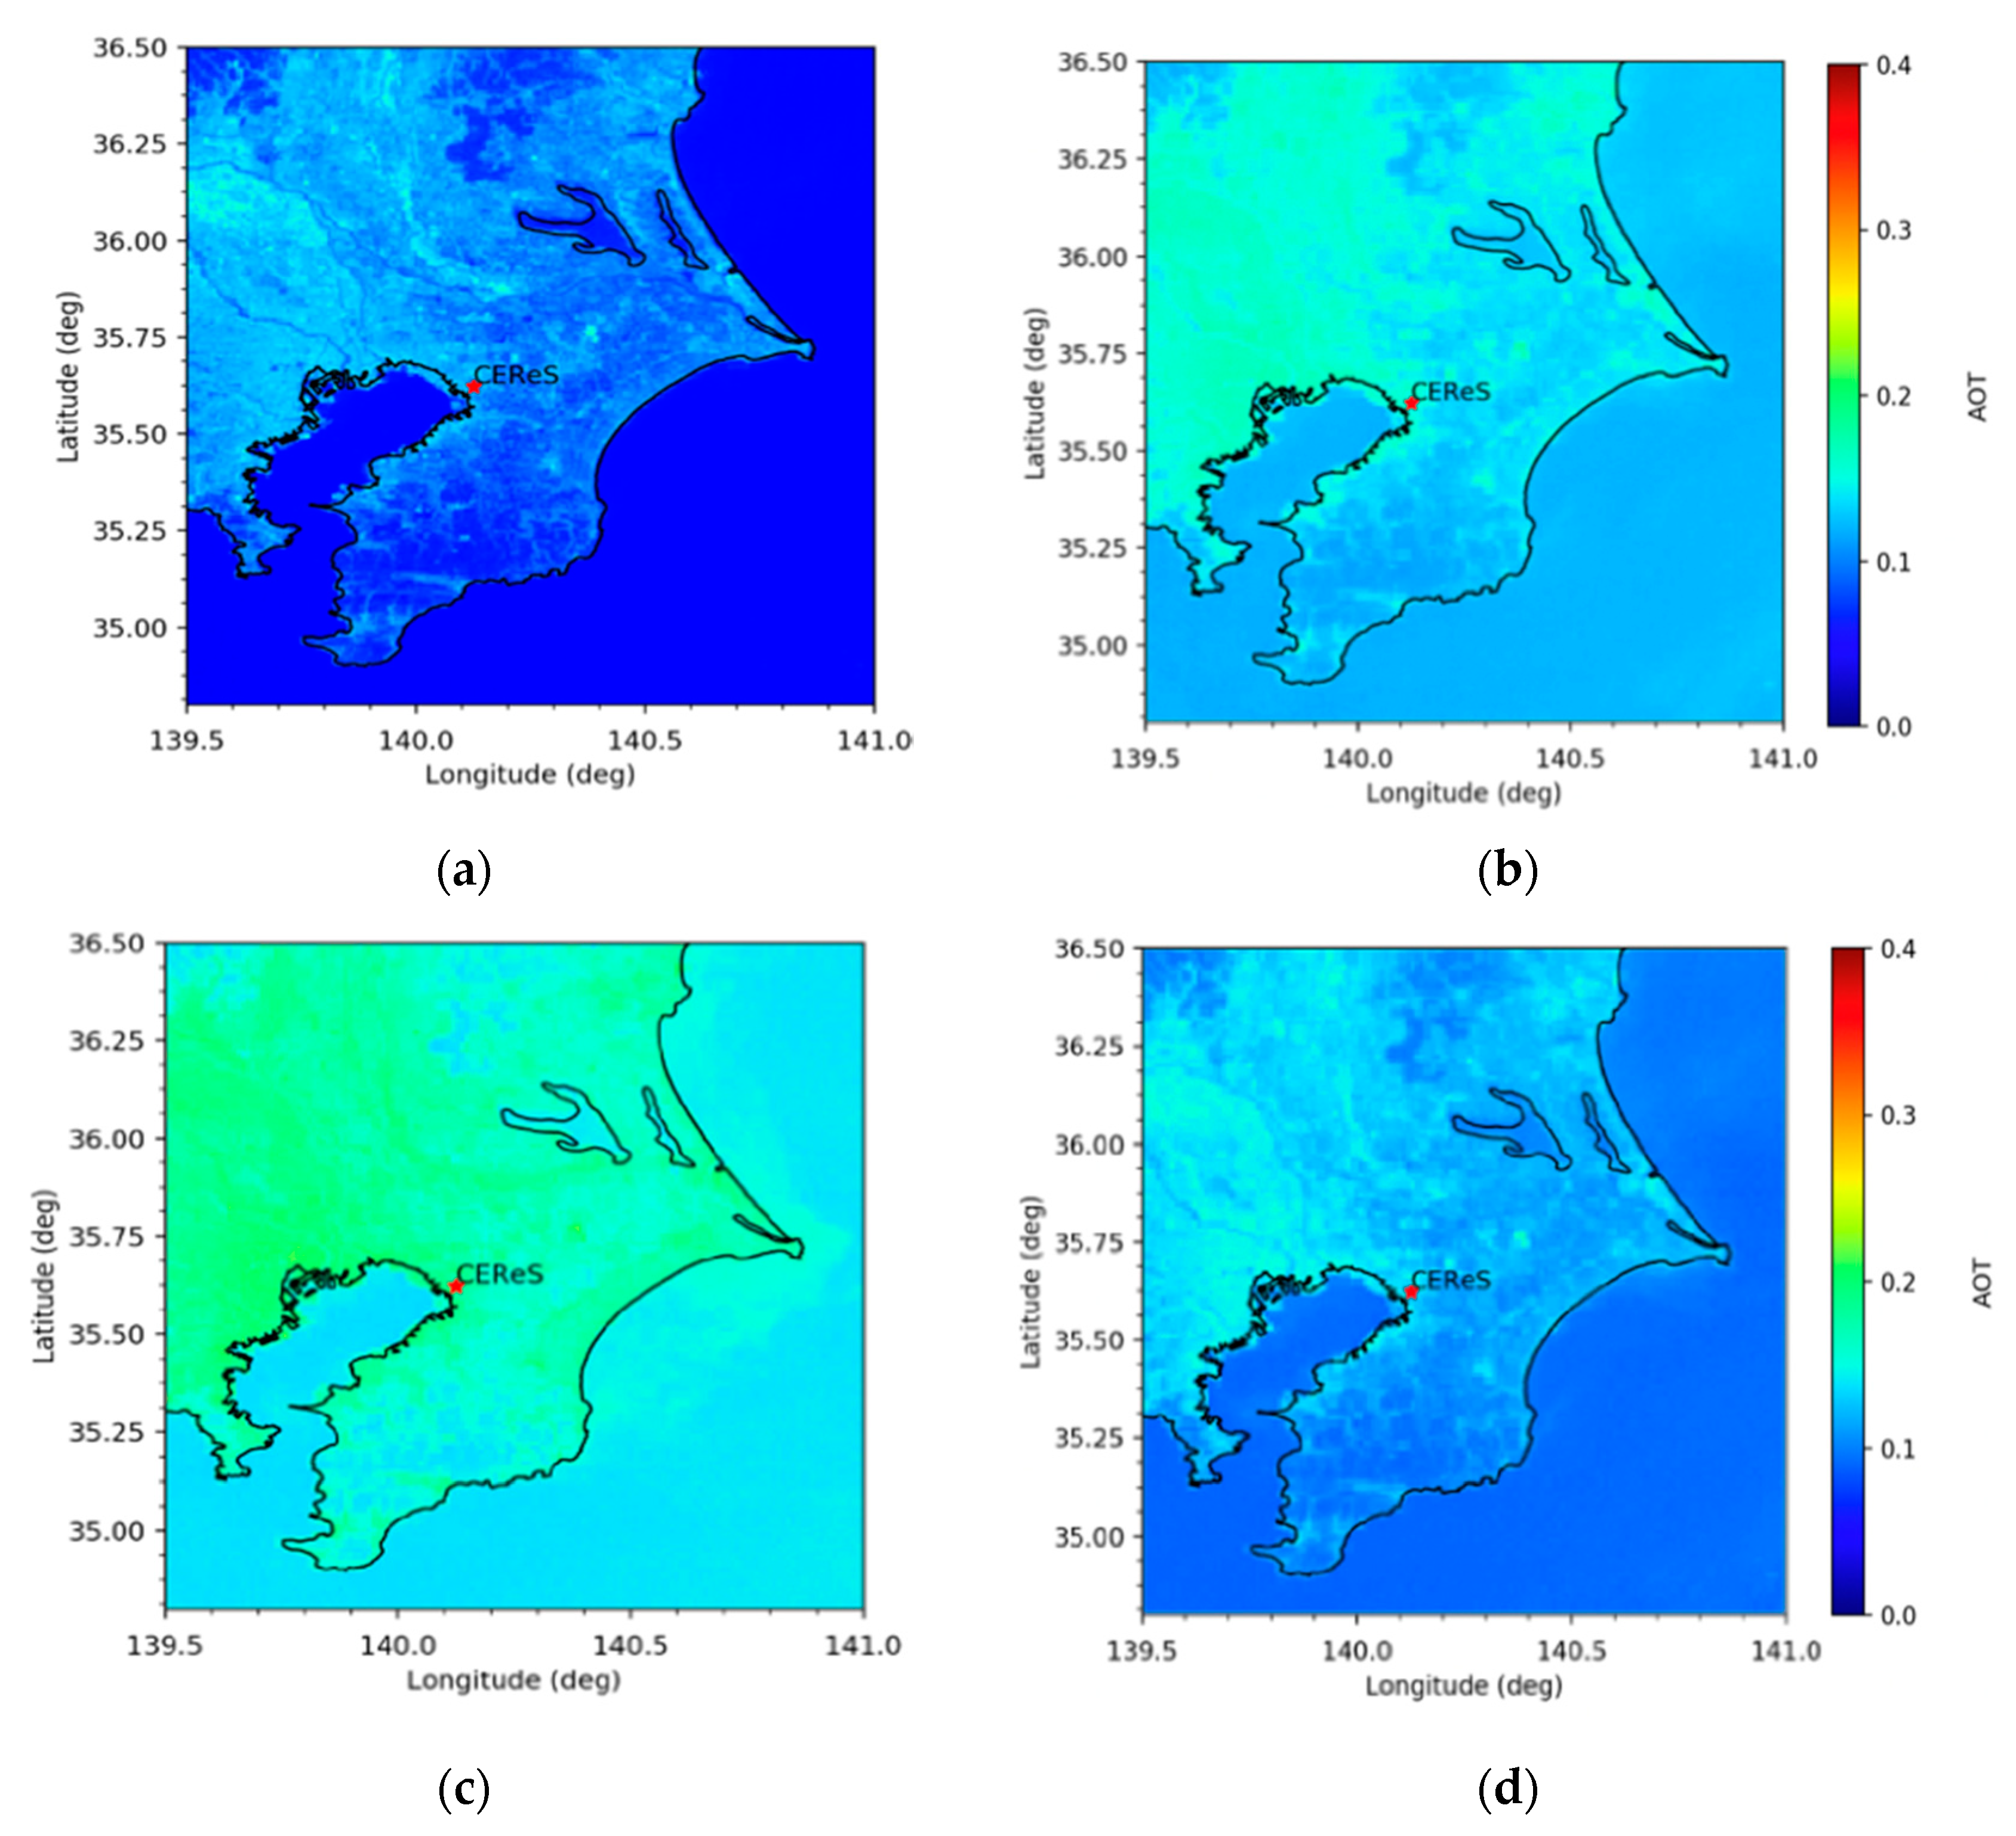
Figure 9.
Comparison of map from custom aerosol model and conventionally-used typical aerosol models (data from 2020).
Figure 9.
Comparison of map from custom aerosol model and conventionally-used typical aerosol models (data from 2020).

Figure 10.
Error estimation of the custom aerosol model, comparing with maritime and rural aerosol models. The absolute values and the relative values for error created from conventionally-used typical aerosol models as illustrated on right axis and left axis, respectively.
Figure 10.
Error estimation of the custom aerosol model, comparing with maritime and rural aerosol models. The absolute values and the relative values for error created from conventionally-used typical aerosol models as illustrated on right axis and left axis, respectively.
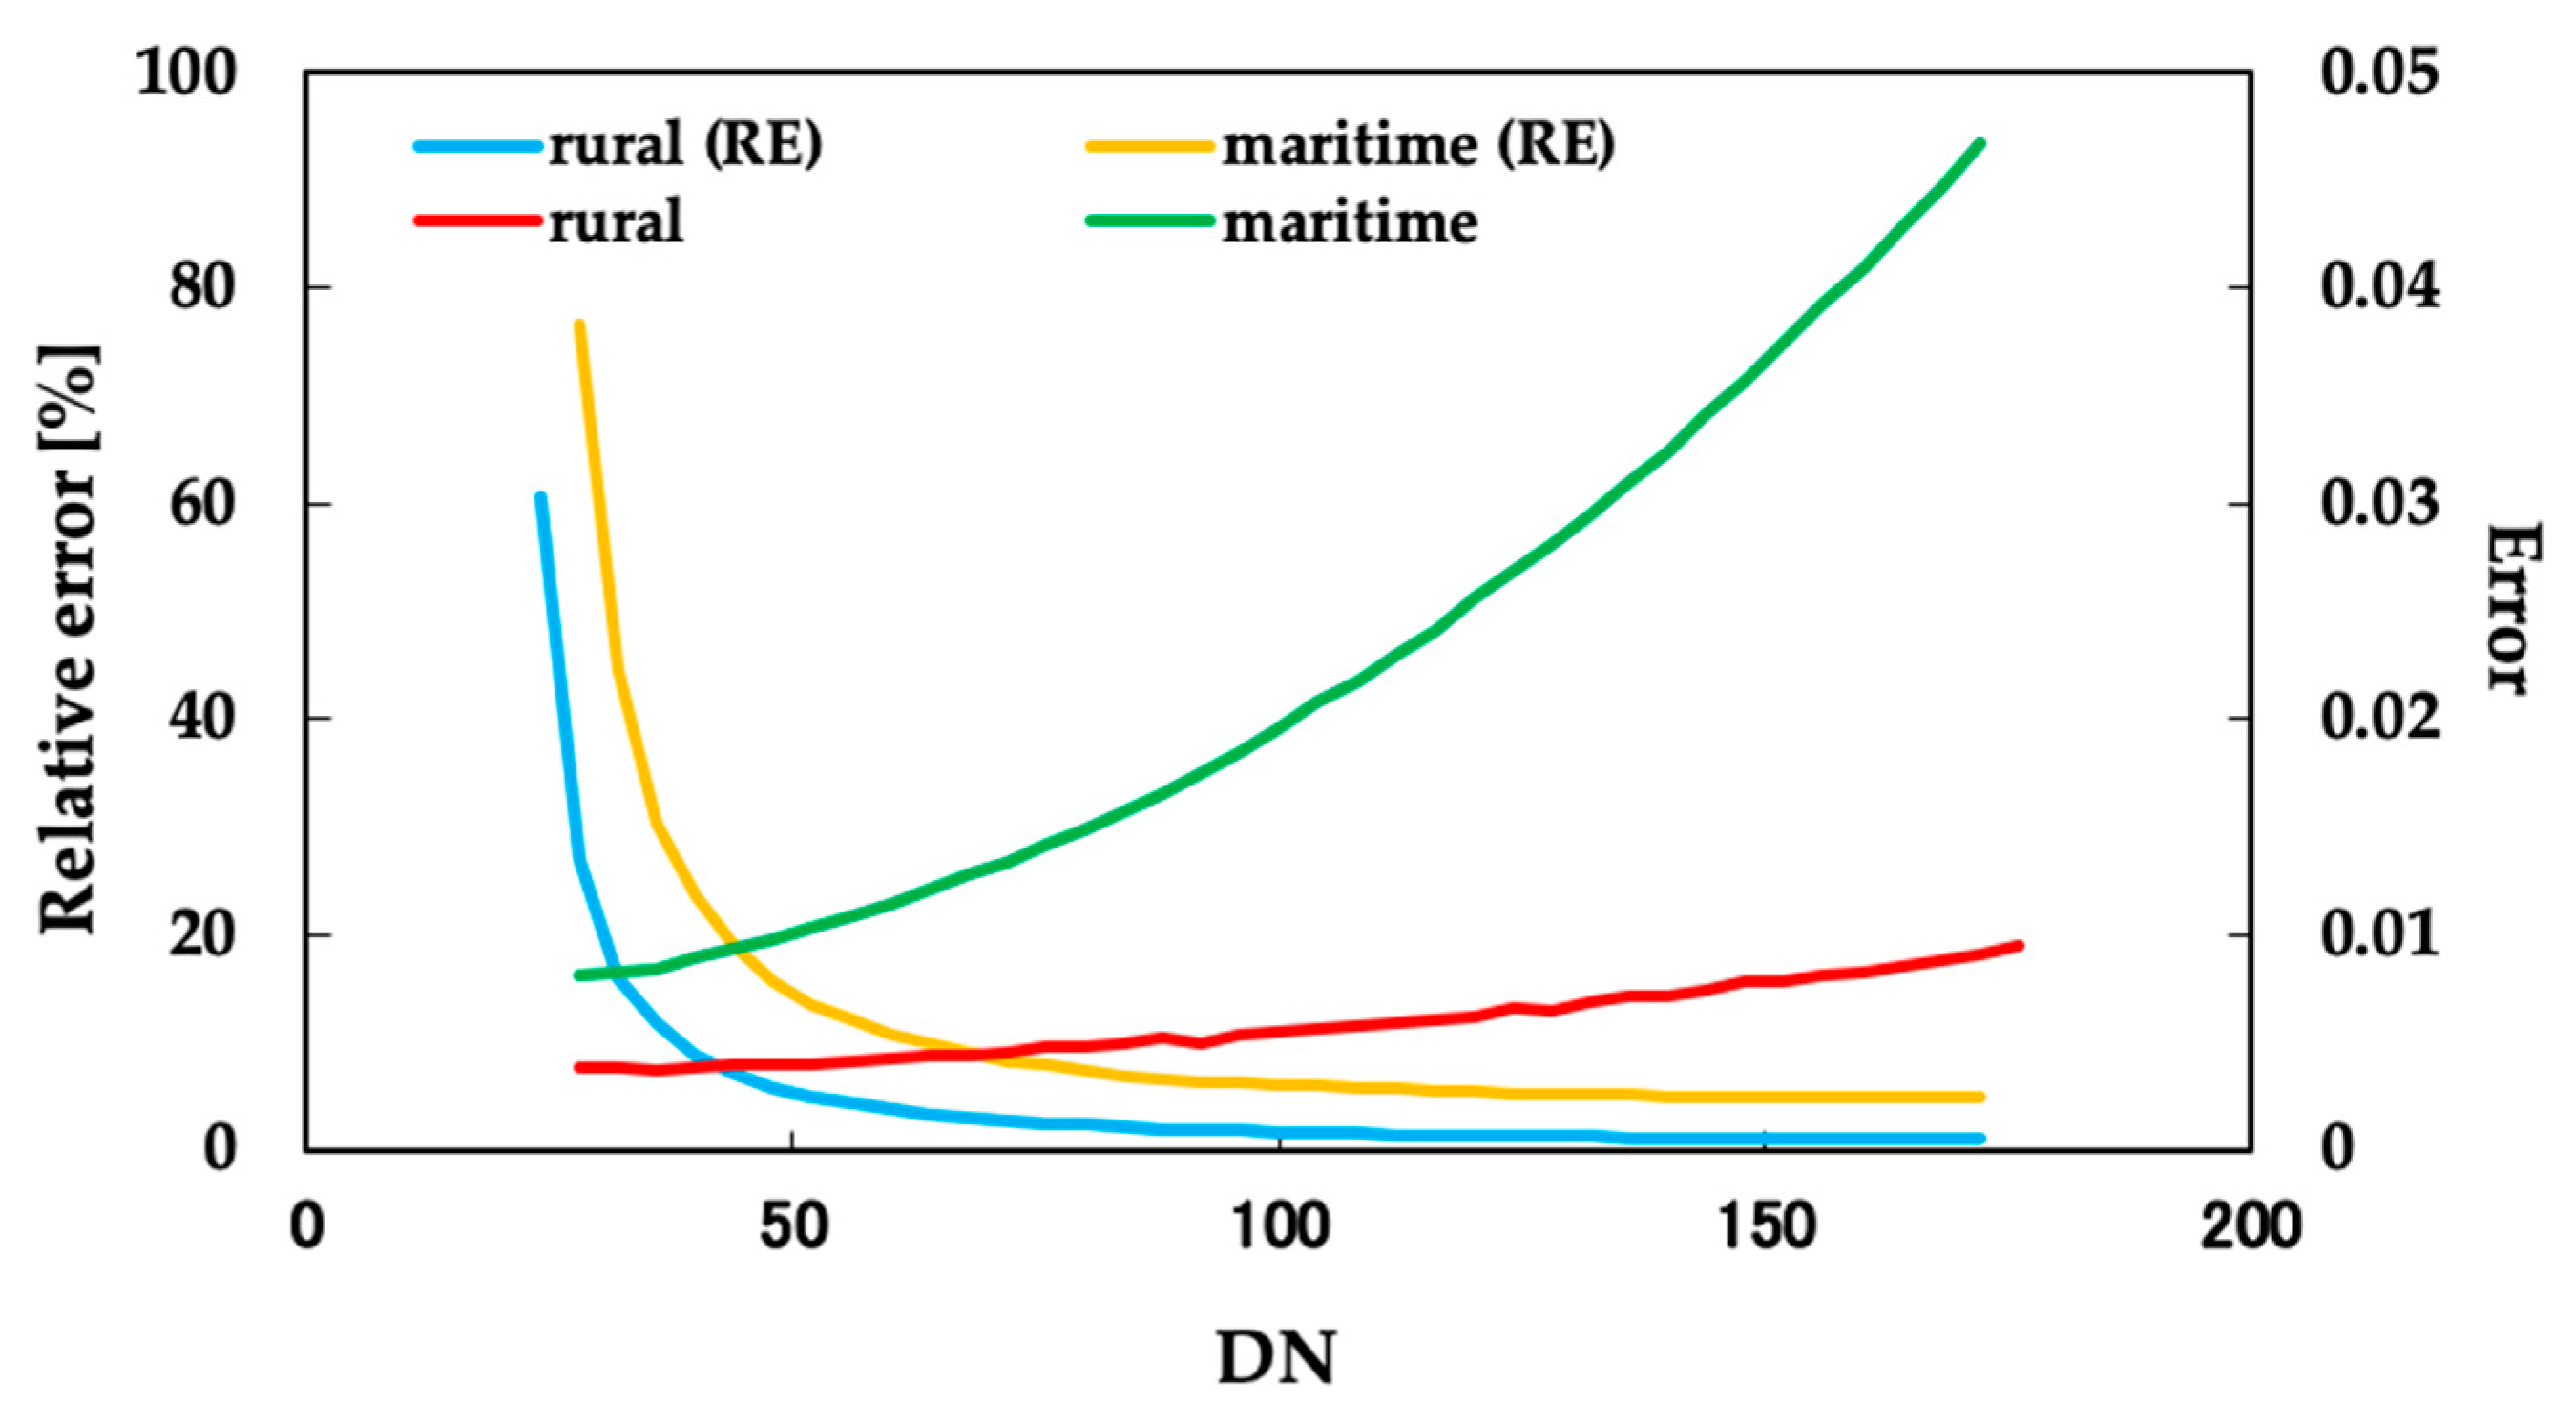
Figure 11.
Yearly mean values of AOTs observed with the sky-radiometer from various wavelengths (data are from 2018, 2019, and 2020, respectively).
Figure 11.
Yearly mean values of AOTs observed with the sky-radiometer from various wavelengths (data are from 2018, 2019, and 2020, respectively).
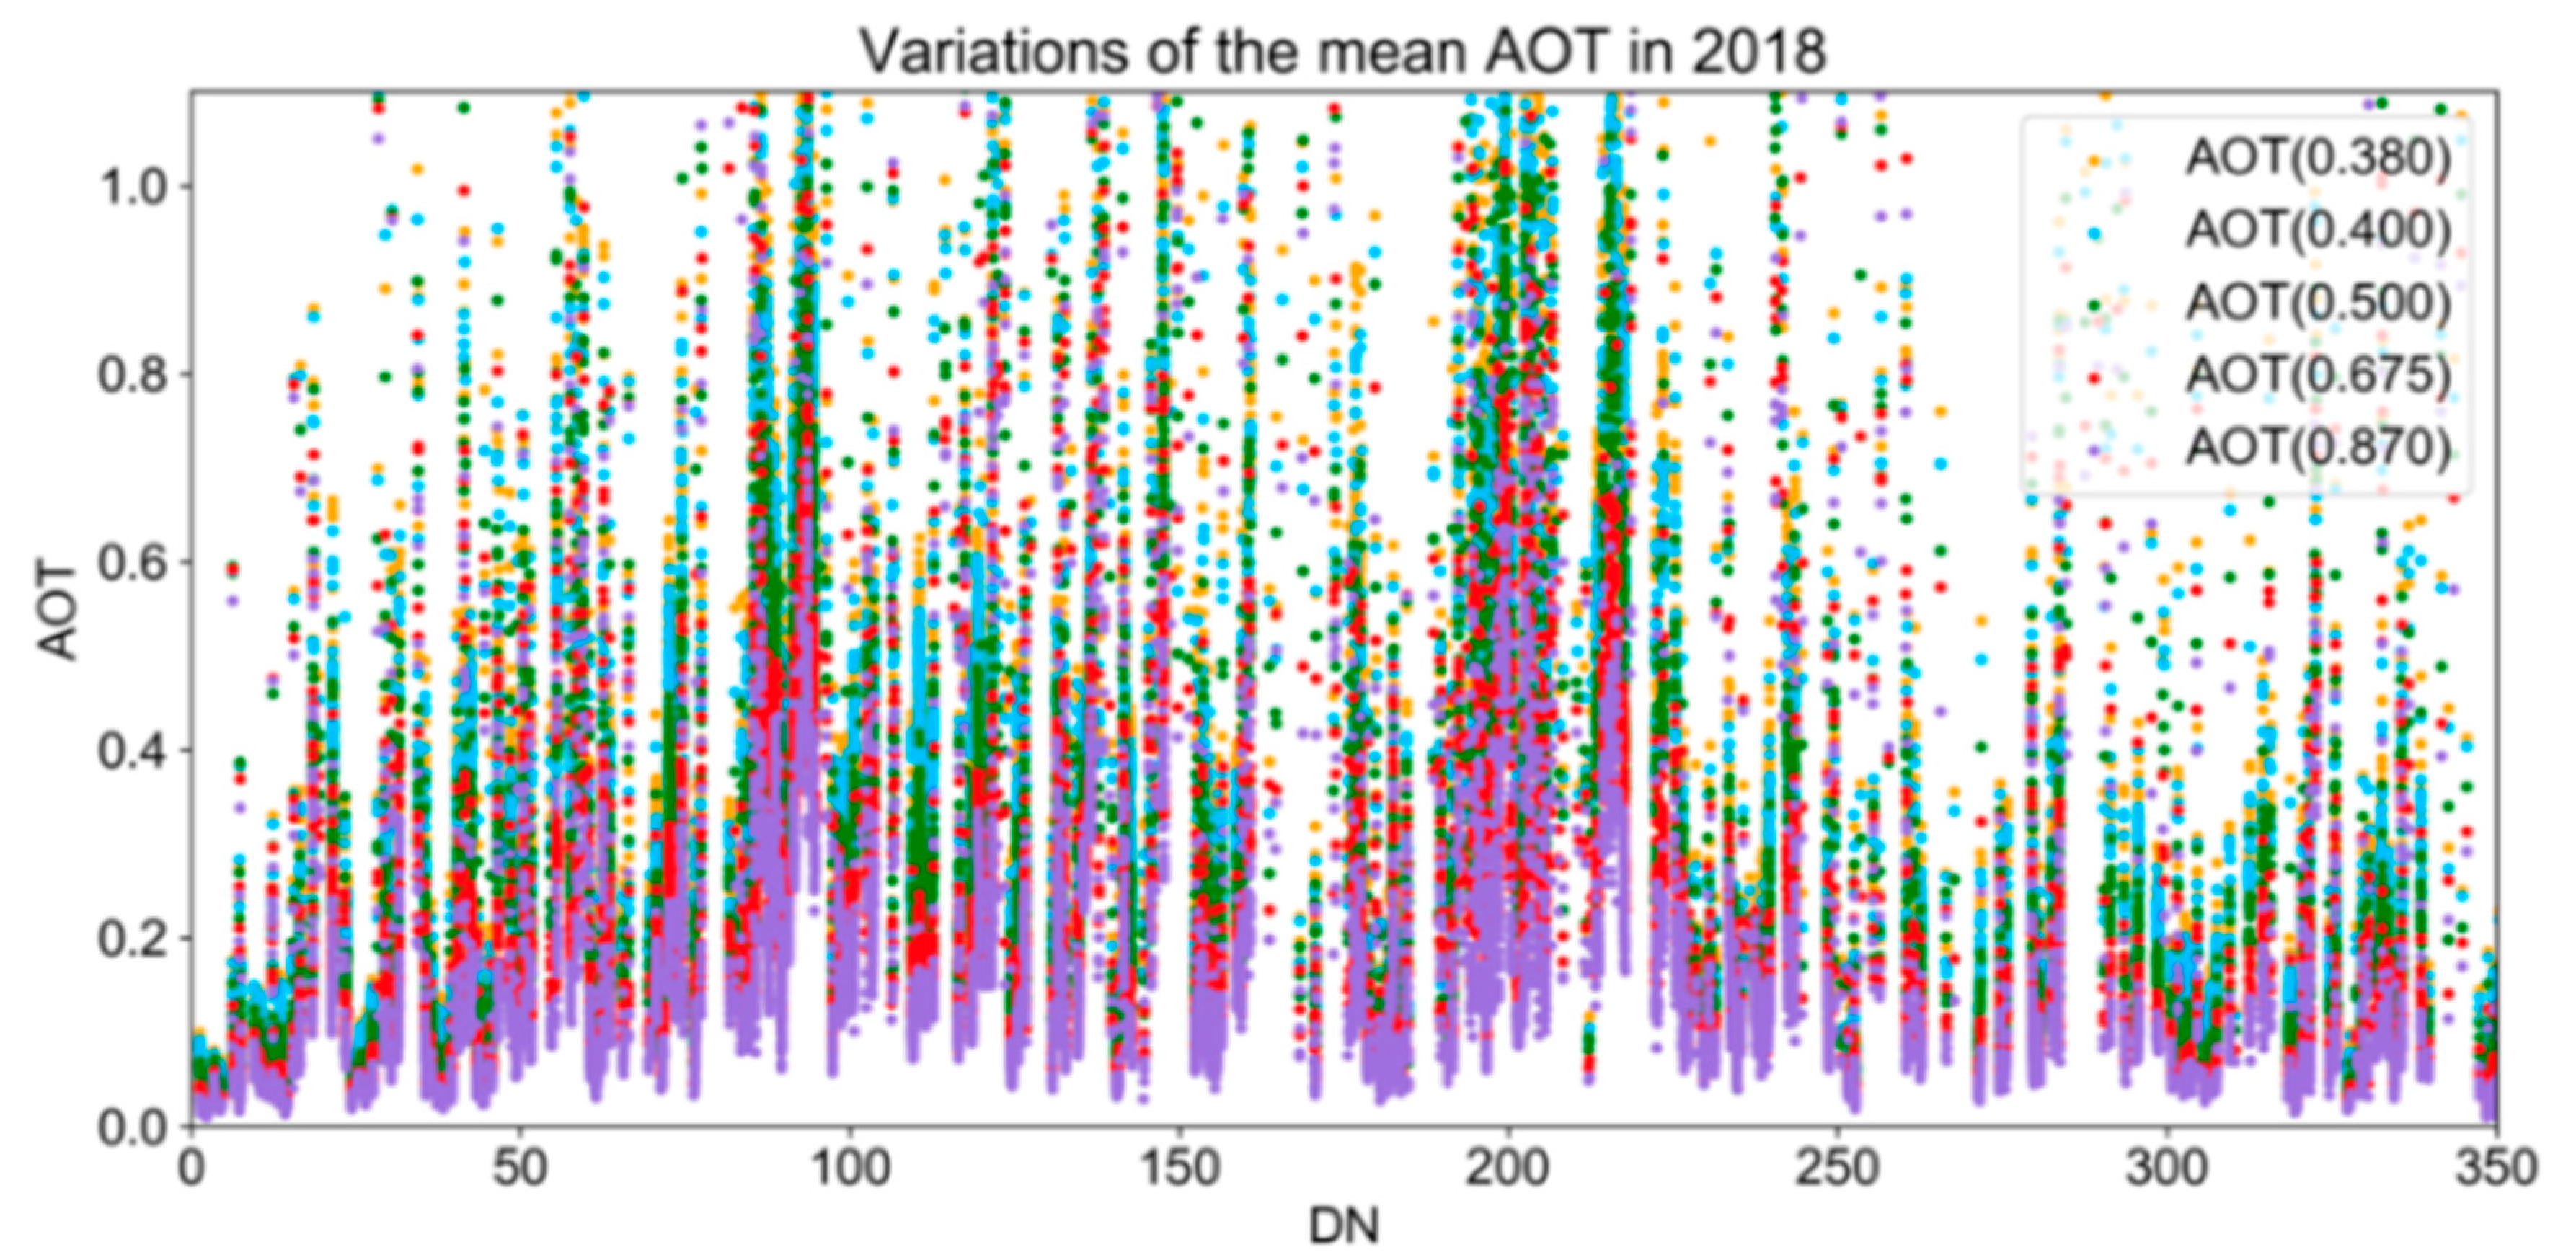
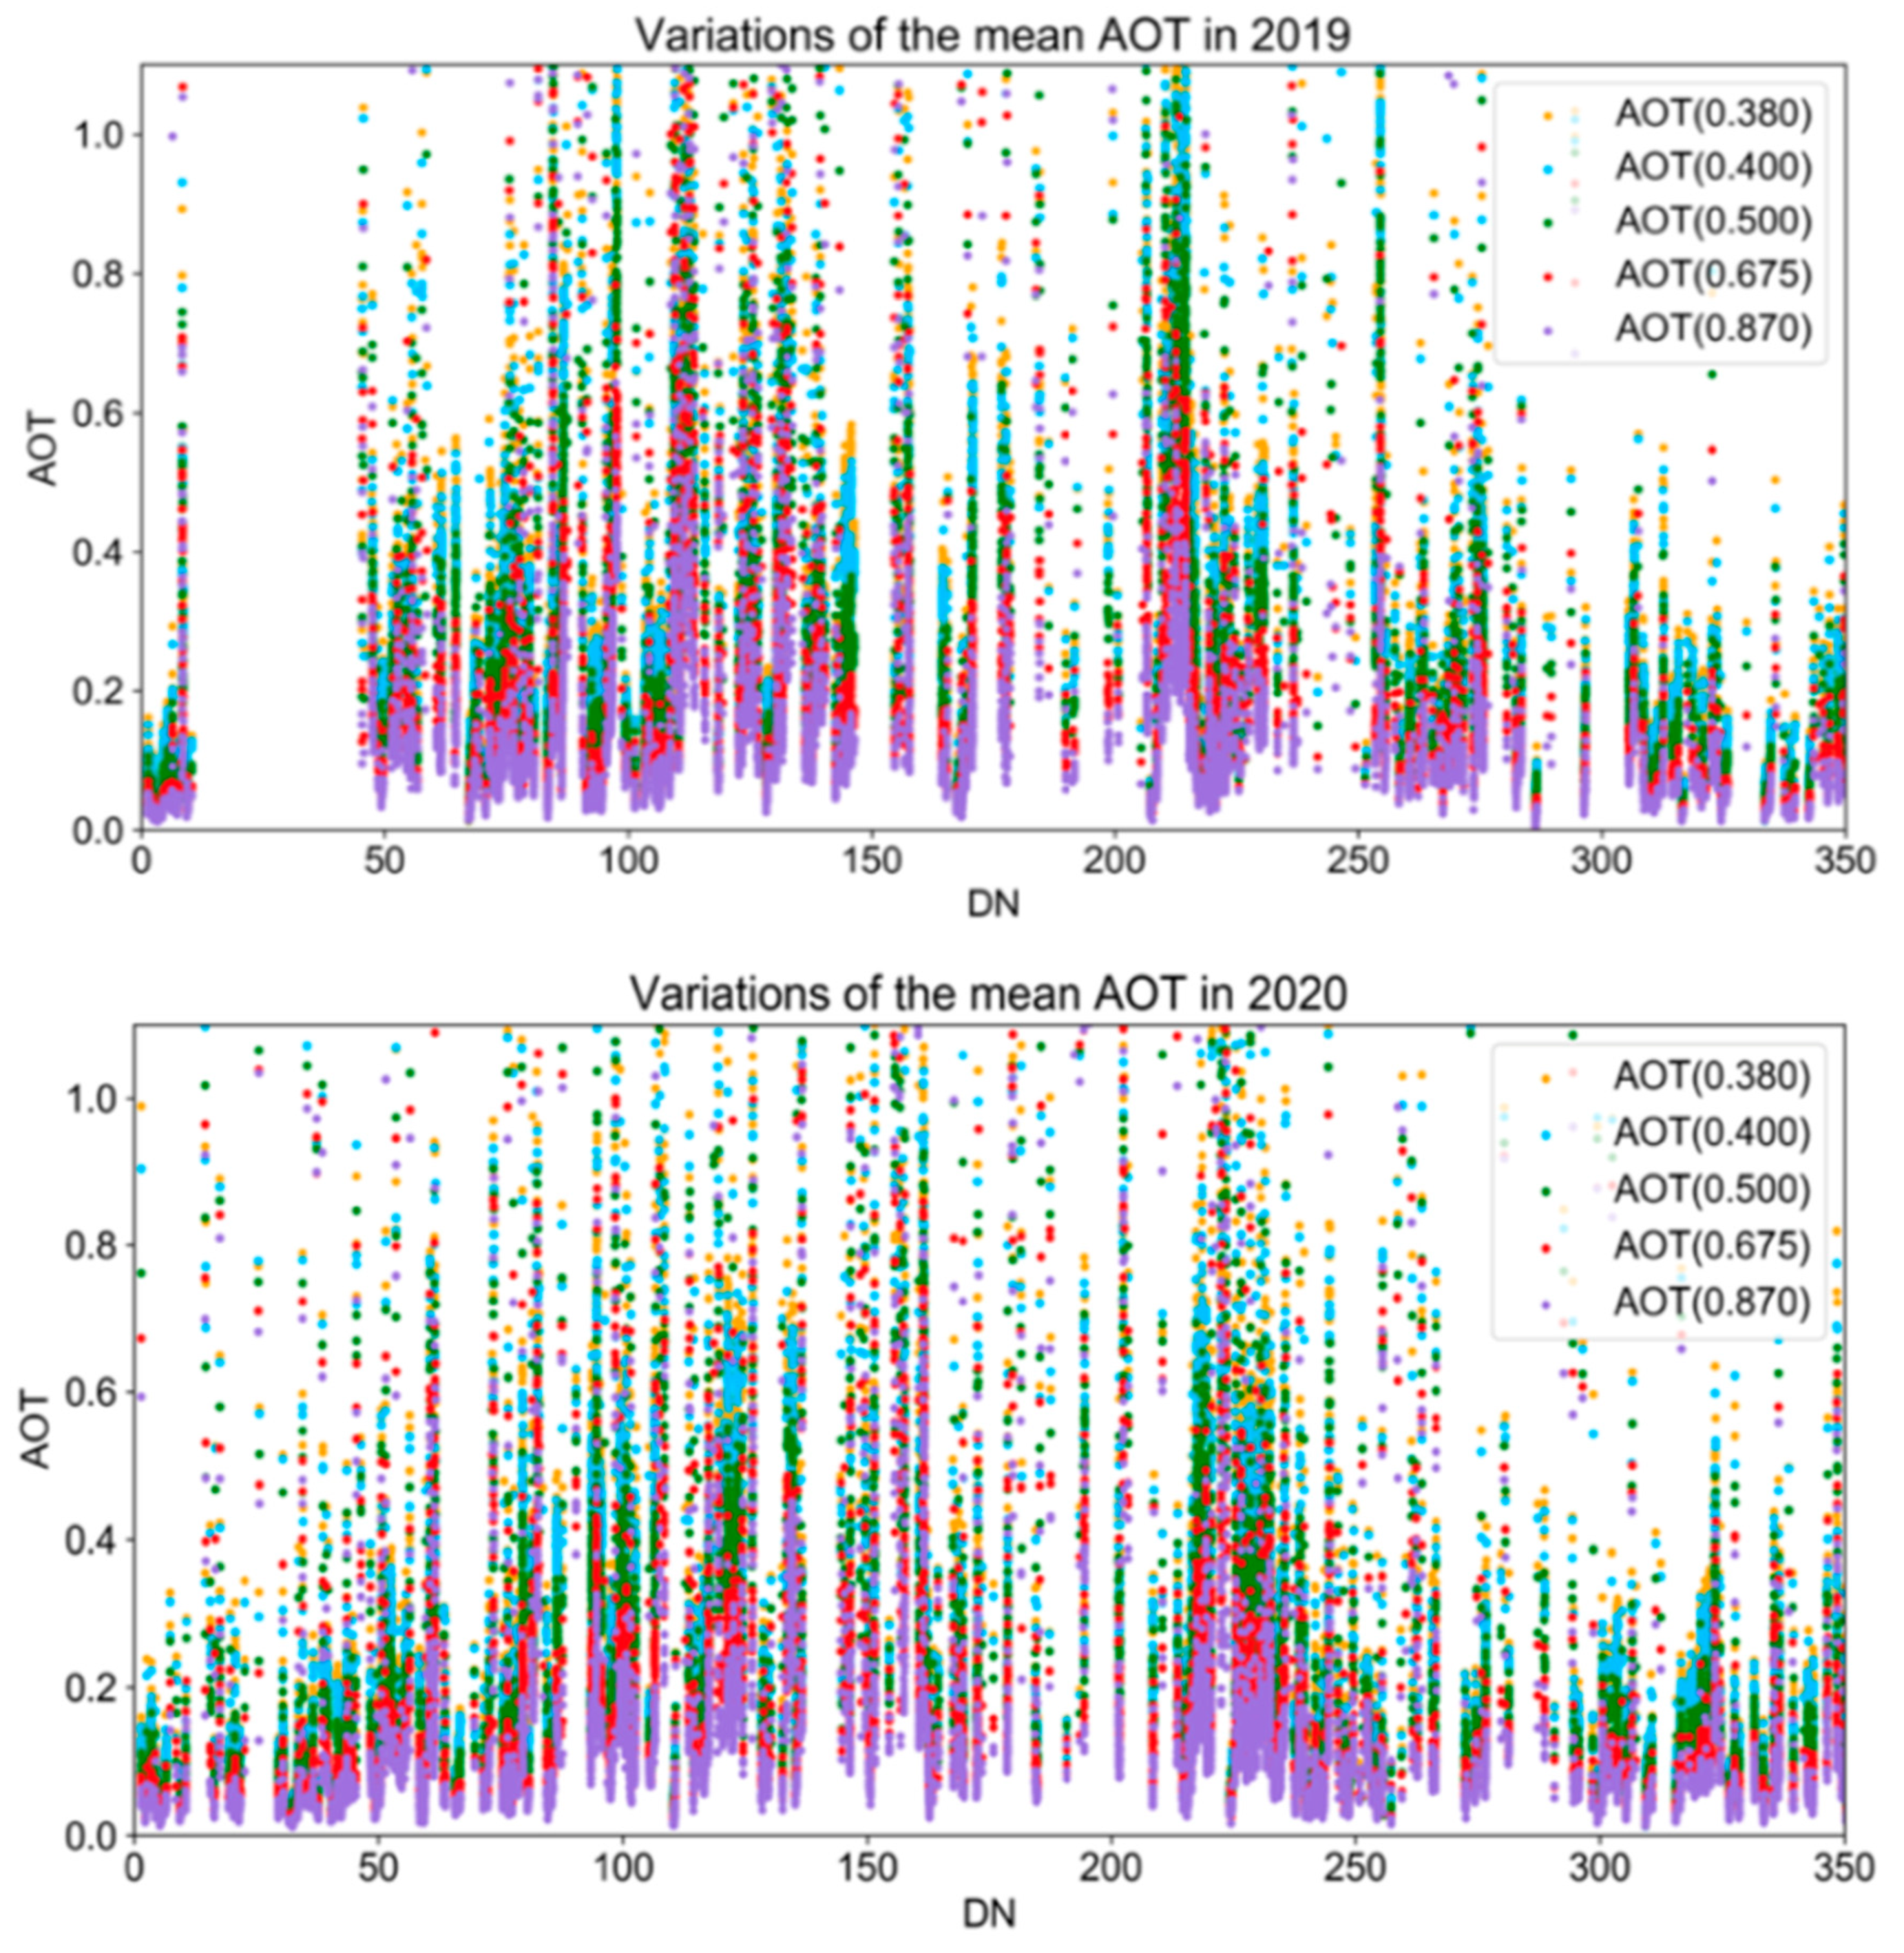
Figure 12.
Temporal variation of AOTs observed with the sky-radiometer from various wavelengths (data are from 2018, 2019, and 2020, respectively).
Figure 12.
Temporal variation of AOTs observed with the sky-radiometer from various wavelengths (data are from 2018, 2019, and 2020, respectively).


Figure 13.
AOT distributions from Landsat-8 on 6 January 2020. The location of CEReS is indicated by the red dot, where the AOT values have been calculated.
Figure 13.
AOT distributions from Landsat-8 on 6 January 2020. The location of CEReS is indicated by the red dot, where the AOT values have been calculated.


Table 1.
Datasets of the Himawari-8 AHI image angle profile.
| Date | Solar Azimuth/° | Solar Elevation/° | Solar Zenith/° |
|---|---|---|---|
| 6 January 2020 | 159.80 | 29.01 | 0.485 |
| 4 April 2020 | 146.06 | 55.63 | 0.825 |
| 2 July 2020 | 122.86 | 69.37 | 0.936 |
| 2 October 2020 | 157.11 | 48.16 | 0.745 |
| 4 January 2019 | 160.06 | 28.89 | 0.483 |
| 6 April 2019 | 145.81 | 56.09 | 0.830 |
| 31 July 2019 | 130.30 | 65.66 | 0.911 |
| 9 October 2019 | 158.84 | 46.02 | 0.719 |
| 2 January 2018 | 160.32 | 28.78 | 0.482 |
| 20 April 2018 | 142.54 | 61.04 | 0.875 |
| 4 July 2018 | 122.99 | 69.25 | 0.935 |
| 28 October 2018 | 162.61 | 39.58 | 0.637 |
Table 2.
Input variables and parameters for 6S model.
| Variables | Input Parameters |
|---|---|
| Solar zenith angle | From 0 to 72, step 6 |
| View zenith angle | From 0 to 72, step 6 |
| Relative azimuth angle | From 0 to 180, step 12 |
| Atmospheric model | Mid-latitude winter/summer |
| Aerosol Type | Custom, Rural, Maritime, Urban |
| Aerosol Optical Thickness (AOT@550 nm) | From 0 to 1, step 0.1 |
| Spectral condition | SRF of Himawari-8 visible bands |
Publisher’s Note: MDPI stays neutral with regard to jurisdictional claims in published maps and institutional affiliations. |
© 2021 by the authors. Licensee MDPI, Basel, Switzerland. This article is an open access article distributed under the terms and conditions of the Creative Commons Attribution (CC BY) license (https://creativecommons.org/licenses/by/4.0/).
Share and Cite
MDPI and ACS Style
Xue, Z.; Kuze, H.; Irie, H. Retrieval of Aerosol Optical Thickness with Custom Aerosol Model Using SKYNET Data over the Chiba Area. Atmosphere 2021, 12, 1144. https://doi.org/10.3390/atmos12091144
AMA Style
Xue Z, Kuze H, Irie H. Retrieval of Aerosol Optical Thickness with Custom Aerosol Model Using SKYNET Data over the Chiba Area. Atmosphere. 2021; 12(9):1144. https://doi.org/10.3390/atmos12091144
Chicago/Turabian StyleXue, Zixuan, Hiroaki Kuze, and Hitoshi Irie. 2021. "Retrieval of Aerosol Optical Thickness with Custom Aerosol Model Using SKYNET Data over the Chiba Area" Atmosphere 12, no. 9: 1144. https://doi.org/10.3390/atmos12091144
Note that from the first issue of 2016, this journal uses article numbers instead of page numbers. See further details here.