
Association of Dietary Vitamin D Intake, Serum 25(OH)D3, 25(OH)D2 with Cognitive Performance in the Elderly


Abstract
:1. Introduction
2. Materials and Methods
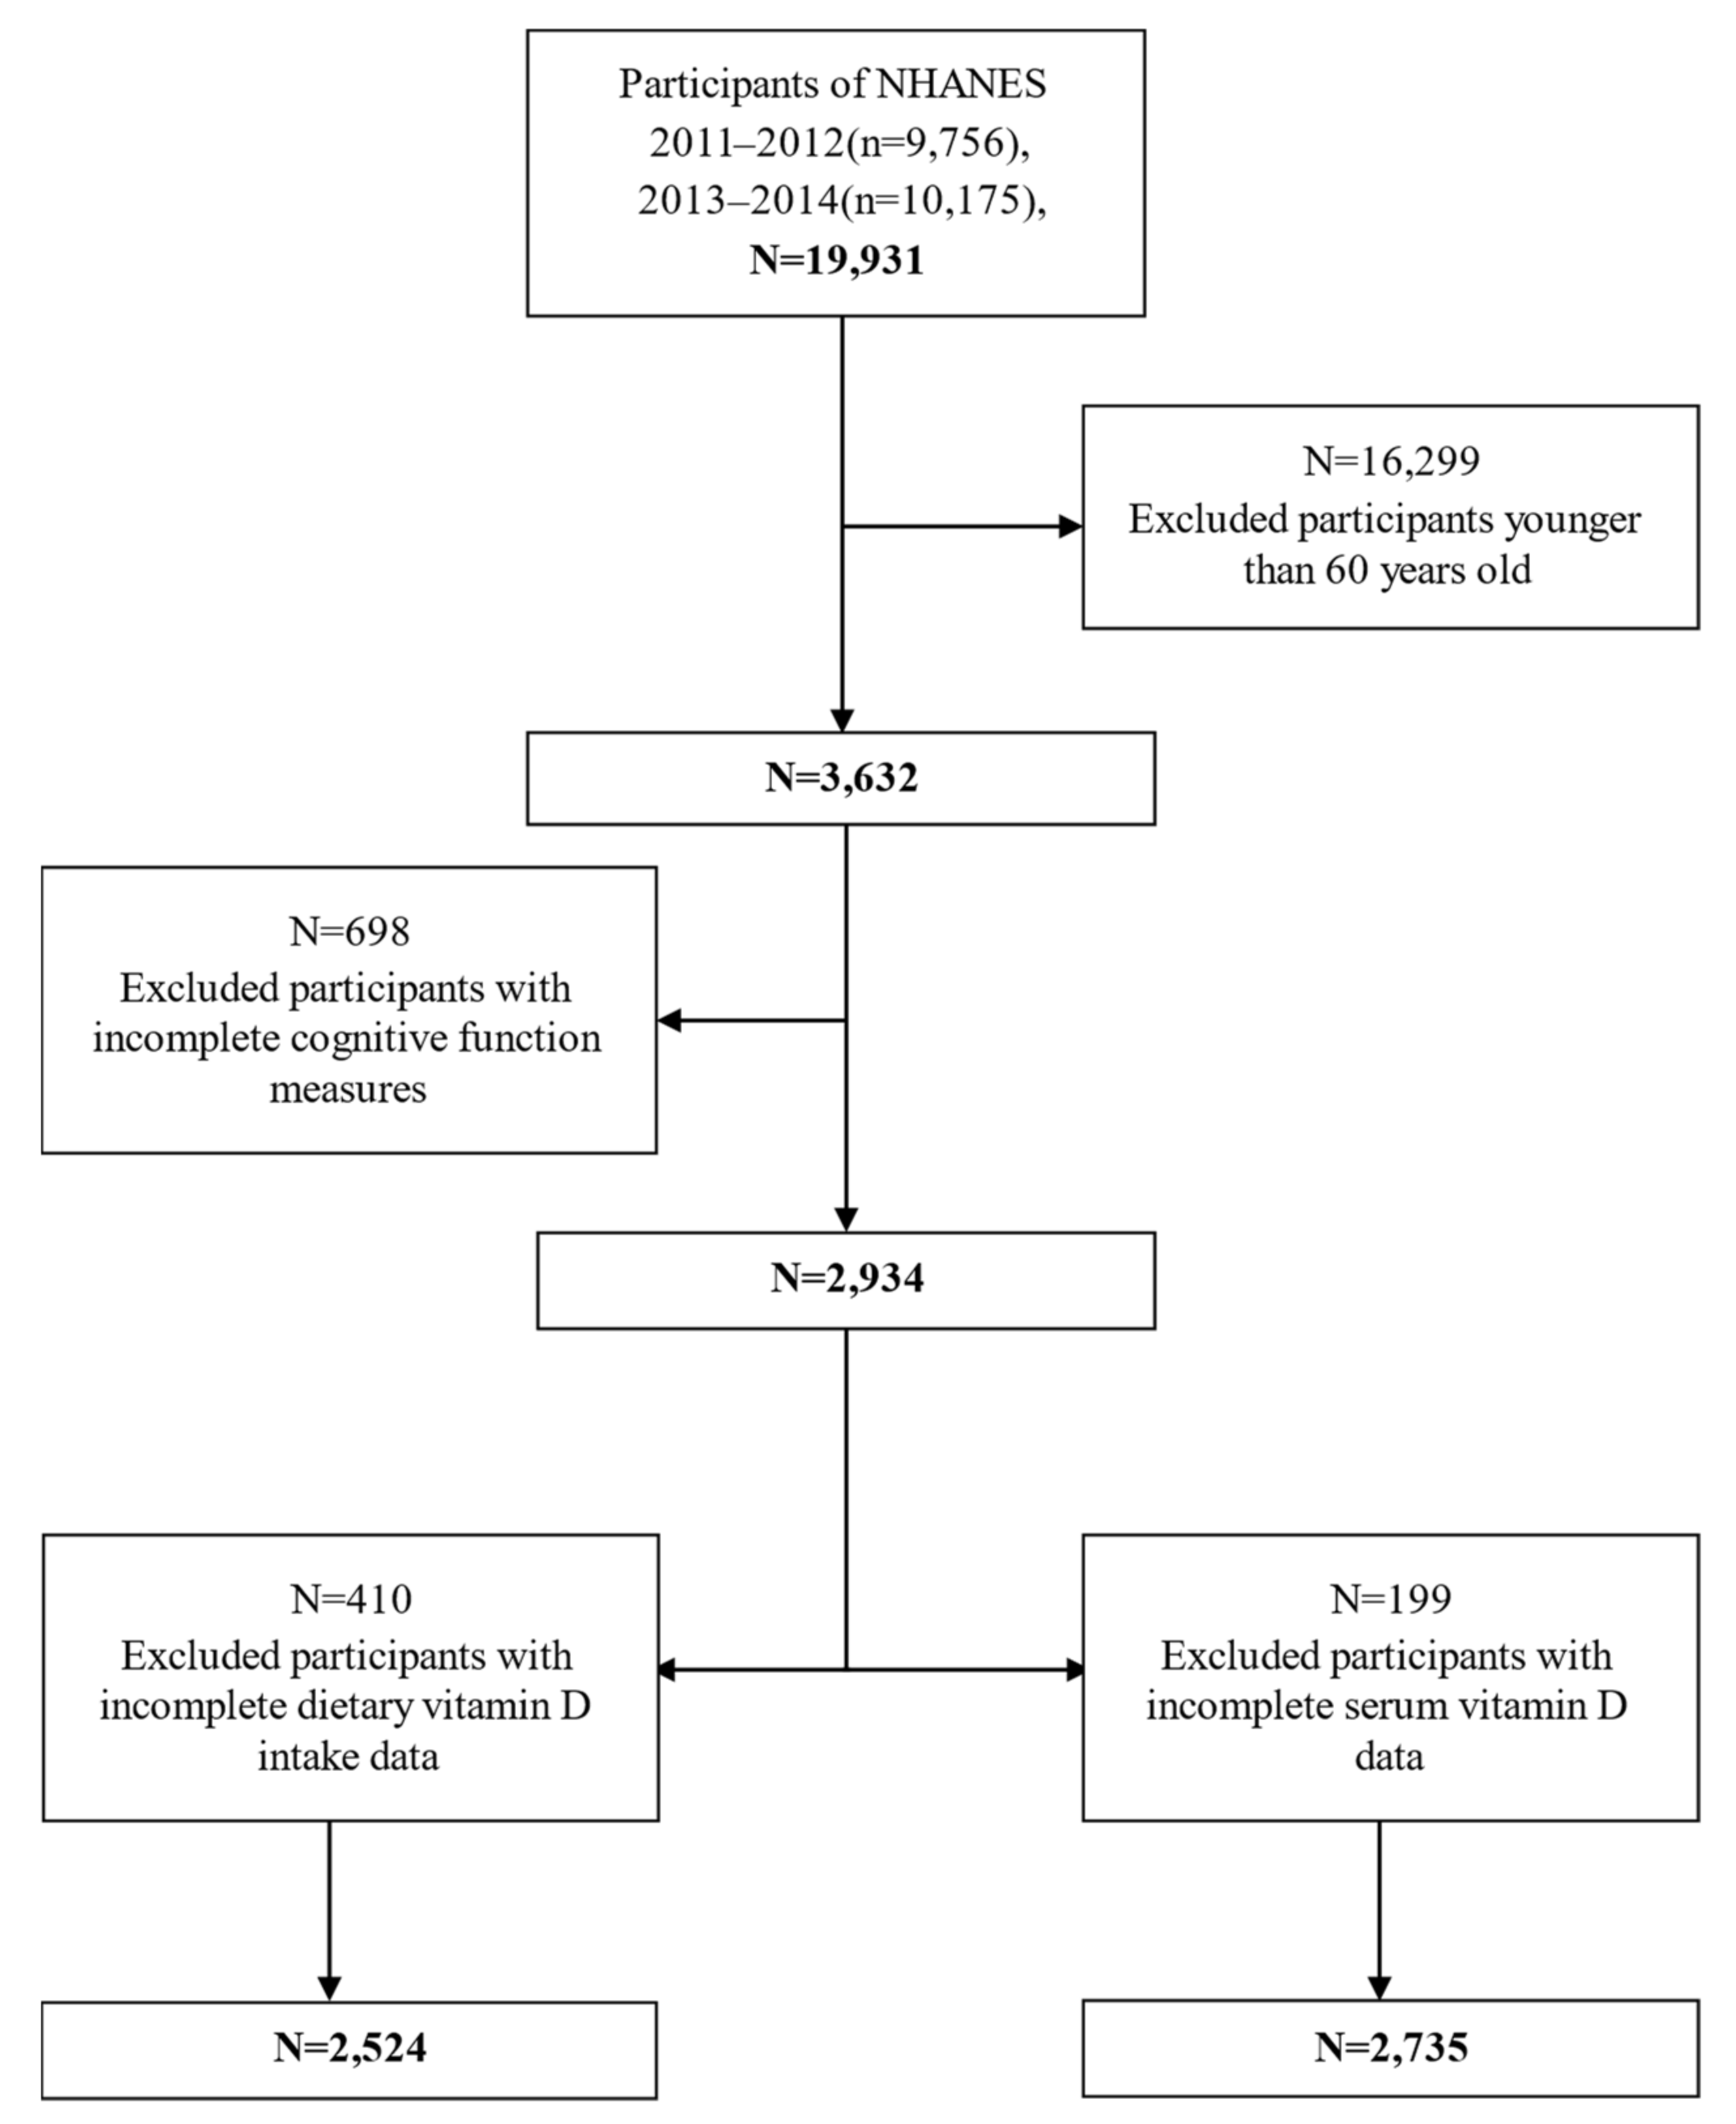
2.1. Study Population
2.2. Cognitive Performance
2.3. The Intake of Dietary VD
2.4. Laboratory Measurement of 25(OH)D
2.5. Covariates
2.6. Statistical Analysis
3. Results
3.1. Sample Characteristics
3.2. Association between Dietary VD and Cognition
3.3. Association between Serum Total 25(OH)D and Cognition
3.4. Association between Serum 25(OH)D2, 25(OH)D3 and Cognition
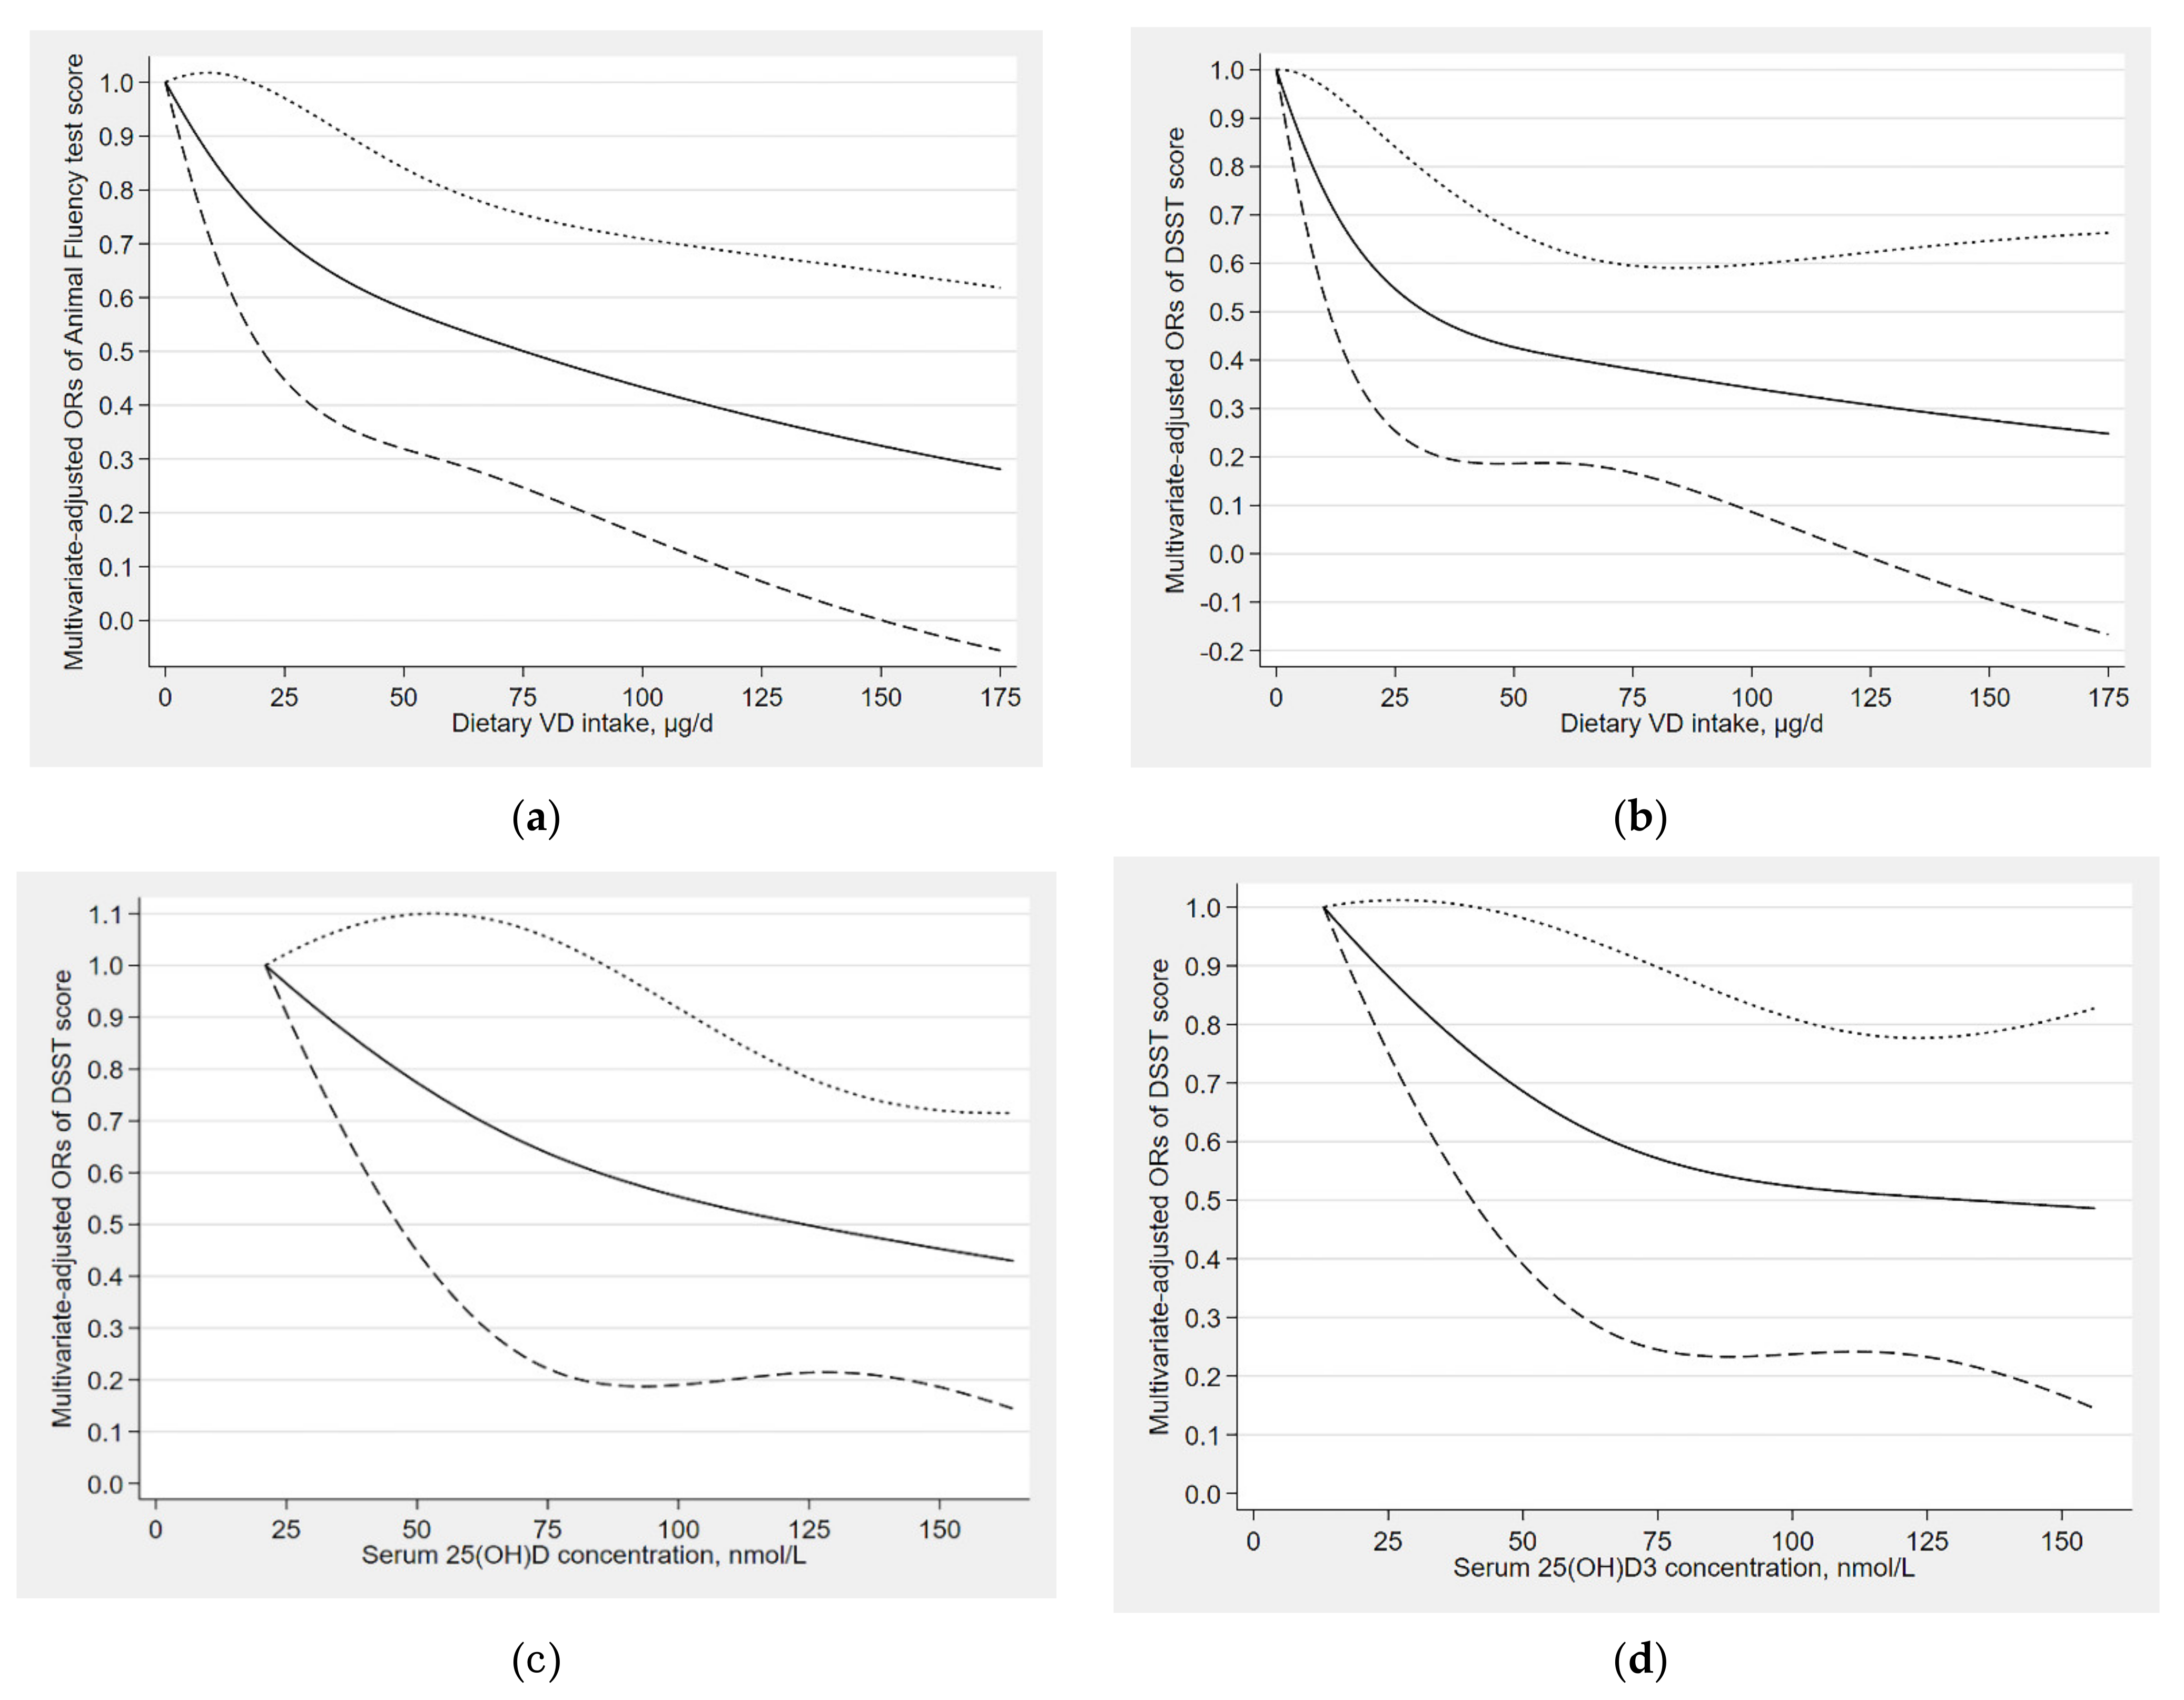
3.5. Dose–Response Relationships
4. Discussion
5. Conclusions
Author Contributions
Funding
Institutional Review Board Statement
Informed Consent Statement
Data Availability Statement
Acknowledgments
Conflicts of Interest
References
- Hebert, L.E.; Weuve, J.; Scherr, P.A.; Evans, D.A. Alzheimer disease in the United States (2010–2050) estimated using the 2010 census. Neurology 2013, 80, 1778–1783. [Google Scholar] [CrossRef] [PubMed] [Green Version]
- Afzal, S.; Bojesen, S.E.; Nordestgaard, B.G. Reduced 25-hydroxyvitamin D and risk of Alzheimer’s disease and vascular dementia. Alzheimers Dement. J. Alzheimer’s Assoc. 2014, 10, 296–302. [Google Scholar] [CrossRef] [PubMed]
- Jaroudi, W.; Garami, J.; Garrido, S.; Hornberger, M.; Keri, S.; Moustafa, A.A. Factors underlying cognitive decline in old age and Alzheimer’s disease: The role of the hippocampus. Rev. Neurosci. 2017, 28, 705–714. [Google Scholar] [CrossRef] [PubMed] [Green Version]
- Dong, X.; Li, S.; Sun, J.; Li, Y.; Zhang, D. Association of Coffee, Decaffeinated Coffee and Caffeine Intake from Coffee with Cognitive Performance in Older Adults: National Health and Nutrition Examination Survey (NHANES) 2011-2014. Nutrients 2020, 12, 840. [Google Scholar] [CrossRef] [PubMed] [Green Version]
- Travica, N.; Ried, K.; Sali, A.; Scholey, A.; Hudson, I.; Pipingas, A. Vitamin C Status and Cognitive Function: A Systematic Review. Nutrients 2017, 9, 960. [Google Scholar] [CrossRef]
- Dusso, A.S.; Brown, A.J.; Slatopolsky, E. Vitamin D. Am. J. Physiol. Ren. Physiol. 2005, 289, F8–F28. [Google Scholar] [CrossRef] [PubMed]
- Aspell, N.; Lawlor, B.; O’Sullivan, M. Is there a role for vitamin D in supporting cognitive function as we age? Proc. Nutr. Soc. 2018, 77, 124–134. [Google Scholar] [CrossRef]
- Olsson, E.; Byberg, L.; Karlström, B.; Cederholm, T.; Melhus, H.; Sjögren, P.; Kilander, L. Vitamin D is not associated with incident dementia or cognitive impairment: An 18-y follow-up study in community-living old men. Am. J. Clin. Nutr. 2017, 105, 936–943. [Google Scholar] [CrossRef]
- Lips, P. Worldwide status of vitamin D nutrition. J. Steroid. Biochem. Mol. Biol. 2010, 121, 297–300. [Google Scholar] [CrossRef]
- Annweiler, C.; Schott, A.M.; Rolland, Y.; Blain, H.; Herrmann, F.R.; Beauchet, O. Dietary intake of vitamin D and cognition in older women: A large population-based study. Neurology 2010, 75, 1810–1816. [Google Scholar] [CrossRef]
- Brouwer-Brolsma, E.M.; van de Rest, O.; Tieland, M.; van der Zwaluw, N.L.; Steegenga, W.T.; Adam, J.J.; van Loon, L.J.; Feskens, E.J.; de Groot, L.C. Serum 25-hydroxyvitamin D is associated with cognitive executive function in Dutch prefrail and frail elderly: A cross-sectional study exploring the associations of 25-hydroxyvitamin D with glucose metabolism, cognitive performance and depression. J. Am. Med. Dir. Assoc. 2013, 14, 852.e9–852.e17. [Google Scholar] [CrossRef]
- Da Rosa, M.I.; Beck, W.O.; Colonetti, T.; Budni, J.; Falchetti, A.C.B.; Colonetti, L.; Coral, A.S.; Meller, F.O. Association of vitamin D and vitamin B(12) with cognitive impairment in elderly aged 80 years or older: A cross-sectional study. J. Hum. Nutr. Diet. Off. J. Br. Diet. Assoc. 2019, 32, 518–524. [Google Scholar] [CrossRef] [PubMed]
- Navarrete-Reyes, A.P.; García-Muñoz, I.; García-Lara, J.M.; Torres-Carrillo, N.M.; Amieva, H.; Avila-Funes, J.A. 25-OH-Vitamin D Is Not Associated with Cognitive Performance among Mexican Community-Dwelling Older Persons. J. Frailty Aging 2015, 4, 74–79. [Google Scholar] [CrossRef] [PubMed]
- Lau, H.; Mat Ludin, A.F.; Rajab, N.F.; Shahar, S. Identification of Neuroprotective Factors Associated with Successful Ageing and Risk of Cognitive Impairment among Malaysia Older Adults. Curr. Gerontol. Geriatr. Res. 2017, 2017, 4218756. [Google Scholar] [CrossRef] [Green Version]
- Goodwill, A.M.; Szoeke, C. A Systematic Review and Meta-Analysis of The Effect of Low Vitamin D on Cognition. J. Am. Geriatr. Soc. 2017, 65, 2161–2168. [Google Scholar] [CrossRef]
- Duchaine, C.S.; Talbot, D.; Nafti, M.; Giguère, Y.; Dodin, S.; Tourigny, A.; Carmichael, P.H.; Laurin, D. Vitamin D status, cognitive decline and incident dementia: The Canadian Study of Health and Aging. Can. J. Public Health Rev. Can. De Sante Publique 2020, 111, 312–321. [Google Scholar] [CrossRef]
- Chei, C.L.; Raman, P.; Yin, Z.X.; Shi, X.M.; Zeng, Y.; Matchar, D.B. Vitamin D levels and cognition in elderly adults in China. J. Am. Geriatr. Soc. 2014, 62, 2125–2129. [Google Scholar] [CrossRef] [Green Version]
- Annweiler, C.; Rolland, Y.; Schott, A.M.; Blain, H.; Vellas, B.; Herrmann, F.R.; Beauchet, O. Higher vitamin D dietary intake is associated with lower risk of alzheimer’s disease: A 7-year follow-up. J. Gerontol. Ser. A Biol. Sci. Med. Sci. 2012, 67, 1205–1211. [Google Scholar] [CrossRef] [PubMed] [Green Version]
- Palacios, N.; Scott, T.; Sahasrabudhe, N.; Gao, X.; Tucker, K.L. Serum vitamin D and cognition in a cohort of Boston-area Puerto Ricans. Nutr. Neurosci. 2020, 23, 688–695. [Google Scholar] [CrossRef] [PubMed]
- Castle, M.; Fiedler, N.; Pop, L.C.; Schneider, S.J.; Schlussel, Y.; Sukumar, D.; Hao, L.; Shapses, S.A. Three Doses of Vitamin D and Cognitive Outcomes in Older Women: A Double-Blind Randomized Controlled Trial. J. Gerontol. Ser. A Biol. Sci. Med. Sci. 2020, 75, 835–842. [Google Scholar] [CrossRef]
- NHANES 2011 2012: Vitamin D Data Documentation, Codebook, and Frequencies. Available online: https://wwwn.cdc.gov/nchs/nhanes/vitamind/analyticalnote.aspx?h=/Nchs/Nhanes/2011-2012/VID_G.htm&t=VID_G%20Doc (accessed on 23 August 2021).
- Swanson, C.M.; Nielson, C.M.; Shrestha, S.; Lee, C.G.; Barrett-Connor, E.; Jans, I.; Cauley, J.A.; Boonen, S.; Bouillon, R.; Vanderschueren, D.; et al. Higher 25(OH)D2 is associated with lower 25(OH)D3 and 1,25(OH)2D3. J. Clin. Endocrinol. Metab. 2014, 99, 2736–2744. [Google Scholar] [CrossRef] [Green Version]
- Romagnoli, E.; Mascia, M.L.; Cipriani, C.; Fassino, V.; Mazzei, F.; D’Erasmo, E.; Carnevale, V.; Scillitani, A.; Minisola, S. Short and long-term variations in serum calciotropic hormones after a single very large dose of ergocalciferol (vitamin D2) or cholecalciferol (vitamin D3) in the elderly. J. Clin. Endocrinol. Metab. 2008, 93, 3015–3020. [Google Scholar] [CrossRef] [PubMed]
- National Health and Nutrition Examination Survey Cognitive Functioning. Available online: https://wwwn.cdc.gov/Nchs/Nhanes/2011-2012/CFQ_G.htm (accessed on 23 August 2021).
- Chen, S.P.; Bhattacharya, J.; Pershing, S. Association of Vision Loss With Cognition in Older Adults. JAMA Ophthalmol. 2017, 135, 963–970. [Google Scholar] [CrossRef] [PubMed]
- Li, S.; Sun, W.; Zhang, D. Association of Zinc, Iron, Copper, and Selenium Intakes with Low Cognitive Performance in Older Adults: A Cross-Sectional Study from National Health and Nutrition Examination Survey (NHANES). J. Alzheimer’s Dis. JAD 2019, 72, 1145–1157. [Google Scholar] [CrossRef]
- National Health and Nutrition Examination Survey. Measuring Guides for the Dietary Recall Interview. Available online: https://www.cdc.gov/nchs/nhanes/measuring_guides_dri/measuringguides.htm (accessed on 28 June 2021).
- Guidelines on Food Fortification with Micronutrients. Available online: https://www.who.int/publications/i/item/9241594012 (accessed on 28 June 2021).
- NHANES 2011–2012 Laboratory Data Overview. Available online: https://wwwn.cdc.gov/nchs/nhanes/search/datapage.aspx?Component=Laboratory&CycleBeginYear=2011 (accessed on 28 June 2021).
- Laboratory Procedure Manual. Available online: https://wwwn.cdc.gov/nchs/data/nhanes/2011-2012/labmethods/vid_g_met_vitamin_d.pdf (accessed on 28 June 2021).
- NHANES Analytical Note for 25 Hydroxyvitamin D Data Analysis. Available online: https://wwwn.cdc.gov/nchs/nhanes/vitamind/analyticalnote.aspx?h=/Nchs/Nhanes/2011 (accessed on 23 August 2021).
- Bouillon, R.; Van Schoor, N.M.; Gielen, E.; Boonen, S.; Mathieu, C.; Vanderschueren, D.; Lips, P. Optimal vitamin D status: A critical analysis on the basis of evidence-based medicine. J. Clin. Endocrinol. Metab. 2013, 98, E1283–E1304. [Google Scholar] [CrossRef] [Green Version]
- Holick, M.F.; Binkley, N.C.; Bischoff-Ferrari, H.A.; Gordon, C.M.; Hanley, D.A.; Heaney, R.P.; Murad, M.H.; Weaver, C.M. Evaluation, treatment, and prevention of vitamin D deficiency: An Endocrine Society clinical practice guideline. J. Clin. Endocrinol. Metab. 2011, 96, 1911–1930. [Google Scholar] [CrossRef] [PubMed] [Green Version]
- Ross, A.C.; Manson, J.E.; Abrams, S.A.; Aloia, J.F.; Brannon, P.M.; Clinton, S.K.; Durazo-Arvizu, R.A.; Gallagher, J.C.; Gallo, R.L.; Jones, G.; et al. The 2011 report on dietary reference intakes for calcium and vitamin D from the Institute of Medicine: What clinicians need to know. J. Clin. Endocrinol. Metab. 2011, 96, 53–58. [Google Scholar] [CrossRef] [PubMed]
- Centers for Disease, Control, and Prevention. National Health and Nutrition Examination Survey. Demographic Data and Related Documentation. Available online: https://wwwn.cdc.gov/Nchs/Nhanes/2011-2012/DEMO_G.htm (accessed on 28 June 2021).
- Peeri, N.C.; Egan, K.M.; Chai, W.; Tao, M.H. Association of magnesium intake and vitamin D status with cognitive function in older adults: An analysis of US National Health and Nutrition Examination Survey (NHANES) 2011 to 2014. Eur. J. Nutr. 2021, 60, 465–474. [Google Scholar] [CrossRef]
- NHANES Tutorials Module 3 Weighting. Available online: https://wwwn.cdc.gov/nchs/nhanes/tutorials/Module3.aspx (accessed on 28 June 2021).
- Beydoun, M.A.; Hossain, S.; Fanelli-Kuczmarski, M.T.; Beydoun, H.A.; Canas, J.A.; Evans, M.K.; Zonderman, A.B. Vitamin D Status and Intakes and Their Association With Cognitive Trajectory in a Longitudinal Study of Urban Adults. J. Clin. Endocrinol. Metab. 2018, 103, 1654–1668. [Google Scholar] [CrossRef] [Green Version]
- Rossom, R.C.; Espeland, M.A.; Manson, J.E.; Dysken, M.W.; Johnson, K.C.; Lane, D.S.; LeBlanc, E.S.; Lederle, F.A.; Masaki, K.H.; Margolis, K.L. Calcium and vitamin D supplementation and cognitive impairment in the women’s health initiative. J. Am. Geriatr. Soc. 2012, 60, 2197–2205. [Google Scholar] [CrossRef] [PubMed]
- Przybelski, R.; Agrawal, S.; Krueger, D.; Engelke, J.A.; Walbrun, F.; Binkley, N. Rapid correction of low vitamin D status in nursing home residents. Osteoporos. Int. A J. Establ. Result Coop. Between Eur. Found. Osteoporos. Natl. Osteoporos. Found. USA 2008, 19, 1621–1628. [Google Scholar] [CrossRef] [PubMed]
- Littlejohns, T.J.; Henley, W.E.; Lang, I.A.; Annweiler, C.; Beauchet, O.; Chaves, P.H.; Fried, L.; Kestenbaum, B.R.; Kuller, L.H.; Langa, K.M.; et al. Vitamin D and the risk of dementia and Alzheimer disease. Neurology 2014, 83, 920–928. [Google Scholar] [CrossRef] [PubMed] [Green Version]
- Feart, C.; Helmer, C.; Merle, B.; Herrmann, F.R.; Annweiler, C.; Dartigues, J.F.; Delcourt, C.; Samieri, C. Associations of lower vitamin D concentrations with cognitive decline and long-term risk of dementia and Alzheimer’s disease in older adults. Alzheimers Dement. J. Alzheimer’s Assoc. 2017, 13, 1207–1216. [Google Scholar] [CrossRef]
- Landel, V.; Annweiler, C.; Millet, P.; Morello, M.; Féron, F. Vitamin D, Cognition and Alzheimer’s Disease: The Therapeutic Benefit is in the D-Tails. J. Alzheimer’s Dis. JAD 2016, 53, 419–444. [Google Scholar] [CrossRef] [Green Version]
- Ouma, S.; Suenaga, M.; Bölükbaşı Hatip, F.F.; Hatip-Al-Khatib, I.; Tsuboi, Y.; Matsunaga, Y. Serum vitamin D in patients with mild cognitive impairment and Alzheimer’s disease. Brain Behav. 2018, 8, e00936. [Google Scholar] [CrossRef] [Green Version]
- Morello, M.; Landel, V.; Lacassagne, E.; Baranger, K.; Annweiler, C.; Féron, F.; Millet, P. Vitamin D Improves Neurogenesis and Cognition in a Mouse Model of Alzheimer’s Disease. Mol. Neurobiol. 2018, 55, 6463–6479. [Google Scholar] [CrossRef] [PubMed] [Green Version]
- Owusu, J.E.; Islam, S.; Katumuluwa, S.S.; Stolberg, A.R.; Usera, G.L.; Anwarullah, A.A.; Shieh, A.; Dhaliwal, R.; Ragolia, L.; Mikhail, M.B.; et al. Cognition and Vitamin D in Older African-American Women- Physical performance and Osteoporosis prevention with vitamin D in older African Americans Trial and Dementia. J. Am. Geriatr. Soc. 2019, 67, 81–86. [Google Scholar] [CrossRef] [Green Version]
- Annweiler, C.; Rolland, Y.; Schott, A.M.; Blain, H.; Vellas, B.; Beauchet, O. Serum vitamin D deficiency as a predictor of incident non-Alzheimer dementias: A 7-year longitudinal study. Dement. Geriatr. Cogn. Disord. 2011, 32, 273–278. [Google Scholar] [CrossRef]
- Mayne, P.E.; Burne, T.H.J. Vitamin D in Synaptic Plasticity, Cognitive Function, and Neuropsychiatric Illness. Trends Neurosci. 2019, 42, 293–306. [Google Scholar] [CrossRef] [PubMed]

| CERAD Test Score | Animal Fluency Test Score | Digit Symbol Test Score | |
|---|---|---|---|
| Dietary VD intake (μg/d) | |||
| ≥60 years | 23 | 14 | 38 |
| ≥70 years | 19 | 12 | 31 |
| Serum 25-hydroxyvitamin D (nmol/L) | |||
| ≥60 years | 22 | 14 | 37 |
| ≥70 years | 19 | 12 | 30 |
| CERAD Test | Animal Fluency Test | Digit Symbol Test | ||||||||
|---|---|---|---|---|---|---|---|---|---|---|
| Number of Subjects (N) | Normal Cognitive Performance | Low Cognitive Performance | p-Value | Normal Cognitive Performance | Low Cognitive Performance | p-Value | Normal Cognitive Performance | Low Cognitive Performance | p-Value | |
| Number of subjects (%) | 1806(71.6) | 718(28.4) | 1792(71.0) | 731(29.0) | 1867(74.0) | 647(26.0) | ||||
| Age(%) 1 | 2524 | 0.028 | 0.415 | 0.993 | ||||||
| ≥60 years | 954(52.8) | 414(57.7) | 962(53.7) | 406(55.5) | 1012(54.2) | 356(54.2) | ||||
| ≥70 years | 852(47.2) | 304(42.3) | 830(46.3) | 326(44.5) | 855(45.8) | 301(45.8) | ||||
| Gender(%) 1 | 2524 | <0.01 | 0.664 | <0.01 | ||||||
| Male | 785(43.5) | 432(60.2) | 869(48.5) | 348(47.5) | 847(45.4) | 370(56.3) | ||||
| Female | 1021(56.5) | 286(39.8) | 923(51.5) | 384(52.5) | 1020(54.6) | 287(43.7) | ||||
| Race(%) 1 | 2524 | <0.01 | <0.01 | <0.01 | ||||||
| Mexican American | 129(7.1) | 82(11.4) | 149(8.3) | 62(8.5) | 119(6.4) | 92(14.0) | ||||
| Other Hispanic | 141(7.8) | 103(14.3) | 151(8.4) | 93(12.7) | 120(6.4) | 124(18.9) | ||||
| Non-Hispanic White | 971(53.8) | 298(41.5) | 1033(57.6) | 236(32.2) | 1094(58.6) | 175(26.6) | ||||
| Non-Hispanic Black | 401(22.3) | 192(26.7) | 334(18.6) | 260(35.5) | 350(18.7) | 244(37.1) | ||||
| Other races | 163(9.0) | 43(6.0) | 125(7.0) | 81(11.1) | 184(9.9) | 22(3.3) | ||||
| Educational level (%) 1 | 2522 | <0.01 | <0.01 | <0.01 | ||||||
| Below high school | 382(19.0) | 304(42.2) | 369(19.3) | 317(38.6) | 276(13.7) | 410(56.9) | ||||
| High school | 475(23.6) | 175(24.3) | 435(22.7) | 215(26.2) | 489(24.3) | 161(22.3) | ||||
| Above high school | 1158(57.5) | 241(33.5) | 1110(58.0) | 289(35.2) | 1249(62.0) | 150(20.8) | ||||
| Marital status (%) 1 | 2521 | 0.883 | 0.027 | <0.01 | ||||||
| Married/living with partner | 1060(58.8) | 419(58.4) | 1075(60.1) | 404(55.3) | 1150(61.7) | 329(50.2) | ||||
| Widowers/divorced/separated/never married | 744(41.2) | 298(42.6) | 715(39.9) | 317(44.7) | 715(38.3) | 327(49.8) | ||||
| Poverty-income ratio (%) 1 | 2333 | <0.01 | <0.01 | <0.01 | ||||||
| ≤1.00 | 228(13.6) | 145(22.0) | 219(13.1) | 154(23.2) | 192(11.1) | 181(30.4) | ||||
| ≥1.00 | 1446(86.4) | 514(78.0) | 1450(86.9) | 510(76.8) | 1545(88.9) | 415(69.6) | ||||
| Body mass index (%) 1 | 2492 | 0.163 | 0.662 | 0.886 | ||||||
| <25 kg/m2 | 466(26.1) | 195(27.6) | 465(26.6) | 196(27.5) | 491(26.5) | 170(26.7) | ||||
| <30 kg/m2 | 607(34.0) | 259(36.6) | 627(35.3) | 239(33.5) | 650(35.0) | 216(34.0) | ||||
| ≥30 kg/m2 | 712(39.9) | 253(35.8) | 686(38.6) | 279(39.1) | 715(38.5) | 250(39.3) | ||||
| Physical activity level(%) 1 | 2524 | <0.01 | <0.01 | <0.01 | ||||||
| Moderate and high | 803(44.5) | 264(36.8) | 825(46.0) | 242(33.1) | 875(46.9) | 192(29.2) | ||||
| Low | 1003(55.5) | 454(63.2) | 968(54.0) | 490(66.9) | 992(53.1) | 465(70.8) | ||||
| Season of exam (%) 1 | 2524 | 0.545 | 0.832 | 0.023 | ||||||
| November-April | 796(44.1) | 326(45.4) | 799(44.6) | 323(44.1) | 805(43.1) | 317(48.2) | ||||
| May-October | 1010(55.9) | 392(54.6) | 993(55.4) | 409(55.9) | 1128(56.0) | 340(51.8) | ||||
| Smoking status (%) 1 | 2522 | 907(50.3) | 368(51.3) | 0.658 | 915(51.1) | 360(49.2) | 0.377 | 1329(71.5) | 401(62.0) | 0.796 |
| Hypertension (%) 1 | 2522 | 1248(69.1) | 514(71.7) | 0.209 | 1212(67.7) | 550(75.1) | <0.01 | 1267(67.9) | 495(75.3) | <0.01 |
| Diabetes (%) 1 | 2524 | 467(25.9) | 232(32.3) | 0.001 | 440(24.6) | 259(35.4) | <0.01 | 443(23.7) | 256(39.0) | <0.01 |
| Stroke (%) 1 | 2519 | 107(5.9) | 62(8.6) | 0.015 | 100(5.6) | 69(9.5) | <0.01 | 94(5.0) | 75(11.4) | <0.01 |
| Had at least 12 alcohol drinks/year (%) 1 | 2506 | 1244(69.1) | 486(68.7) | 0.842 | 1271(71.3) | 459(63.4) | <0.01 | 1329(71.5) | 401(62.0) | <0.01 |
| Total energy intake (kcal/day) 2 | 2524 | 1845.71(672.87) | 1761.34(685.91) | 0.001 | 1885.32(676.43) | 1666.00(655.11) | <0.01 | 1875.86(651.83) | 1667.83(724.50) | <0.01 |
| Daily dietary VD intake (μg/d) 2 | 2524 | 25.14(47.43) | 19.04(58.55) | <0.01 | 24.95(49.71) | 19.60(53.54) | <0.01 | 26.49(57.00) | 14.60(24.79) | <0.01 |
| CERAD Test | Animal Fluency Test | Digit Symbol Test | ||||||||
|---|---|---|---|---|---|---|---|---|---|---|
| Number of Subjects (N) | Normal Cognitive Performance | Low Cognitive Performance | p-Value | Normal Cognitive Performance | Low Cognitive Performance | p-Value | Normal Cognitive Performance | Low Cognitive Performance | p-Value | |
| Number of subjects (%) | 2015(73.7) | 720(26.3) | 1914(70.0) | 821(30.0) | 2014(73.6) | 721(26.4) | ||||
| Age (%) 1 | 2735 | 0.258 | 0.449 | 0.963 | ||||||
| ≥60 years | 1110(55.1) | 379(52.6) | 1033(54.0) | 456(55.0) | 1097(54.5) | 392(54.4) | ||||
| ≥70 years | 905(44.9) | 341(47.4) | 881(46.0) | 365(44.5) | 917(45.5) | 329(45.6) | ||||
| Gender(%) 1 | 2735 | <0.01 | 0.460 | <0.01 | ||||||
| Male | 911(45.2) | 431(59.9) | 948(49.5) | 394(48.0) | 941(46.7) | 401(55.6) | ||||
| Female | 1104(54.8) | 289(40.1) | 966(50.5) | 427(52.0) | 1073(53.3) | 320(44.4) | ||||
| Race(%) 1 | 2735 | <0.01 | <0.01 | <0.01 | ||||||
| Mexican American | 160(7.9) | 81(11.3) | 169(8.8) | 72(8.8) | 137(6.8) | 104(14.4) | ||||
| Other Hispanic | 177(8.8) | 102(14.2) | 173(9.0) | 106(12.9) | 138(6.9) | 141(19.6) | ||||
| Non-Hispanic White | 1032(51.2) | 190(40.3) | 1057(55.2) | 265(32.3) | 1141(56.7) | 181(25.1) | ||||
| Non-Hispanic Black | 441(21.9) | 189(26.3) | 359(18.8) | 271(33.0) | 380(18.9) | 250(34.7) | ||||
| Other races | 205(10.2) | 58(8.1) | 156(8.2) | 107(13.0) | 218(10.8) | 45(6.2) | ||||
| Educational level (%) 1 | 2735 | <0.01 | <0.01 | <0.01 | ||||||
| Below high school | 382(19.0) | 304(42.2) | 369(19.3) | 317(38.6) | 276(13.7) | 410(56.9) | ||||
| High school | 475(23.6) | 175(24.3) | 435(22.7) | 215(26.2) | 489(24.3) | 161(22.3) | ||||
| Above high school | 1158(57.5) | 241(33.5) | 1110(58.0) | 289(35.2) | 1249(62.0) | 150(20.8) | ||||
| Marital status (%) 1 | 2733 | 0.089 | 0.020 | <0.01 | ||||||
| Married/living with partner | 1189(59.1) | 399(55.4) | 11139(59.5) | 449(54.8) | 1226(60.9) | 392(50.3) | ||||
| widowers/divorced/separated/never married | 824(40.9) | 321(44.6) | 774(40.5) | 371(45.2) | 78(39.1) | 358(49.7) | ||||
| Poverty-income ratio (%) 1 | 2509 | 0.199 | 0.928 | 0.572 | ||||||
| ≤1.00 | 318(17.1) | 96(14.9) | 292(16.5) | 122(16.4) | 312(16.7) | 102(15.8) | ||||
| ≥1.00 | 1546(82.9) | 549(85.1) | 1473(83.5) | 622(83.6) | 1551(83.3) | 544(84.2) | ||||
| Body mass index (%) 1 | 2697 | 0.178 | 0.449 | 0.675 | ||||||
| <25 kg/m2 | 535(26.9) | 205(29.0) | 508(26.8) | 232(29.0) | 543(27.2) | 197(28.2) | ||||
| <30 kg/m2 | 699(35.1) | 360(36.8) | 685(36.1) | 274(31.1) | 706(35.3) | 253(36.2) | ||||
| ≥30 kg/m2 | 757(38.0) | 241(34.1) | 705(37.1) | 293(36.7) | 749(37.5) | 249(35.6) | ||||
| Physical activity level (%) 1 | 2735 | <0.01 | <0.01 | <0.01 | ||||||
| Moderate and high | 892(44.3) | 258(35.8) | 889(46.4) | 261(31.8) | 946(47.0) | 204(28.3) | ||||
| Low | 1123(55.7) | 462(64.2) | 1025(53.6) | 560(68.2) | 1068(53.0) | 517(71.7) | ||||
| Season of exam (%) 1 | 2735 | 0.877 | 0.859 | 0.011 | ||||||
| November-April | 914(45.4) | 329(45.7) | 872(45.6) | 371(45.2) | 886(44.0) | 357(49.5) | ||||
| May-October | 1101(54.6) | 391(54.3) | 1042(54.4) | 450(54.8) | 1128(56.0) | 364(50.5) | ||||
| Smoking status (%) 1 | 2733 | 1013(50.3) | 369(51.3) | 0.669 | 969(50.7) | 413(50.3) | 0.857 | 1005(50.0) | 377(52.3) | 0.281 |
| Hypertension (%)1 | 2733 | 1381(68.6) | 514(71.5) | 0.145 | 1283(67.1) | 612(74.5) | <0.01 | 1357(67.4) | 538(74.6) | <0.01 |
| Diabetes (%) 1 | 2735 | 529(26.3) | 230(31.9) | 0.003 | 473(24.7) | 286(34.8) | <0.01 | 480(23.8) | 279(38.7) | <0.01 |
| Stroke (%) | 2730 | 115(5.7) | 72(10.0) | <0.01 | 104(5.4) | 83(10.1) | <0.01 | 105(5.2) | 82(11.4) | <0.01 |
| Had at least 12 alcohol drinks/year (%) 1 | 2689 | 1376(69.2) | 466(66.6) | 0.201 | 1339(70.9) | 503(63.8) | <0.01 | 1413(70.9) | 429(61.5) | <0.01 |
| Serum total 25(OH)D (nmol/L) 2 | 2735 | 78.17(32.02) | 72.55(30.20) | <0.01 | 78.3(31.1) | 72.68(32.84) | <0.01 | 79.06(31.33) | 69.72(31.78) | <0.01 |
| Serum 25(OH)D3 (nmol/L) 2 | 2735 | 71.38(32.31) | 65.32(29.33) | <0.01 | 71.90(31.55) | 64.91(31.37) | <0.01 | 72.43(31.62) | 62.04(30.73) | <0.01 |
| Serum 25(OH)D2 (nmol/L) 1 | 2735 | 0.076 | 0.159 | 0.45 | ||||||
| ≤1.45 | 1512(75.0) | 516(71,7) | 1434(74.9) | 594(72.4) | 1501(74.5) | 527(73.1) | ||||
| >1.45 | 503(25.0) | 204(28.3) | 480(25.1) | 227(27.6) | 513(25.5) | 194(26.9) | ||||
| Dietary VD Intake (μg/d) | Dietary VD Intake (μg/d) | |||||
| ≤5.00 | ≤20.75 | >20.75 | ≤5.00 | >5.00 | ||
| CREAD Test | Case/Participants | 265/798 | 268/888 | 185/838 | 265/798 | 453/1726 |
| Crude | 1.00 (Ref.) | 1.02 (0.80–1.30) | 0.69 (0.51–0.92) * | 1.00 (Ref.) | 0.84 (0.67–1.04) | |
| Model 1 | 1.00 (Ref.) | 0.96 (0.75–1.24) | 0.70 (0.51–0.96) * | 1.00 (Ref.) | 0.82 (0.65–1.05) | |
| Model 2 | 1.00 (Ref.) | 0.97 (0.72–1.29) | 0.83 (0.58–1.19) | 1.00 (Ref.) | 0.90 (0.69–1.17) | |
| Animal Fluency Test | Case/Participants | 284/798 | 260/888 | 188/838 | 284/798 | 448/1726 |
| Crude | 1.00 (Ref.) | 0.69 (0.49–0.97) * | 0.43 (0.34–0.55) * | 1.00 (Ref.) | 0.55 (0.43–0.70) * | |
| Model 1 | 1.00 (Ref.) | 0.67 (0.48–0.93) * | 0.41 (0.31–0.53) * | 1.00 (Ref.) | 0.53 (0.41–0.67) * | |
| Model 2 | 1.00 (Ref.) | 0.70 (0.43–1.13) | 0.51 (0.36–0.72) * | 1.00 (Ref.) | 0.60 (0.41–0.89) * | |
| Digit Symbol Test | Case/Participants | 277/798 | 247/888 | 133/838 | 277/798 | 380/1726 |
| Crude | 1.00 (Ref.) | 0.82 (0.55–1.20) | 0.36 (0.26–0.51) * | 1.00 (Ref.) | 0.56 (0.41–0.77) * | |
| Model 1 | 1.00 (Ref.) | 0.77 (0.53–1.14) | 0.34 (0.25–0.46) * | 1.00 (Ref.) | 0.53 (0.39–0.73) * | |
| Model 2 | 1.00 (Ref.) | 0.72 (0.45–1.15) | 0.45 (0.31–0.66) * | 1.00 (Ref.) | 0.59 (0.40–0.86) * | |
| CREAD Test | Animal Fluency Test | Digit Symbol Test | ||||||||||
|---|---|---|---|---|---|---|---|---|---|---|---|---|
| Case/Participants | Crude | Model 1 | Model 2 | Case/Participants | Crude | Model 1 | Model 2 | Case/Participants | Crude | Model 1 | Model 2 | |
| Dietary VD intake (μg/d) | ||||||||||||
| male | 432/1217 | 348/1217 | 370/1217 | |||||||||
| ≤5.00 | 1.00 (Ref.) | 1.00 (Ref.) | 1.00 (Ref.) | 1.00 (Ref.) | 1.00 (Ref.) | 1.00 (Ref.) | 1.00 (Ref.) | 1.00 (Ref.) | 1.00 (Ref.) | |||
| ≤20.75 | 1.04 (0.66–1.64) | 1.04 (0.66–1.64) | 1.09 (0.68–1.75) | 0.65 (0.35–1.20) | 0.64 (0.35–1.17) | 0.73 (0.37–1.44) | 0.95 (0.58–1.54) | 0.93 (0.56–1.53) | 0.90 (0.55–1.47) | |||
| >20.75 | 0.79 (0.46–1.36) | 0.79 (0.45–1.40) | 0.86 (0.44–1.68) | 0.34 (0.20–0.57) | 0.31 (0.19–0.55) | 0.38 (0.22–0.67) | 0.36 (0.23–0.58) | 0.34 (0.22–0.55) | 0.46 (0.26–0.82) | |||
| female | 286/1217 | 184/1217 | 287/1217 | |||||||||
| ≤5.00 | 1.00 (Ref.) | 1.00 (Ref.) | 1.00 (Ref.) | 1.00 (Ref.) | 1.00 (Ref.) | 1.00 (Ref.) | 1.00 (Ref.) | 1.00 (Ref.) | 1.00 (Ref.) | |||
| ≤20.75 | 0.90 (0.61–1.33) | 0.88 (0.60–1.27) | 0.80 (0.49–1.32) | 0.73 (0.50–1.06) | 0.70 (0.47–1.03) | 0.69 (0.46–1.05) | 0.66 (0.41–1.07) | 0.62 (0.39–1.00) | 0.57 (0.26–1.25) | |||
| >20.75 | 0.66 (0.42–1.02) * | 0.62 (0.42–0.93) * | 0.81 (0.53–1.23) | 0.51 (0.34–0.77) * | 0.48 (0.31–0.72) * | 0.68 (0.43–1.07) | 0.36 (0.23–0.57) * | 0.33 (0.21–0.50) * | 0.50 (0.30–0.83) * | |||
| Dietary VD intake (μg/d) | ||||||||||||
| male | 432/1217 | 348/1217 | 370/1217 | |||||||||
| ≤5.00 | 1.00 (Ref.) | 1.00 (Ref.) | 1.00 (Ref.) | 1.00 (Ref.) | 1.00 (Ref.) | 1.00 (Ref.) | 1.00 (Ref.) | 1.00 (Ref.) | 1.00 (Ref.) | |||
| >5.00 | 0.93 (0.62–1.38) | 0.93 (0.62–1.40) | 1.00 (0.64–1.56) | 0.51 (0.30–0.85) * | 0.49 (0.30–0.83) * | 0.58 (0.33–1.04) | 0.68 (0.44–1.03) | 0.65 (0.42–1.02) | 0.72 (0.47–1.10) | |||
| female | 286/1217 | 184/1217 | 287/1217 | |||||||||
| ≤5.00 | 432/1217 | 1.00 (Ref.) | 1.00 (Ref.) | 1.00 (Ref.) | 1.00 (Ref.) | 1.00 (Ref.) | 1.00 (Ref.) | 1.00 (Ref.) | 1.00 (Ref.) | 1.00 (Ref.) | ||
| >5.00 | 0.75 (0.52–1.07) | 0.72 (0.52–0.99) * | 0.81 (0.54–1.19) | 0.59 (0.41–0.85) * | 0.56 (0.38–0.81) * | 0.68 (0.47–1.00) * | 0.47 (0.32–0.69) * | 0.44 (0.30–0.63) * | 0.53 (0.31–0.93) * | |||
| Total 25-Hydroxyvitamin D (nmol/L) | ||||||||||||
| male | 431/1342 | 394/1342 | 401/1342 | |||||||||
| ≤61.41 | 1.00 (Ref.) | 1.00 (Ref.) | 1.00 (Ref.) | 1.00 (Ref.) | 1.00 (Ref.) | 1.00 (Ref.) | 1.00 (Ref.) | 1.00 (Ref.) | 1.00 (Ref.) | |||
| ≤86.30 | 0.83 (0.59–1.17) | 0.84 (0.60–1.18) | 0.99 (0.65–1.51) | 0.56 (0.39–0.85) * | 0.57 (0.38–0.85) * | 0.84 (0.54–1.30) | 0.44 (0.28–0.68) * | 0.44 (0.29–0.68) * | 0.84 (0.44–1.61) | |||
| >86.30 | 0.63 (0.43–0.93) * | 0.61 (0.41–0.89) * | 0.77 (0.46–1.31) | 0.46 (0.25–0.84) * | 0.44 (0.25–0.79) * | 0.65 (0.35–1.23) | 0.35 (0.20–0.63) * | 0.35 (0.20–0.61) * | 0.67 (0.30–1.48) | |||
| female | 289/1393 | 427/1393 | 320/1393 | |||||||||
| ≤61.41 | 1.00 (Ref.) | 1.00 (Ref.) | 1.00 (Ref.) | 1.00 (Ref.) | 1.00 (Ref.) | 1.00 (Ref.) | 1.00 (Ref.) | 1.00 (Ref.) | 1.00 (Ref.) | |||
| ≤86.30 | 1.09 (0.75–1.58) | 1.04 (0.70–1.53) | 1.01 (0.67–1.54) | 1.03 (0.69–1.55) | 0.99 (0.65–1.51) | 1.49 (0.93–2.41) | 0.84 (0.55–1.29) | 0.78 (0.50–1.23) | 1.04 (0.61–1.78) | |||
| >86.30 | 0.82 (0.58–1.15) | 0.73 (0.50–1.06) | 0.75 (0.47–1.20) | 0.83 (0.58–1.19) | 0.76 (0.53–1.07) | 1.30 (0.92–1.83) | 0.56 (0.41–0.76) * | 0.47 (0.34–0.66) * | 0.68 (0.42–1.09) | |||
| CERAD Test | Animal Fluency Test | Digit Symbol Test | ||||||||||
|---|---|---|---|---|---|---|---|---|---|---|---|---|
| Case/Participants | Crude | Model 1 | Model 2 | Case/Participants | Crude | Model 1 | Model 2 | Case/Participants | Crude | Model 1 | Model 2 | |
| Total 25-Hydroxyvitamin D (nmol/L) | ||||||||||||
| ≤61.41 | 274/911 | 1.00 (Ref.) | 1.00 (Ref.) | 1.00 (Ref.) | 326/911 | 1.00 (Ref.) | 1.00 (Ref.) | 1.00 (Ref.) | 307/911 | 1.00 (Ref.) | 1.00 (Ref.) | 1.00 (Ref.) |
| ≤86.30 | 252/915 | 0.96 (0.77–1.20) | 0.94 (0.75–1.15) | 1.02 (0.77–1.34) | 259/915 | 0.75 (0.59–0.96) * | 0.75 (0.58–0.97) * | 1.12 (0.83–1.51) | 237/915 | 0.60 (0.44–0.81) * | 0.58 (0.43–0.80) * | 0.93 (0.61–1.42) |
| >86.30 | 194/909 | 0.68 (0.53–0.87) * | 0.67 (0.52–0.86) * | 0.77 (0.55–1.08) | 236/909 | 0.64 (0.47–0.88) * | 0.59 (0.44–0.81) * | 0.95 (0.70–1.28) | 177/909 | 0.44 (0.34–0.55) * | 0.41 (0.32–0.52) * | 0.68 (0.47–0.97) * |
| 25-Hydroxyvitamin D3 (nmol/L) | ||||||||||||
| ≤55.14 | 264/911 | 1.00 (Ref.) | 1.00 (Ref.) | 1.00 (Ref.) | 334/911 | 1.00 (Ref.) | 1.00 (Ref.) | 1.00 (Ref.) | 316/911 | 1.00 (Ref.) | 1.00 (Ref.) | 1.00 (Ref.) |
| ≤80.63 | 266/913 | 1.16 (0.85–1.59) | 1.10 (0.81–1.48) | 1.23 (0.86–1.77) | 259/913 | 0.74 (0.56–0.99) * | 0.74 (0.56–0.98) * | 1.10 (0.92–1.46) | 238/913 | 0.61 (0.46–0.81) * | 0.58 (0.43–0.80) * | 0.92 (0.64–1.33) |
| >80.63 | 190/911 | 0.74 (0.53–1.03) | 0.72 (0.51–1.02) | 0.92 (0.58–1.45) | 228/911 | 0.61 (0.47–0.99) * | 0.57 (0.44–0.75) * | 0.98 (0.75–1.29) | 167/911 | 0.36 (0.29–0.46) * | 0.41 (0.32–0.52) * | 0.62 (0.44–0.86) * |
| 25-Hydroxyvitamin D2 (nmol/L) | ||||||||||||
| ≤1.45 | 516/2028 | 1.00 (Ref.) | 1.00 (Ref.) | 1.00 (Ref.) | 594/2028 | 1.00 (Ref.) | 1.00 (Ref.) | 1.00 (Ref.) | 527/2028 | 1.00 (Ref.) | 1.00 (Ref.) | 1.00 (Ref.) |
| >1.45 | 204/707 | 1.27 (0.92–1.77) | 1.30 (0.93–1.81) | 1.47 (0.98–2.22) | 227/707 | 0.99 (0.74–1.33) | 0.97 (0.72–1.29) | 1.05 (0.74–1.47) | 194/707 | 0.95 (00.73–1.25) | 0.94 (0.70–1.26) | 1.00 (0.68–1.49) |
Publisher’s Note: MDPI stays neutral with regard to jurisdictional claims in published maps and institutional affiliations. |
© 2021 by the authors. Licensee MDPI, Basel, Switzerland. This article is an open access article distributed under the terms and conditions of the Creative Commons Attribution (CC BY) license (https://creativecommons.org/licenses/by/4.0/).
Share and Cite
Wang, R.; Wang, W.; Hu, P.; Zhang, R.; Dong, X.; Zhang, D. Association of Dietary Vitamin D Intake, Serum 25(OH)D3, 25(OH)D2 with Cognitive Performance in the Elderly. Nutrients 2021, 13, 3089. https://doi.org/10.3390/nu13093089
Wang R, Wang W, Hu P, Zhang R, Dong X, Zhang D. Association of Dietary Vitamin D Intake, Serum 25(OH)D3, 25(OH)D2 with Cognitive Performance in the Elderly. Nutrients. 2021; 13(9):3089. https://doi.org/10.3390/nu13093089
Chicago/Turabian StyleWang, RuTong, Weijing Wang, Ping Hu, Ronghui Zhang, Xue Dong, and Dongfeng Zhang. 2021. "Association of Dietary Vitamin D Intake, Serum 25(OH)D3, 25(OH)D2 with Cognitive Performance in the Elderly" Nutrients 13, no. 9: 3089. https://doi.org/10.3390/nu13093089
APA StyleWang, R., Wang, W., Hu, P., Zhang, R., Dong, X., & Zhang, D. (2021). Association of Dietary Vitamin D Intake, Serum 25(OH)D3, 25(OH)D2 with Cognitive Performance in the Elderly. Nutrients, 13(9), 3089. https://doi.org/10.3390/nu13093089