Abstract
Stripe rust, caused by Puccinia striiformis f. sp. tritici (Pst), is one of the most important diseases of wheat worldwide. To understand the worldwide distribution of its molecular groups, as well as the diversity, differentiation, and migration of the Pst populations, 567 isolates collected from nine countries (China, Pakistan, Italy, Egypt, Ethiopia, Canada, Mexico, Ecuador, and the U.S.) in 2010–2018 were genotyped using 14 codominant simple sequence repeat markers. A total of 433, including 333 new multi-locus genotypes (MLGs), were identified, which were clustered into ten molecular groups (MGs). The MGs and country-wise populations differed in genetic diversity, heterozygosity, and correlation coefficient between the marker and virulence data. Many isolates from different countries, especially the isolates from Mexico, Ecuador, and the U.S., were found to be identical or closely related MLGs, and some of the MGs were present in all countries, indicating Pst migrations among different countries. The analysis of molecular variance revealed 78% variation among isolates, 12% variation among countries, and 10% variation within countries. Only low levels of differentiation were found by the pairwise comparisons of country populations. Of the 10 MGs, 5 were found to be involved in sexual and/or somatic recombination. Identical and closely related MLGs identified from different countries indicated international migrations. The study provides information on the distributions of various Pst genetic groups in different countries and evidence for the global migrations, which should be useful in understanding the pathogen evolution and in stressing the need for continual monitoring of the disease and pathogen populations at the global scale.
1. Introduction
Stripe rust (yellow rust) caused by Puccinia striiformis Westend. f. sp. tritici Erikss. (Pst) is a destructive disease across major wheat growing regions of the world [1,2,3,4,5]. Yield losses caused by stripe rust vary greatly depending upon the susceptibility of cultivars, the time point of initial infection, the rate of disease development, and the duration of the disease, but can reach up to 100% if highly susceptible cultivars are grown under extremely favorable weather conditions for stripe rust development [4,6,7,8]. Due to the capacity for rapid changes in virulent races to circumvent resistance in wheat cultivars and genotypes adapting to different environments, as well as the long-distance dissemination of Pst urediniospores via wind dispersal or human activities, stripe rust is an increasing problem threatening global wheat production [4,6,9,10,11,12,13,14,15].
In the past two decades, a series of severe epidemics caused by stripe rust were reported in large-scale regions, including East Asia, Central and West Asia, East and North Africa, Europe, western Australia, and North and South America [4,5,6,7,16,17,18,19,20]. Since 2000, new races, as well as aggressive and high temperature-adapted strains, have spread the major Pst populations worldwide and caused severe damage in terms of yield loss and cost of fungicide applications in many countries. For example, severe epidemics occurred throughout the U.S. in 2000, 2001, 2003, 2005, 2010, 2011, 2015, and 2016 [4,5,17], and in Australia in 2003–2006 [5,21]. In 2010, prevalent stripe rust caused economic losses in East Africa [20], Central and West Asia [5,19,20], and North America [5,6,7,22,23]. For example, a devastating stripe rust epidemic occurred on more than 600,000 ha of wheat in Ethiopia, which led to a cost of more than USD 3.2 million in the application of fungicides [20]; similarly in the U.S., wheat stripe rust caused the most widespread epidemic throughout the whole country in recorded history in 2010, and the extremely severe epidemic in the Pacific Northwest in 2011, which resulted in large-scale applications of foliar fungicides [5,6,7]. Since 2011, the invasive races of Pst, “Warrior” and “Kranich” largely destroyed the pre-existing NW European populations. Moreover, the “Kranich” race has been demonstrated to have a high sexual reproduction capacity under suitable conditions, leading to potential threats to wheat production worldwide [14,24,25].
To track the migration routes, determine the origin, and detect changes in genetic groups, several studies have been performed on Pst at relatively large geographic scales using different molecular markers and virulence data. Some studies have suggested that the Himalayan region or the whole Mediterranean to Asia region may be the putative center of origin of Pst, because of its high genotypic diversity, high ability for sexual reproduction, and the strong differentiation from other populations [1,13,26]. The Asian populations, including those in China, Nepal, and Pakistan, have been indicated as the possible sources of the emergence of new, virulent, and aggressive strains due to the high level of recombination, diversity, and ability for sexual reproduction, the latter of which has been reported in China in several studies [27,28,29,30,31]. Other studies have also tried to track the migration of Pst populations and the worldwide distribution of different genetic linkages [15,26,32,33]. However, recent molecular studies on the characterization of international Pst collections have been conducted mainly on isolates collected before 2010 [13,33], indicating that more recent populations must be characterized to determine whether the international Pst population has undergone any major genetic changes since 2010.
In our group, stripe rust samples are routinely collected and received from throughout the U.S., and the Pst isolates are characterized for virulence using a set of wheat differentials and for genotypes using simple sequence repeat (SSR) and other markers [4,22,23,34,35,36,37,38,39,40,41,42,43]. These studies identified a large number of virulence races and multi-locus genotypes (MLGs) in the Pst populations, as well as clonal production, relatively high diversities in some epidemiological regions and on grass hosts, differentiation and migration among different regions, and long-term dynamics for inferring evolutionary mechanisms. In addition, the roles of sexual reproduction, somatic reproduction, and mutation in Pst variation were studied by developing sexual, somatic recombinant, and mutation populations under controlled conditions, characterized by both virulence testing and molecular markers [41,42,43,44,45,46,47,48]. Our laboratory has received stripe rust samples from other countries and characterized them through virulence testing and using molecular markers [26,49,50,51,52]. Previous studies characterized Pst isolates collected from 16 countries in 2006–2010 through virulence testing [50] using co-dominant SSR markers [26]. These studies identified large numbers of races [50] and genotypes, and revealed overall high diversity and migrations among different countries [26]. Since 2010, we have received stripe rust samples from eight countries (Canada, China, Ecuador, Egypt, Ethiopia, Italy, Mexico, and Pakistan), in addition to the U.S. collections. The virulence data from the collections from Ethiopia in 2013 and 2014 [51], and those from the collections from other countries collected from 2013 to 2020, except the data from the U.S. collections from 2013 to 2020, have recently been published [52], but the molecular characterization of the foreign collections has not been published. Based on the virulence data of these collections, it was hypothesized that Pst migrations have occurred among different countries and continents in the recent years. The present study was conducted to test the hypothesis via the molecular characterization of the collections.
The specific objectives of this study were to (1) characterize the international collections of Pst since 2010 using SSR markers and identify molecular groups, (2) determine and compare the levels of genetic diversities, heterozygosity, and differentiation among different molecular groups and countries, and (3) track migrations among Pst populations among different countries. Using the molecular data, we also inferred reproduction mode and the correlation between the molecular data and previously published virulence data [51,52]. The results should provide a better understanding of stripe rust epidemiology and distribution, and the migration of the pathogen populations, as well as mechanisms of pathogen evolution.
2. Results
2.1. Multi-Locus Genotypes
A total of 433 MLGs were detected in the 567 Pst isolates using the 14 SSR loci. The allelic genotypes of the 567 isolates at the 14 marker loci and their assigned MLGs are provided in Table S1, and those of the 433 MLGs, together with the numbers of isolates and the country distribution, are given in Table S2. Among the 433 MLGs, 53 were detected in 2 to 29 isolates, and 380 each were detected in only 1 isolate. Only 15 MLGs were detected in two or more countries. Of the 433 MLGs, 100 previously identified MLGs were from the U.S. isolates used in the present study, and 333 MLGs were identified for the first time in isolates of the other countries.
2.2. Minimum Spanning Network of the MLGs
A minimum spanning network was constructed to show the country distribution and genetic relatedness among the MLGs based on the Bruvo’s distance values using a stepwise mutation model for the SSR loci (Figure 1). Most MLGs within each country were more closely clustered together, while MLGs from different countries were respectively separated. The 433 MLGs could be separated into six branches, which are labeled by the broken lines in Figure 1. In the first branch (B1), most MLGs from Italy were clustered in the center of the network and were highly connected to other MLGs from the other countries. The large branch (B2) at the bottom of the Figure contains the most diverse MLGs, mainly from China, with some from Italy, the U.S., and Mexico, and few MLGs from the remaining countries, suggesting the wide spreading of this genetic group. The MLGs from the U.S., Mexico, and Ecuador were most closely related in a separate branch (B3), suggesting frequent gene flow in the continents of North and South America, while another closely related branch (B4) mainly contained MLGs from the U.S. and Italy. Most Ethiopian MLGs formed a distinct branch (B5) that was the least related to other countries, except for another small branch (B6) of MLGs from Mexico and a few from Ecuador, Canada, and Italy.
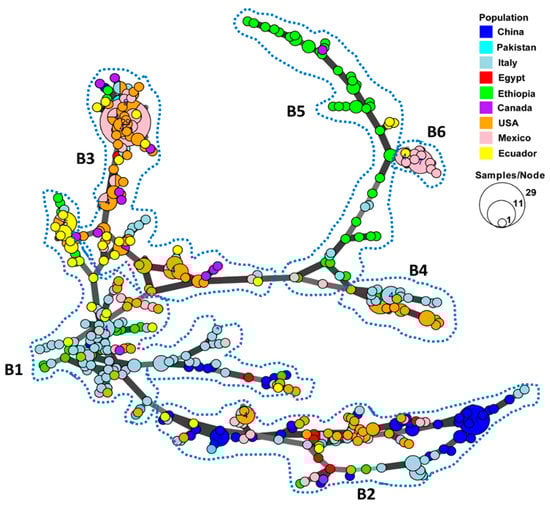
Figure 1.
Minimum spanning network showing relationships among multi-locus genotypes (MLGs) of Puccinia striiformis f. sp. tritici identified from nine countries. Each node represents a different MLG. The size of a node indicates the number of isolates in the MLG. Node colors represent countries from which the isolates were collected. Six major branches are marked by the broken close lines. B1–B6, branch 1–branch 6.
2.3. Molecular Groups (MGs)
To further determine the relationships of the collections, a hierarchical cluster analysis of the 567 isolates based on the 14 SSR markers was conducted. These isolates or the 433 MLGs were optimally clustered into ten MGs (K = 10). The isolates and MLGs in each MG are provided in Tables S1 and S2, respectively. The total number of isolates and the number of isolates in each MG are presented in Table 1. The genetic relationships and distributions in various countries of the MGs are shown in Figure 2. The number of isolates in each MG ranged from 14 (2.5%) in MG4 to 169 (29.8%) in MG9 (Table 1). MG1, MG2, and MG3 were closely related, and they formed a branch distinct from the other MGs (Figure 2). MG1 and MG3 had 58.9% and 50.0% of the isolates, respectively, from Italy, as well as 41.1% and 50.0% of the isolates, respectively, from other countries, except Pakistan. MG2 had 83.3% of the isolates from Ecuador. MG4 and MG5 were close to each other in a branch separated from other MGs. MG4 mainly contained isolates from Ethiopia (85%), while MG5 was an interesting group that contained 20 out of 21 isolates (95.2%) from Mexico and only 1 isolate (4.8%) from Canada. Closely related to each other, MG6, MG7, and MG8 formed a big branch that was most distantly related to the other MGs. These three MGs contained 76.1% of the isolates (51 out of 67) from China and 5.4% of the isolates from Egypt, which comprised 78% of the Egyptian isolates. MG6 was more widely distributed than either MG7 or MG8, as it was detected in all countries except Ethiopia (Table 1). This MG mainly contained isolates from the U.S. (28%), China (26.7%), Italy (13.3%), and Mexico (13.3%). As the second smallest MG and detected in six countries, but not Pakistan, Canada, or Ecuador, MG7 contained 37.5% of the isolates from China, 25% from the U.S., and 18.8% from Italy. Compared to MG6 and MG7, MG8 had a relatively narrow distribution, with 64.1% of the isolates from China, 30.8% from Italy (31%), and only 5.1% (two isolates) from the U.S. MG9 and MG10 were more closely related to each other than to other MGs and formed another big branch. As the largest MG, consisting of 169 isolates or 29.8% of the total isolates and detected in all nine countries, MG9 had the highest percentage of isolates from the U.S. (42%), followed by Mexico (30.2%), Italy (8.3%), and Canada (6.5%). In contrast, MG10 was detected in five countries (the U.S., Italy, Ethiopia, Ecuador, and Mexico), comprising 33.3%, 30.2%, 25.4%, 7.9%, and 3.2% of the isolates from these countries, respectively.

Table 1.
The numbers and frequencies, sampling years, and moleular groups (MG) of the Puccinia striiformis f. sp. tritici isolates from nine countries in 2010–2018.
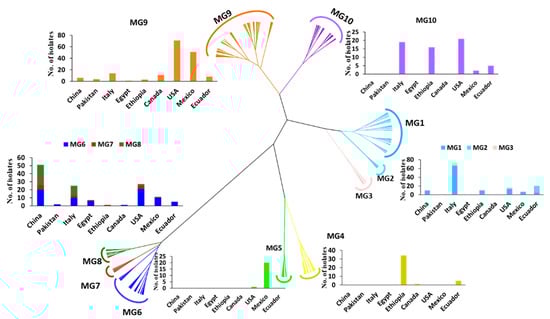
Figure 2.
Dendrogram of Puccinia striiformis f. sp. tritici populations from nine countries constructed based on dissimilarities assessed with 14 simple sequence repeat (SSR) markers using the hierarchical cluster analysis, showing ten molecular groups (MGs) and the histograms with isolate numbers from different countries within each MG.
In addition to the numbers and frequencies of isolates of each MG in each country (Table 1), the proportional presence of MGs in each country can be easily seen in a map (Figure 3). The Chinese collection comprised 37.3% MG8 isolates, followed by 29.9% MG6, 14.9% MG1, 9% MG7, and 9% MG9, but did not have any isolates in MG2 to MG5 or MG10. The small collection from Pakistan had isolates in only three MGs: 50% in MG9 and 25% each in MG3 and MG6. Eight MGs were detected in Italy, including MG1 (50%), MG10 (14.4%), MG9 (10.6%), MG8 (9.1%), MG6 (7.6%), MG3 (5.3%), MG7 (2.3%), and MG2 (0.8%). Nine isolates from Egypt were identified as MG6 (66.7%) and one isolate (11.1%) each in MG1, MG7, and MG9. Six MGs were detected in Ethiopia, including MG4 (52.3%), MG10 (24.6%), MG1 (15.4%), MG9 (4.6%), and MG3 and MG7, each at 1.5%. The Canadian isolates were identified mostly as MG9 (78.6%), with only one isolate (7.1%) each in MG1, MG4, and MG6. Seven MGs were detected in Mexico, including MG9 (56%), MG5 (22%), MG6 (11%), MG1 (6.6%), MG10 (2.2%), and MG2 and MG7, each with only one isolate (1.1%). The Ecuador isolates were identified as MG2 (34.1%); MG9 (18.2%); MG1, MG4, MG6, and MG10 (11.4% each); and MG3 (2.3%). The selected U.S. isolates were identified in all MGs except MG4, with 51.8% in MG9, 15.3% each in MG6 and MG10, 9.5% in MG1, 2.9% in MG7, 2.2% in MG3, 1.5% in MG8, and 0.7% in both MG2 and MG5.
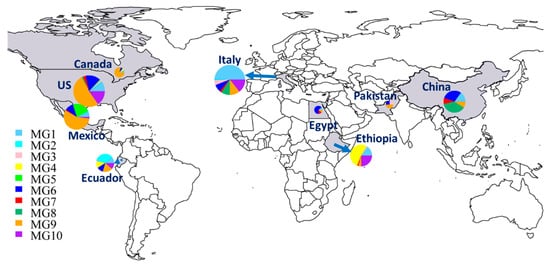
Figure 3.
Distributions of molecular groups (MGs) of Puccinia striiformis f. sp. tritici in nine countries. The sizes of the circles and fans indicate the relative numbers of isolates in the countries and MGs, respectively.
To further detect the relationships between individual isolates from different countries identified in the same MGs, two trees showing individual isolates were constructed using hierarchical cluster analysis, one consisting of all isolates of the closely related MG6, MG7, and MG8 (Figure 4A), and one containing all isolates of MG9 (Figure 4B). These two trees showed that many isolates from the U.S. and Mexico were clustered together, and some were identical. For example, Mexican isolates MX16-249-2 and MX16-244, and U.S. isolates US11-175, US13-272, and US13-226, were identical, as were isolates MX16-237 and US14-215 (Figure 4A). Isolates US10-161 and IT14-28 from Italy, and EC15-43 from Ecuador, were identical; and IT14-5, EG18-9 and EG18-119 from Egypt were identical. US14-309 and MX16-219; PK12-99 and MX16-210; MX16-217-1, US13-019, and US14-176; MX16-211-1 and US14-196; CA13-447 from Canada, US12-153-NG, and US16-170; IT18-13 and US17-061; and more interestingly, 27 Mexican isolates (from MX16-017 to MX16-250) and 5 U.S. isolates (US12-26, US14-11, US14-114, US14-49, and US15-50) were identical (Figure 4B). These results indicate that the migrations of Pst urediniospores not only occurred among geographically close countries, such as the U.S. and Mexico, but also between geographically distant countries on different continents.

Figure 4.
Dendrograms of major molecular groups (MGs) of Puccinia striiformis f. sp. tritici showing genetically related isolates from different countries. (A) Dendrogram of isolates in MG6, MG7, and MG8. (B) Dendrogram of isolates in MG9. These dendrograms were constructed based on dissimilarities assessed with 14 simple sequence repeat markers (SSR) using hierarchical cluster analysis.
2.4. Diversity and Heterozygosity in Different MGs and Countries
The diversities of different MGs were determined by the ratio (g/N) of the number of MLGs (g) over the number of isolates (N), the Shannon–Wiener index of genotypic diversity (H), and the Stoddart and Taylor’s genotypic diversity index (G) coupled with respective 95% confidence intervals by bootstrap statistics (Table 2). The ratio of g/N was relatively high (>0.80) in MG1, MG3, MG4, MG6, MG7, and MG10, but relatively low (<0.80) for MG2, MG5, MG8, and MG9, with the highest (1.00) in MG3, the lowest (0.56) in MG2, and a mean of 0.76. The genotypic diversities measured by the H value were relatively high for MG1 (4.60, confidence interval: 4.49–4.72), MG6 (4.06, confidence interval: 3.90–4.22), and MG9 (4.19, confidence interval: 4.00–4.39) compared to the remaining MGs. The confidence intervals of the MG1 values did not overlap with those of the other MGs, showing a significantly higher diversity than any of the other MGs. Similarly, the G value was also relatively high for MG1 (92.24, confidence interval: 84.26–100.21), MG4 (32, confidence interval: 27.83–36.17), MG6 (49.78, confidence interval: 43.02–56.53), MG9 (25.99, confidence interval: 16.18–35.80), and MG10 (31.75, confidence interval: 24.28–39.23) compared to those of the remaining MGs with G values less than 15.00. Both MG1 and MG6 were significantly more diverse than the remaining MGs.
Table 2.
Numbers of Puccinia striiformis f. sp. tritici isolates, numbers of multi-locus genotypes (MLGs), g/N values, heterozygosity, Stoddart and Taylor’s MLG diversity (G) and confidence interval (CI), and Shannon–Wiener index of MLG diversity (H) over 14 SSR loci, as well as standardized index of association (rbarD) and its probability (P) for indication of reproduction mode in ten molecular groups (MGs).
Similarly, the MLG diversities of different countries were also determined (Table 3). The highest genotypic diversity measured by both the H (4.69, confidence interval: 4.58–4.81) and G (96.8, confidence interval: 87.57–106.04) values was found in Italy, followed by the U.S. (H = 4.49, G = 74.78) and Ethiopia (H = 4.06, G = 56.33). Egypt had the lowest genotypic diversity measured by both the H (2.04, confidence interval: 1.63–2.46) and G (7.36, confidence interval: 5.38–9.35).
Table 3.
Numbers of Puccinia striiformis f. sp. tritici isolates, numbers of multi-locus genotypes (MLGs), g/N values, heterozygosity, Stoddart and Taylor’s MLG diversity (G) and confidence interval (CI), and Shannon–Wiener index of MLG diversity (H) over 14 SSR loci, as well as standardized index of association (rbarD) and its probability (P) for indication of reproduction mode in the collections from nine countries.
Private MLGs in each country contributed greatly to the diversity of the global population. The number of private MLGs varied greatly, ranging from 6 in Pakistan to 113 in Italy (Table 3), while the frequencies of private MLGs were all above 80%, except for in Pakistan (75%), with the highest frequency in Ethiopia (98.3%) followed by China (98.0%), Italy (96.6%), and Ecuador (94.7%).
Heterozygosity, which also represents gene diversity, was estimated for each MG and country. The frequencies of homozygous (homokaryotic) and heterozygous (heterokaryotic) alleles across the 14 SSR loci are provided in Table S2, and the heterozygosity frequencies of the 10 MGs and of the nine countries are provided in Tables S3 and S4, respectively. The frequencies of heterozygous alleles of the SSR loci varied greatly, ranging from 5.9% (Pstp029) to 63.5% (CPS02), with a mean of 30.3% across the 567 isolates (Table S2). The highest mean heterozygous allele frequency was observed in MG9 (57%), followed by MG10 (56%), MG1 (49%), MG3 (35%), MG4 (25%), MG2 (20%), MG7 (18%), and MG8 (15%), with the lowest frequency (14%) in both MG5 and MG6 (Table 2 and Table S3). For the country-wise comparisons, Canada (49%), the U.S. (48%), Italy (47%), and Mexico (45%) had high mean values of heterozygous allele frequencies; Egypt (18%) and China (21%) had low mean values; and Ethiopia (33%) and Ecuador (27%) were in between (Table 3 and Table S4). Big ranges of heterozygosity values were observed for every country except Egypt. The results indicate that the Pst populations were highly heterozygous, indicating that the two nuclei in most of the isolates were different, and that different alleles between the two nuclei in a single isolate contributed greatly to the population diversity.
2.5. Genetic Relationships of Country-Wise Populations
A phylogenetic dendrogram and a scatter plot based on the discriminant analysis of principal component (DAPC) analysis for nine country-wise populations are shown in Figure 5. In the phylogenetic dendrogram (Figure 5A), the Chinese and Egyptian populations were clearly separated from the other country populations by a 100% bootstrap value. The Ethiopian population was also differentiated clearly from the other populations by a 39.8% bootstrap value. The U.S., Canadian, and Mexican populations were clustered together by a 67.5% bootstrap value, and this branch further grouped together with the Ecuadorian population by a 30.8% bootstrap value. Similarly, in the DAPC scatter plot, the isolates from China and Ethiopia were obviously differentiated from each other. Most of the isolates of the U.S., Canada, Mexico, and Ecuador (especially the U.S., Canada, and Mexico) were closely related and distributed in a different coordination from those of the Chinese and Ethiopian isolates (Figure 5B).
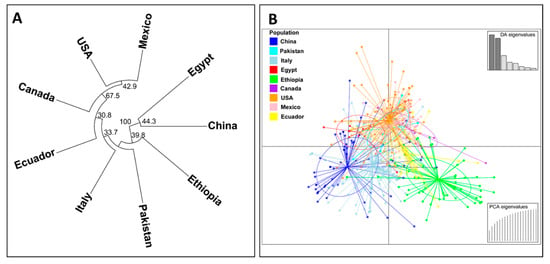
Figure 5.
A phylogenetic tree showing the relationships of Puccinia striiformis f. sp. tritici (Pst) collections from nine countries based on the Edward’s genetic distance (A) and a scatter plot based on the discriminant analysis of principal component (DAPC) analysis of all Pst isolates across the nine countries (B).
2.6. Genetic Variation, Population Differentiation, and Migration
The genetic variations of the Pst populations from different countries were analyzed by analysis of molecular variance (AMOVA) (Table 4). The highest variation was among isolates (78%), followed by countries (12%) and within countries (10%). All these levels of variation were highly significant (P < 0.001).
Table 4.
Analysis of molecular variance for partitioning the variation in Puccinia striiformis f. sp. tritici isolates from nine countries.
The Fixation index (FST) were used to estimate the genetic differentiations among the populations of different countries. The FST estimations and P values of the pairwise comparisons among the nine country populations are shown in Table 5. The differentiations were significant between all country-wise comparations at the P = 0.05 level, except between Canada and Mexico, and also at P = 0.01, except between Canada and Ecuador, between Canada and Ethiopia, and between Canada and the U.S., in addition to between Canada and Mexico, indicating that these country populations were less differentiated.
Table 5.
Pairwise comparison of populations of Puccinia striiformis f. sp. tritici from seven countries based on the fixation index (FST) values a.
A migration network generated based on the Nm values (number of effective migrants) showed the possible migrations between any of the studied countries (Figure 6). Higher migration rates (lower differentiation) were observed among the U.S., Canada, and Mexico populations than between the other countries. Interestingly, the highest migration (1.0) was detected between China and Egypt, and considerable levels of migration (>0.2) were detected between Ethiopia and Canada, Mexico, or Ecuador; between the U.S. and Pakistan or Italy; and between Italy and China or Egypt. These results indicate frequent migrations between different continents.
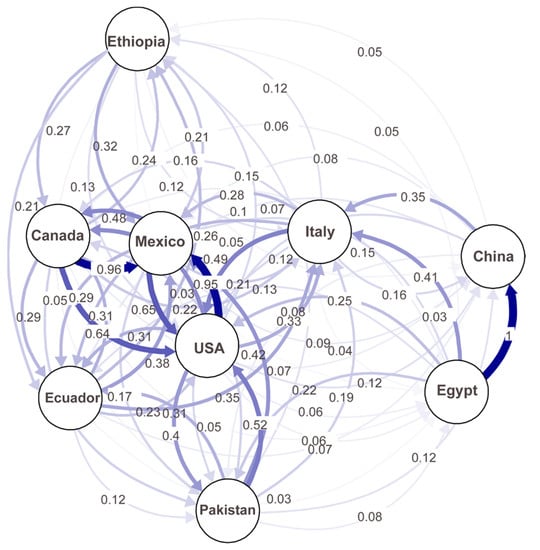
Figure 6.
A migration network showing the gene flow patterns among nine country populations of Puccinia striiformis f. sp. tritici. Gene flow strengths are indicated by the line thicknesses.
2.7. Reproduction Mode
The standard index of association (rbarD) value was calculated for each of the 10 MGs (Table 2) and each of the nine country populations (Table 3). The rbarD values ranged from 0.006 in MG8 to 0.222 in MG5 (Table 2, Figure S1). The P values < 0.05 of five MGs (MG1, MG4, MG5, MG9, and MG10) indicated that their rbarD values were significantly different from the theoretic values for lack of linkage disequilibrium, and thus, the populations were clonal. In contrast, the remaining five MGs (MG2, MG3, MG6, MG7, and MG8) had P values > 0.05, indicating that their rbarD values were not significantly different from the theoretical values for lack of linkage disequilibrium, and thus, recombination possibly occurred in these genetic groups. However, the rbarD value of the overall population was 0.116, with a P value < 0.001, indicating that the overall population was mostly asexually reproduced.
The rbarD values ranged from 0.087 in Italy to 0.413 in Mexico (Table 3, Figure S2). All country-wise populations had P values < 0.001 (Table 3) and were located outside the bell-curve of the simulated distribution (expected from unlinked loci) of a randomly mating population in the Pst population (Figure S2), thus, the data reject the hypothesis of no linkage among markers, but support the mostly clonal reproduction of the Pst populations based on countries.
2.8. Correlation between the Molecular and Virulence Data
Correlation analysis was conducted with the marker data obtained from this study and the virulence data of a separate study [52] using Mantel tests with 1000 permutations. When all isolates were considered without any grouping, the overall correlation coefficient was 0.235 (P < 0.001) between the marker genotypes and virulence phenotypes (Table 6 and Table 7), indicating a low but significant correlation between the two data sets. When the individual MGs were analyzed separately, the correlation coefficients ranged from 0.069 (MG4) to 0.308 (MG2), and significant correlations (P < 0.05) were found for MG1, MG2, MG9, and MG10 (Table 6). When the individual country populations were analyzed separately, the highest correlation (0.366) was found in the U.S. population, followed by the Ethiopian population (0.319), and the lowest (0.156) in the Canadian population followed by the Italy population (0.172) and the Chinese population (0.177) (Table 7). The correlations were all significant at P = 0.05, except those of the populations from Canada (P = 0.203) and Ecuador (P = 0.132).
Table 6.
Correlation coefficients between the molecular data (SSR) and virulence data within different molecular groups (MG) of Puccinia striiformis f. sp. tritici.
Table 7.
Correlation coefficients between the molecular data (SSR) and virulence data of Puccinia striiformis f. sp. tritici collections from different countries.
3. Discussion
The stripe rust pathogen is distributed in the wheat-growing countries throughout the world, and the fungus evolves and disseminates rapidly from one country to another [9,10,11,13,14,15,21,26,32,33]. The present study successfully tested the hypothesis that Pst migrates among countries and continents, which was proposed based on the virulence data of the collections from different countries in a recent study [52]. Our study offers clear evidence supporting Pst migration around the global. In addition, our study found great diversities within country-wise populations and significant differences among the country-wise populations and molecular groups. The results of the present study expand our understanding of the mechanisms of the pathogen’s evolution.
In this study, we identified 433 MLGs, including 333 previously undescribed MLGs, from 567 Pst isolates collected from nine countries using 14 SSR markers. The 14 markers were adequate to characterize the Pst collection, as the marker sufficiency test indicated that 99.5% of the 433 MLGs could be differentiated with only 13 markers (data not shown), which is consistent with our previous study of U.S. collections with the same 14 SSR markers [43]. The 433 MLGs were clustered into 10 MGs, and these MGs had different frequencies and distributions in different countries, and they differed in diversity, heterozygosity, and correlation with virulence phenotypes. Similarly, the country-wise populations also had different levels of diversity and differentiation, and differed in heterozygosity and correlation with virulence phenotypes. However, we detected identical and closely related MLGs in several MGs from different countries. These results indicate the rapid dissemination of specific genetic populations across different continents. Moreover, the analyses of reproduction mode indicate that the overall and country-wise Pst populations were generally clonal, but recombination was detected within several MGs. Therefore, this study provides insights for understanding the global diversity, distribution, differentiation, migration, and reproduction of the Pst populations.
The geographic distribution and genetic relatedness of the MLGs in different countries were analyzed by the minimum spanning networks by utilizing a stepwise mutation model for the 14 SSR loci. Even though most of the MLGs were private and more closely related within each country, some MLGs from different countries were also interrelated. MLGs from geographically close countries, such as Ecuador, Mexico, and the U.S., and geographically distant countries, such as China, Italy, and the U.S., were both found to be identical or very closely related, indicating migrations or incursions from country to country, which supports the previous reports of the international migration of Pst in recent decades [9,13,14,26,32,50,56].
The 433 MLGs were clustered into ten MGs, of which some were present in all countries, also indicating Pst migration among different countries. Among the ten MGs, MG1, MG6, and MG9 had more isolates and were more diverse and widespread. These MGs consisted of isolates from eight or all nine countries. Although each of the MGs was detected in at least two countries, they appeared to have preferred countries. MG1 and MG3 had the highest numbers of isolates from Italy. MG2 had the highest frequency in Ecuador, MG4 in Ethiopia, MG5 in Mexico, and MG8 in China. MG6 had the highest number of isolates from the U.S., immediately followed by China. MG7 had the highest number of isolates from China followed by the U.S. and Italy. The highest number of isolates of MG9 was from the U.S., followed by Mexico. The U.S. contributed the highest number of isolates to MG10, followed by Italy and Ethiopia. The ten MGs had different levels of relatedness. MG1, MG2, and MG3 were more closely related to each other, and so were MG6, MG7, and MG8. The differences in predominant MGs in different countries may be due to the different foundation populations existing and evolving independently, plus the shared genotypes migrating among countries in recent years.
In a previous study of only U.S. isolates using the same 14 SSR markers, three major groups (MGs) with 10 subgroups (sub-MGs) were identified [43]. The relationships of the 10 MGs identified in the present study were similar to those of the previously identified sub-MGs. For example, 82% of the U.S. isolates in MG6, MG7, and MG8 in the present study were from the previously identified sub-MGs of MG3, which is a new MG that has only been detected since 2000, and mainly since 2010 in the U.S. [43]. In the present study, MG9 consisted of isolates mostly from the U.S. and Mexico and also contained isolates from all other countries. MG6–MG9 may be related to the aggressive strains widely spreading in the world, as reported in previous studies [11,13,14,33,57]. Some small MGs were genetically distant from other MGs and specific to one or a few countries, such as MG4 in Ethiopia and MG5 in Mexico, indicating the possibility of new emergence or incursions. The other small MGs had close relationships with the large MGs, but were separated into different groups. For example, the second smallest group, MG2, was closely related to the second largest group, MG1. As MG2 was mostly from Ecuador and MG1 widespread in eight countries including Ecuador, MG2 was likely evolved from MG1, and became more adapted to the environment and wheat cultivars in Ecuador. Mostly from China and Italy, MG8 was closely related to MG6, which was detected in all countries except Ethiopia. It is likely that MG8 has recently evolved from MG6, as a larger and more diverse group takes longer to develop than a small and less diverse group. Because Pst is capable of long-distance spreading by wind or occasional human activities [9,13], these initially small and distinct groups may undergo future wide distribution. Therefore, even though the genetic groups are unique to certain countries, they need to be continually monitored for possible dispersal to other countries or continents.
Despite its capacity for long-distance migration, the global Pst population may be very complex due to a combination of other factors, such as different cropping systems, variable climate conditions, and different geographic features [9]. For example, the highest FST value of 0.540 was found between China and East Africa using the Stubbs Collections from various countries mainly before the 1990s, indicating a strong population subdivision [1,13]. In our previous study, we found low to moderate levels of differentiation, with the highest FST value of 0.15 between East Asia and South America in the worldwide collections from 2006–2010 [26]. In the present study, the collections from nine countries were more recent (2010–2018), and the highest FST value (0.263) was also between China and East Africa (Ethiopia), which was similar to the result of the study by Ali et al. [13]. However, even though most of the pairwise country comparisons for differentiation as measured by FST values were significant (excluding Egypt and Pakistan, because of small numbers of isolates), the population differentiations were at low to moderate levels, further confirming the international migrations of Pst, especially in the more recent years since 2010. We found that, overall, genetic variation mostly existed among isolates (78%), with only 10% within countries and 12% among countries. These values are comparable to the 81% among isolates and 13% among countries in our previous study of the international Pst collections of 2006–2010 [26]. This indicates a trend of more rapid globalization in Pst populations. With the global spreading of the new aggressive strains, including the sudden appearance of MGs in the U.S. in 2010 and 2011 [43], there have been widespread epidemics of stripe rust, causing huge economic losses in many countries in Central and West Asia, East Africa, and North America in the last decade [5,20,22,23]. Therefore, monitoring Pst genotypes is continually needed.
High levels of genotypic diversity were observed in Italy, China, the U.S., and Ethiopia. These results are consistent with a previous study that also reported high levels of diversity in Asia and the Mediterranean area [26]. This is quite different from the study of Ali et al. (2014), who reported low levels of diversity in the Mediterranean area and North America [13]. In the present study, the highest level of genotypic diversity (4.69 for H and 96.8 for G) was in the Italian population. Italy is part of the Mediterranean region, which was considered a center of origin for P. striiformis by Stubbs (1985) [1]. In a recent study analyzing weather conditions for suitability to Pst infection, Italy was found among the countries with high risk to stripe rust [58]. The difference could be due to the sizes and regions of Pst samples. The North American samples analyzed by Ali et al. (2014) were from southcentral states [13], where Pst has a much lower diversity than in the western U.S. [22,23,43,59,60]. In general, Pst populations should show high diversity in regions with weather conditions and cropping systems favorable to their survival, infection, and reproduction. All above genetic studies reported that the Asian Pst population is relatively highly diverse compared to those of some other regions, and this high diversity may be partially related to possible sexual reproduction in this continent [13,27,28,29,30,31,61]. In 2014, the Himalayan region was proposed as a Pst point of origin [13]. In agreement with our previous study, the whole Mediterranean to Asian region could be the main center of origin for the stripe rust fungus. This modified hypothesis is related to the long history of cereal cultivation and stripe rust epidemics in this big geographic region [1,3].
As Pst is a dikaryotic fungus, the heterozygosity of isolates makes a major contribution to the overall diversity. Ali et al. (2014) studied the heterozygosity of Pst populations in different countries and reported heterozygosity values of 0.28 in China and 0.35 in Pakistan [13]. In the present study, we observed high levels of heterozygosity in Canada (49%), the U.S. (48%), Italy (47%), and Mexico (45%), with the lowest levels in China (21%) and Egypt (18%). The heterozygosity values of China and Pakistan were comparable with those reported by Ali et al. (2014) [13], and the values of Pakistan, Mexico, and the U.S. were consistent with our previous study [43]. However, the heterozygosity value for China in the present study was much lower than that in our previous study (47%) [43]. This difference could be due to the different regions of the collections. In the previous study, the Chinese isolates were from the northwestern region, while in the present study, the samples were from only one province (Yunnan) in the southwestern region. The Pst populations in these two regions of China are quite different [30,62]. In addition to the different heterozygosity levels among the country-wise populations, differences in heterozygosity were also detected among the MGs, with the highest heterozygous allele frequencies in MG9 (57%) and MG10 (56%) and the lowest in MG5 and MG6 (both 14%). The heterozygous allele frequencies were significantly correlated to the numbers of isolates of MGs (r = 0.692, P = 0.027), which may support the hypothesis that heterozygous isolates may have advantages in pathogen evolution because of the heterosis effect, which may be involved in adaptation to different environments and host cultivars with different resistance genes [26,43].
Most previous studies reported the clonal reproduction of Pst populations in many parts of the world [26,29,36,37,38,43,57,63]. Some studies on population genetics have suggested the sexual recombination of Pst in China and the Himalayan region [13,30,31,61], and the natural infection of Pst in barberry for sexual reproduction was reported at low frequencies in China [25,27,28,29]. In the present study, clonal reproduction was indicated for each individual country and also for the overall population. However, when the isolates in the 10 MGs were analyzed separately for the standardized index of association (rbarD), 5 MGs (MG2, MG3, MG6, MG7, and MG8) were found to have recombination at the P = 0.01 level, and at the P = 0.05 level, 3 MGs (MG2, MG3, and MG8) were still considered to have possible recombination. Based on the lowest rbarD value (0.006) and the highest P value (0.309), MG8 is most likely to be produced by sexual recombination. In fact, most MG8 isolates were from China and Italy. China has been shown to have sexual reproduction [25,27,28,29], and Italy has been reported to be at a high potential risk of Pst infection on barberry [58]. Thus, this study provides evidence for Pst sexual recombination in some countries, especially China. Not all possibilities of recombination are through sexual reproduction, and some of them may be results of somatic recombination. Somatic recombination has been demonstrated for Pst under controlled conditions [44], and has been reported to produce virulent races in Puccinia graminis f. sp. tritici, the wheat stem rust pathogen [64,65]. Nevertheless, among all possible mechanisms, mutation is the most important for Pst evolution, which is illustrated by the minimum span of the network for stepwise mutations to produce the majority of MLGs in the present study (Figure 1), as is consistent with our previous studies [26,43].
The overall correlation coefficient value (0.235) between the molecular genotype data and the previously published virulence data [51,52] was low, but significant. This value is lower than the 0.41 value reported for the international collections from 2006 to 2010 [26]. The difference could be due to the collections being from different countries in the two studies, as different country populations had different coefficient values in the present study. The U.S. and Ethiopian populations had the highest correlations, while the Ecuadorian population had the lowest correlation. Similarly, the different MGs had different coefficient values, with MG2 having the highest (0.308) and MG4 the lowest (0.069). The correlations in five MGs were significant, but they were insignificant in the other five MGs. The differences in correlation may indicate different deployments of specific resistance genes in different countries, and some MGs have been under stronger wheat cultivar selection pressure than others. Because the overall correlation is not very high, neither virulence nor molecular tests can provide a complete picture of the pathogen population. Thus, it is important to continually characterize Pst populations using both virulence testing and molecular markers.
4. Materials and Methods
4.1. Sample Collection and Urediniospore Multiplication
A total of 567 Pst isolates from 9 countries were used in this study, including 132 U.S. isolates selected to represent different races and molecular groups during the same period of collection in the other countries for the purpose of genotype comparison (Table 1, Figure S3). As the quantity of urediniospores for each isolate stored in liquid nitrogen was limited, urediniospores were multiplied on seedlings of wheat cultivar “Nugaines”, which is susceptible at the seedling stage to all Pst races identified thus far in the U.S. [22,23]. After heat shock at 50 °C for 2 min, urediniospores sealed in small foil bags were transferred with a fine brush onto two-leaf-stage seedlings of Nugaines. The inoculated plants were incubated in a dew chamber at 10 °C for 24 h without light, and grown in a growth chamber with a diurnal temperature cycle gradually changing from 4 °C at 2:00 a.m. to 20 °C at 2:00 p.m., with 8 h dark in the low temperature range and 16 h light in the high temperature range [59,60]. To prevent cross contamination, plants inoculated with different isolates in different pots were separated with plastic booths. Urediniospores were vacuum collected with custom-made glass collectors.
4.2. Genomic DNA Extraction
Total genomic DNA was extracted from dried urediniospores following a universal and rapid salt-extraction method for high-quality genomic DNA [66] with modifications for Pst [67]. A mixture of ~20 mg spores and 200 mg sand in a 1.1 mL tube was ground by vortexing for 2 min and added to 500 µL 2× cetyltrimethylammonium bromide (CTAB) buffer (1.4 M NaCl, 100 mM Tris-HCl pH 8.0, and prewarm to 65 °C) (ThermoFishher Scientific, Waltham, MA, USA). After mixing, the tube was incubated in a water bath at 65 °C for 60 min with gentle inverting every 10 min, and mixed with 400 μL chloroform: iso-pentyl alcohol (24:1) (ThermoFishher Scientific, Waltham, MA, USA), then centrifuged for 15 min at 4000 rpm at 4 °C in an Allegra 25R centrifuge (Beckman Coulter Inc., Brea, CA, USA). The 500 μL supernatant was transferred to a new tube and mixed with 500 μL isopropanol; the mixture was centrifuged for 15 min and the DNA pellet was air-dried and re-suspended in 100 μL TE buffer (containing 20 μg mL−1 Rnase A). The tube was incubated at 37 °C for 2 h to completely dissolve the DNA pellet. The concentration of the DNA stock solution was determined using a ND-1000 spectrophotometer (Bio-Rad, Hercules, CA, USA), and the quality was checked in a 0.8% agarose gel. A work solution of 5 ng µL−1 was made from the stock solution by adding sterile deionized water for use as a DNA template in the polymerase chain reaction (PCR).
4.3. SSR Markers and PCR Amplification
Fourteen pairs of SSR primers were selected based on their co-dominant polymorphisms among Pst isolates shown in previous studies [26,35,36,39]. They were CPS02, CPS04, CPS08, and CPS13 [68]; PstP001, PstP002, PstP003, PstP005, PstP006, and PstP029 [35]; and RJ18, RJ20, RJ21, and RJ8N [69,70]. The primers were synthesized by Sigma Life Science (St. Louis, MO, USA). The sequences, annealing temperatures, and amplied fragments of the primers are provided in Table S5. To use fluorescence for detecting PCR products, an M13 tag (5′-CACGACGTTGTAAAACGAC) was added to the 5′ end of each forward primer [48]. For each SSR marker, the forward primer was labeled with black, green, or blue florescent dye, with the red fluorescent dye (Sigma Life Science) for the size marker. SSR loci with the same or similar allele sizes were labeled with different florescent dyes to achieve the maximum possible number of loci per run in the sequencer [71].
Amplification of PCR was performed in a Bio-Rad iCycler (Bio-Rad, Hercules, CA, USA) following the protocol described in previous studies [35,36]. Each reaction (12 µL) contained 1.2 µL of 10× reaction buffer with 15 mM MgCl2 (Sigma Life Science), 0.96 µL 2.5 mM dNTP (Sigma Life Science), 0.12 µL of 5 µM forward primer, 0.6 µL 5 µM reverse primer, 0.24 µL of 5 µM M13 universal primer, 0.2 µL 5 U/µL Taq polymerase (Sigma Life Science), 4 µL DNA (total 20 ng), and 4.68 µL sterile ddH2O. The amplification cycles and conditions were 94 °C for 5 min for initial denaturation; 42 cycles of 94 °C for 30 s, 45 to 54 °C for 30 s depending on primers, and 72 °C for 45 s; and 7 min of final extension at 72 °C. The sizes of the PCR products were estimated using capillary electrophoresis on an ABI3730 Genotyper (Applied Biosystems, Foster City, CA, USA). The internal molecular weight standard for ABI3730 was Genescan 445-LIZ (Applied Biosystems). Allele sizes in base pairs were scored and analyzed using the software GeneMarker V2.2 (Softgenetics, State College, PA, USA).
4.4. Analyses of Multilocus Genotypes
If isolates in the present study had identical alleles across all 14 SSR loci, they were assigned to the same MLG. The MLGs were named in continuation with the previous MLGs identified from the U.S. isolates of 2010 to 2017 [43]. Since Pst is a dikaryotic fungus at the uredinial stage, each isolate was scored for two alleles to determine homozygous or heterozygous for each SSR locus using GeneMarker V2.2 (https://genemarker.software.informer.com/2.2/ (accessed on 20 August 2021)). The data file generated by GeneMarker was converted to a ‘csv’ file to be analyzed with the R package. The sufficiency of markers to describe the population structure was assessed through the detection of multilocus genetypes (MLGs) plotted against the number of loci, and a graph was generated using the ‘poppr’ package in the R 4.0.3 program (https://r-for-windows.updatestar.com/ (accessed on 20 August 2021)) [72]. The genetic relationships among individual MLGs were analyzed based on the Bruvo’s distance utilizing a stepwise mutation model for microsatellite loci [73,74,75] and visualized by a minimum spanning network in ‘poppr’.
4.5. Identification of Molecular Groups
To identify putative clusters of genetically related isolates in the present study (567 isolates), hierarchical clustering analysis based on the 14 SSR markers (CPS02, CPS04, CPS08, CPS13, RJ18, RJ20, RJ21, RJ8N, Pstp001, PstP002, PstP003, Pstp005, PstP006, and PstP029) was conducted using the dissimilarity values and the “ward.D2” method with the “hclust” function in the R stats 4.0.3 program [76]. The parameters for hierarchical cluster analysis were the same as previously described [43].
4.6. Population Diversity and Heterozygosity
Genotypic diversity was determined by estimating both genotypic richness (the number of observed MLGs) and evenness (the distribution of genotype abundance). Stoddart and Taylor’s index and Shannon’s diversity index for MLG diversity were calculated as G = 1/∑Pi2 and H = ∑PilnPi, respectively, where Pi is the observed frequency of the ith MLG in a population [53,54,77]. As Pst is a dikaryotic fungus at the uredinial stage and DNA was extracted from urediniospores, each isolate was scored for homozygous or heterozygous at each SSR locus using the software GeneMarkerV1.5 (https://genemarker.software.informer.com/download/ (accessed on 20 August 2021)). Heterozygosity in percentage was calculated for each isolate based on the number of loci with different alleles across the 14 SSR markers analyzed using the software GenAlEx 6.503 (https://biology-assets.anu.edu.au/GenAlEx/Welcome.html (accessed on 20 August 2021)) [78]. Mean heterozygosity was calculated for each country and MG.
4.7. Population Variation, Differention, and Phylogenetic Relationships
Analysis of molecular variance (AMOVA), which allows the hierarchical partitioning of genetic variation within and among countries [79], was conducted by defining the Pst isolates based on countries using the function “poppr.amova” in the poppr R program version 4.0.3 [72,80]. Population differentiation measured by the fixation index (FST) among the nine countries, except for Pakistan and Egypt which had isolate numbers less than ten, were analyzed using the software GenAlEx 6.503 [78]. A migration network based on the number of effective migrants (Nm, where N is the effective population size of each population and m is the migration rate between populations) was also generated to visualize the gene flow patterns among the nine countries using the “diversity” package in R. To further investigate the genetic relationships at the country level, a phylogenetic tree was generated based on Edward’s genetic distance for the nine countries in bootstrap analysis with 1000 replicates using function “aboot” in the “poppr” program. Similarly, to assess how the nine country-wise populations differed from each other, the discriminant analysis of principal components (DAPC), a no model-based method developed and implemented in the “adegenet” R package, was also performed to generate a scatter plot. The DAPC was carried out for all marker loci, and an α-score optimization was used to determine the number of principal components to retain [81,82].
4.8. Reproduction Mode
The mode of reproduction was tested by adjusted/standard index of association (rbarD) [55]. This test is useful to determine if a populations is clonal (rbarD = 1, where significant disequilibrium is expected due to linkage among loci) or sexual (rbarD = 0, where linkage among loci is not expected). The null hypothesis is that alleles observed at different loci are not linked if the population is sexually reproduced, and they recombine freely into new genotypes during the process of sexual reproduction. In molecular ecology, we typically use the index of association or related indices to test this phenomenon. In this study, rbarD was calculated using the “poppr” program, and the null hypothesis rbarD = 0 was tested with 1000 permutations [72]. If an observed rbarD value is located outside the distribution of the randomized dataset at P < 0.001, then the samples are likely from a clonal population [72].
4.9. Determination of Correlation between the Molecular and Virulence Data
To determine the correlations between the molecular data obtained in the present study with the virulence data in a previous study from our group [52], a distance matrix was generated for each country population with each of the two data sets using GenAlEx 6.5 [78]. The regression analysis was used to obtain the correlation coefficient based on the distance matrix generated from the two datasets, and the significance of correlation was determined using P = 0.05.
5. Conclusions
In this study, we identified 433 MLGs from the Pst collections of nine countries on five continents in recent years, and clustered them into 10 MGs. These MGs differed greatly in frequency, distribution, genetic diversity, heterozygosity, and correlation coefficient between the molecular genotypes and virulence phenotypes. Similarly, we also detected differences in these aspects among the nine country-wise populations. Although significant differentiations were observed between all possible pairwise country populations at P = 0.05, except between Canada and Mexico, the greater the distance between two countries, the greater the differentiation between the two countries’ populations. The presence of the same MGs and the detection of identical or closely related MLGs in different countries indicated frequent migrations of the pathogen among countries and continents. The analysis of the standardized index of association indicated possible sexual reproduction involved in some of the MGs, although the overall population or individual country populations were found to be clonal. The relatively low correlation coefficient values obtained for the overall population, individual country populations, and MGs suggest the need for characterization of Pst populations using both virulence phenotyping and molecular genotyping. This study provides insights for understanding the diversity, distribution, and evolution of Pst populations on a global scale, and the information is useful for continual monitoring of the pathogen populations. The detection of global migrations of Pst genotypes in the present study and virulent races in the previous studies emphasizes the importance of considering the global pathogen populations when breeding wheat cultivars with broad, durable resistance, for the sustainable control of stripe rust.
Supplementary Materials
The following are available online at https://www.mdpi.com/article/10.3390/ijms22179457/s1.
Author Contributions
Conceptualization, X.C. and Q.B.; methodology, Q.B., A.W. and M.W.; software, Q.B. and M.W.; validation, Q.B., A.W., M.W. and X.C.; formal analysis, Q.B.; investigation, Q.B., A.W. and M.W.; resources, X.C. and D.R.S.; data curation, Q.B.; writing—original draft preparation, Q.B.; writing—review and editing, X.C.; visualization, Q.B.; supervision, X.C.; project administration, X.C.; funding acquisition, X.C. All authors have read and agreed to the published version of the manuscript.
Funding
This research was funded by the US Department of Agriculture, Agricultural Research Service (Project No. 2090-22000-018-00D), Washington Grain Commission (Project No. 13C-3061-3144), and Washington State University, Department of Plant Pathology, College of Agricultural, Human, and Natural Resource Sciences, Agricultural Research Center, HATCH Project Number WNP00461.
Institutional Review Board Statement
Not applicable.
Informed Consent Statement
Not applicable.
Data Availability Statement
The data presented in this study are available in the Supplementary Material.
Acknowledgments
The authors would like to thank Mingju Li, Institute of Agricultural Environment and Resources, Yunnan Academy of Agricultural Sciences, Kunming, China; Pedro Figueroa López, Mexican National Institute for Agricultural Research, Sección Andalucía, Ciudad Obregón, Sonora, México, Marco Maccaferri, Department of Agricultural Sciences, University of Bologna, Italy; Anna Maria Mastrangelo, CREA-Research Centre for Cereal and Industrial Crops, Foggia, Italy; Charles W. Barnes, US Department of Agriculture, Forest Service, Forest Health Protection, San Bernardino, CA, USA; Diego Fabricio Campaña Cruz, Instituto Nacional de Investigaciones Agropecuarias (INIAP) Estación Experimental Santa Catalina, Quito, Ecuador; Albert U. Tenuta, Ontario Ministry of Agriculture, Food and Rural Affairs, Ridgetown, Ontario, Canada; Samar M. Esmail, Wheat Diseases Research Department, Sakha Agriculture Research Station, Institute of Plant Pathology, Agriculture Research Centre (ARC), Sakha, Kafrelsheikh, Egypt; Abdelrazek S. Abdelrhim, Department of Plant Pathology, Faculty of Agriculture, Minia University, El-Minia, Egypt; Javed Mirza, National Agricultural Research Center, Islamabad, Pakistan. The China Scholarship Council scholarship to Q.B. is highly appreciated.
Conflicts of Interest
The authors declare no conflict of interest. The funders had no role in the design of the study; in the collection, analyses, or interpretation of data; in the writing of the manuscript, or in the decision to publish the results.
Disclaimer
Mention of trade names or commercial products in this publication is solely for the purpose of providing specific information and does not imply recommendation or endorsement by the US Department of Agriculture. USDA is an equal opportunity provider and employer.
Abbreviations
| Pst | Puccinia striiformis f. sp. tritici |
| U.S. | United States |
| MLG | Multi-locus genotype |
| MG | Molecular group |
| SSR | Simple sequence repeat |
| MX | Mexico |
| IT | Italy |
| EC | Ecuador |
| EG | Egypt |
| PK | Pakistan |
| CA | Canada |
| g | Number of MLGs |
| N | Number of isolates |
| g/N | Ratio of number of MLGs/number of isolates |
| H | Shannon–Wiener index of genotypic diversity |
| G | Stoddart and Taylor’s genotypic diversity index |
| DAPC | Discriminant Analysis of Principal Components |
| AMOVA | Analysis of molecular variance |
| FST | Fixation index |
| P | Probability value |
| rbarD | Adjusted/standard index of association |
| CTAB | Cetyltrimethylammonium bromide |
| PCR | Polymerase Chain Reaction |
| Nm | Number of effective migrants |
| USDA | U.S. Department of Agriculture |
References
- Stubbs, R.W. Stripe Rust: The Cereal Rusts II: Disease, Distribution, Epidemiology and Control; Roelfs, A.P., Bushnell, W.R., Eds.; Academic Press, Inc.: New York, NY, USA, 1985; pp. 61–101. [Google Scholar]
- Wellings, C.R. Global status of stripe rust: A review of historical and current threats. Euphytica 2011, 179, 129–141. [Google Scholar] [CrossRef]
- Chen, X.M.; Kang, Z.S. History of research, symptoms, taxonomy of the pathogen, host range, distribution, and impact of stripe rust. In Stripe Rust; Chen, X.M., Kang, Z.S., Eds.; Springer: Dordrecht, The Netherlands, 2017; pp. 1–33. [Google Scholar]
- Chen, X.M. Epidemiology and control of stripe rust [Puccinia striiformis f. sp. tritici] on wheat. Can. J. Plant. Pathol. 2005, 27, 314–337. [Google Scholar] [CrossRef]
- Chen, X.M. Pathogens which threaten food security: Puccinia striiformis, the wheat stripe rust pathogen. Food Secur. 2020, 12, 239–251. [Google Scholar] [CrossRef]
- Chen, X.M. Stripe rust epidemiology. In Stripe Rust; Chen, X.M., Kang, Z.S., Eds.; Springer: Dordrecht, The Netherlands, 2017; pp. 283–352. [Google Scholar]
- Chen, X.M. Integration of cultivar resistance and fungicide application for control of wheat stripe rust. Can. J. Plant. Pathol. 2014, 36, 311–326. [Google Scholar] [CrossRef]
- Afzal, S.N.; Haque, M.I.; Ahmedani, M.S.; Bashir, S.; Rattu, A.R. Assessment of yield losses caused by Puccinia striiformis triggering stripe rust in the most common wheat varieties. Pak. J. Bot. 2007, 39, 2127–2134. [Google Scholar]
- Hovmøller, M.S.; Justesen, A.F.; Brown, J.K.M. Clonality and long-distance migration of Puccinia striiformis f. sp. tritici in north-west Europe. Plant Pathol. 2002, 51, 24–32. [Google Scholar]
- Boshoff, W.H.P.; Pretorius, Z.A.; Van Niekerk, B.D. Establishment, distribution, and pathogenicity of Puccinia striiformis f. sp. tritici in South Africa. Plant. Dis. 2002, 86, 485–492. [Google Scholar] [PubMed] [Green Version]
- Hovmøller, M.S.; Yahyaoui, A.H.; Milus, E.A.; Justesen, A.F. Rapid global spread of two aggressive strains of a wheat rust fungus. Mol. Ecol. 2008, 17, 3818–3826. [Google Scholar] [CrossRef]
- Milus, E.A.; Kristensen, K.; Hovmøller, M.S. Evidence for increased aggressiveness in a recent widespread strain of Puccinia striiformis f. sp. tritici causing stripe rust of wheat. Phytopathology 2009, 99, 89–94. [Google Scholar]
- Ali, S.; Gladieux, P.; Leconte, M.; Gautier, A.; Justesen, A.F.; Hovmoller, M.S.; Enjalbert, J.; de Vallavieille-Pope, C. Origin, migration routes and worldwide population genetic structure of the wheat yellow rust pathogen Puccinia striiformis f.sp. tritici. PLoS Pathog. 2014, 10, e1003903. [Google Scholar] [CrossRef] [Green Version]
- Hovmøller, M.S.; Walter, S.; Bayles, R.A.; Hubbard, A.; Flath, K.; Sommerfeldt, N.; Leconte, M.; Czembor, P.; Rodriguez-Algaba, J.; Thach, T.; et al. Replacement of the European wheat yellow rust population by new races from the centre of diversity in the near-Himalayan region. Plant Pathol. 2016, 65, 402–411. [Google Scholar] [CrossRef] [Green Version]
- Ali, S.; Rodriguez-Algaba, J.; Thach, T.; Sørensen, C.K.; Hansen, J.G.; Lassen, P.; Nazari, K.; Hodson, D.P.; Justesen, A.F.; Hovmøller, M.S. Yellow rust epidemics worldwide were caused by pathogen races from divergent genetic lineages. Front. Plant. Sci. 2017, 8, 1057. [Google Scholar] [CrossRef] [Green Version]
- Wan, A.M.; Zhao, Z.H.; Chen, X.M.; He, Z.H.; Jin, S.L.; Jia, Q.Z.; Yao, G.; Yang, J.X.; Wang, B.T.; Li, G.B.; et al. Wheat stripe rust epidemic and virulence of Puccinia striiformis f. sp. tritici in China in 2002. Plant Dis. 2004, 88, 896–904. [Google Scholar] [PubMed] [Green Version]
- Milus, E.A.; Seyran, E.; McNew, R. Aggressiveness of Puccinia striiformis f. sp. tritici isolates in the south-central United States. Plant Dis. 2006, 90, 847–852. [Google Scholar] [CrossRef] [Green Version]
- Ezzahiri, B.; Yahyaoui, A.; Hovmøller, M.S. An analysis of the 2009 epidemic of yellow rust on wheat in Morocco. In Proceedings of the 4th Regional Yellow Rust Conference for Central and West Asia and North Africa, Antalya, Turkey, 10–12 October 2009. [Google Scholar]
- Hodson, D.; Nazari, K. Serious Outbreaks of Wheat Stripe or Yellow Rust in Central and West Asia and North Africa-March/April 2010. Borlaug Global Rust Initiative, Newsroom, Rust in the News, April 2010 News Items. 2010. Available online: http://globalrust.org/traction/%20permalink/Pathogen206 (accessed on 30 August 2021).
- Singh, R.P.; Singh, P.K.; Rutkoski, J.; Hodson, D.P.; He, X.; Jørgensen, L.N.; Hovmøller, M.S.; Huerta-Espino, J. Disease impact on wheat yield potential and prospects of genetic control. Annu. Rev. Phytopathol. 2016, 54, 303–322. [Google Scholar] [CrossRef] [PubMed] [Green Version]
- Wellings, C.R.; Wright, D.G.; Keiper, F.; Loughman, R. First detection of wheat stripe rust in Western Australia: Evidence for a foreign incursion. Australas. Plant Pathol. 2003, 32, 321–322. [Google Scholar] [CrossRef]
- Wan, A.M.; Chen, X.M. Virulence characterization of Puccinia striiformis f. sp. tritici using a new set of Yr single-gene line differentials in the United States in 2010. Plant Dis. 2014, 98, 1534–1542. [Google Scholar] [CrossRef] [PubMed] [Green Version]
- Wan, A.M.; Chen, X.M.; Yuen, J. Races of Puccinia striiformis f. sp. tritici in the United States in 2011 and 2012 and comparison with races in 2010. Plant Dis. 2016, 100, 966–975. [Google Scholar] [CrossRef] [Green Version]
- Hubbard, A.; Lewis, C.M.; Yoshida, K.; Ramirez-Gonzalez, R.H.; de Vallavieille-Pope, C.; Thomas, J.; Kamoun, S.; Bayles, R.; Uauy, C.; Saunders, D.G. Field pathogenomics reveals the emergence of a diverse wheat yellow rust population. Genome Biol. 2015, 16, 1–15. [Google Scholar] [CrossRef] [Green Version]
- Rodriguez-Algaba, J.; Hovmøller, M.S.; Justesen, A.F. Sexual recombination within the “Kranich” race of the yellow rust fungus Puccinia striiformis f. sp. tritici on Berberis vulgaris. Eur. J. Plant Pathol. 2020, 156, 1169–1173. [Google Scholar] [CrossRef]
- Sharma-Poudyal, D.; Bai, Q.; Wan, A.M.; Wang, M.N.; See, D.R.; Chen, X.M. Molecular characterization of international collections of the wheat stripe rust pathogen Puccinia striiformis f. sp. tritici reveals high diversity and intercontinental migration. Phytopathology 2020, 110, 933–942. [Google Scholar] [CrossRef]
- Zhao, J.; Wang, L.; Wang, Z.Y.; Chen, X.M.; Zhang, H.C.; Yao, J.N.; Zhan, G.M.; Chen, W.; Huang, L.L.; Kang, Z.S. Identification of eighteen Berberis species as alternate hosts of Puccinia striiformis f. sp. tritici and virulence variation in the pathogen isolates from natural infection of barberry plants in China. Phytopathology 2013, 103, 927–934. [Google Scholar] [CrossRef] [Green Version]
- Wang, Z.Y.; Zhao, J.; Chen, X.M.; Peng, Y.L.; Ji, J.J.; Zhao, S.L.; Lv, Y.J.; Huang, L.L.; Kang, Z.S. Virulence variations of Puccinia striiformis f. sp. tritici isolates collected from Berberis spp. in China. Plant Dis. 2016, 100, 131–138. [Google Scholar] [CrossRef] [Green Version]
- Zhao, J.; Wang, M.N.; Chen, X.M.; Kang, Z.S. Role of alternate hosts in epidemiology and pathogen variation of cereal rusts. Annu. Rev. Phytopathol. 2016, 54, 207–228. [Google Scholar] [CrossRef]
- Hu, X.P.; Ma, L.J.; Liu, T.G.; Wang, C.H.; Peng, Y.L.; Pu, Q.; Xu, X.M. Population genetic analysis of Puccinia striiformis f. sp. tritici suggests two distinct populations in Tibet and the other regions of China. Plant Dis. 2017, 101, 288–296. [Google Scholar] [CrossRef] [Green Version]
- Wang, C.C.; Zhang, R.; Chu, B.Y.; Wu, B.M.; Ma, Z.H. Population genetic structure of Puccinia striiformis f. sp. tritici at the junction of Gansu, Sichuan and Shaanxi Provinces in China. Phytopathol. Res. 2019, 1, 25. [Google Scholar] [CrossRef] [Green Version]
- Hovmøller, M.S.; Walter, S.; Justesen, A.F. Escalating threat of wheat rusts. Science 2010, 329, 369. [Google Scholar] [CrossRef] [Green Version]
- Walter, S.; Ali, S.; Kemen, E.; Nazari, K.; Bahri, B.A.; Enjalbert, J.; Hansen, J.G.; Brown, J.K.; Sicheritz-Ponten, T.; Jones, J.; et al. Molecular markers for tracking the origin and worldwide distribution of invasive strains of Puccinia striiformis. Ecol. Evol. 2016, 6, 2790–2804. [Google Scholar] [CrossRef] [PubMed] [Green Version]
- Liu, T.L.; Wan, A.M.; Liu, D.C.; Chen, X.M. Changes of races and virulence genes of Puccinia striiformis f. sp. tritici, the wheat stripe rust pathogen, in the United States from 1968 to 2009. Plant Dis. 2017, 101, 1522–1532. [Google Scholar] [CrossRef] [PubMed] [Green Version]
- Cheng, P.; Chen, X.M.; Xu, L.S.; See, D.R. Development and characterization of expressed sequence tag-derived microsatellite markers for the wheat stripe rust fungus Puccinia striiformis f. sp. tritici. Mol. Ecol. Res. 2012, 12, 779–781. [Google Scholar]
- Cheng, P.; Chen, X.M. Virulence and molecular analyses support asexual reproduction of Puccinia striiformis f. sp. tritici in the U.S. Pacific Northwest. Phytopathology 2014, 104, 1208–1220. [Google Scholar] [CrossRef] [Green Version]
- Wang, M.N.; Wan, A.M.; Chen, X.M. Barberry as alternate host is important for Puccinia graminis f. sp. tritici but not for Puccinia striiformis f. sp. tritici in the U. S. Pacific Northwest. Plant Dis. 2015, 99, 1507–1516. [Google Scholar] [CrossRef] [PubMed] [Green Version]
- Wang, M.N.; Chen, X.M. Barberry does not function as an alternate host for Puccinia striiformis f. sp. tritici in the U. S. Pacific Northwest due to teliospore degradation and barberry phenology. Plant Dis. 2015, 99, 1500–1506. [Google Scholar] [CrossRef] [Green Version]
- Cheng, P.; Chen, X.M.; See, D. Grass hosts harbor more diverse isolates of Puccinia striiformis than cereal crops. Phytopathology 2016, 106, 362–371. [Google Scholar] [CrossRef] [PubMed]
- Xia, C.J.; Wang, M.N.; Wan, A.M.; Jiwan, D.A.; See, D.R.; Chen, X.M. Association analysis of SP-SNPs and avirulence genes in Puccinia striiformis f. sp. tritici, the wheat stripe rust pathogen. Am. J. Plant Sci. 2016, 7, 126–137. [Google Scholar] [CrossRef]
- Xia, C.J.; Wan, A.M.; Wang, M.N.; Jiwan, D.A.; See, D.R.; Chen, X.M. Secreted protein gene derived-single nucleotide polymorphisms (SP-SNPs) reveal population diversity and differentiation of Puccinia striiformis f. sp. tritici in the United States. Fungal Biol. 2016, 120, 729–744. [Google Scholar] [CrossRef] [PubMed] [Green Version]
- Liu, T.L.; Bai, Q.; Wang, M.N.; Li, Y.X.; Wan, A.M.; See, D.R.; Xia, C.J.; Chen, X.M. Genotyping Puccinia striiformis f. sp. tritici isolates with SSR and SP-SNP markers reveals dynamics of the wheat stripe rust pathogen in the United States from 1968 to 2009 and identifies avirulence associated markers. Phytopathology 2021. [Google Scholar] [CrossRef]
- Bai, Q.D.; Wan, A.M.; Wang, M.N.; See, D.R.; Chen, X.M. Population diversity, dynamics, and differentiation of wheat stripe rust pathogen Puccinia striiformis f. sp. tritici from 2010 to 2017 and comparison with 1968 to 2009 in the United States. Front. Microbiol. 2021, 12, 696835. [Google Scholar] [CrossRef]
- Lei, Y.; Wang, M.N.; Wan, A.M.; Xia, C.J.; See, D.R.; Zhang, M.; Chen, X.M. Virulence and molecular characterization of experimental isolates of the stripe rust pathogen (Puccinia striiformis) indicate somatic recombination. Phytopathology 2017, 107, 329–344. [Google Scholar] [CrossRef] [Green Version]
- Yuan, C.Y.; Wang, M.N.; Skinner, D.Z.; See, D.R.; Xia, C.J.; Guo, X.H.; Chen, X.M. Inheritance of virulence, construction of a linkage map, and mapping of virulence genes in Puccinia striiformis f. sp. tritici by virulence and molecular characterization of a sexual population through genotyping-by-sequencing. Phytopathology 2018, 108, 133–141. [Google Scholar] [CrossRef] [Green Version]
- Li, Y.X.; Wang, M.N.; See, D.R.; Chen, X.M. Ethyl-methanesulfonate mutagenesis generated diverse isolates of Puccinia striiformis f. sp. tritici. World J. Microbiol. Biotechnol. 2019, 35, 28. [Google Scholar] [CrossRef]
- Li, Y.X.; Xia, C.J.; Wang, M.N.; Yin, C.T.; Chen, X.M. Whole-genome sequencing of Puccinia striiformis f. sp. tritici mutant isolates identifies avirulence gene candidates. BMC Genom. 2020, 21, 247. [Google Scholar] [CrossRef] [Green Version]
- Xia, C.J.; Lei, Y.; Wang, M.N.; Chen, W.Q.; Chen, X.M. An avirulence gene cluster in the wheat stripe rust pathogen (Puccinia striiformis f. sp. tritici) identified through genetic mapping and whole-genome sequencing of a sexual population. mSphere 2020, 5, e00128-20. [Google Scholar] [CrossRef]
- Zhan, G.M.; Chen, X.M.; Kang, Z.S.; Huang, L.L.; Wang, M.N.; Wan, A.M.; Cheng, P.; Cao, S.Q.; Jin, S.L. Virulence and molecular comparison of Puccinia striiformis f. sp. tritici populations in China and the United States. Fungal Biol. 2012, 116, 643–653. [Google Scholar] [CrossRef] [PubMed]
- Sharma-Poudyal, D.; Chen, X.M.; Wan, A.M.; Zhan, G.M.; Kang, Z.S.; Cao, S.Q.; Jin, S.L.; Morgounov, A.; Akin, B.; Mert, Z.; et al. Virulence characterization of international collections of the wheat stripe rust pathogen, Puccinia striiformis f. sp. tritici. Plant. Dis. 2013, 97, 379–386. [Google Scholar] [CrossRef] [PubMed] [Green Version]
- Wan, A.M.; Muleta, K.T.; Zegeye, H.; Hundie, B.; Pumphrey, M.O.; Chen, X.M. Virulence characterization of wheat stripe rust fungus Puccinia striiformis f. sp. tritici in Ethiopia and evaluation of Ethiopian wheat germplasm for resistance to races of the pathogen from Ethiopia and the United States. Plant Dis. 2017, 101, 73–80. [Google Scholar] [CrossRef] [PubMed] [Green Version]
- Chen, X.M.; Wang, M.N.; Wan, A.M.; Bai, Q.; Li, M.J.; López, P.F.; Maccaferri, M.; Mastrangelo, A.M.; Barnes, C.W.; Cruz, D.F.C.; et al. Virulence characterization of Puccinia striiformis f. sp. tritici collections from six countries in 2013 to 2020. Can. J. Plant Pathol. 2021. [Google Scholar] [CrossRef]
- Shannon, C.E. A mathematical theory of communication. Bell Syst. Tech. J. 1948, 27, 379–423. [Google Scholar] [CrossRef] [Green Version]
- Stoddart, J.A.; Taylor, J.F. Genotypic diversity: Estimation and prediction in samples. Genetics 1988, 118, 705–711. [Google Scholar] [CrossRef]
- Agapow, P.M.; Burt, A. Indices of multilocus linkage disequilibrium. Mol. Ecol. Notes 2001, 1, 101–102. [Google Scholar] [CrossRef]
- Radhakrishnan, G.V.; Cook, N.; Bueno-Sancho, V.; Lewis, C.M.; Persoons, A.; Mitiku, A.G.; Heaton, M.; Davey, P.; Abeyo, B.; Alemayehu, Y.; et al. Mobile and real-time plant disease (MARPLE) diagnostics for strain-level identification of complex fungal pathogens. BMC Biol. 2019, 17, 65. [Google Scholar] [CrossRef] [PubMed] [Green Version]
- Bahri, B.; Leconte, M.; Ouffroukh, A.; de Vallavieille-Pope, C.; Enjalbert, J. Geographic limits of a clonal population of wheat yellow rust in the Mediterranean region. Mol. Ecol. 2009, 18, 4165–4179. [Google Scholar] [CrossRef]
- Sinha, P.; Chen, X.M. Potential infection risks of the wheat stripe rust and stem rust pathogens on barberry in Asia and southeastern Europe. Plants 2021, 10, 957. [Google Scholar] [CrossRef]
- Chen, X.M.; Moore, M.; Milus, E.A.; Long, D.L.; Line, R.F.; Marshall, D.; Jackson, L. Wheat stripe rust epidemics and races of Puccinia striiformis f. sp. tritici in the United States in 2000. Plant Dis. 2002, 86, 39–46. [Google Scholar] [CrossRef] [Green Version]
- Chen, X.M.; Penman, L.; Wan, A.M.; Cheng, P. Virulence races of Puccinia striiformis f. sp. tritici in 2006 and 2007 and development of wheat stripe rust and distributions, dynamics, and evolutionary relationships of races from 2000 to 2007 in the United States. Can. J. Plant Pathol. 2010, 32, 315–333. [Google Scholar] [CrossRef]
- Duan, X.Y.; Tellier, A.; Wan, A.M.; Leconte, M.; de Vallavieille-Pope, C.; Enjalbert, J. Puccinia striiformis f.sp. tritici presents high diversity and recombination in the over-summering zone of Gansu, China. Mycologia 2010, 102, 44–53. [Google Scholar] [CrossRef] [PubMed] [Green Version]
- Li, M.; Zhang, Y.; Chen, W.; Duan, X.; Liu, T.; Jia, Q.; Cao, S.; Xu, Z. Evidence for Yunnan as the major origin center of the dominant wheat fungal pathogen Puccinia striiformis f. sp. tritici. Aus. Plant Pathol. 2021, 50, 241–252. [Google Scholar] [CrossRef]
- Ali, S.; Leconte, M.; Walker, A.S.; Enjalbert, J.; de Vallavieille-Pope, C. Reduction in the sex ability of worldwide clonal populations of Puccinia striiformis f.sp. tritici. Fungal Genet. Biol. 2010, 47, 828–838. [Google Scholar] [CrossRef]
- Chen, J.; Upadhyaya, N.M.; Ortiz, D.; Sperschneider, J.; Li, F.; Bouton, C.; Breen, S.; Dong, C.; Xu, B.; Zhang, X.; et al. Loss of AvrSr50 by somatic exchange in stem rust leads to virulence for Sr50 resistance in wheat. Science 2017, 358, 1607–1610. [Google Scholar] [CrossRef] [PubMed] [Green Version]
- Li, F.; Upadhyaya, N.M.; Sperschneider, J.; Matny, O.; Nguyen-Phuc, H.; Mago, R.; Raley, C.; Miller, M.E.; Silverstein, K.A.T.; Henningsen, E.; et al. Emergence of the Ug99 lineage of the wheat stem rust pathogen through somatic hybridisation. Nat. Commun. 2019, 10, 5068. [Google Scholar] [CrossRef] [PubMed] [Green Version]
- Aljanabi, S.M.; Martinez, I. Universal and rapid salt-extraction of high quality genomic DNA for PCR-based techniques. Nucleic Acids Res. 1997, 25, 4692–4693. [Google Scholar] [CrossRef]
- Justesen, A.F.; Ridout, C.J.; Hovmøller, M.S. The recent history of Puccinia striiformis f. sp. tritici in Denmark as revealed by disease incidence and AFLP markers. Plant Pathol. 2002, 51, 13–23. [Google Scholar] [CrossRef] [Green Version]
- Chen, C.Q.; Zheng, W.M.; Buchenauer, H.; Huang, L.L.; Lu, N.H.; Kang, Z.S. Isolation of microsatellite loci from expressed sequence tag library of Puccinia striiformis f. sp. tritici. Mol. Ecol. Resour. 2009, 9, 236–238. [Google Scholar] [CrossRef] [PubMed]
- Enjalbert, J.; Duan, X.; Giraud, T.; Vautrin, D.; De Vallavieille-Pope, C.; Solignac, M. Isolation of twelve microsatellite loci, using an enrichment protocol, in the phytopathogenic fungus Puccinia striiformis f. sp. tritici. Mol. Ecol. Notes 2002, 2, 563–565. [Google Scholar] [CrossRef]
- Bahri, B.; Leconte, M.; de Vallavieille-Pope, C.; Enjalbert, J. Isolation of ten microsatellite loci in an EST library of the phytopathogenic fungus Puccinia striiformis f. sp. tritici. Conserv. Genet. 2009, 10, 1425. [Google Scholar] [CrossRef]
- Schuelke, M. An economic method for the fluorescent labeling of PCR fragments. Nat. Biotechnol. 2000, 18, 233–234. [Google Scholar] [CrossRef]
- Kamvar, Z.N.; Tabima, J.F.; Grünwald, N.J. Poppr: An R package for genetic analysis of populations with clonal, partially clonal, and/or sexual reproduction. PeerJ 2014, 2, e281. [Google Scholar] [CrossRef] [PubMed] [Green Version]
- Bruvo, R.; Michiels, N.K.; D’Souza, T.G.; Schulenburg, H. A simple method for the calculation of microsatellite genotype distances irrespective of ploidy level. Mol. Ecol. 2004, 13, 2101–2106. [Google Scholar] [CrossRef]
- Csárdi, G.; Nepusz, T. The igraph software package for complex network research. Int. J. Complex Syst. 2006, 1695, 1–9. [Google Scholar]
- Kamvar, Z.N.; Larsen, M.M.; Kanaskie, A.M.; Hansen, E.M.; Grünwald, N.J. Spatial and temporal analysis of populations of the sudden oak death pathogen in Oregon forests. Phytopathology 2015, 105, 982–989. [Google Scholar] [CrossRef] [PubMed] [Green Version]
- Murtagh, F.; Legendre, P. Ward’s hierarchical agglomerative clustering method: Which algorithms implement Ward’s criterion? J. Classif. 2014, 31, 274–295. [Google Scholar] [CrossRef] [Green Version]
- Shannon, C.E. A mathematical theory of communication. ACM Sigmobile MC2R 2001, 5, 3–55. [Google Scholar] [CrossRef]
- Peakall, R.O.D.; Peter, E.S. GENALEX 6: Genetic analysis in Excel. Population genetic software for teaching and research. Mol. Ecol. Notes 2006, 6, 288–295. [Google Scholar] [CrossRef]
- Excoffier, L.; Smouse, P.E.; Quattro, J.M. Analysis of molecular variance inferred from metric distances among DNA haplotypes: Application to human mitochondrial DNA restriction data. Genetics 1992, 131, 479–491. [Google Scholar] [CrossRef]
- Meirmans, P.G.; Liu, S. Analysis of molecular variance (AMOVA) for autopolyploids. Front. Ecol. Evol. 2018, 6, 66. [Google Scholar] [CrossRef] [Green Version]
- Jombart, T. Adegenet: A R package for the multivariate analysis of genetic markers. Bioinformatics 2008, 24, 1403–1405. [Google Scholar] [CrossRef] [PubMed] [Green Version]
- Jombart, T.; Devillard, S.; Balloux, F. Discriminant analysis of principal components: A new method for the analysis of genetically structured populations. BMC Genet. 2010, 11, 1–15. [Google Scholar] [CrossRef] [Green Version]
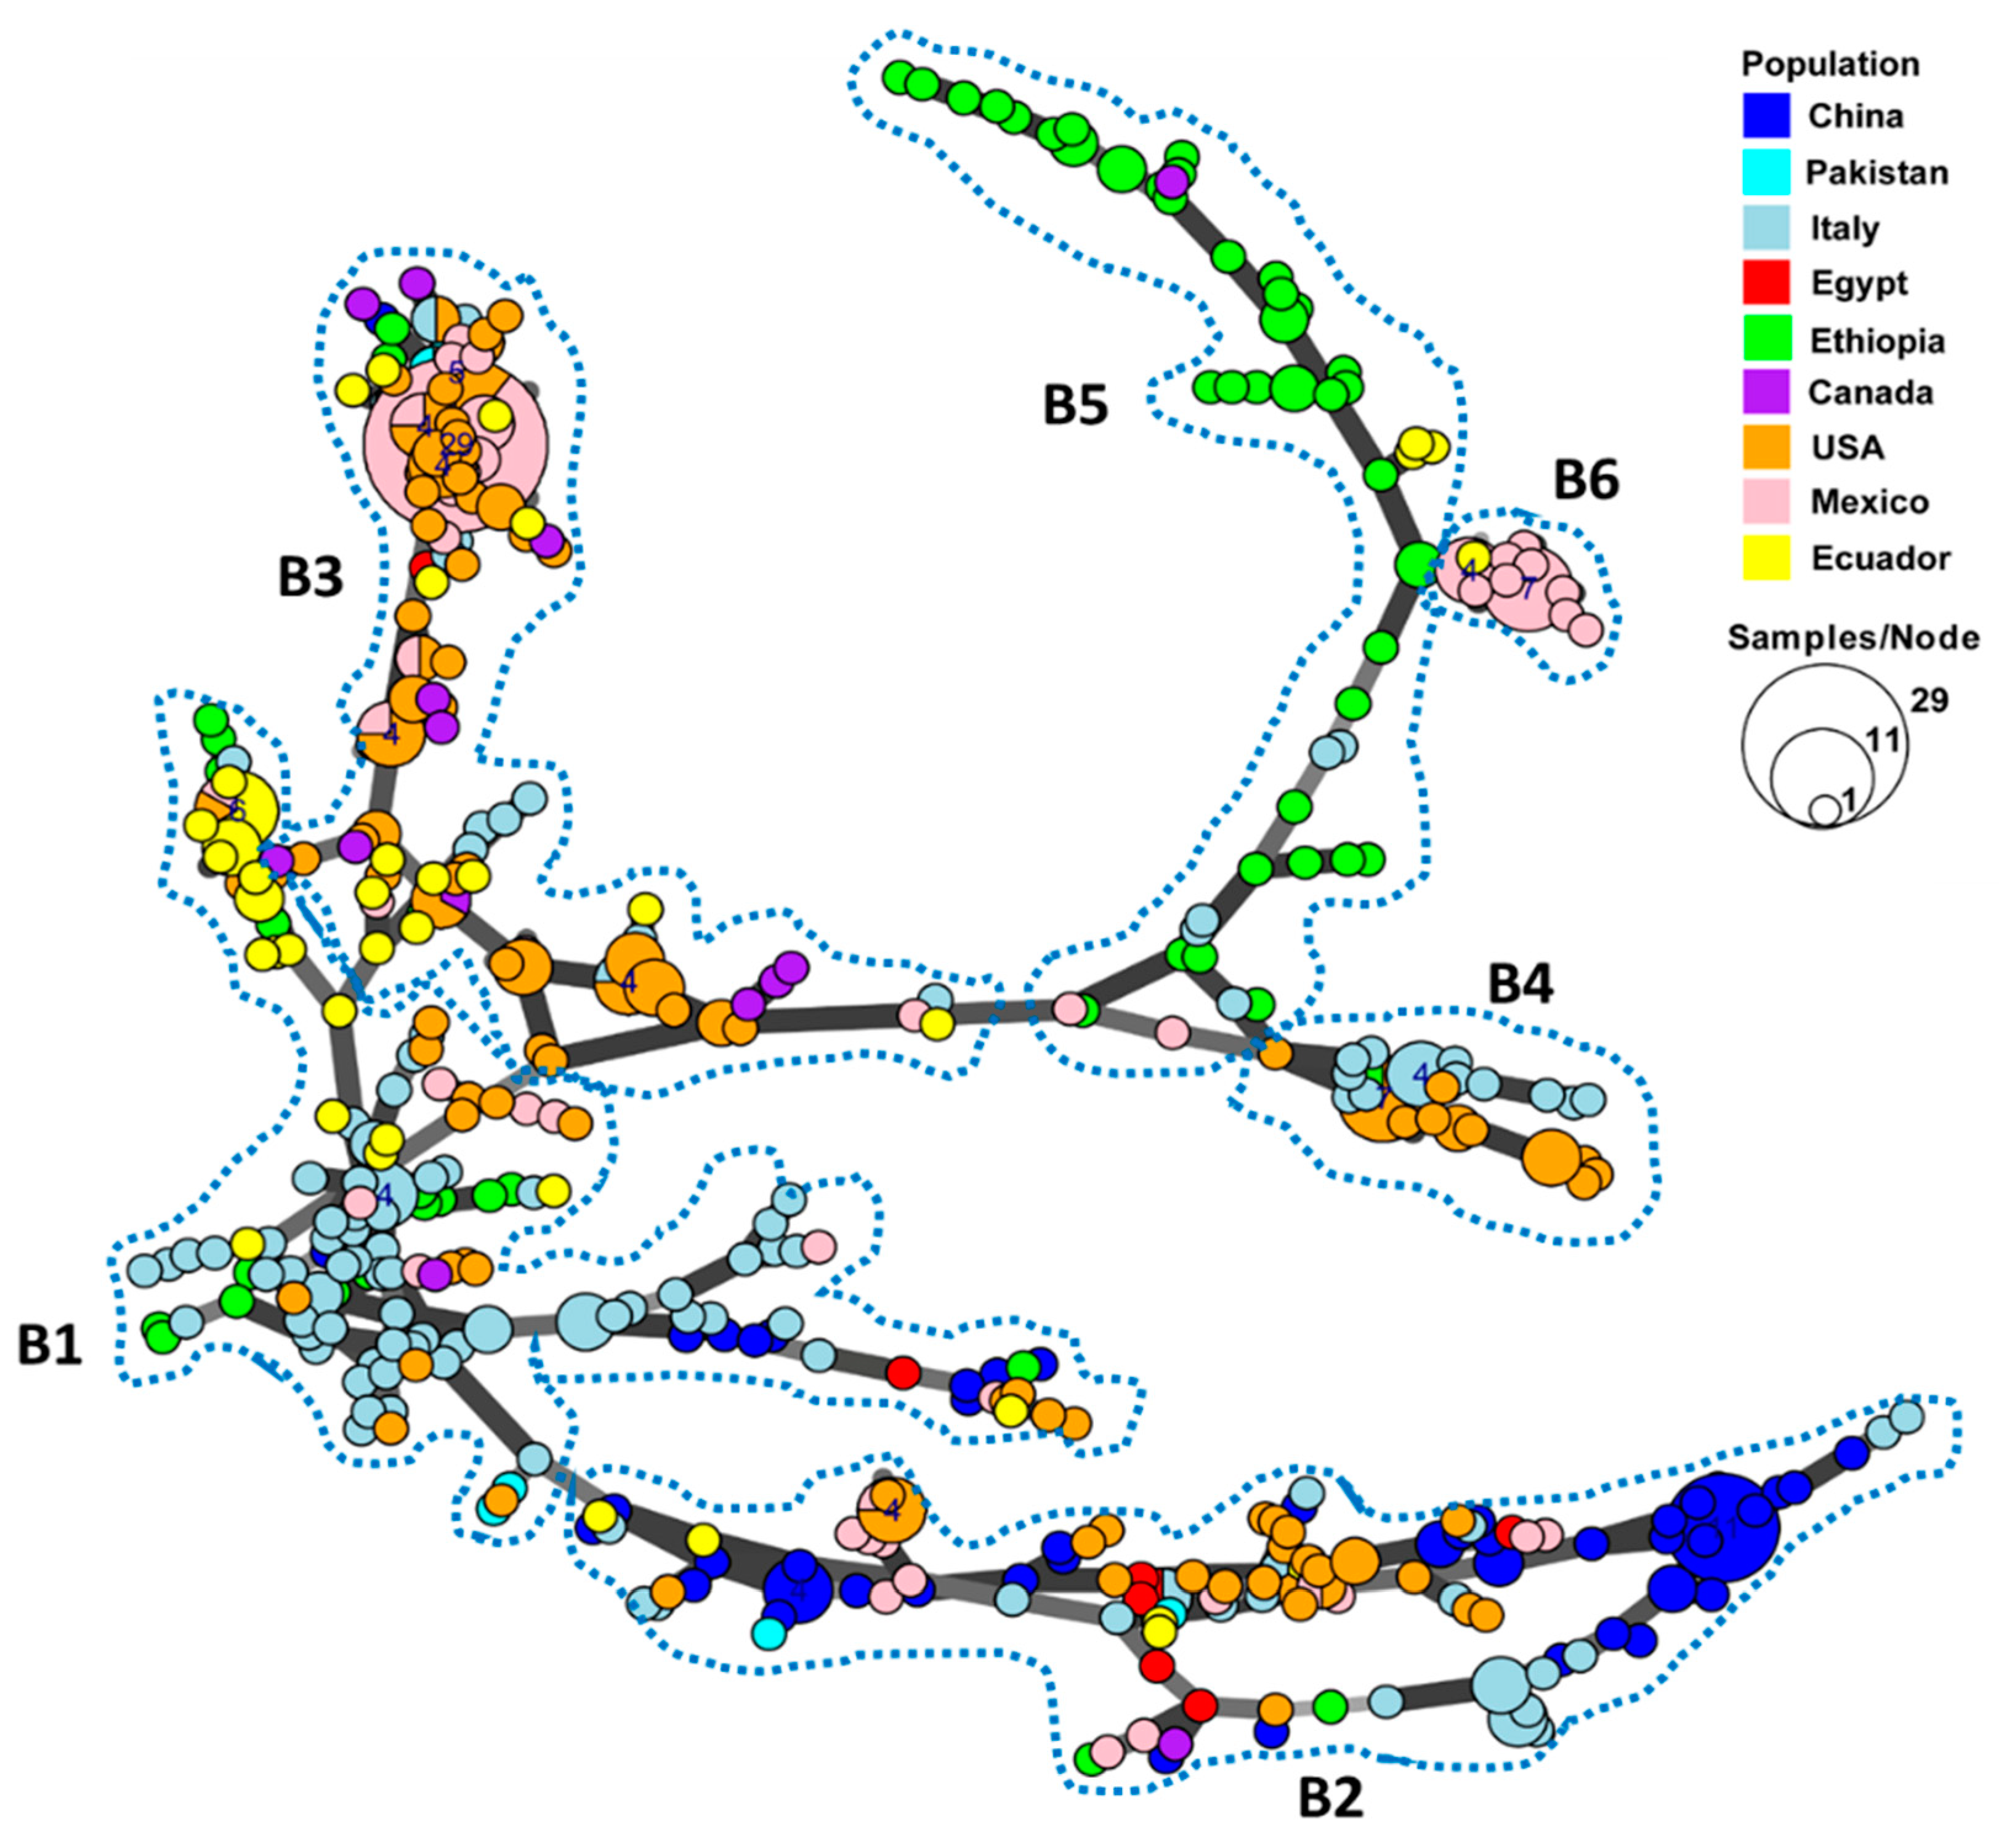
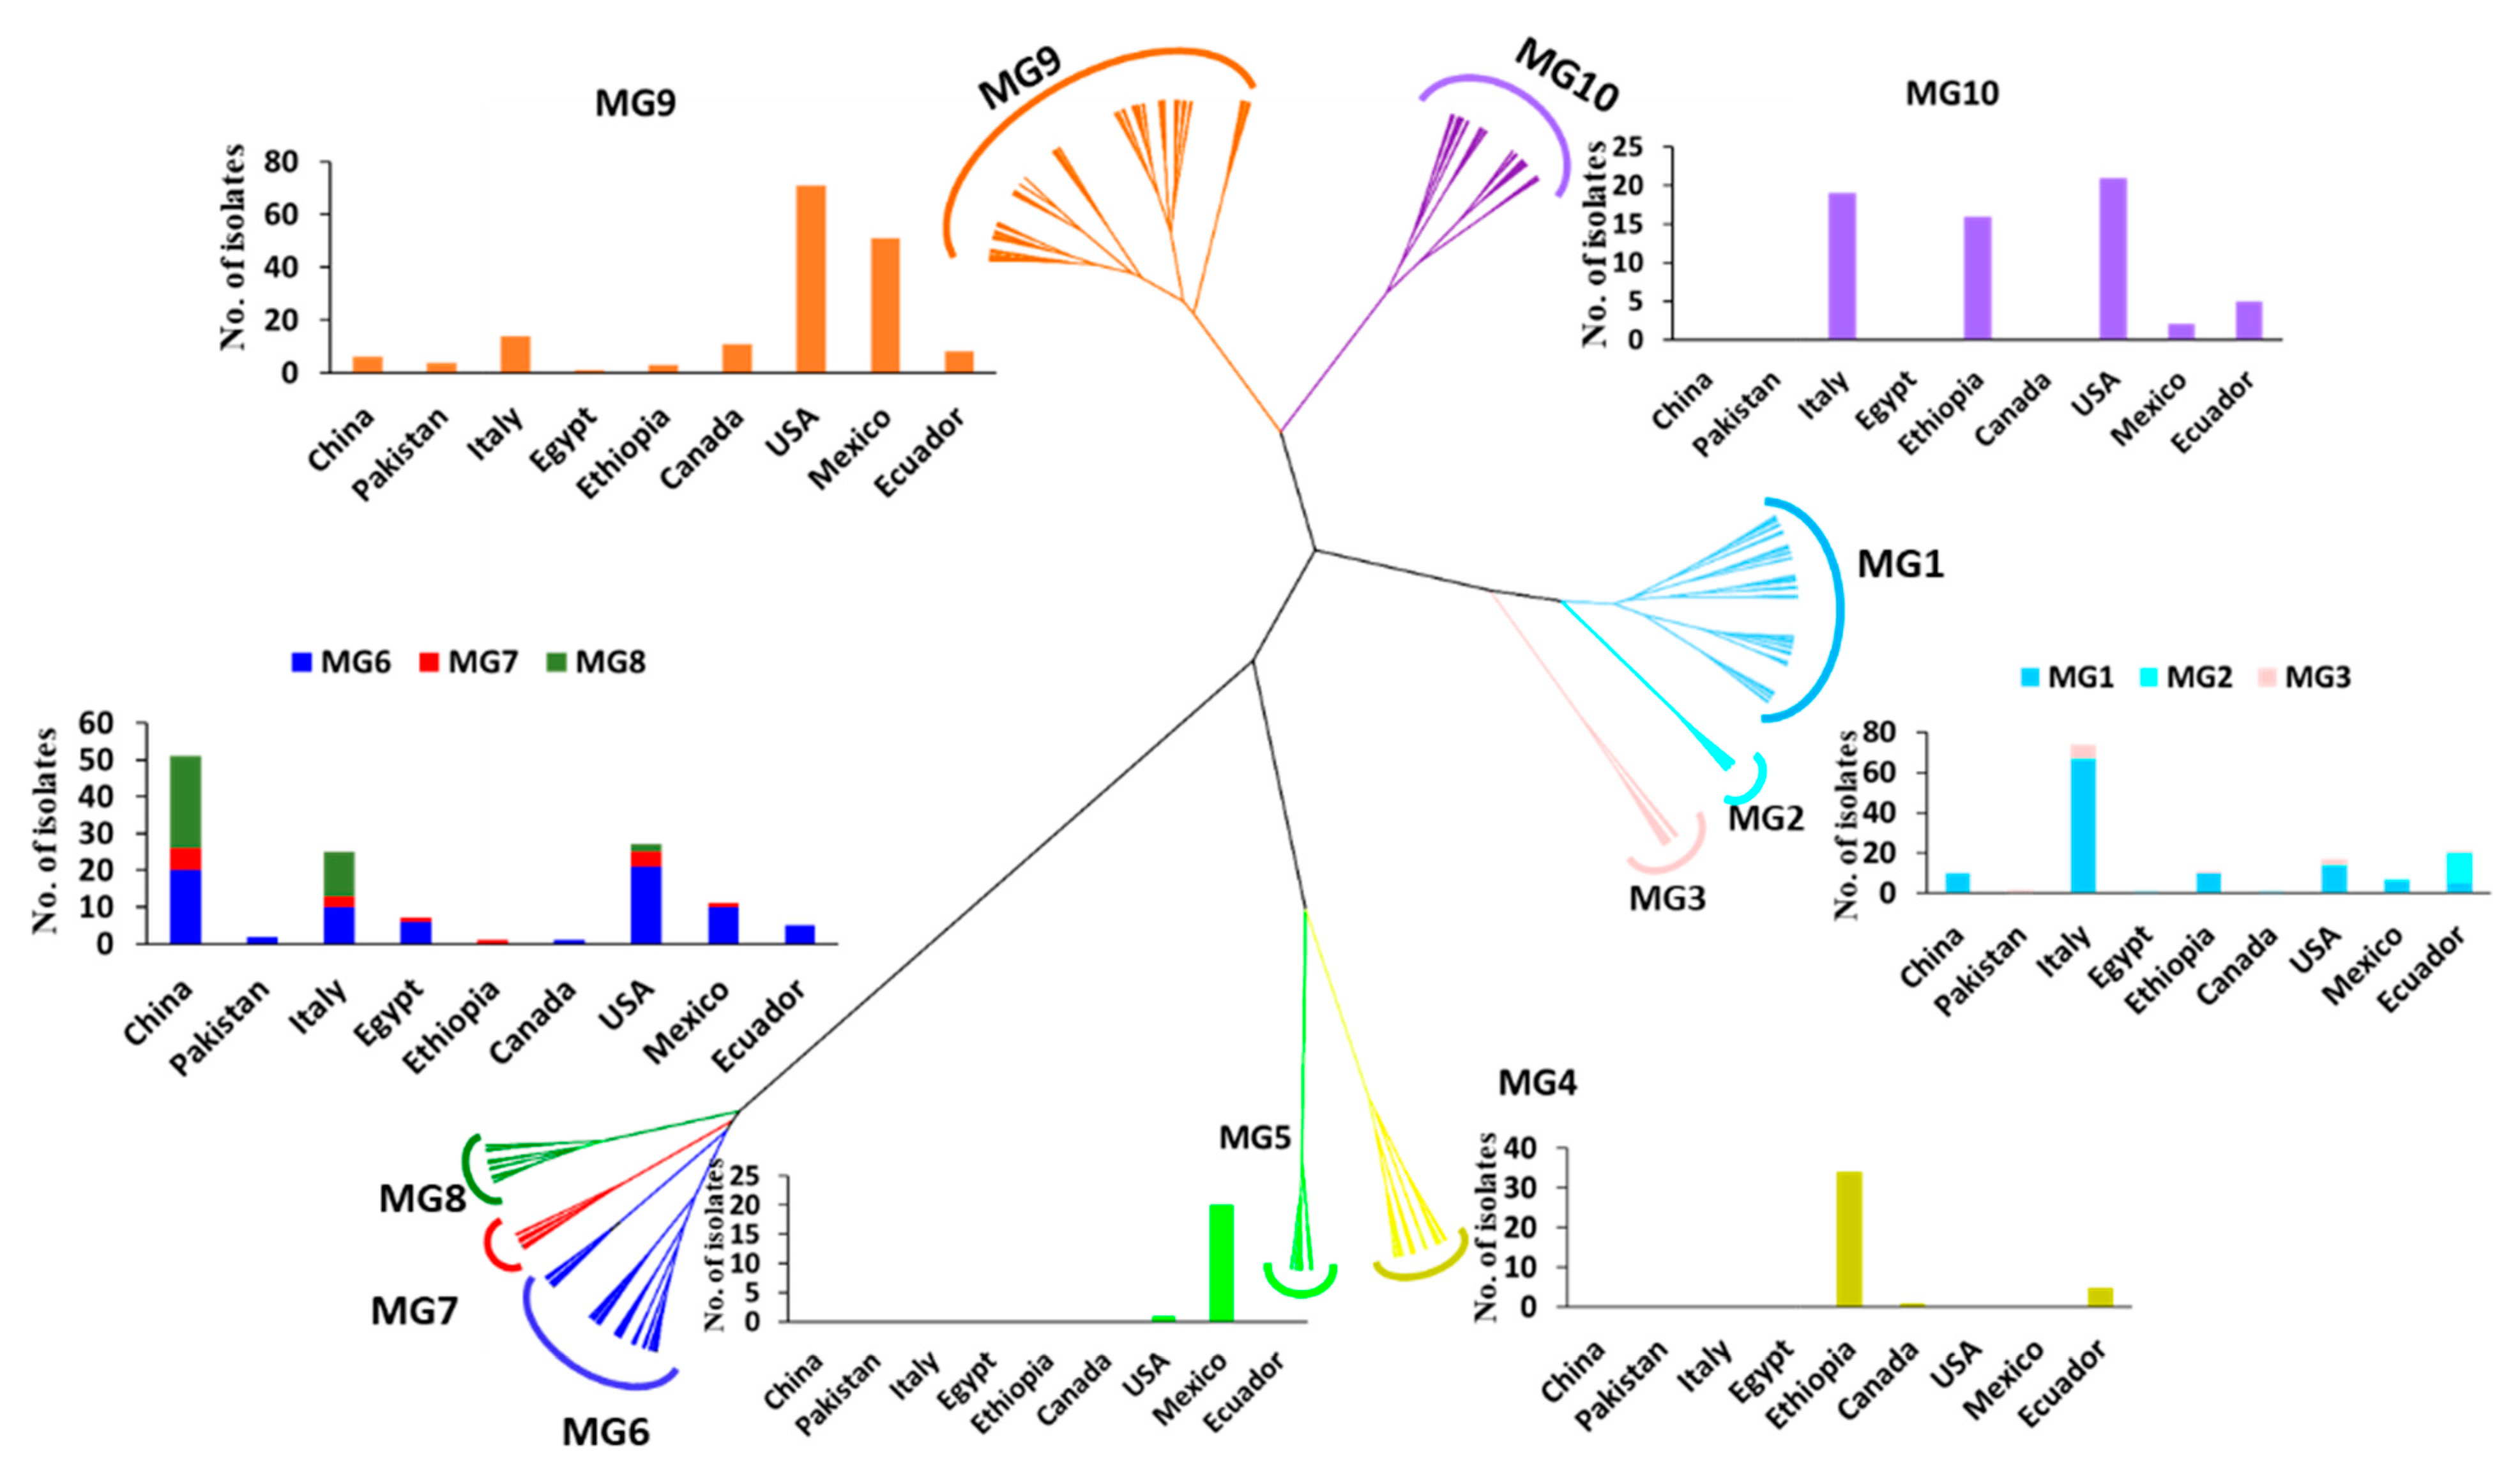
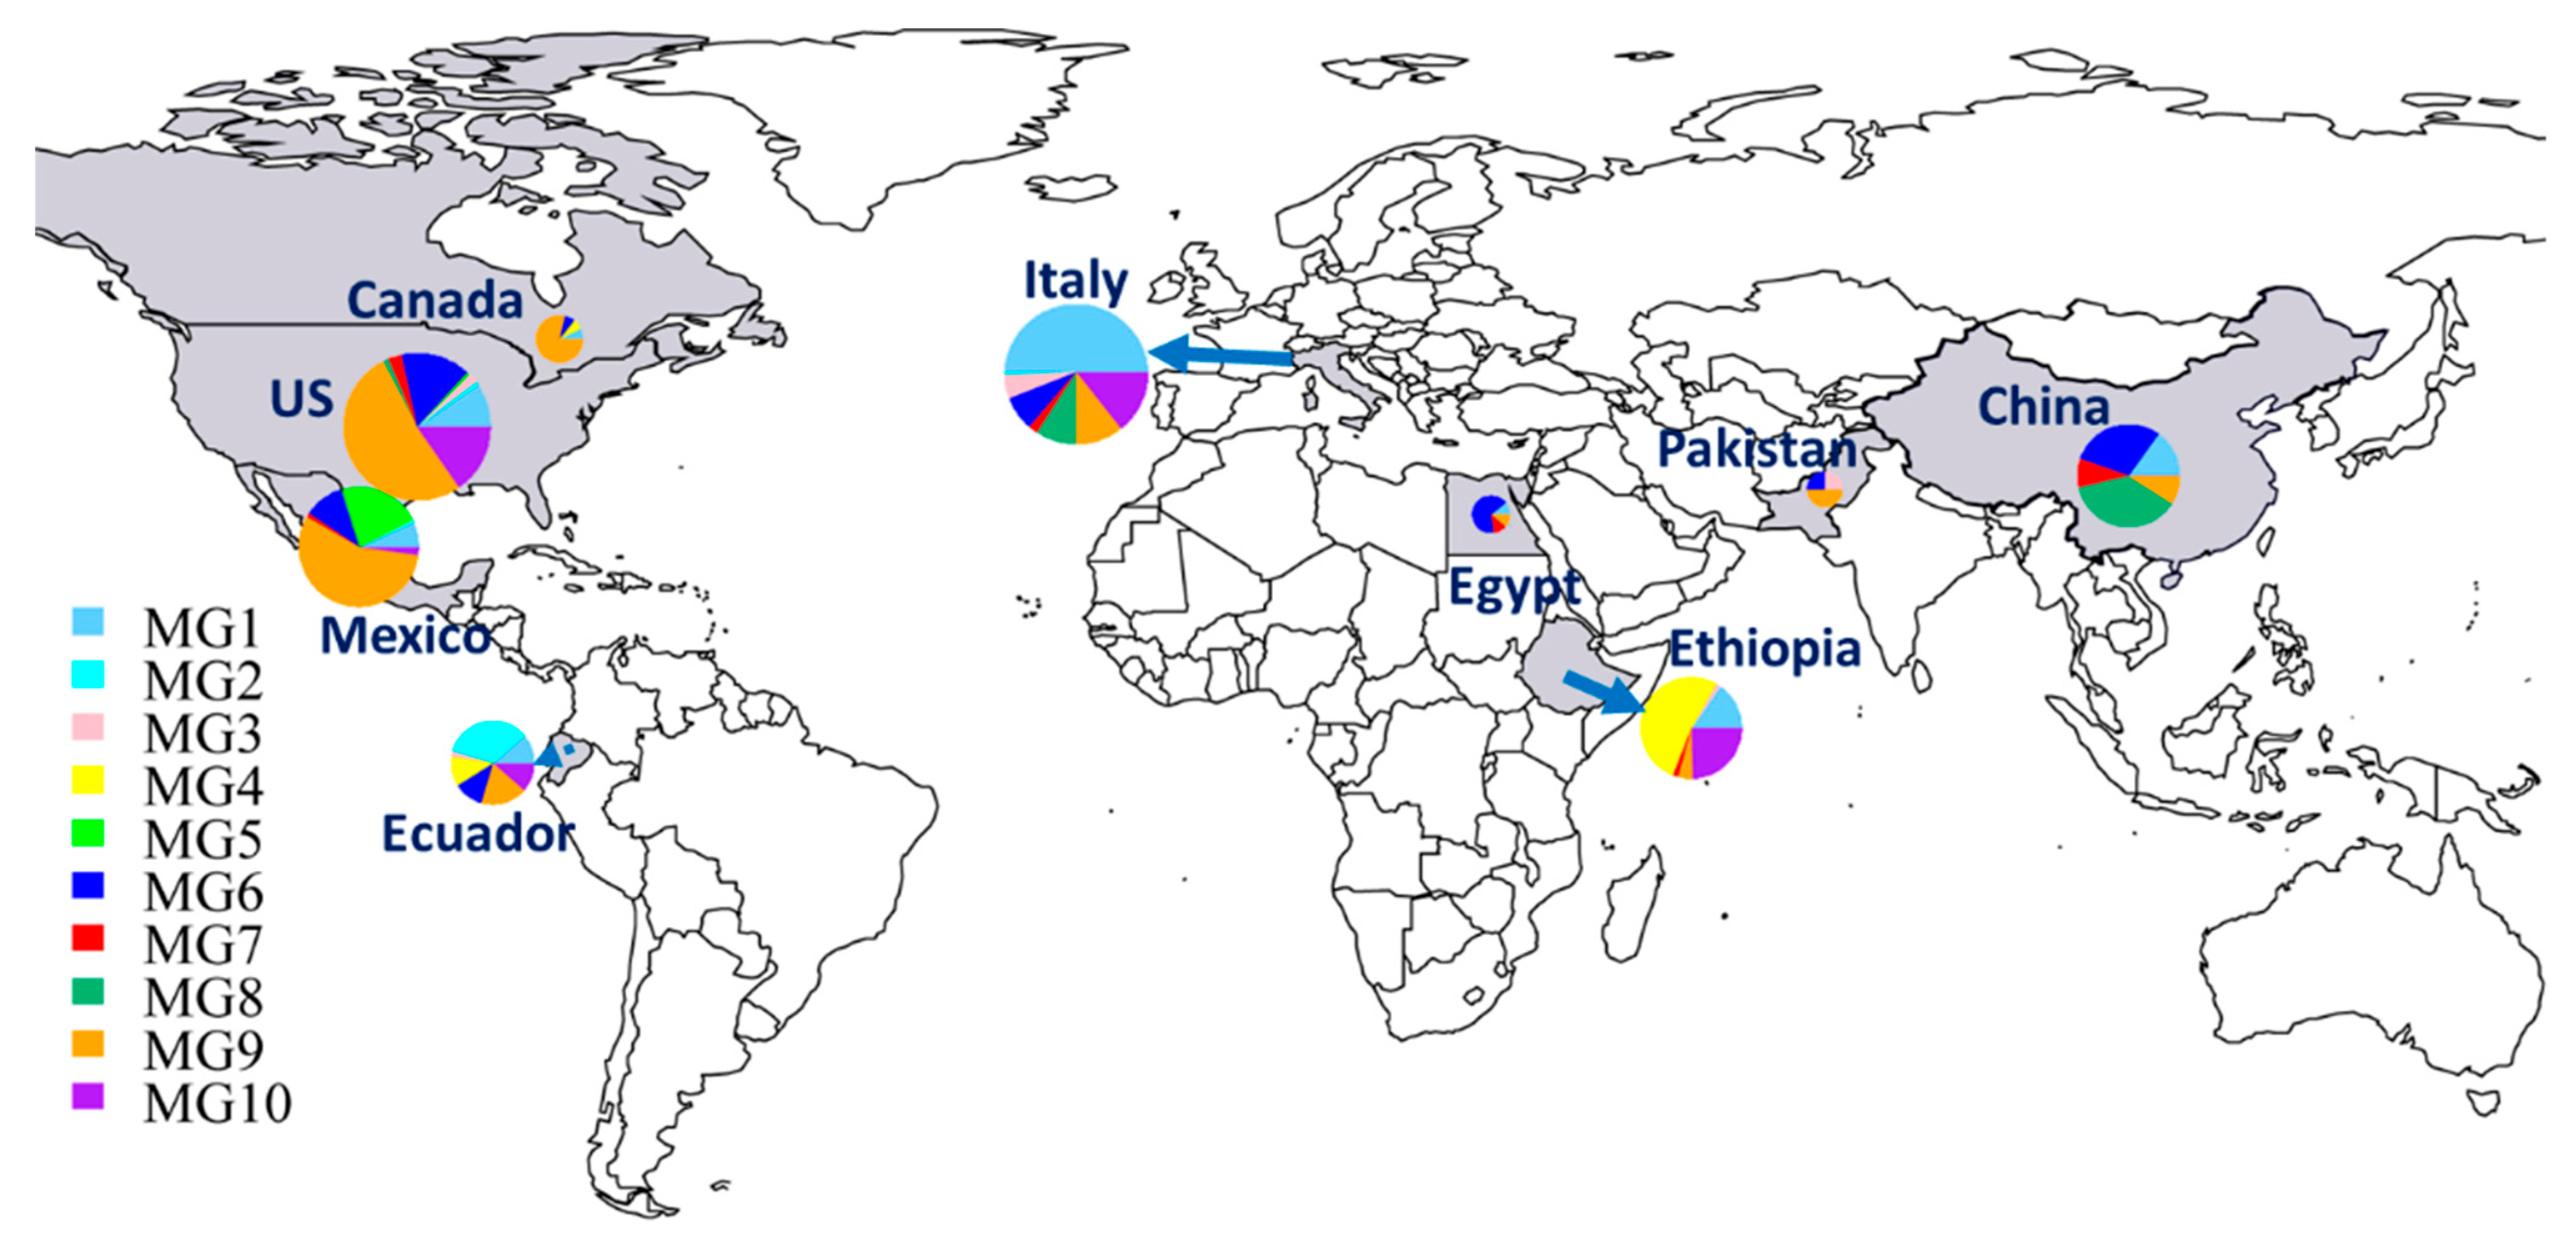
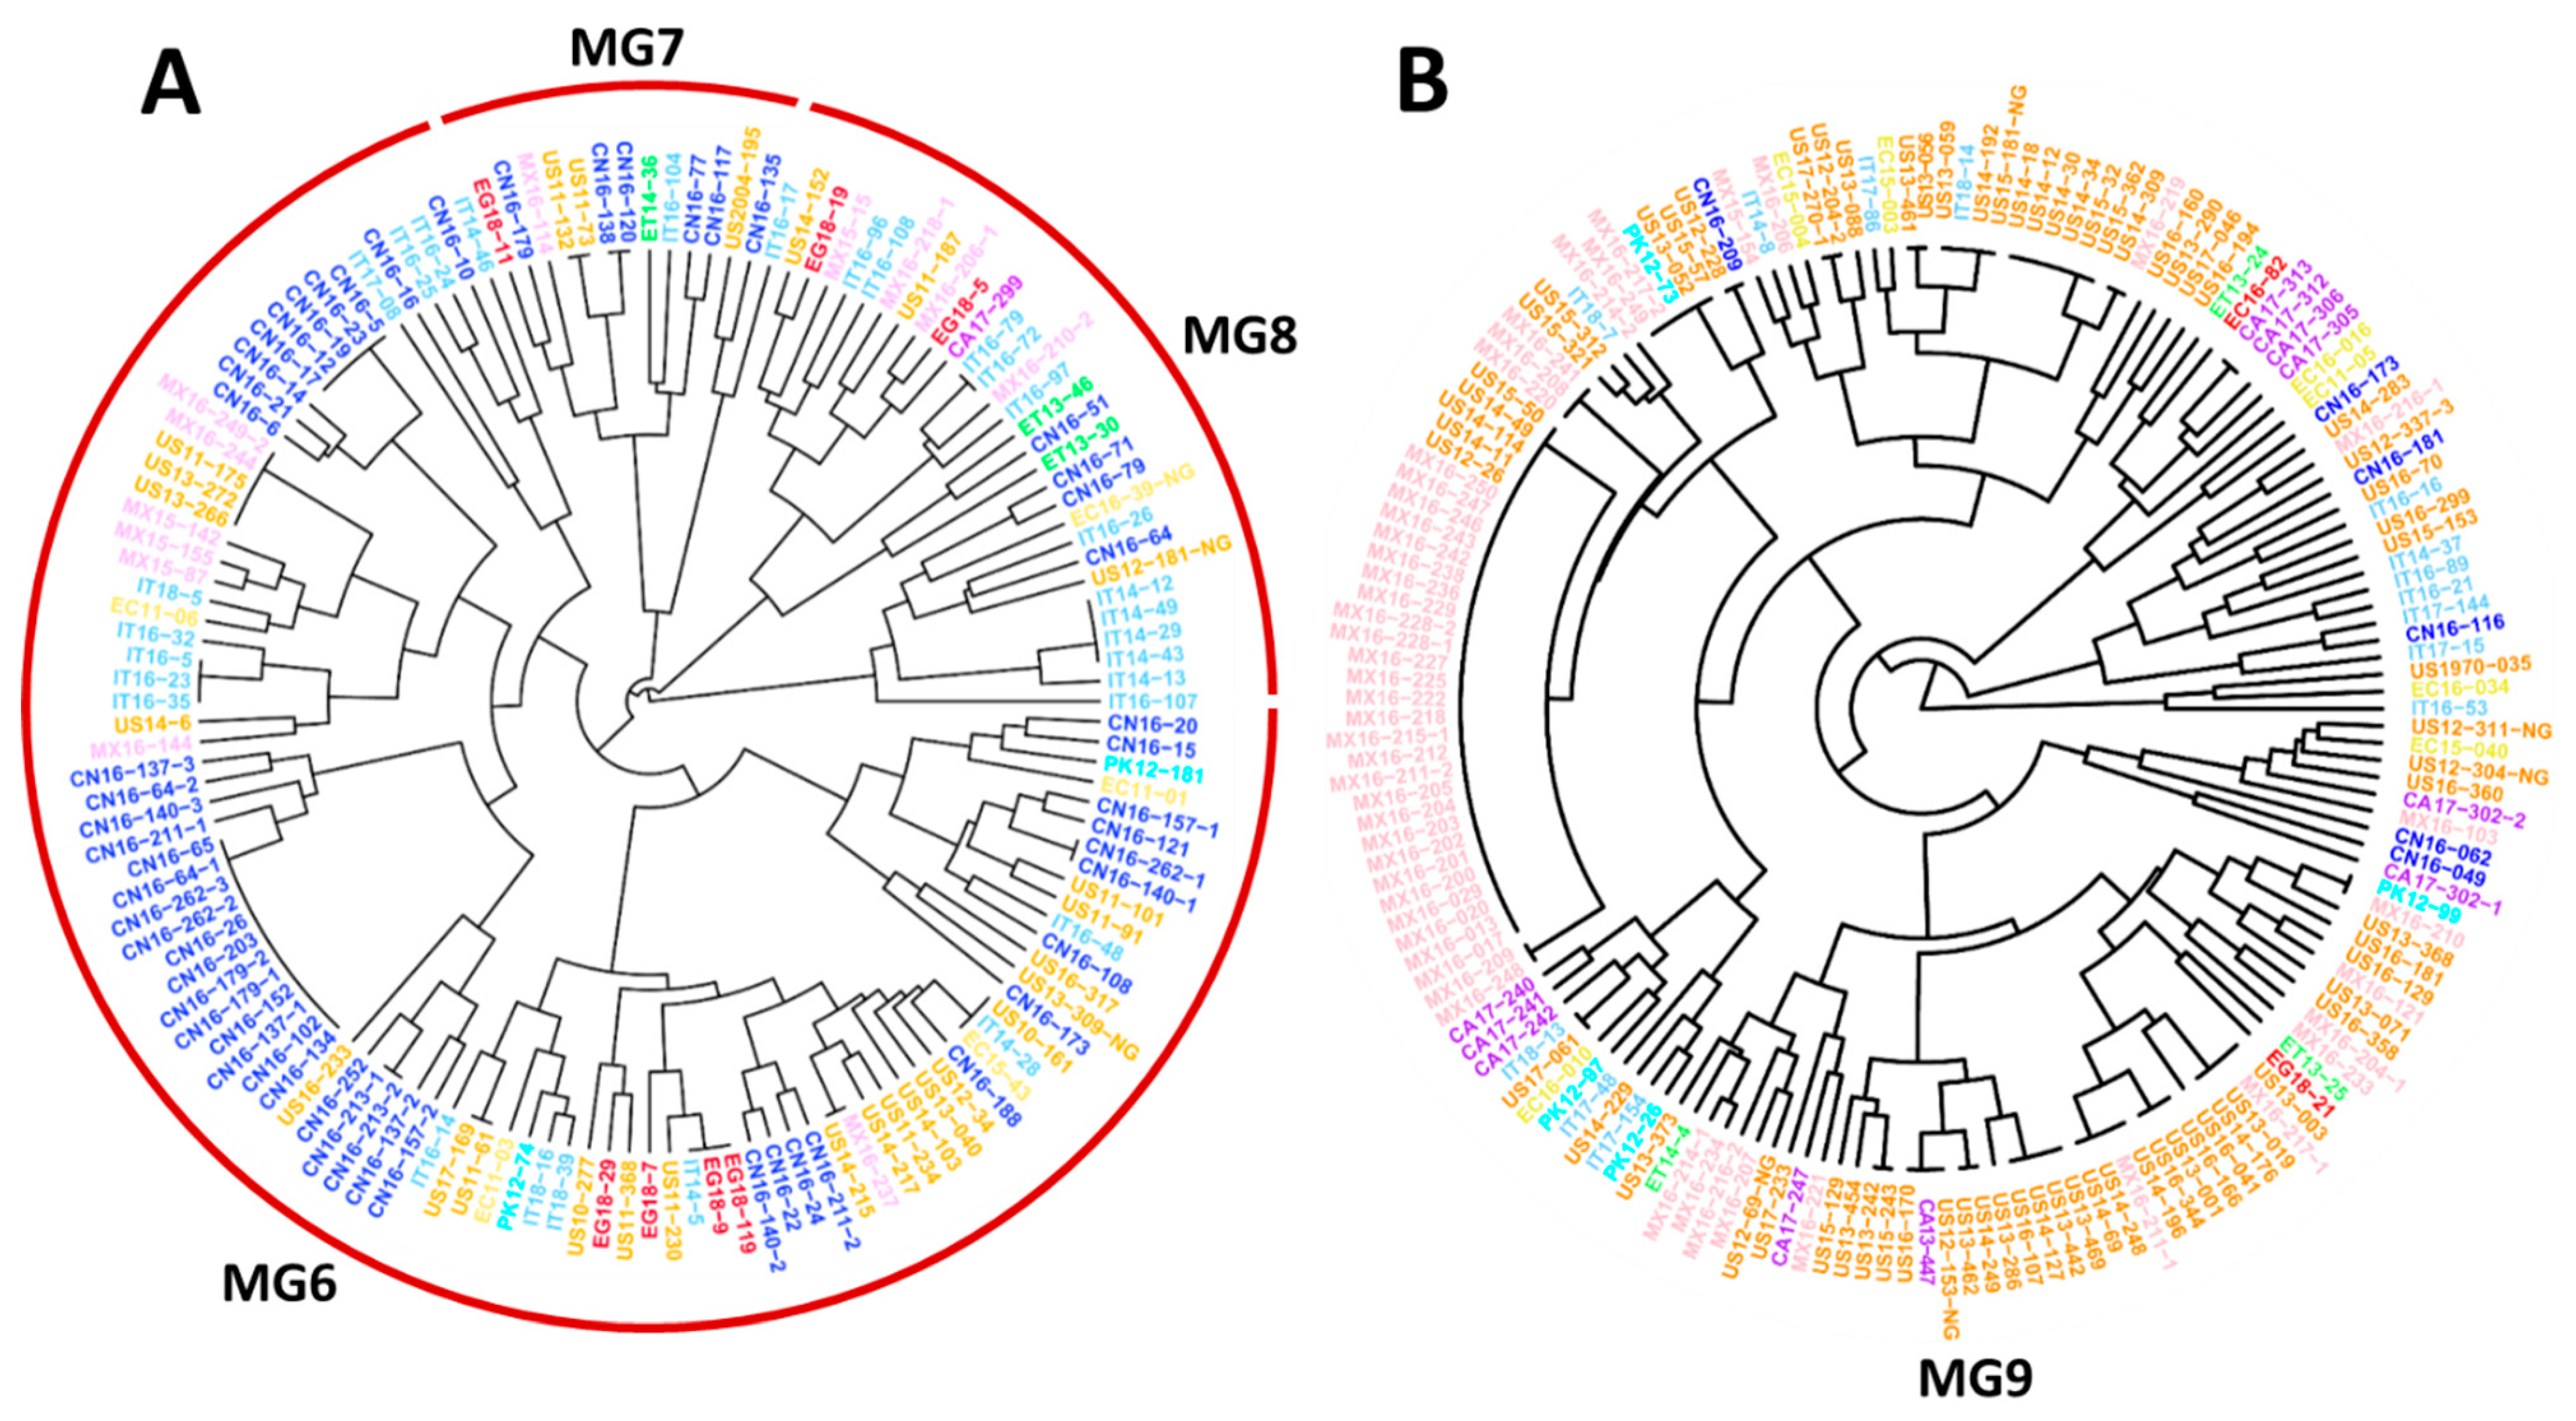
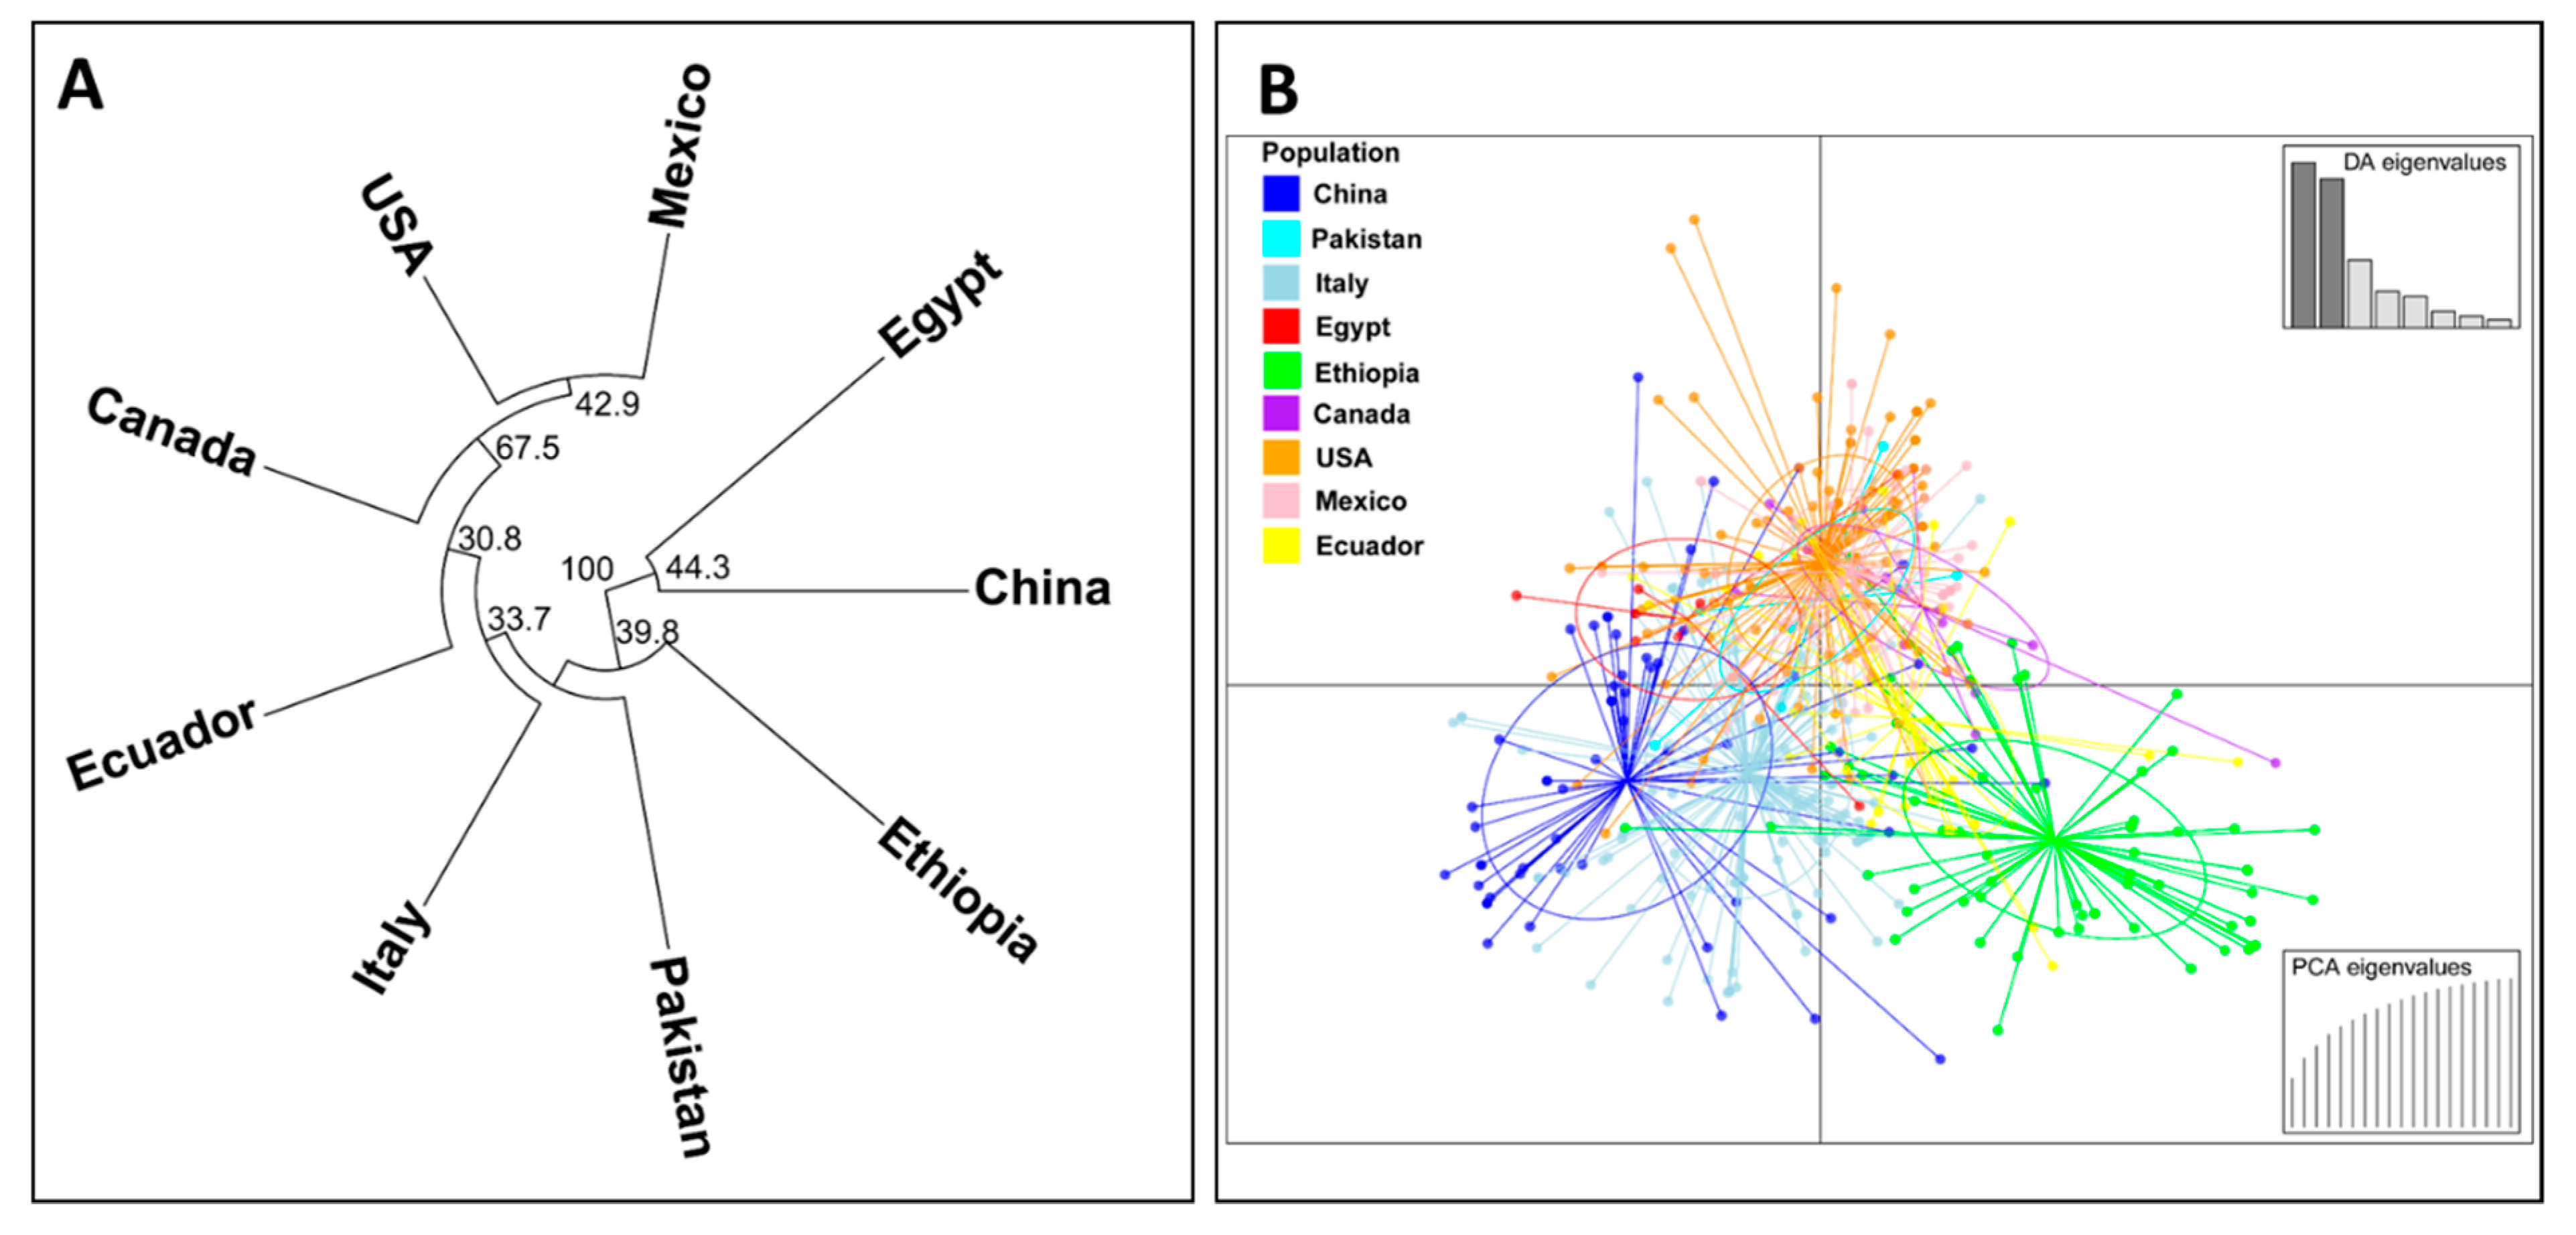
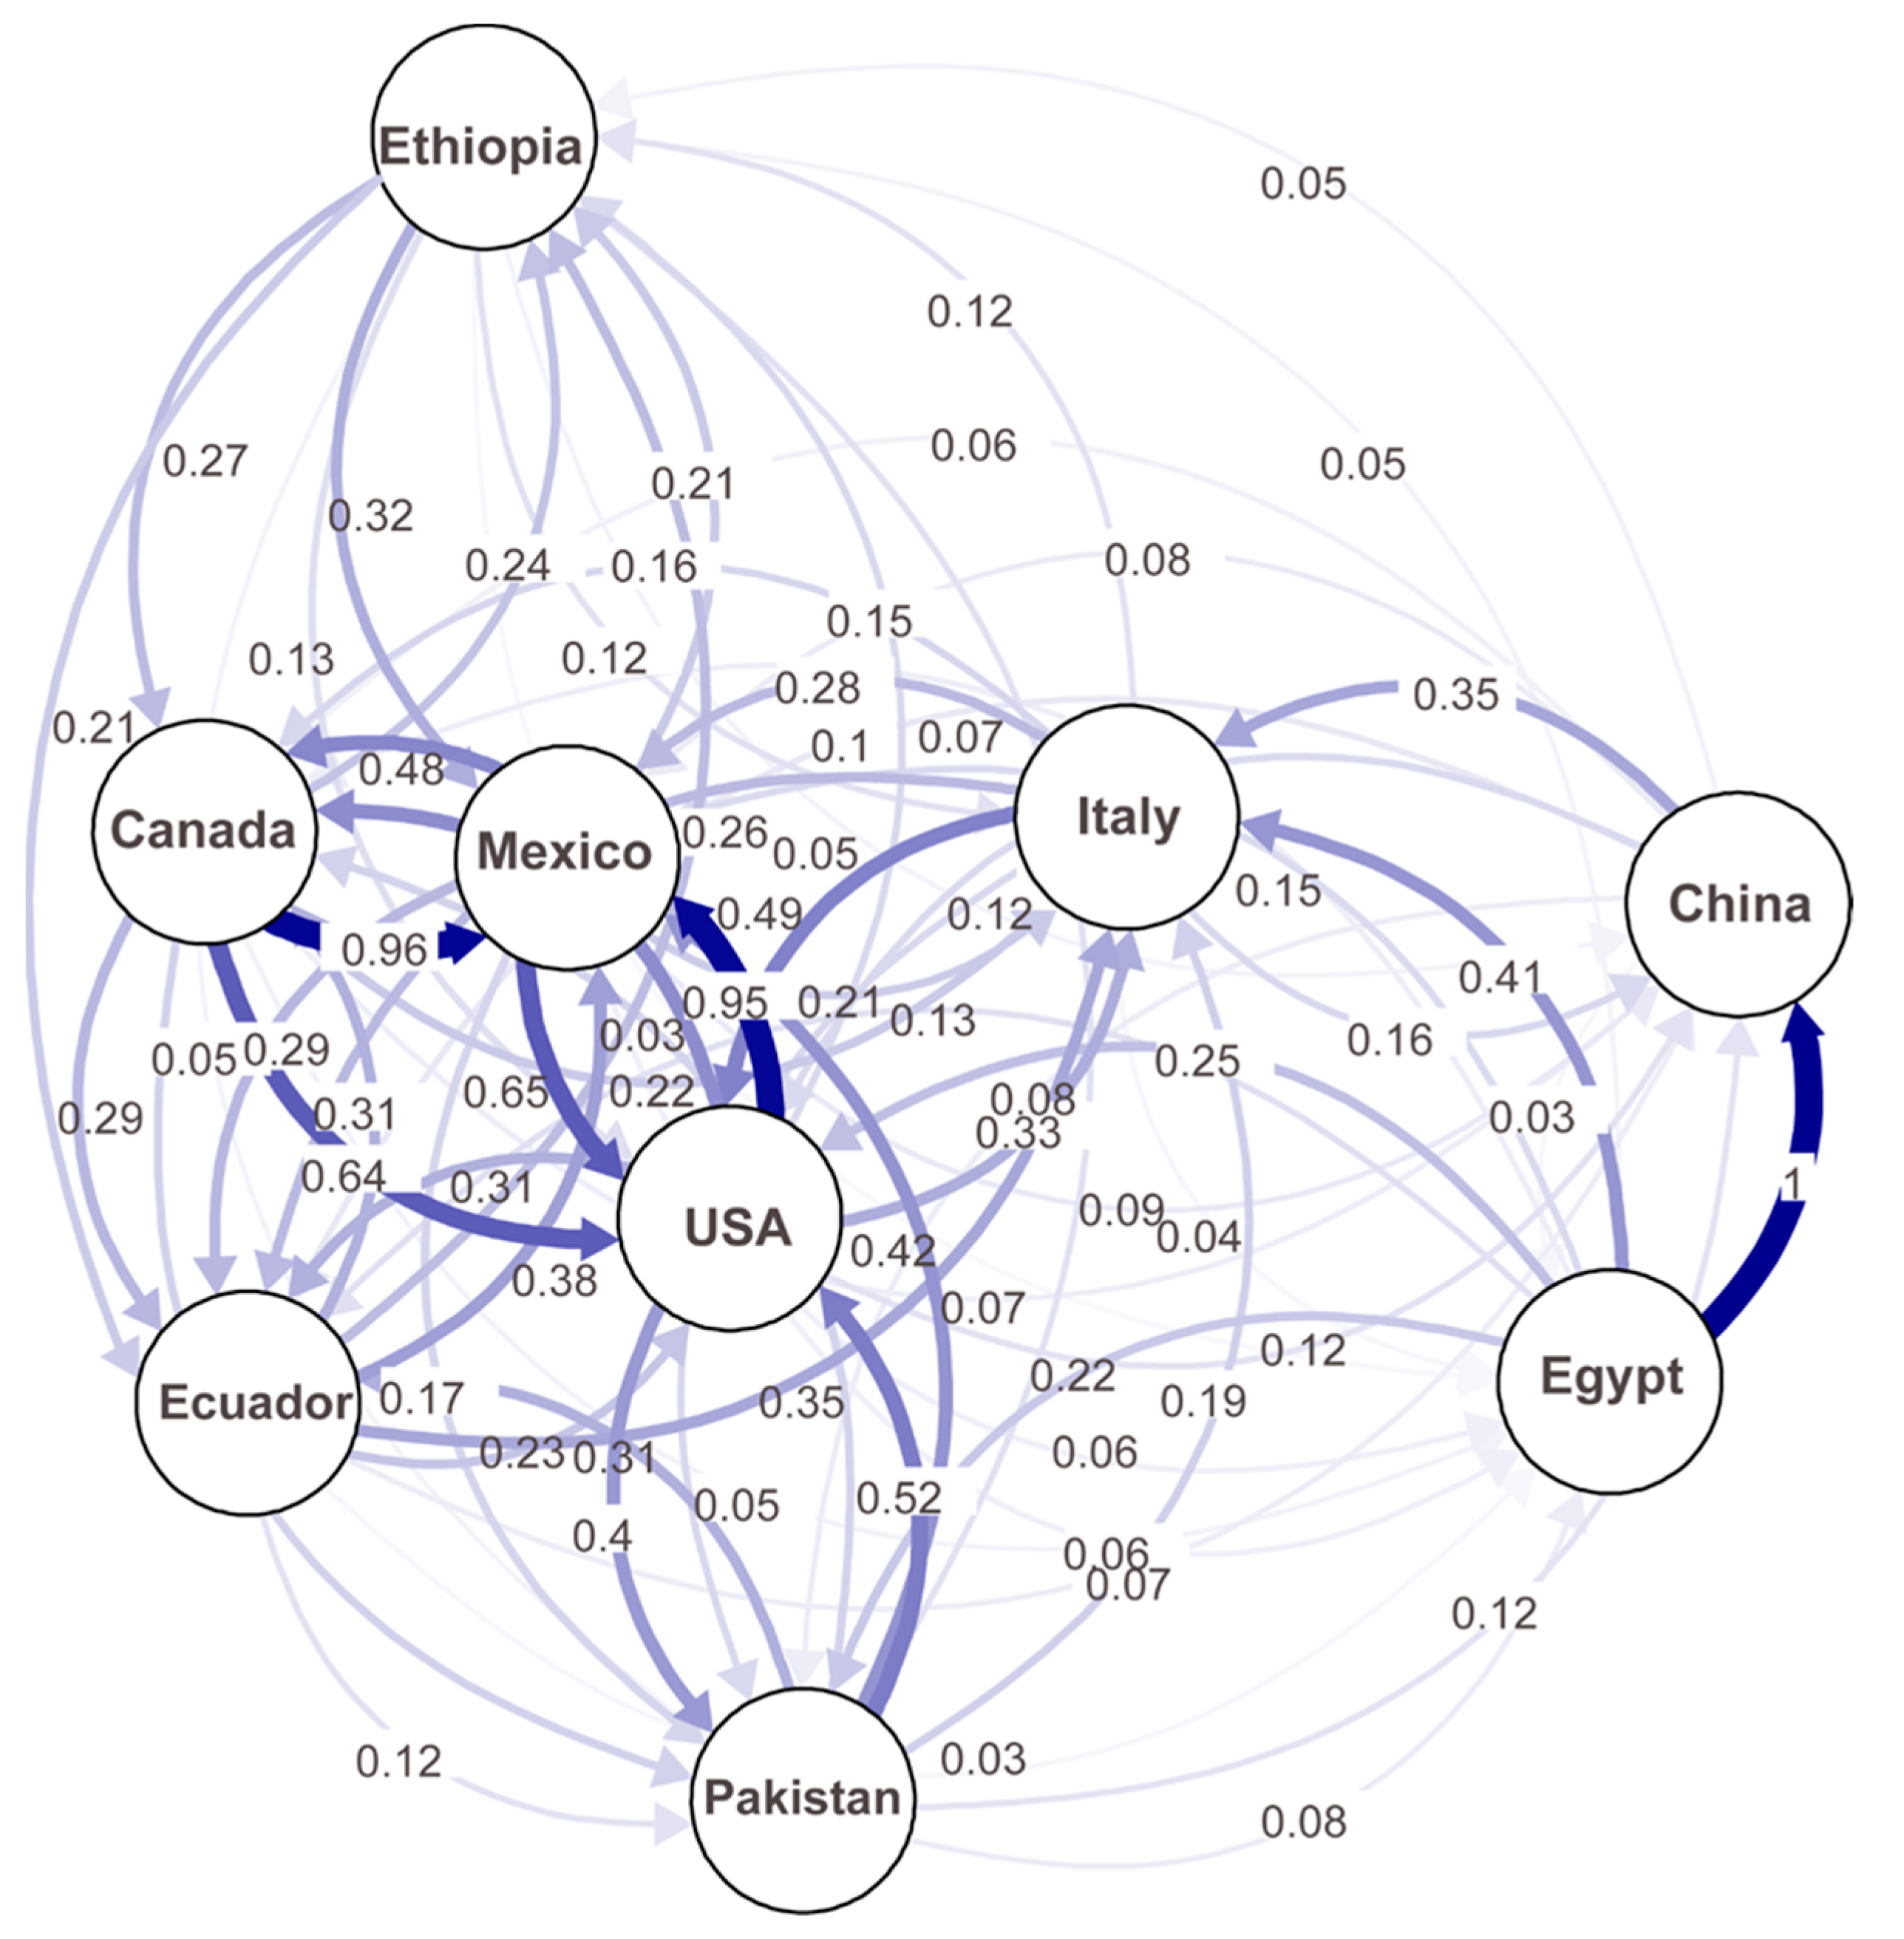
Publisher’s Note: MDPI stays neutral with regard to jurisdictional claims in published maps and institutional affiliations. |
© 2021 by the authors. Licensee MDPI, Basel, Switzerland. This article is an open access article distributed under the terms and conditions of the Creative Commons Attribution (CC BY) license (https://creativecommons.org/licenses/by/4.0/).