Article

Control of Vapor Pressure Deficit (VPD) on Black Sesame Seed (Sesamum indicum L.) Sprout Production in a Micro-Greenhouse Using Intelligent Control

by
Luis E. Barreto-Salazar
,
Jesús J. Rochín-Medina
,
Julio C. Picos-Ponce
,
David E. Castro-Palazuelos
and
Guillermo J. Rubio-Astorga
*
División de Estudios de Posgrado e Investigación, Tecnológico Nacional de México-IT, Culiacán 80220, Sinaloa, Mexico
*
Author to whom correspondence should be addressed.
Appl. Sci. 2021, 11(17), 7957; https://doi.org/10.3390/app11177957
Submission received: 21 July 2021 / Revised: 25 August 2021 / Accepted: 27 August 2021 / Published: 28 August 2021
(This article belongs to the Section Agricultural Science and Technology)

Abstract

:
The demand for fresh and healthy food has been increasing, and different options for growing sprouts have been presented to solve this, such as traditional techniques and cultivation under controlled conditions. However, sprout farming has not explored all the tools available to produce these foods under controlled conditions. This study presents an alternative to produce sesame seed sprouts in a micro-greenhouse applying intelligent control algorithms for vapor pressure deficit. There was an improvement of 56% in the germination percentage, 2.59 in the germination index, 9.7% in the production of proteins, 1.1% in ash and an increase of 77.03 mm in the sprouts’ length collected in the micro-greenhouse in comparison with the traditional technique. This was achieved by maintaining a mean error for soil moisture at 87% and 0.93 kPa for vapor pressure deficit by applying proportional–integral–derivative, fuzzy logic and neural network control algorithms in the micro-greenhouse. The study shows that the nutritional content, the measured germination parameters and the size are improved in sesame sprout production by applying intelligent control algorithms for vapor pressure deficit in a micro-greenhouse.

1. Introduction

The production of fresh and healthy food has experienced an important worldwide demand in recent years. This is caused by population growth in regions where the production of these foods is complicated due to the weather conditions [1]. Some of these fresh and healthy foods are sprouts, as they have a good quantity of enzymes, carbohydrates, vitamins, and minerals. Sesame seeds are oilseeds that have good nutritional characteristics and contain 50–60% oil rich in unsaturated fats, 20% proteins and 6.4–21% carbohydrates [2,3,4]. In addition, they are a good source of minerals such as calcium, phosphorus, zinc and magnesium; thus, they are included in people’s diets [5]. One of the ways to take advantage of sesame’s nutritional characteristics is seed germination. The germination process produces effects on the biochemical composition of sesame seeds in which the type of seed and germination conditions are involved [6].
For sprout production, traditional techniques such as pots, glass jars or wet towels have been used, mainly in homes for personal consumption [7]. The traditional technique, being exposed to the outside, complicates the germination process due to not being able to control variables to maintain the appropriate conditions. For this reason, sprouts are also produced in a controlled environment, where the crop is isolated from the outside, modifying its environment to extend the harvest period, increase yield, improve sprout quality and dispose of the products when traditional production is limited [8]. Temperature, humidity and soil moisture are involved in the germination process [9,10,11]. Temperature and humidity are physical variables that define the behavior of vapor pressure deficit (VPD), and this is a way of measuring the climate inside a greenhouse. VPD control represents a useful tool to solve physiological problems in plants, and it helps to improve the absorption of water and fertilizers from the soil, which would benefit the sprouts in obtaining the necessary nutrients to develop and obtain better yield of the crop and better quality of the product. To achieve this, it is required to use intelligent control algorithms that maintain the temperature and humidity within the appropriate values for the VPD to improve the production of sesame sprouts [12,13,14].
Investigations related to climate control in greenhouses have been reported in recent years. In [15,16,17], greenhouse climate control designs evaluated in simulations with fuzzy control techniques were presented. Investigations have also been presented where fogging, micro-fog and airflow systems were applied for the control of VPD in a greenhouse, screenhouse and chambers, as mentioned in [18,19,20,21,22]. The VPD has been mathematically modeled as reported in [23]. Based on the above, in [24], work was presented where VPD is modeled using fuzzy logic. The climatic conditions to produce sprouts have been considered for research related to sesame seeds. Studies have been presented where sesame seeds were germinated under different environmental conditions to determine the germination parameters and the sprout size [25,26,27,28,29]. Additionally, [30,31,32] analyzed the nutritional content of sesame sprouts produced under different physical conditions. Previous investigations have designed and simulated intelligent climate control systems in greenhouses. However, these works do not consider the characteristics of the actuators that they control in the implementation of their designs, and do not establish the mathematical equations of those systems. Although fuzzy logic has been used to model the behavior of VPD, an intelligent control focused on VPD as a convenient tool in sesame sprout production in a controlled environment is not mentioned in previous research. Therefore, in this research, thermal systems were established for the control of VPD through temperature and humidity to improve the germination parameters, size and nutritional value in the sesame germination process using intelligent control algorithms such as fuzzy logic (FL) and neural networks (NNs) for VPD and PID for soil moisture in a micro-greenhouse.

2. Materials and Methods

2.1. Materials

2.1.1. Seed Preparation in Micro-Greenhouse and Traditional Technique
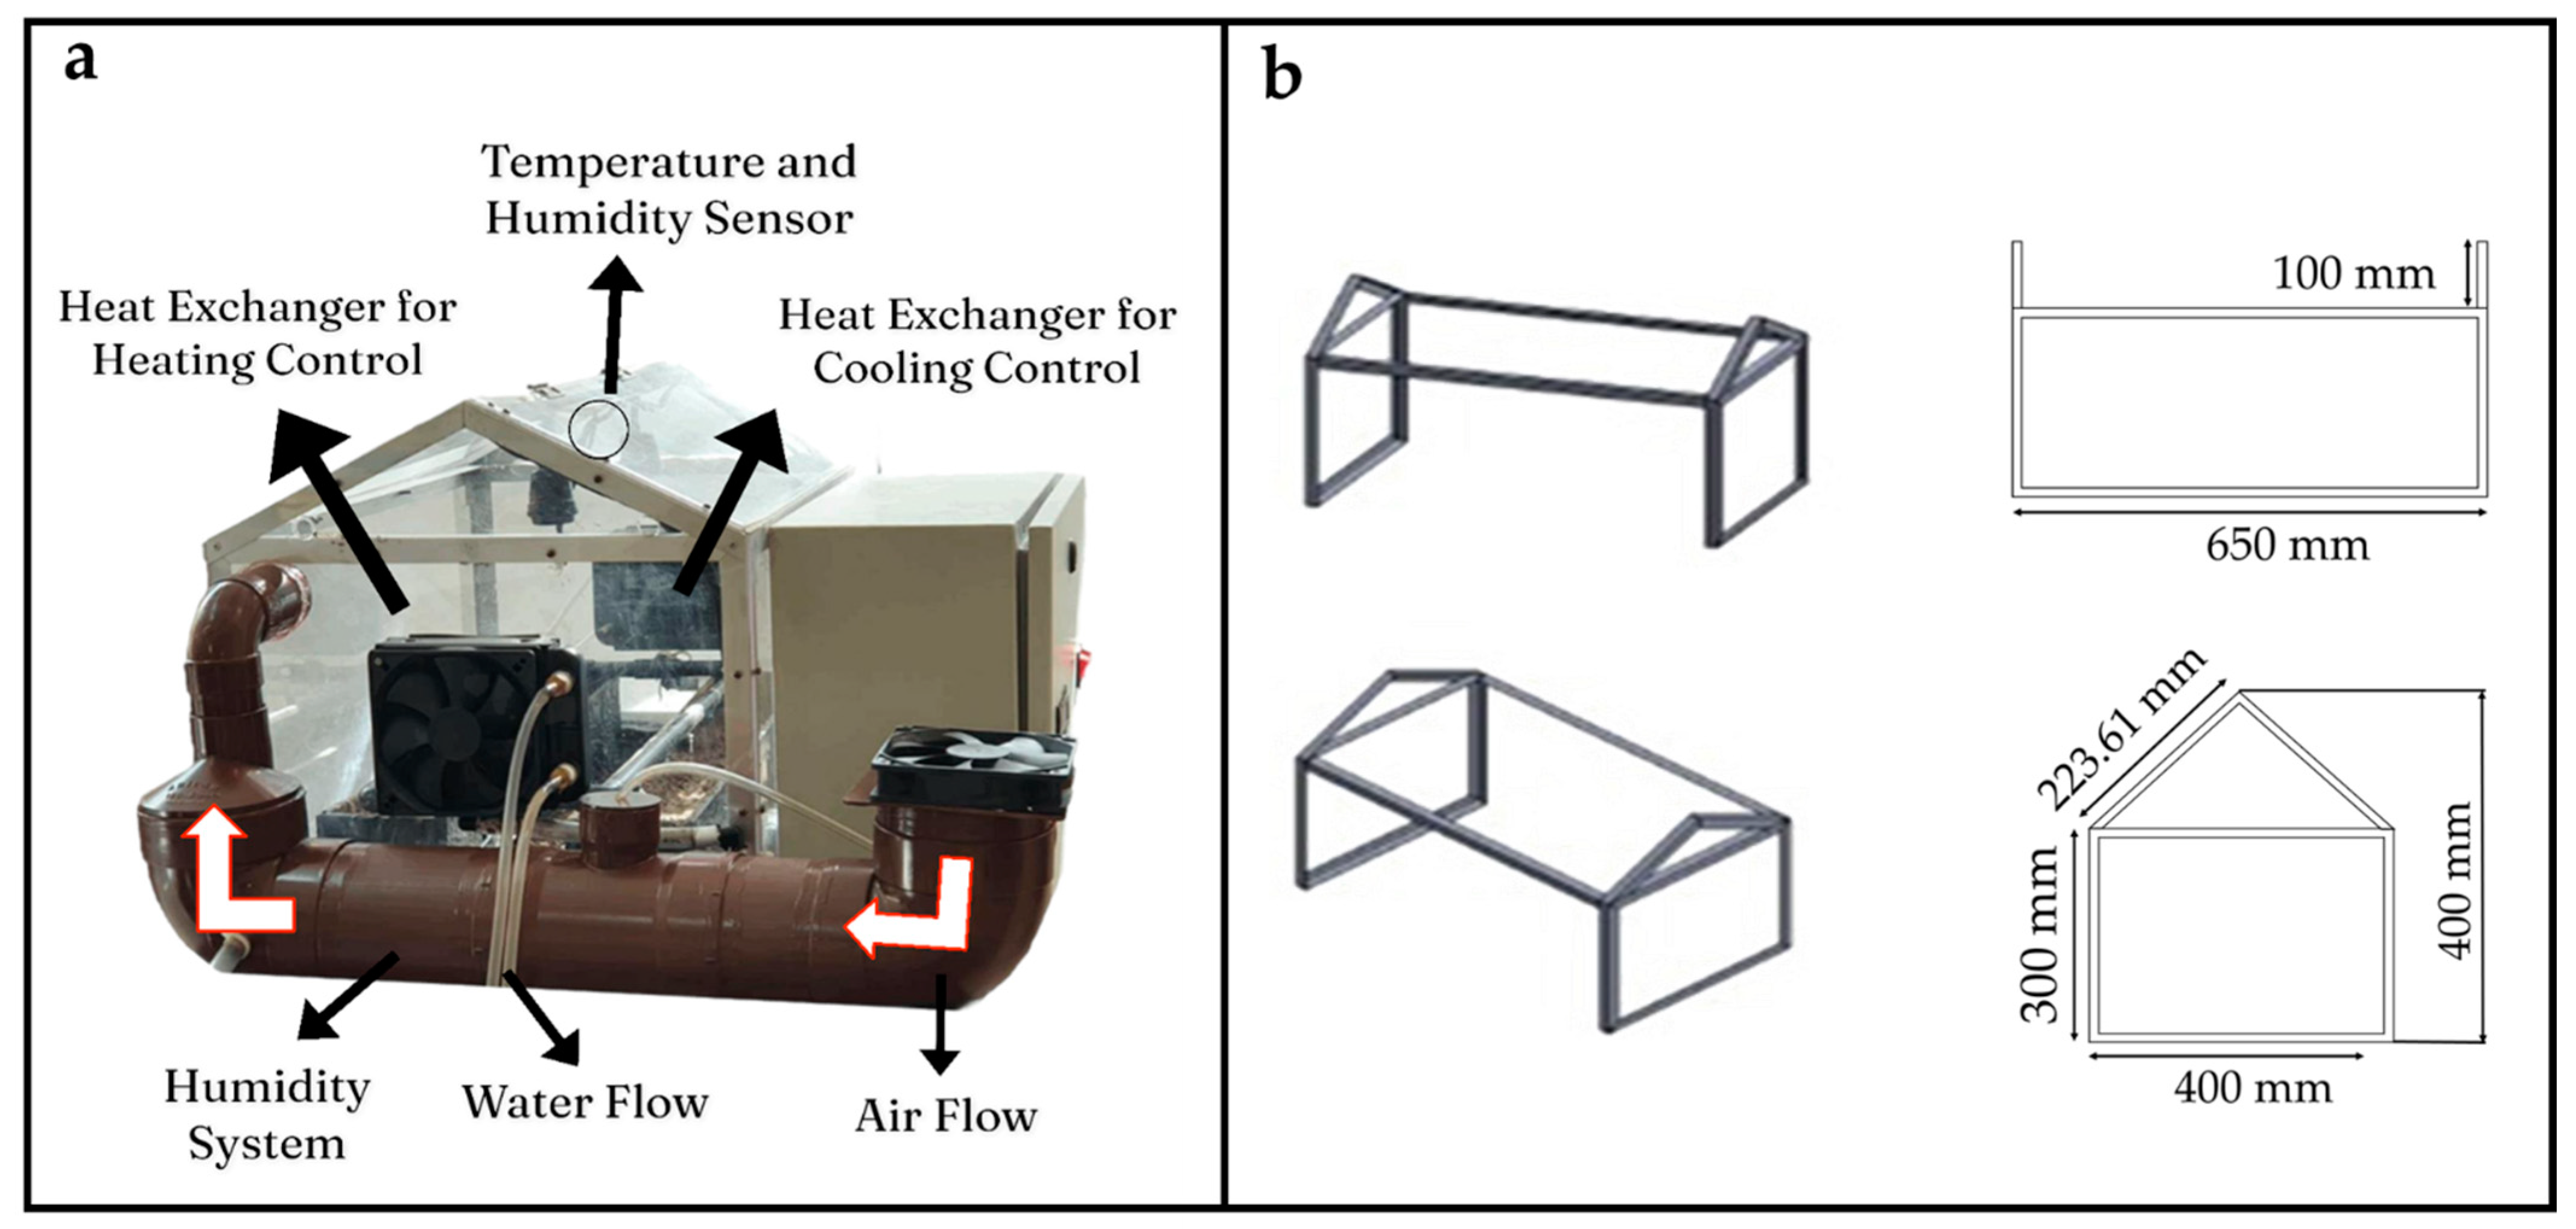
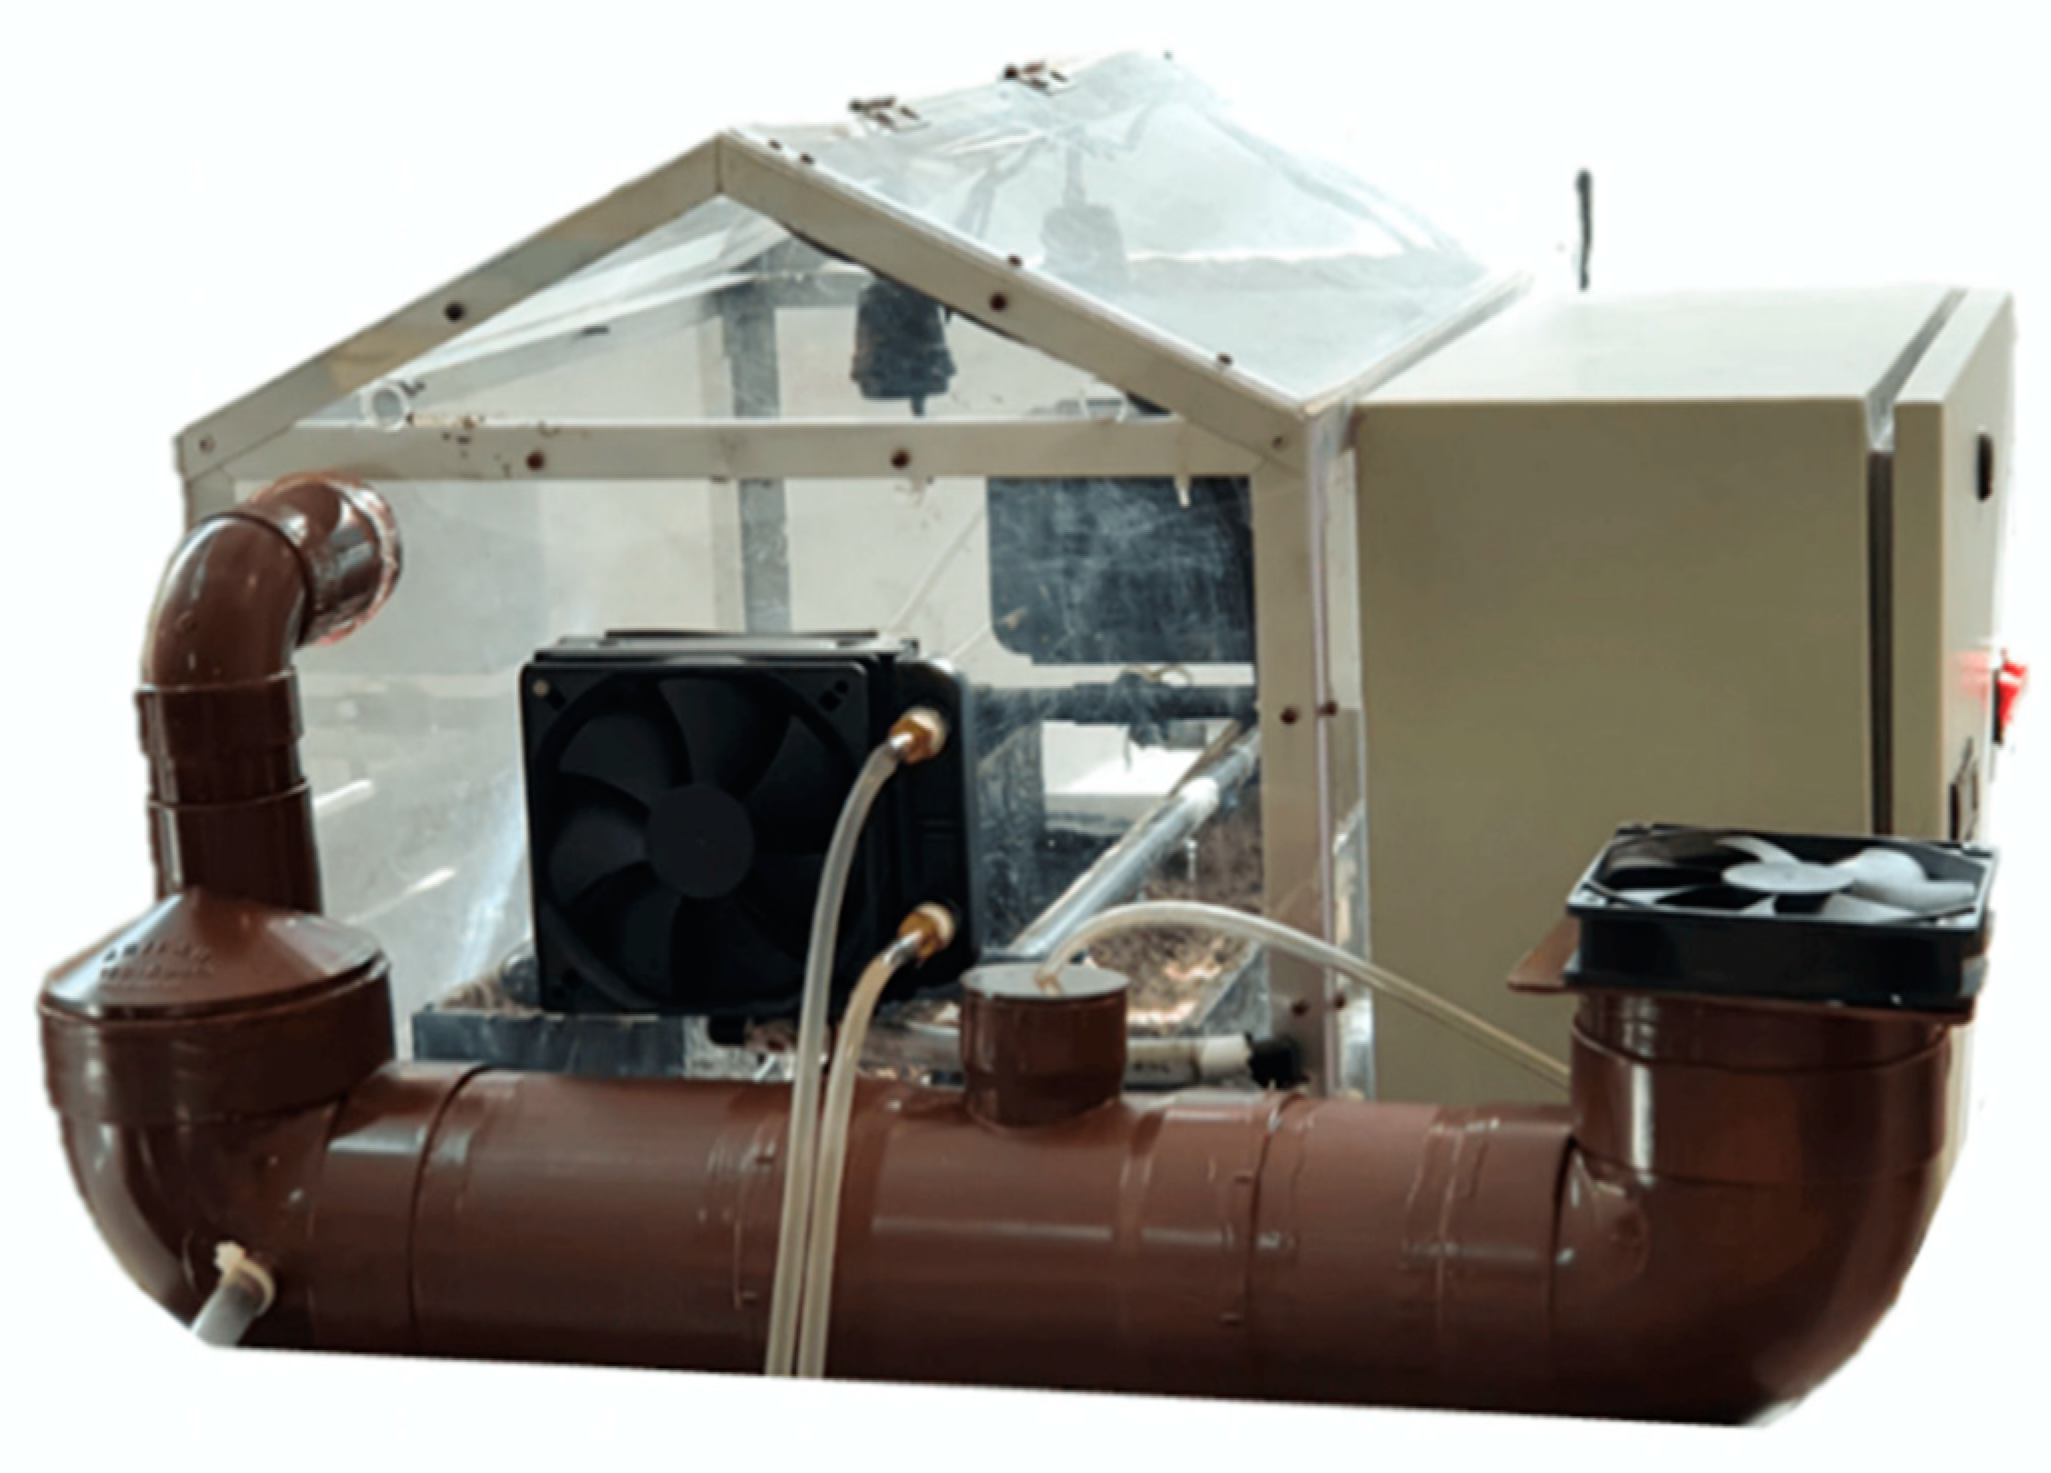
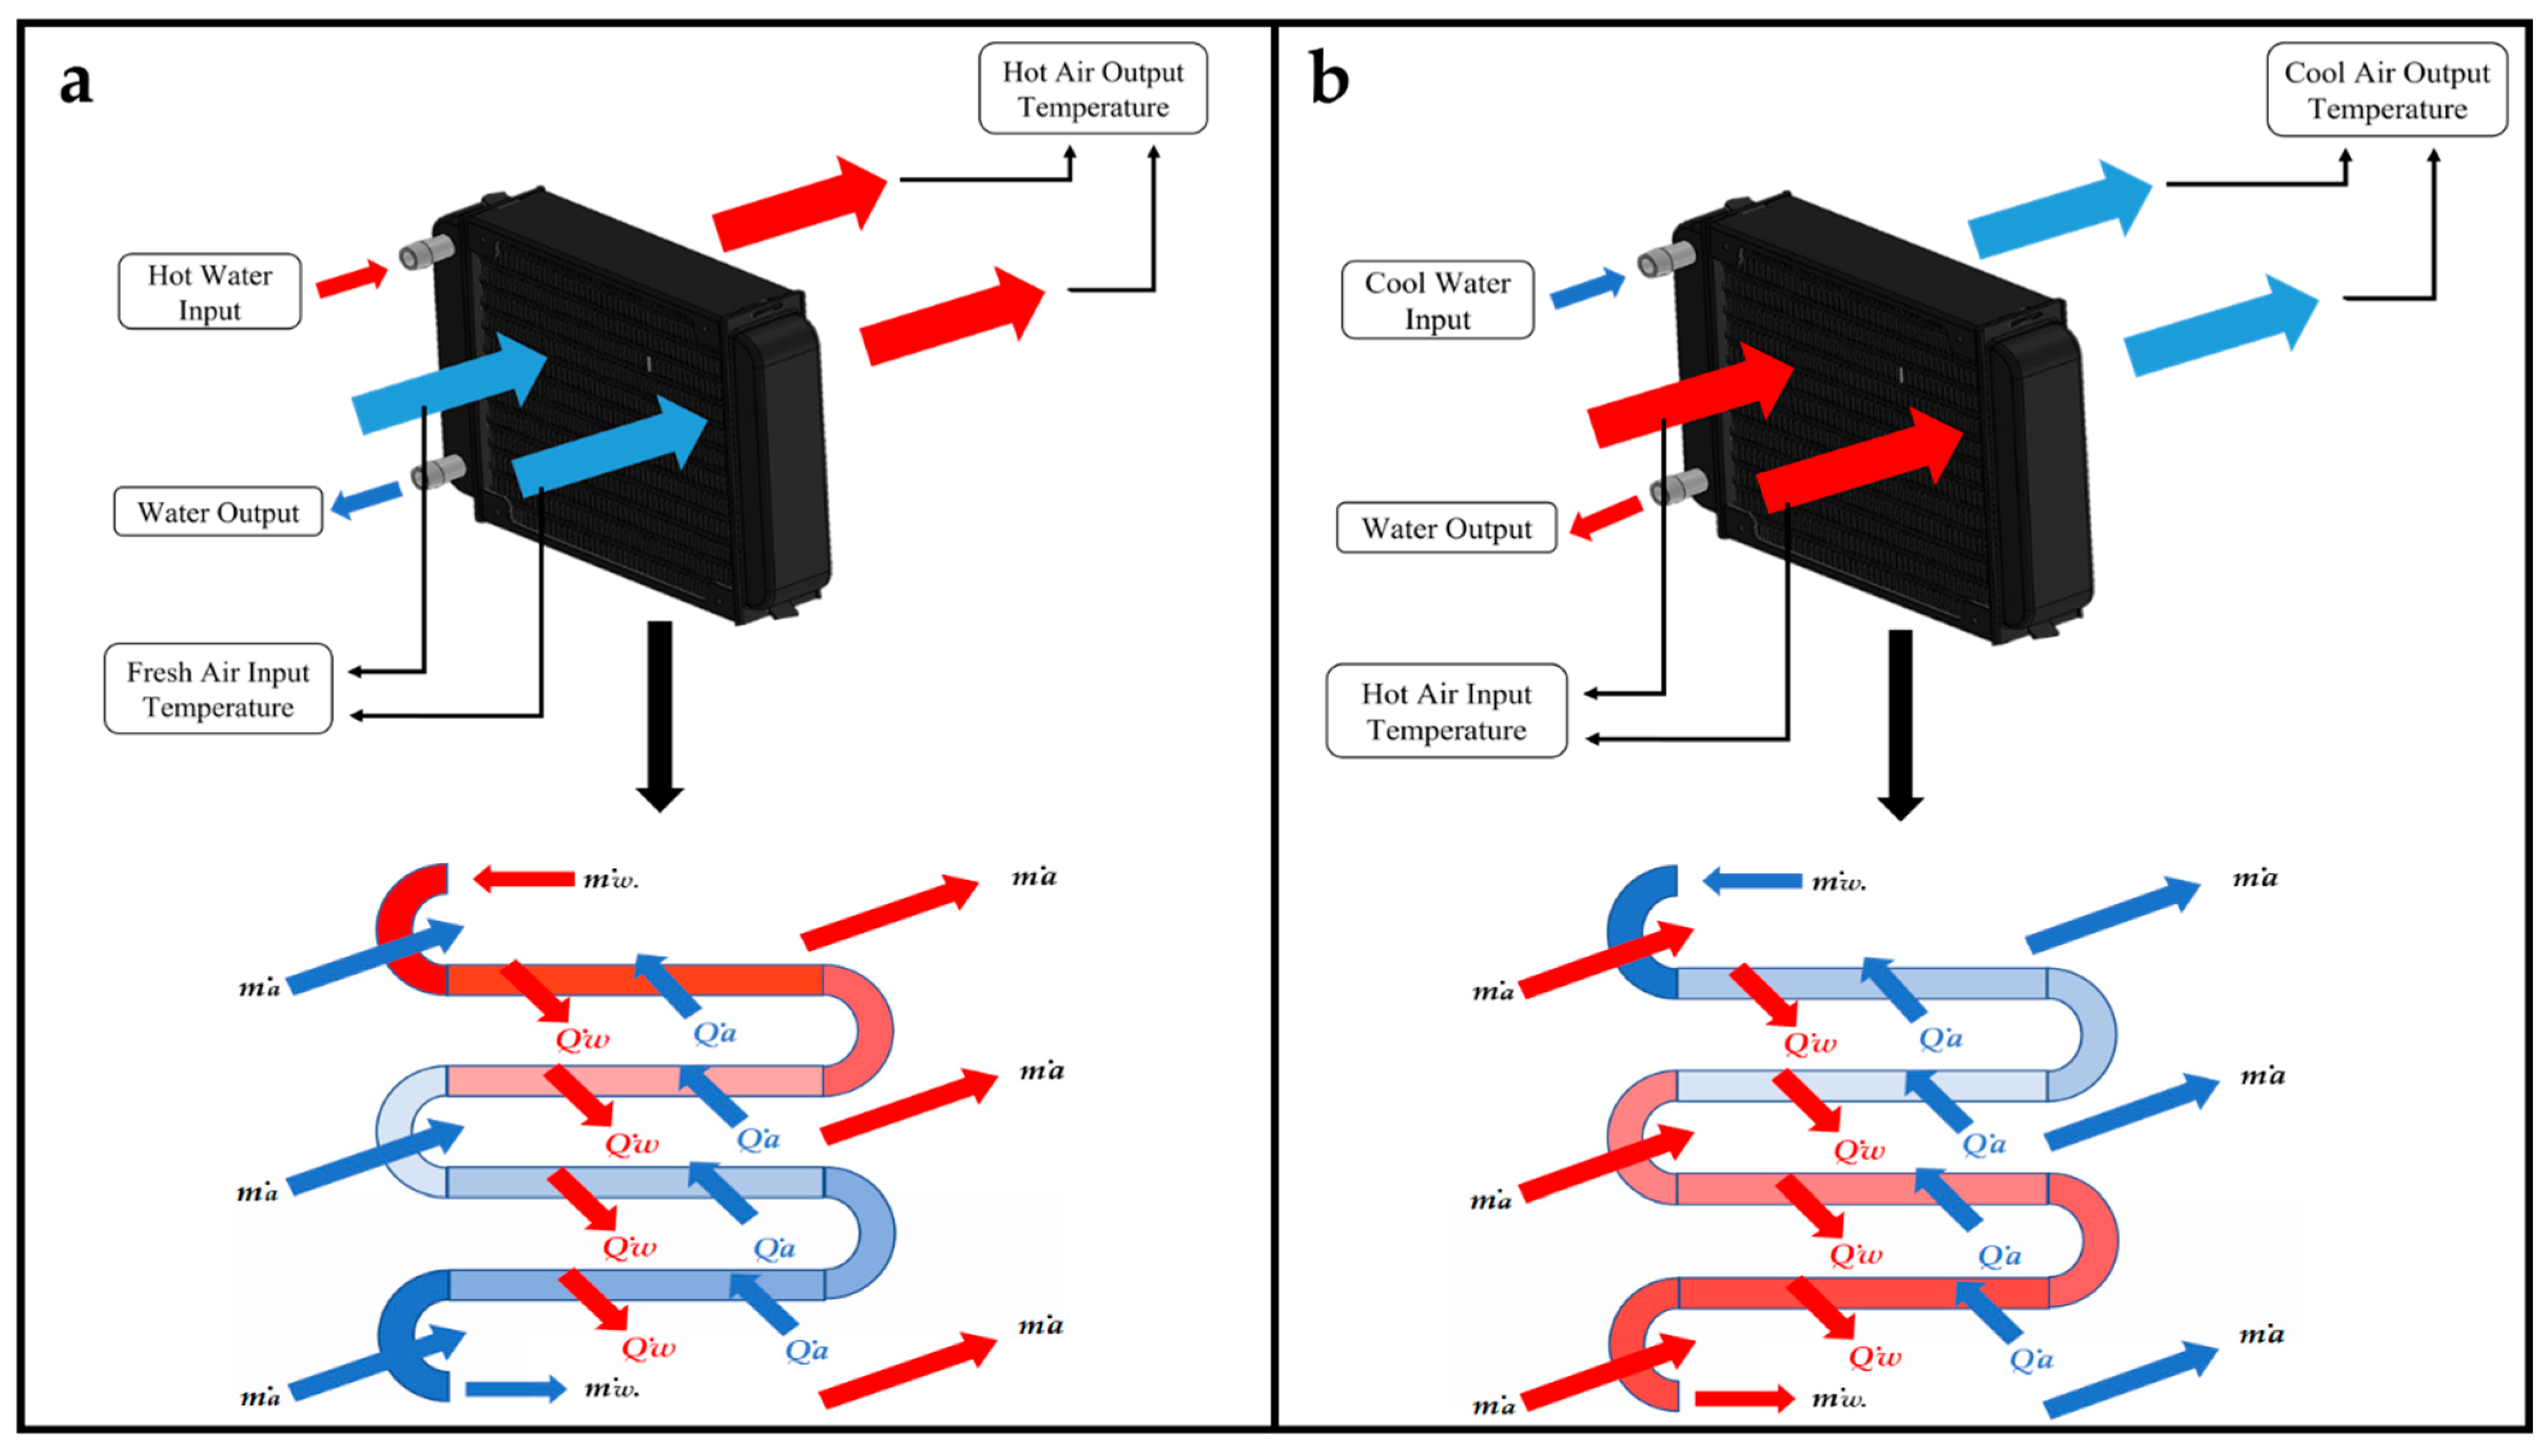
Black sesame seeds (Sesamum indicum L.) were placed in the micro-greenhouse and with the traditional technique in pots 10 cm deep. The soil was prepared with a N, K, P ratio of 12-5-7 according to the manufacturer’s information, which was obtained from an establishment of the region. The micro-greenhouse and the traditional technique were exposed to 12 h of light and 12 h of darkness at the same time of the year: autumn–winter. The experiments were performed simultaneously.

2.1.2. Prototype

To maintain the proper conditions in the sesame seeds germination process, VPD and soil moisture must be controlled. According to the research presented by [33], the adequate VPD values for any crop range from 0.5–1.4 kPa. The VPD is dependent on temperature and relative humidity. In an investigation presented by [34,35], it was mentioned that the variables for sesame seeds should be maintained between 25 and 37 °C for temperature, close to 100% for relative humidity and at a value between 80 and 95% for soil moisture. Based on these requirements, a micro-greenhouse was designed and built (Figure 1). The dimensions of the micro-greenhouse presented in millimeters and the location of the systems for temperature and humidity can be observed in Figure 2. The systems used for temperature control in this research require the energy transfer between two fluids (Figure 3). Two heat exchangers were installed, one for heating and one for cooling. Water temperature for heating was maintained at 45–50 °C by applying an on–off control. Water temperature for cooling was obtained directly from the local supply network, ranging between 21 and 25 °C. To control relative humidity, a water vapor saturation system was installed. This system works with air flow using a fan in a tubular tank with water and a submersible water pump.

2.2. Methods

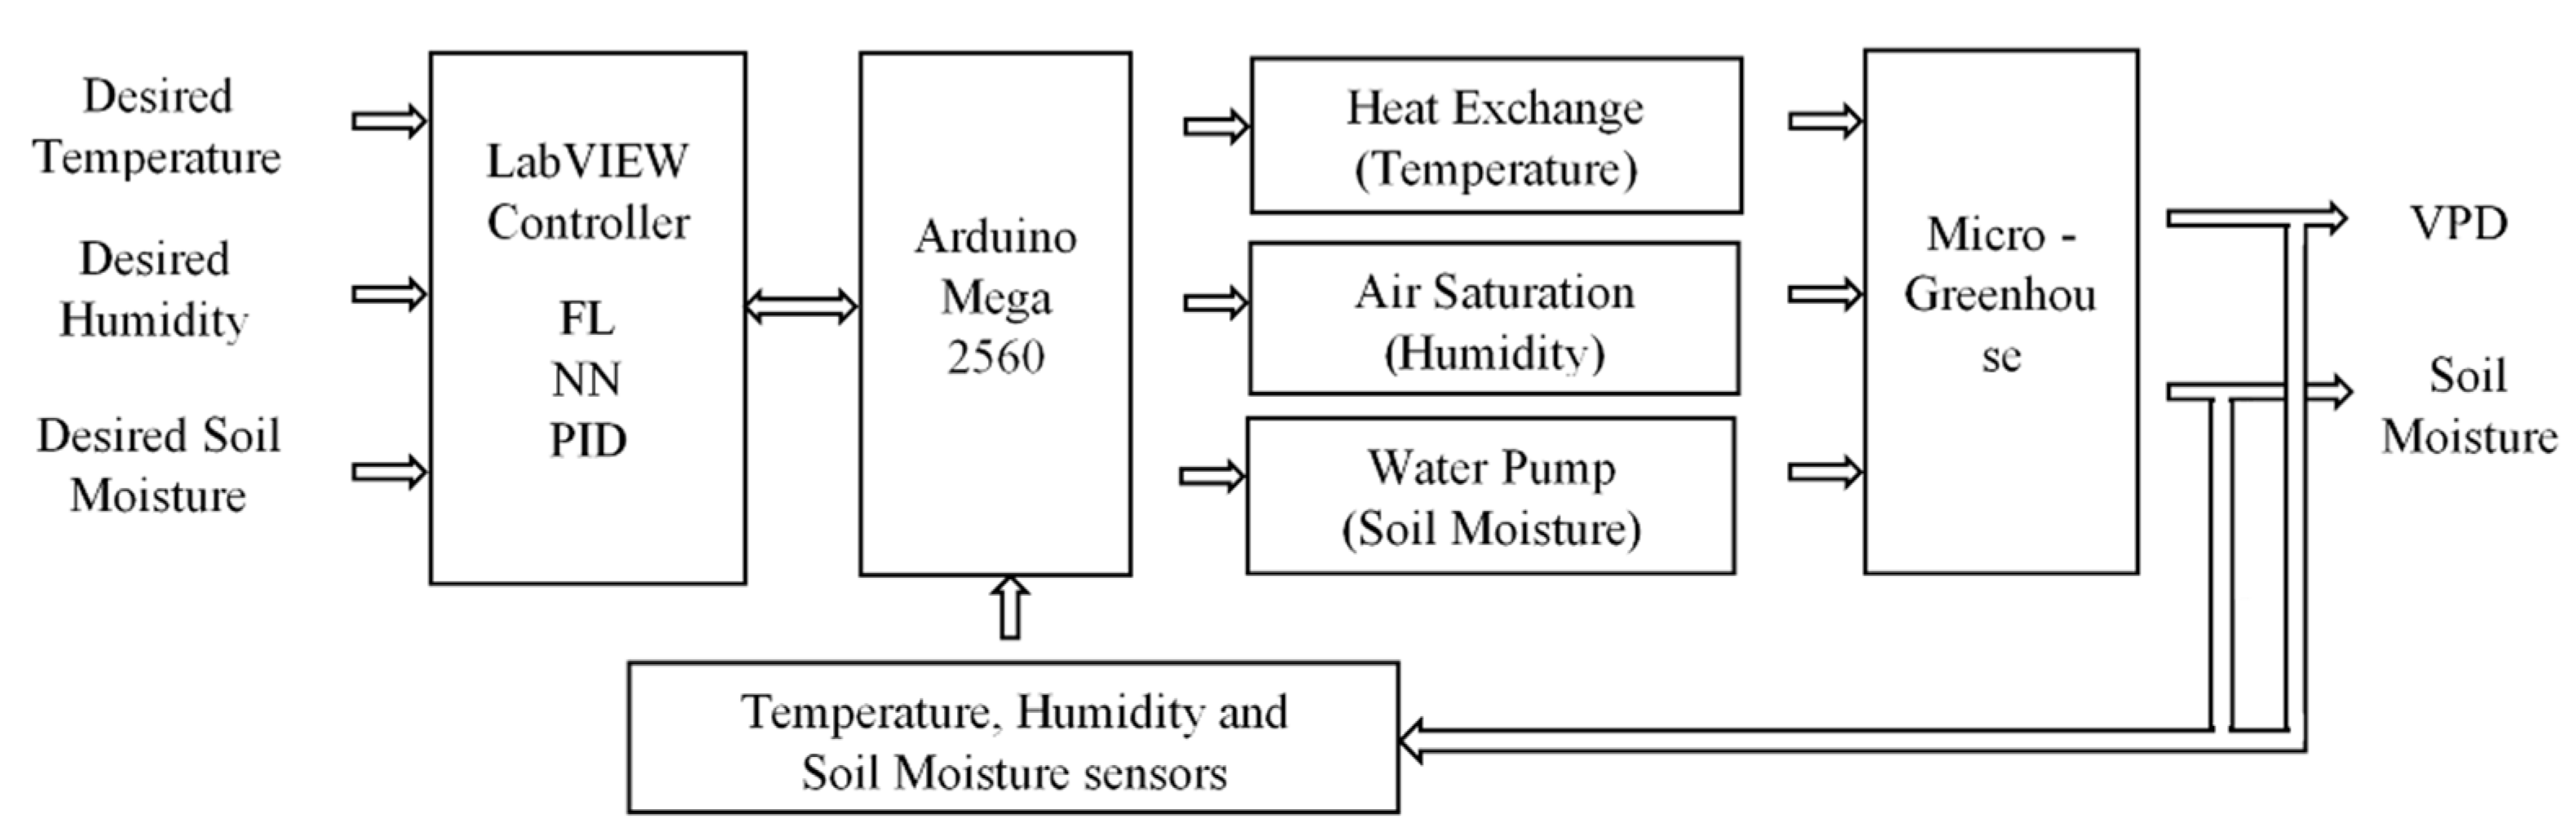
2.2.1. VPD Control Development

Mathematically, VPD is defined as the difference between the saturation vapor pressure ( V P D s a t ) related to temperature and the air vapor pressure ( V P D a i r ) associated with the relative humidity. Equations (1)–(3) presented by [36] and used in an investigation by [33] were used to calculate the VPD.
V P D = [ V P s a t V P a i r ]
V P s a t = 0.61078 ( e [ ( 17.27 ) ( T ) 237.3 + T ] )
V P a i r = ( R H 100 ) ( V P s a t )
where T = temperature and R H   = relative humidity. Considering that V P s a t and V P a i r depend on the values of temperature and relative humidity, a mathematical model was proposed that defines the dynamics of these variables.

Temperature

For this research, an unmixed crossflow heat exchanger was used for temperature control, as it is a heat exchanger in which two different fluids can interact, in this case, water and air. Heat exchangers regularly operate for long periods of time, without significant changes in their operating conditions. For that reason, the analysis can be considered as a steady flow system. The heat exchanger’s actual heat transfer rate can be defined based on an energy balance in the hot and cold liquids [37]. For the mathematical analysis of the crossflow heat exchanger for heating the temperature system, in one exchanger, one fluid gives up energy and the other acquires energy; therefore, the heat transfer that exists in the water is equal to the heat transfer in the air, as shown in Equations (4)–(6).
Q · w = Q · a
Q w · = m w · c p w ( T w , i n T w , o u t )
Q a · = m a · c p a ( T a , o u t T a , i n )
where Q w · = current heat transfer from water, Q a · = current heat transfer from air, m w · = water mass flow, m a · = air mass flow, c p w = specific water heat, c p a = specific air heat, T w , i n = water input temperature, T a , i n = air input temperature, T w , o u t = water output temperature and T a , o u t = air output temperature. The T a , o u t is the internal micro-greenhouse temperature; therefore, Equation (7) is obtained for heating.
m w · c p w ( T w , i n T w , o u t ) + m a · c p a T a , i n m a · c p a = T a , o u t
The variable T a , o u t represents the output temperature of the air when it passes through the heat exchanger. The mathematical analysis for the cooling cross flow heat exchanger in the temperature system is similar to the heating system, except that the signs are reversed because in heating, the T a , o u t gains energy, and in cooling it loses energy. That is, when the system increases its temperature, it absorbs heat, therefore it is said that the system gains energy. The principle remains that the water heat transfer is equal to that of air, as shown in Equation (8).
m w · c p w ( T w , o u t T w , i n ) m a · c p a T a , i n m a · c p a = T a , o u t
Equations (7) and (8) describe heating and cooling dynamics in the heat exchanger for the temperature system in the micro-greenhouse.

Relative Humidity

For the humidification system, based on the work presented by Cengel and Boles [37], the adiabatic saturation process is taken as the basis, in which there is an unsaturated airflow that has a specific initial humidity and an input temperature, gaining humidity when it comes into contact with a water tank, in which the water vapor mixes with the airflow. The humidity content increases during this process. Water temperature is kept at the same temperature as the input air; therefore, there is a similar temperature between the inlet and the outlet. By supplying make-up water to the tank at the evaporation rate and the temperature T 2 , the process can be analyzed as a steady flow process. For the equation analysis, it is considered in Equation (9) that the air mass flow is the same at the input and output and, therefore, in Equation (10), the air mass flow and evaporation mass flow are related.
m · a 2 = m · a 1
m ˙ f = m ˙ a ( h 2 h 1 ) h f g 2
where m · a 1   = input air mass flow, m · a 2 = output air mass flow, m ˙ f = evaporation mass flow, h 1 = enthalpy input, h 2 = enthalpy output and h f g 2 = evaporation enthalpy. Equation (11) describes the evaporation rate for the airflow that circulates through the humidity system.
m ˙ f = m a [ ( ( c p a T 2 + 0.622 φ 2 p g 2 p φ 2 p g 2 ) ( h v a p o u r + c p v a p o u r T 2 ) ) ( ( c p a T 1 + 0.622 φ 1 p g 1 p φ 1 p g 1 ) ( h v a p o u r + c p v a p o u r T 1 ) ) ] h f g 2
where T 1 = input temperature, T 2 = output temperature, h v a p o u r = vapor enthalpy water, c p v a p o u r = average vapor water specific heat, P = atmospheric pressure, p g 1 = saturation pressure at input temperature, p g 2 = saturation pressure at output temperature, φ 1 = input relative humidity and φ 2 = output relative humidity. When obtaining the evaporation rate, an analysis is executed to determine the output humidity. Thus, a consideration is made where the evaporation mass flow is equal to the air mass flow that multiplies the difference between the output and input humidity. Subsequently, φ 2 is calculated [37]. Equation (11) describes the m ˙ f humidity system’s behavior, which allows for obtaining the inside micro-greenhouse relative humidity.

Control

Design, simulation and implementation of FL and NN control for VPD and PID for soil moisture in the micro-greenhouse were executed. The heat, humidity and soil moisture systems were evaluated with three different types of control (PID, FL and NN), obtaining, as a result: FL for heat control, NN for humidity and PID for soil moisture. The use of intelligent control has facilitated the prediction of parameters in systems with complex dynamics. For example, fuzzy logic (FL) systems try to determine logically what must be done to achieve the control objectives from a knowledge base provided by a human operator [38]. The steps for the design of a system based on fuzzy logic are the following: define the state and control variables; the linguistic labels and the degree of membership of the fuzzy sets are defined; set the if–then rules and defuzzification stage [39]. The temperature control variable in the micro-greenhouse was T a , o u t . The control was designed by varying the m w · in Equations (7) and (8). In Table 1, the fuzzy sets of state variables ( E r r o r t e m p i n t ), ( E r r o r t e m p e x t ) and the control variable ( V a r   T e m p   I n t ) can be observed. Vertex 1, 2 and 3 correspond to triangular fuzzy sets. Vertex 1, 2, 3 and 4 correspond to trapezoidal fuzzy sets, where 1 is the extreme left vertex. Table 1 shows the values that the fuzzy sets take at that vertex. The state variables can be calculated with Equations (12) and (13). Mamdani’s method was designed to use if–then rules using complex knowledge expressed in natural language [40]. Recent research has used this method, as reported in [41,42]. A Mamdani inference method was implemented in this work, the rules are shown in Table 2 and Table 3.
E r r o r T e m p I n t = T d T c u
E r r o r T e m p E x t = T d T e x
where T d = desired temperature, T c u  = current temperature and T e x = external temperature.
Neural networks (NNs) are supported by computational models that use a set of units called artificial neurons, which when interacting with each other through links responsible for interconnecting them, can increase or inhibit the activation state of adjacent units [43]. The main characteristic of an NN is that each unit that composes it can learn and train itself, therefore, it can be applied in areas where the detection of parameters is difficult to achieve [44]. An NN was designed for the humidity system. This control has a hidden layer with two neurons. The training algorithm used was backpropagation [45]. During training, a mean square error of 3.58 × 10⁻⁴ was obtained. The training values were taken in a range from 1 to −1 for the present error in intervals of 0.2. For the desired output, values in the range from 0 to 0.033 were taken, which correspond to the minimum and maximum value that m ˙ a can take. After carrying out the VPD control design by modifying the values of temperature and humidity in the micro-greenhouse, a transfer function was obtained that describes the soil moisture dynamics through an identification process. The Matlab tool “System identification toolbox” was used, which works with the data input obtained experimentally [46]. For this, a voltage of 12 V was applied to the water pump. When the system activates the irrigation, the soil moistens quickly and the dynamics have a fast behavior. A reference of 100% moisture in the soil was established and an average of 7 runs was calculated [47]. The transfer function that describes the behavior of soil moisture in the micro-greenhouse is shown in Equation (14).
G m o i s t ( s ) = 1.1122 7.2837 s + 1
At present, PID control has been used to control irrigation systems in greenhouses [48]. The PID control is made up of three actions: proportional, integral and derivative [49]. A PID control with one input and one output (SISO) was designed for soil moisture control in this work. The first Ziegler–Nichols method was used to determine the PID controller gain value [50]. The values to calculate K p , T i and T d were obtained from the rules proposed by Ziegler–Nichols, where it was determined that L = 6 and T = 12.5 . The PID controller parameter values for soil moisture are K p = 2.5 , K i = 0.2 and K d = 7.5 .
The control algorithms implemented by FL and the NN for VPD and PID for soil moisture were performed in the LabVIEW programming environment. The control system implementation diagram can be seen in Figure 4. An FL and NN control was implemented for temperature and humidity. The FL algorithm controls the pump flow water in the heat exchanger to decrease or increase the micro-greenhouse internal temperature when it exceeds the indicated reference value. The NN controls m ˙ a through a fan, saturating the air with water vapor to humidify the micro-greenhouse. For irrigation, a PID control with an input and an output was implemented. The PID control regulates the submersible pump speed, which functions to transport water through the irrigation pipes installed inside the micro-greenhouse.

2.2.2. Treatment and Germination of Sesame Seeds

The experiment was developed using two types (micro-greenhouse and traditional technique) of germination. Each type of germination had five replicates with 20 seeds, and these were soaked for 12 h before cultivation [51]. After the soaking period was over, the seeds were placed 2 cm deep in arable land [52]. A reference of 30 °C for temperature, 75% for humidity and 85% for soil moisture, considered optimal conditions for the sesame seed germination process, was established in the micro-greenhouse. The experiment was carried out for 8 days from the moment of sowing. The traditional technique consisted of sesame seeds sown in plastic pots. For this case, the laboratory conditions were emulated, in a range from 25 to 30 °C for temperature and 45 to 60% for humidity. Irrigation was applied twice a day to keep the soil moist.

2.2.3. Determination of Germination Parameters

The parameters of germination percentage (G%), germination index (GI), time at 50% (T50) germination and coefficient of the velocity of germination (CVG) at each level were determined in order to analyze the times based on the germination capacity of the seeds as shown in Equations (15)–(18) [53,54].
G % = n i N ( 100 )
G I = ( n i t i ) N
T 50 = t i + { ( N 2 ) n i } ( t j t i ) ( n j n i )
C V G = ( n i t i ) ( n i ) ( 100 )
where n i is the number of seeds germinated on day i , t i is the number of days after the sowing and N is the total number of seeds.

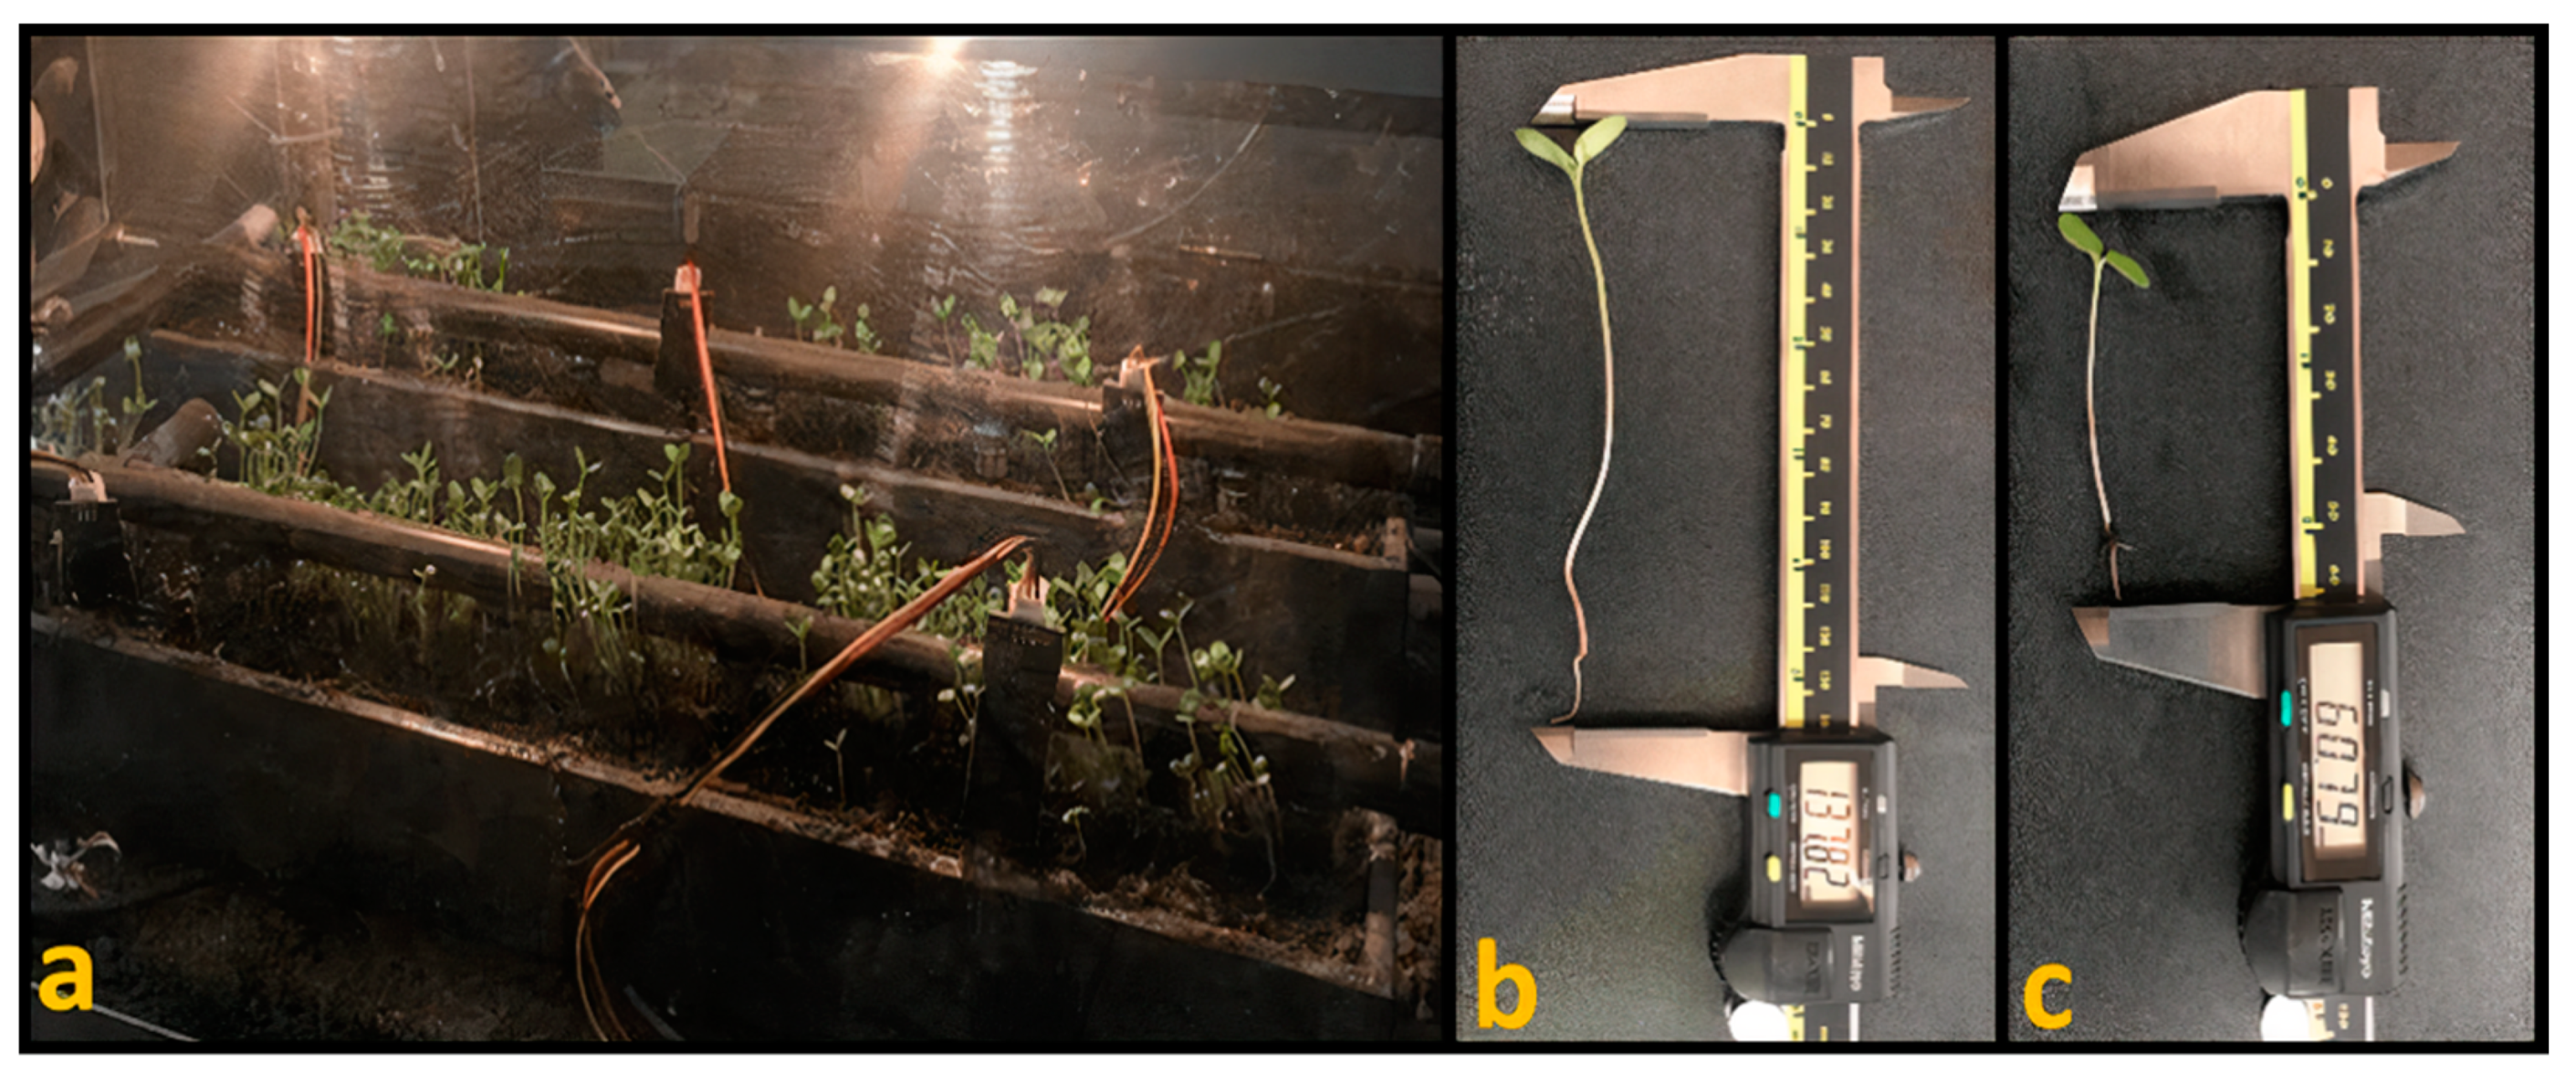
2.2.4. Measurement of Sprout Length

The length of the largest sprouts was taken in the micro-greenhouse and the traditional technique using a Vernier caliper. The sprout length was measured from the tip of the root to the tip of the sprout, aiming to make a comparison between both techniques.

2.2.5. Nutritional Value Determination

The sprouts’ nutritional value was measured with the official AOAC methods 925.09B, 923.03, 920.39C and 960.52 to determine the moisture, ash, lipid and protein content [55].

2.2.6. Statistical Analysis

The results were analyzed by an analysis of variance (ANOVA), and the comparison of means was performed by the Tukey multiple range test, with a significance level of 5%.

3. Results and Discussion
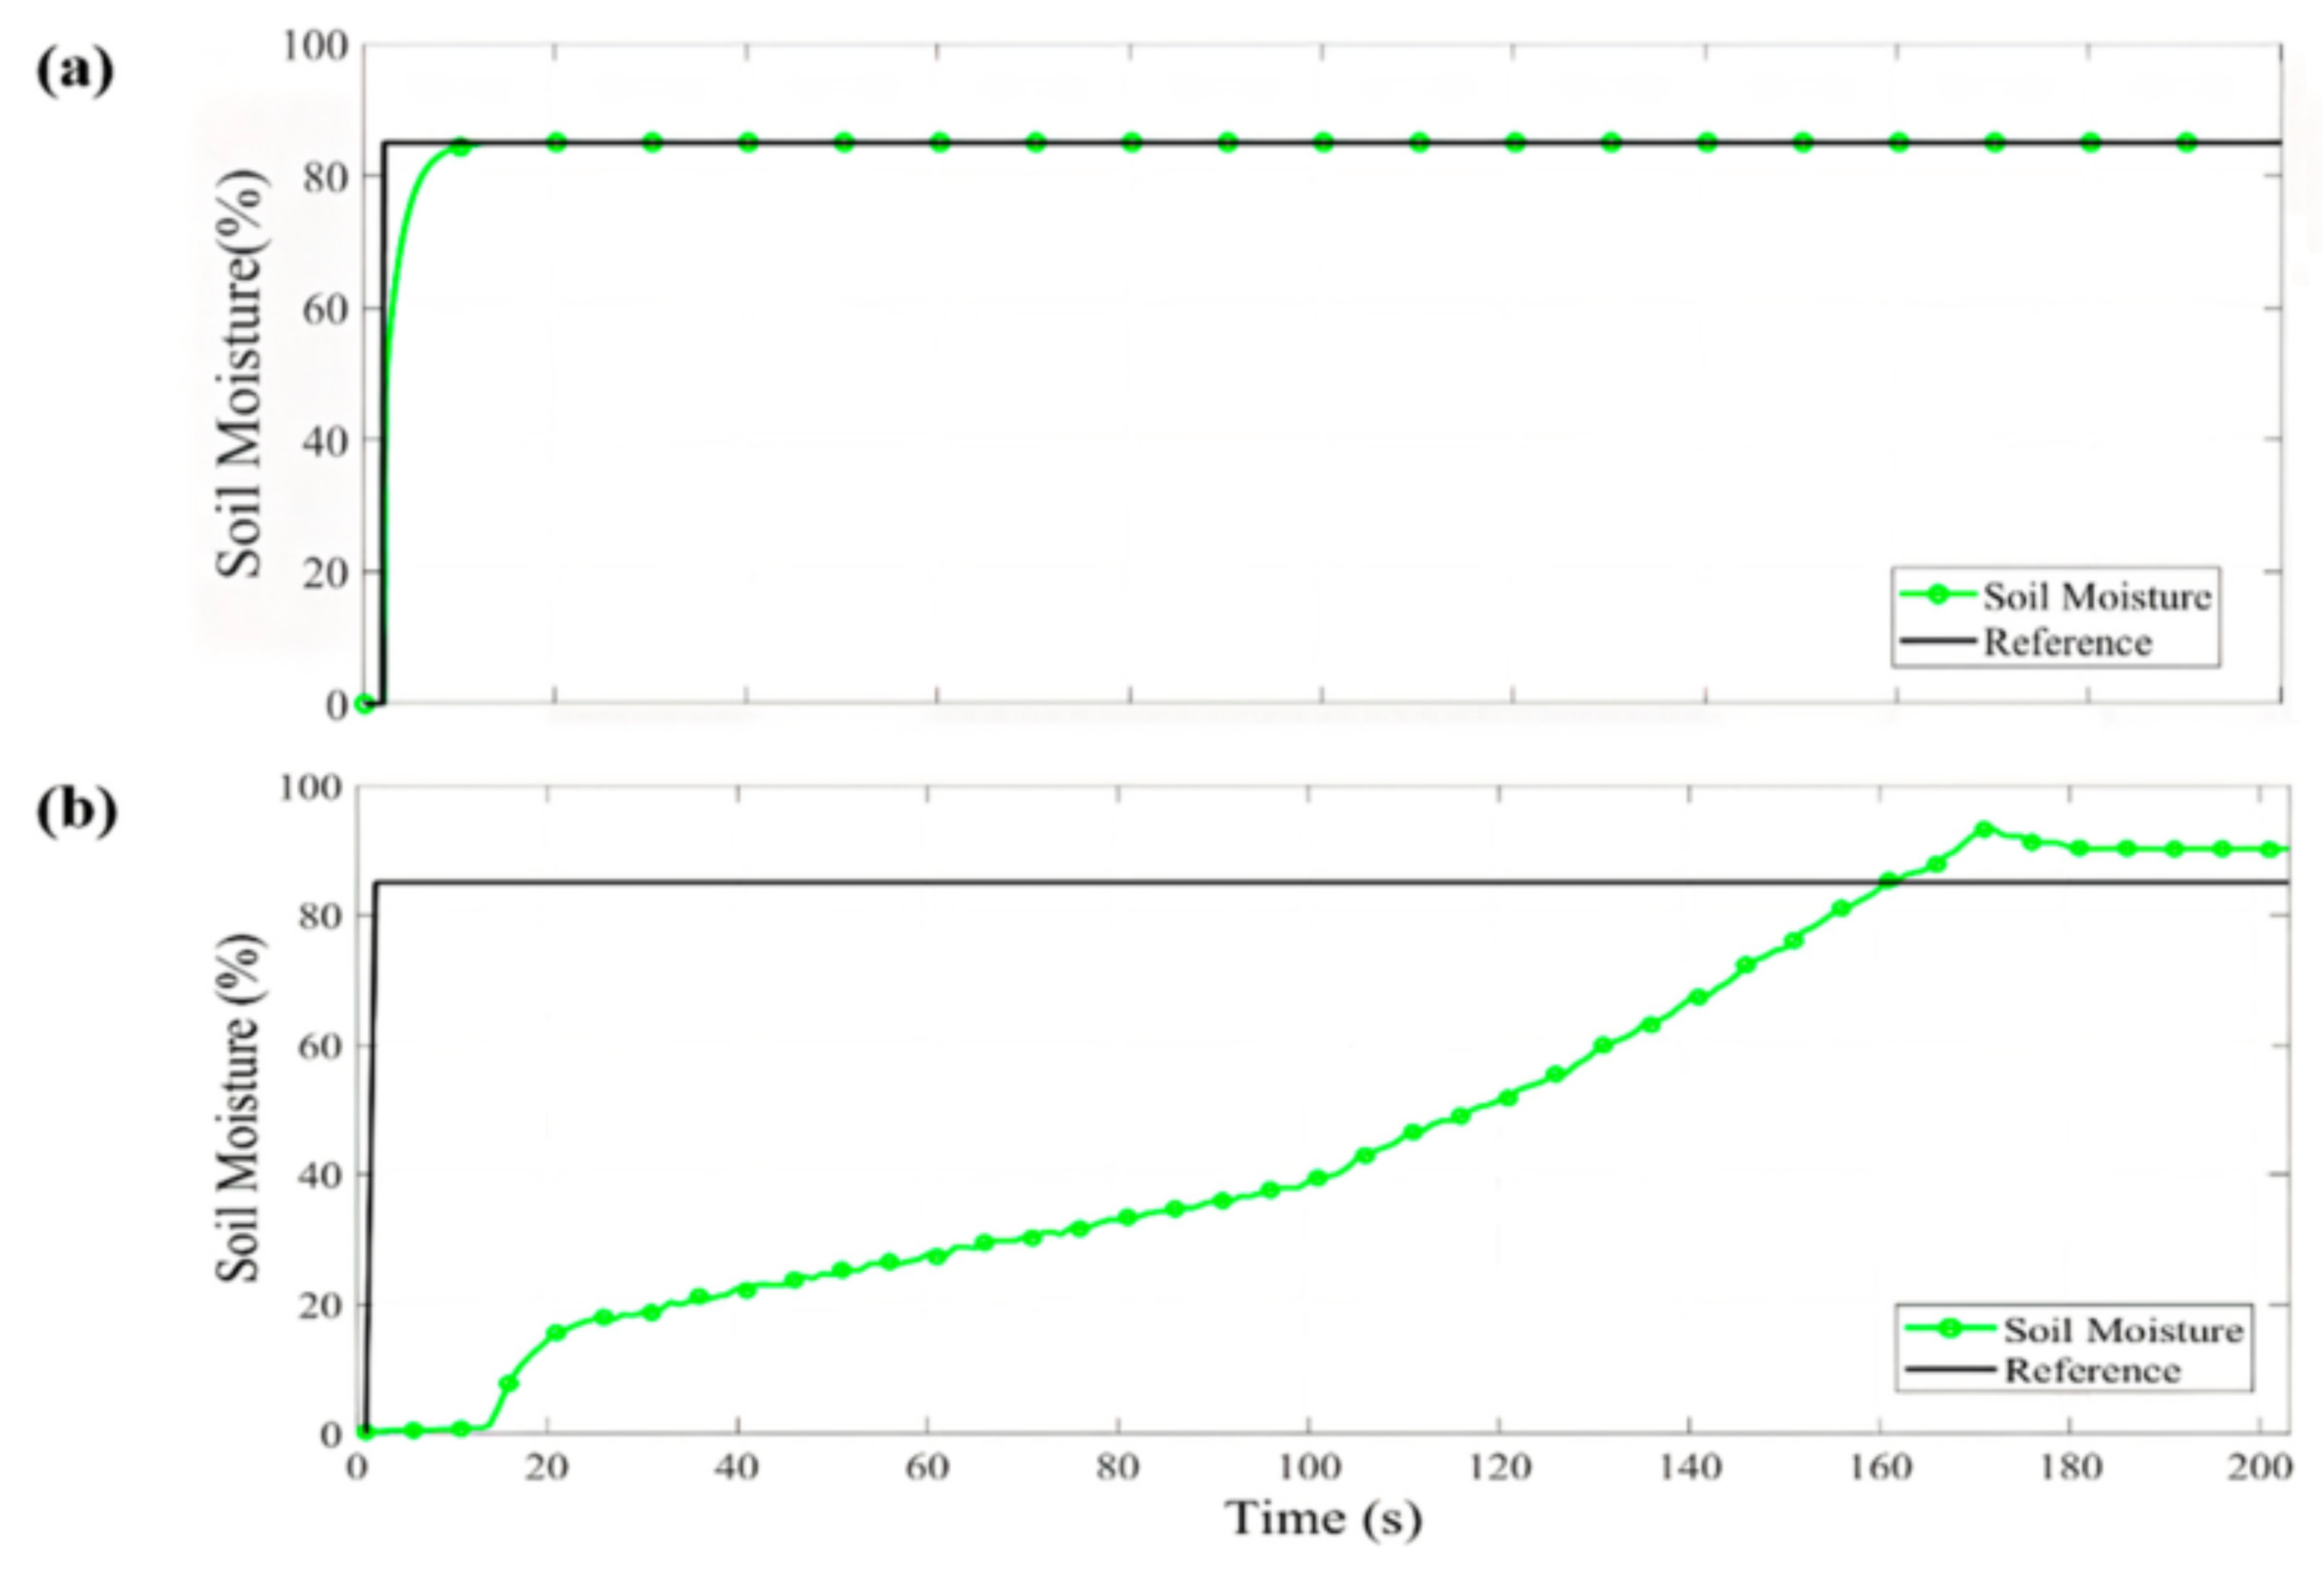
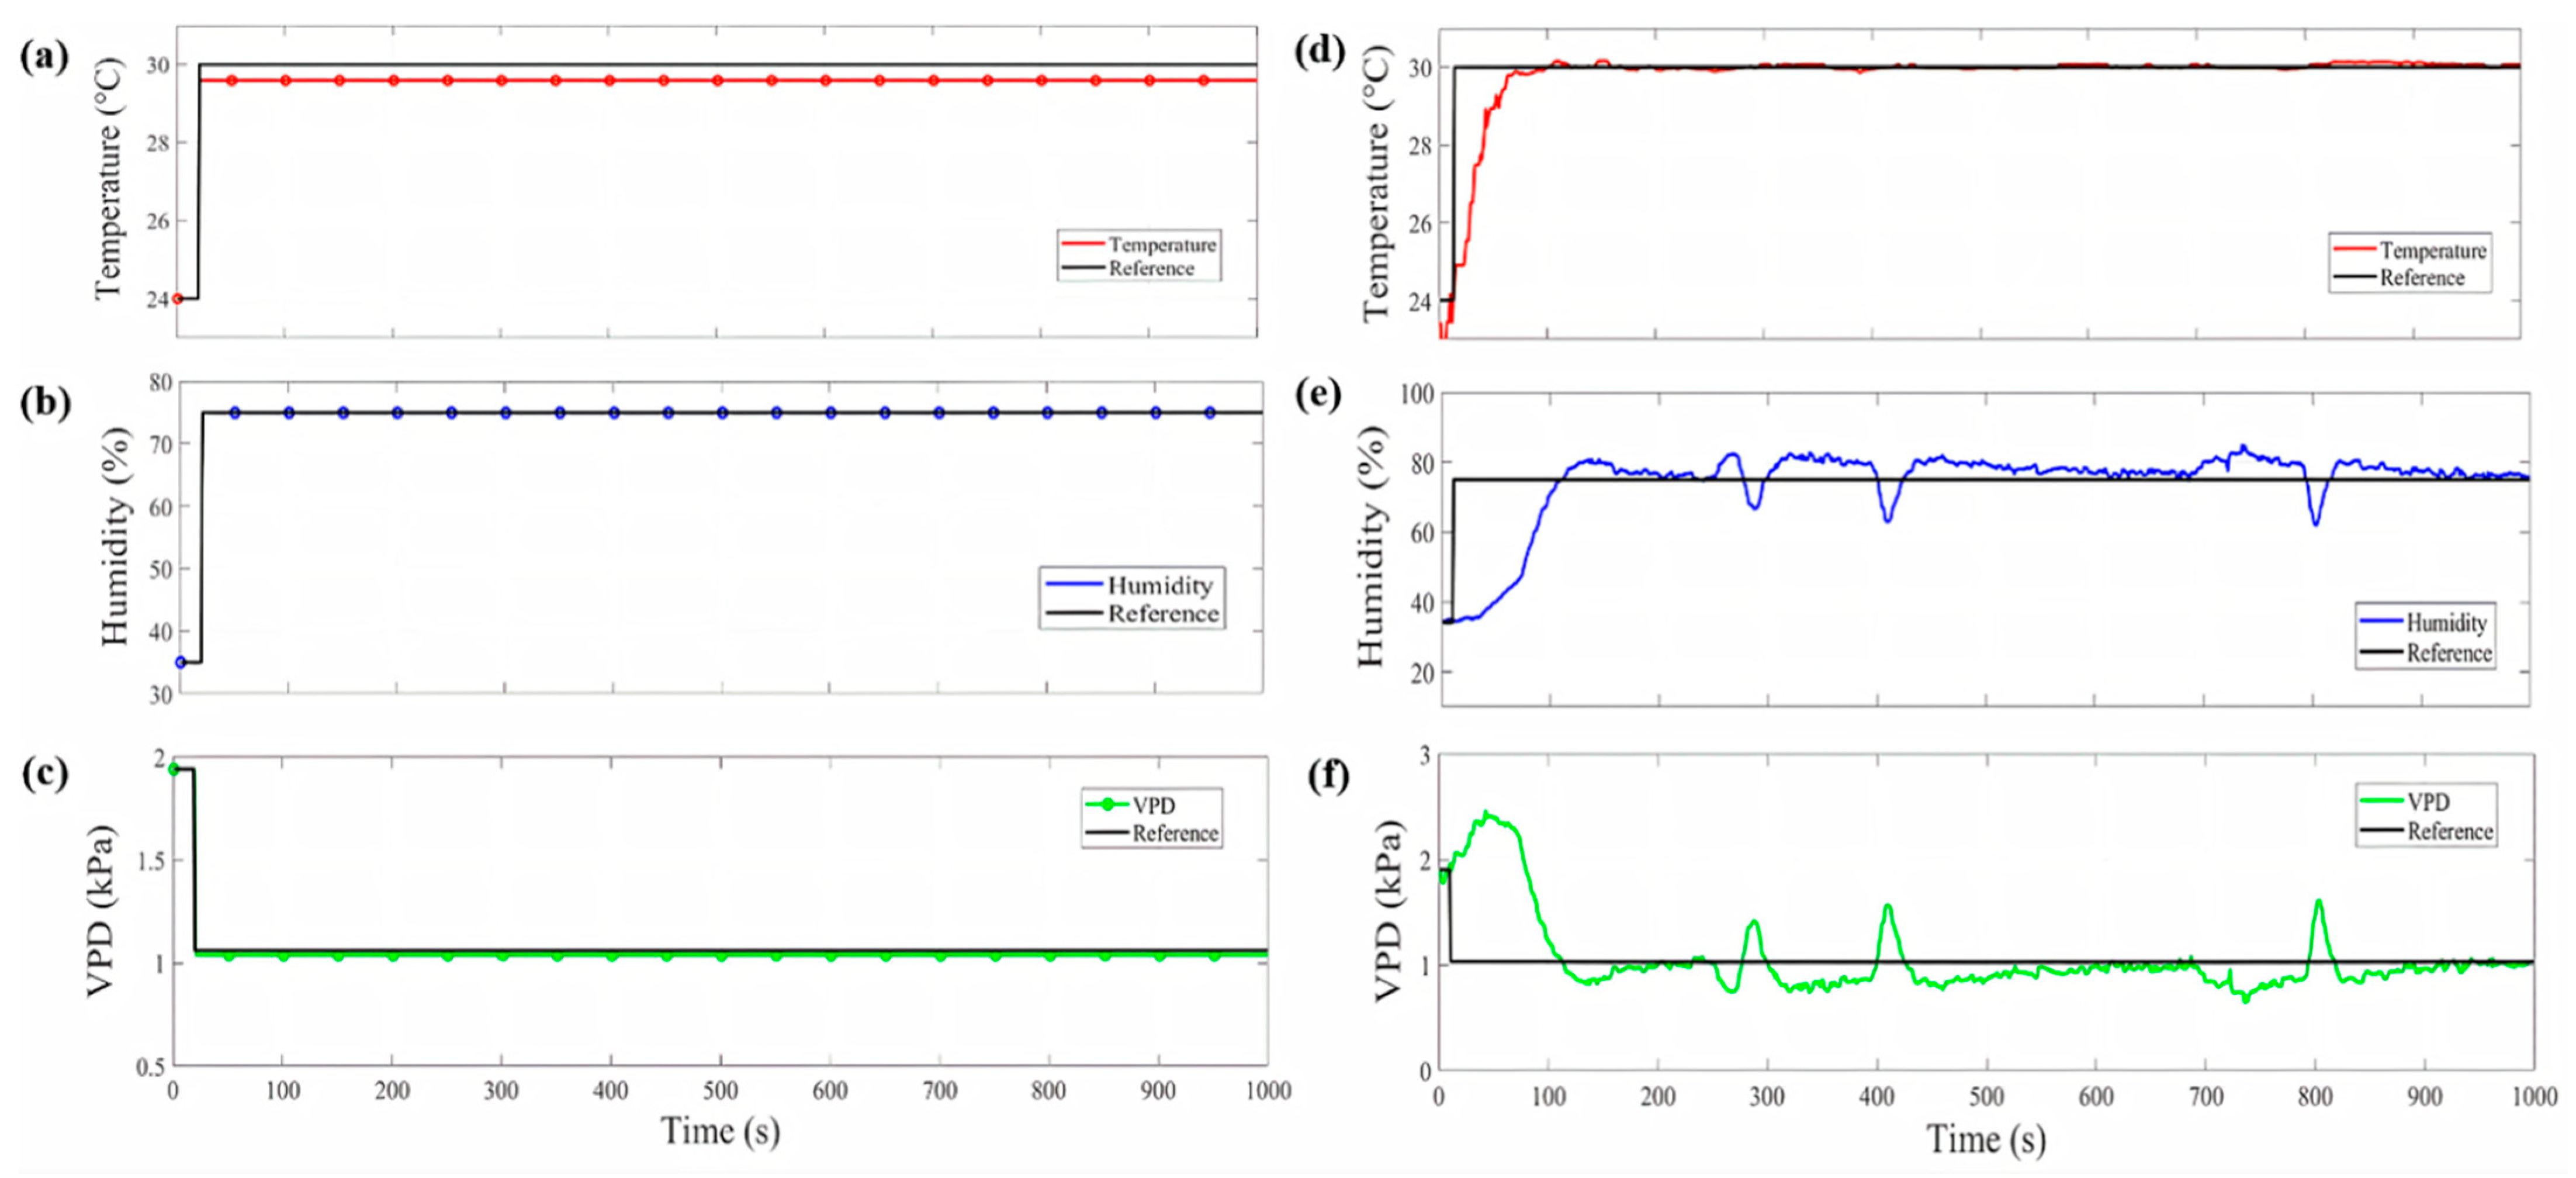
3.1. Control System

In Figure 5a, the temperature fuzzy control simulation in the micro-greenhouse is shown, where a 30 °C reference was established starting from a temperature of 24 °C. The desired value was reached in 20 s and it remains stable with a difference of 0.4 °C compared to the reference. In Figure 5b, the humidity NN control simulation can be observed. A 75% reference was established from 35%. A steady-state difference of 0.05% was obtained. With the temperature and humidity values, it is possible to obtain the VPD control values, as shown in Figure 5c. The VPD result in the simulation was 1.03 kPa. Figure 6a shows the PID control simulation result for soil moisture. An 85% reference was established, starting with 0% soil moisture. The desired value was reached in 40 s and presented a steady-state difference of 0.1%.
In the VPD and soil moisture control implementation, the standard error (SE) and mean absolute error (MAE) for each one was determined and compared with simulation, as shown in Table 4. The same references were established in the simulation as in the implementation for contrast. In Figure 6b, the PID control behavior for soil moisture is shown, where it is observed that an overshoot occurs when the reference is reached, but later it achieves the stable state. In Figure 5d,e, the temperature FL control and humidity NN control implementation are shown; temperature takes approximately 70 s to rise from 24 °C to 30 °C and the humidity reaches the reference in 105 s. The VPD behavior control can be observed in Figure 5f. The VPD has an MAE of 0.93 ± 0.09   kPa and an SE of 0.93 ± 0.004   kPa . In comparison with the VPD obtained in the traditional technique, a variation in temperature and humidity caused the VPD to fluctuate in the range of 1.6–1.7 kPa. In contrast, the temperature and humidity are close to the reference value in the micro-greenhouse. Humidity takes approximately 35 s longer than the temperature to reach the reference; this is because the temperature must first be stabilized to bring the humidity to the desired value. However, when it falls below the desired value, it can be observed in Figure 5d,e that, when the heat exchanger is activated, it causes a momentary drop in the humidity value, which causes the VPD to rise. This happens because the outside air is drier than the air inside of the micro-greenhouse, and when the exchanger is activated, it enters through the fan. Likewise, in Figure 5e,f, it is observed that, when the humidity falls, it causes the VPD to rise at the same time. Despite this, in a few seconds, the control system can resume within an acceptable range the humidity value again, causing the VPD to remain within the acceptable values for sesame seed germination. The scientific community has researched VPD control in microclimates. For example, [20] proposed a fogging system in a screenhouse to increase humidity. They obtained VPD values between 2.9 and 3.3 kPa. In another study by [21] a micro-fog system in a greenhouse was proposed to raise humidity and thus reduce VPD in summer temperatures. They obtained, as a result, a minimum VPD value of 0.75 kPa. A study presented by [18] involved different experiments in chambers to raise the humidity using airflow to vary the VPD value. They obtained VPD values that ranged between 1.1 and 3.7 kPa. The authors of [19] also executed three experiments where humidity values were increased to evaluate the VPD in growth chambers. They obtained results that varied between 0.7 and 2 kPa by applying automated irrigation four times a day. In another work, [22] also increased the humidity in a greenhouse in the winter season, employing a nebulization system to reduce VPD in the greenhouse. They managed to reduce the VPD value to 0.8 kPa by midday. Therefore, in this research, a VPD value of 0.93 kPa and 87% soil moisture are proposed for the proper germination sesame seeds in the micro-greenhouse. These values are due to PID control for soil moisture, FL temperature control and NN humidity control to obtain the VPD value.

3.2. Germination Parameters

The G%, GI, CVG and T50 improved significantly in the micro-greenhouse compared to the traditional technique for the optimum temperature, humidity and soil moisture conditions for sesame seed germination. The germination parameters determined for sesame seeds in the micro-greenhouse and the traditional technique are shown in Table 5. The sprout production in the micro-greenhouse is shown in Figure 7a.
Germinating sesame seeds in conditions that are not optimal for their growth reduces the metabolic process caused by the dormant state in which the seed is exposed [35]. In this work, a temperature of 30 °C was established in the micro-greenhouse. In [56], it is reported that in order to have a high G% and CVG, it is necessary to maintain a soil moisture range of 75–90%. If the soil moisture percentage increases to 100%, it would be difficult for the seed to receive oxygen because it compacts and obstructs the oxygen passage. Alternatively, if the soil moisture decreased below 75%, water absorption in the seed would be lower. Therefore, the movement of the reserves within the seed would not be adequately achieved. In this work, soil moisture for sesame seed germination remained at 85%. The environmental conditions of the physical variables were emulated in the laboratory, and it was complex to maintain the values of temperature, humidity and soil moisture constantly since there was no control of the physical variables in the traditional technique, which made it difficult to obtain the proper conditions for the development process of seed germination.
A G% of 88% was obtained in a micro-greenhouse under conditions of 30.02 °C and 77% for temperature and humidity in the present investigation. With these results, sesame seed sprouts grew with a VPD value of 0.93 kPa and soil moisture of 87%. In the work presented by [29], they tested germination in different varieties of sesame seeds at 25 °C. The G% results that they obtained ranged between 71% and 97%. In another study [27], G% results in sesame seeds between 84% and 97% at 25 °C were presented. In the work presented by [26], G% results between 65% and 95% when applying uniform irrigation to sesame seeds are presented. The authors of [25] germinated sesame seeds at different temperatures, obtaining their best G% at 25 °C with 73.8%. Crotalaria seeds have also been investigated under controlled conditions, as shown in the work of [53], where they obtained a CVG of 2 at a temperature of 25 °C. Additionally, [57] studied bean seeds and obtained a T50 of 3.6 days when germinated at 25 °C. The previous works demonstrated that germinating under controlled conditions positively impacts the seed germination parameters; therefore, if the control algorithm maintains the VPD and soil moisture with precision at the appropriate value, the germination process benefits.

3.3. Sprout Length Measurement

In the micro-greenhouse, the longest sprout measured 137.82 mm, as shown in Figure 7b, while the sprout obtained with the longest length using the traditional technique measured 60.79 mm, as can be observed in Figure 7c. The sprout with the longest length presented in the micro-greenhouse grew 77.03 mm more than the sprout obtained with the traditional technique. This is due to the controlled conditions of temperature and soil moisture, and seedling growth is favored by keeping these variables at optimum values. However, in the traditional technique, temperature ranged from 25 to 30 °C. In terms of soil moisture, saturation occurred in the soil and after a few hours of water scarcity, which caused the seedling development to be limited by the oxygen obstruction to the seed and crest hardening.
These results demonstrate an improvement compared to those obtained by [28], as they obtained sesame sprouts with a maximum length of 111 mm in the best of their treatments at a temperature of 25 °C. In another study [27], results of 98.3 mm as the maximum length of sesame sprouts at 25 °C were reported. The authors of [26] obtained sesame sprouts with a maximum length of 105 mm, below the size obtained in the micro-greenhouse. Additionally, [32] presented maximum sprout length results when soaked in water of 119.8 mm.

3.4. Nutritional Value of the Sprout

During the seed germination process in the micro-greenhouse, the protein content was significantly increased (p ≤ 0.05) by 9.7%. This increase may be due to dry matter loss, especially carbohydrates throughout the seed respiration process during germination. Simultaneously, the sprouts obtained using traditional techniques decreased the protein content in contrast to the ungerminated seeds. In work done by [31], reduction in protein content was demonstrated of 16% when germination time increased. In another study [35], 25.11% sesame protein was presented. The authors of [32] soaked sesame seeds for 6 h before germination, and 19.31% protein was obtained. In the present investigation, the protein content in the micro-greenhouse was 25.4%. In the traditional technique, germination decreased significantly (p ≤ 0.05) compared to whole grain with 6.6% due to seed water absorption, as mentioned in [30]. In terms of the lipid content, there was a 30% decrease in the micro-greenhouse sprouts, obtaining 37.5% and 58% in the traditional technique sprouts; this reduction may probably be due to the use of lipids as an energy source during the germination process. For this reason, when the germination time is greater, the lipids percentage is lower. A similar result is presented by [31], where a reduction in lipid content of 19% was observed in sesame sprouts produced under conditions of 30 °C.
The ash percentage increased significantly (p ≤ 0.05) in sprouts obtained in the micro-greenhouse compared to traditional germination with 1.1% and 1.9% in whole grain. This increase is due to the nutrients contained in the soil in which the seeds were sown. Likewise, the 12 h soaking used for the sesame seeds before being sown did not cause a decrease in minerals; [31] obtained ash results in sesame sprouts between 3% and 5% in conditions of 30 °C, presenting a considerable ash reduction caused by pre-germination soaking. Additionally, [35] presented 5.2% ash content for sesame sprouts in 35 °C temperature conditions. The moisture content increased considerably in the micro-greenhouse with 6.8% compared to the traditional technique and 79.9% in whole grain, possibly due to the seeds’ water absorption, causing moisture to increase proportionately in high germination times. In the investigation by [31], a decrease in moisture content when germinating sesame seeds was reported. Table 6 shows the protein, lipid, ash and moisture analysis of the whole grain and sesame sprouts collected in the micro-greenhouse and traditional technique.

4. Conclusions

In this research, sesame seeds were germinated in a micro-greenhouse and with a traditional technique. Proper seed germination depends on the physical conditions in which it is sown. For this reason, the effect of VPD was analyzed in two different techniques, resulting in an improvement in the physical properties of sesame sprouts, the length of the sesame sprout seedling and its nutritional value compared to the traditional technique. A 56% improvement in the germination percentage, 9.7% in protein content and 14.7% in ash content were obtained in the micro-greenhouse in comparison with the traditional technique. This was achieved using FL and NN for VPD control and PID for soil moisture control in the micro-greenhouse.
This study is presented as an alternative for the production of sesame sprouts where two options for direct use are proposed, one for food due to the increase in nutritional value, whose main focus is on the health of the population, and the other for agricultural purposes, producing seedlings in less time and of better size than traditional germination processes. With these results, the bases are established for future studies in pilot-scale systems for sprout production.

Author Contributions

Conceptualization, L.E.B.-S. and J.J.R.-M.; Data curation, J.C.P.-P.; Formal analysis, D.E.C.-P. and G.J.R.-A.; Funding acquisition, G.J.R.-A.; Investigation, L.E.B.-S., J.J.R.-M. and G.J.R.-A.; Methodology, L.E.B.-S., J.J.R.-M., J.C.P.-P. and G.J.R.-A.; Project administration, G.J.R.-A.; Resources, J.C.P.-P. and D.E.C.-P.; Software, D.E.C.-P.; Supervision, J.J.R.-M.; Validation, L.E.B.-S.; Visualization, J.C.P.-P. and D.E.C.-P.; Writing—original draft, L.E.B.-S.; Writing—review and editing, L.E.B.-S. and J.J.R.-M. All authors have read and agreed to the published version of the manuscript.

Funding

This work was supported by the Tecnológico Nacional de México (TecNM) (Grant number 8376.20-P).

Institutional Review Board Statement

Not applicable.

Informed Consent Statement

Not applicable.

Data Availability Statement

Not applicable.

Acknowledgments

The authors appreciate the support of Consejo Nacional de Ciencia y Tecnológia (CONACYT) and Tecnológico Nacional de México (TecNM).

Conflicts of Interest

The authors declare no potential conflict of interest.

References

  1. FAO. The State of Food Security and Nutrition in the World (SOFI). In Transforming Food Systems for Affordable Healthy Diets; FAO: Rome, Italy, 2020; pp. 1–320. [Google Scholar]
  2. Sivakanthan, A.; Prasantha, J.; Madhujith, T. Optimization of the Production of Structured Lipid by Enzymatic Interesterification from Coconut (Cocos nucifera) and Sesame (Sesamum indicum) Oil Using Response Surface Metholodogy; EJFST: Nigde, Turkey, 2018; Volume 6, pp. 43–55. [Google Scholar]
  3. Nadeem, A.; Kashani, S.; Ahmed, N.; Buriro, M.; Saeed, Z.; Mohammad, F.; Ahmed, S. Growth and yield of sesame (Sesamum indicum L.) under the influence of planting geometry and irrigation regimes. Am. J. Plant Sci. 2015, 6, 980–986. [Google Scholar] [CrossRef] [Green Version]
  4. Raeisi-Dehkordi, H.; Mohammadi, M.; Moghtaderi, F.; Salehi-Abargouei, A. Do sesame seed and its products affect body weight and composition? A systematic review and meta-analysis of controlled clinical trials. J. Funct. Foods 2018, 49, 324–332. [Google Scholar] [CrossRef]
  5. Akusu, O.; Kiin-Kabari, D.B.; Isah, E.M. Effects of processing methods on the nutrient composition and sensory attributes of cookies produced from wheat and sesame seed flour blends. Int. J. Food Sci. Technol. 2019, 5, 34–50. [Google Scholar]
  6. Turner, E.R.; Luo, Y.; Buchanan, R.L. Microgreen nutrition, food safety, and shelf life: A review. J. Food Sci. 2020, 85, 870–882. [Google Scholar] [CrossRef] [Green Version]
  7. Meyerowitz, S. Sprouts the Miracle Food; Quality Books: Buckingham, VA, USA, 2010. [Google Scholar]
  8. Ponce, P.; Molina, A.; Cepeda, P.; Lugo, E.; MacClery, B. Greenhouse Desing and Control; Taylor and Francis Group: Abingdon, UK; London, UK, 2015. [Google Scholar]
  9. Ottavini, D.; Pannacci, E.; Onofri, A.; Tei, F.; Kryger, P. Effects of light, temperature, and soil depth on the germination and emergence of Conyza canadensis (L.) Cronq. Agronomy 2019, 9, 533. [Google Scholar] [CrossRef] [Green Version]
  10. Limwiwattana, D.; Tongkhao, K.; Na, J.K. Effect of sprouting temperature and air relative humidity on metabolic profiles of sprouting black gram (Vigna Mungo L.). J. Food Process. Preserv. 2016, 40, 306–315. [Google Scholar]
  11. Gao, R.; Zhao, R.; Huang, Z.; Yang, X.; Wei, X.; He, Z.; Walck, J.L. Soil temperature and moisture regulate seed dormancy cycling of a dune annual in a temperate desert. Environ. Exp. Bot. 2018, 155, 688–694. [Google Scholar] [CrossRef]
  12. Amitrano, C.; Arena, C.; Rouphael, Y.; De Pascale, S.; De Micco, V. Vapour pressure deficit: The hidden driver behind plant morphofunctional traits in controlled environments. Ann. Appl. Biol. 2019, 175, 313–325. [Google Scholar] [CrossRef]
  13. Jambrak, A.R.; Nutrizio, M.; Djekić, I.; Pleslić, S.; Chemat, F. Internet of nonthermal food processing technologies (IoNTP): Food industry 4.0 and sustainability. Appl. Sci. 2021, 11, 686. [Google Scholar] [CrossRef]
  14. Riahi, J.; Vergura, S.; Mezghani, D.; Mami, A. Intelligent control of the microclimate of an agricultural greenhouse powered by a supporting pv system. Appl. Sci. 2020, 10, 1350. [Google Scholar] [CrossRef] [Green Version]
  15. Sriraman, A.; Mayorga, R.V.A. Fuzzy inference system approach for greenhouse climate control. Environ. Inform. Arch. 2004, 2, 630–641. [Google Scholar]
  16. Javadikia, P.; Tabatabaeefar, A.; Omid, M.; Fathi, M. Evaluation of intelligent greenhouse climate control system, based fuzzy logic in relation to conventional systems. In Proceedings of the International Conference on Artificial Intelligence and Computational Intelligence, Shanghai, China, 7–8 November 2009; pp. 146–150. [Google Scholar]
  17. Habib, S.; Akram, M.; Ashraf, A. Fuzzy climate decision support systems for tomatoes in high tunnels. Int. J. Fuzzy Syst. 2016, 19, 751–775. [Google Scholar] [CrossRef]
  18. Fletcher, A.; Sinclair, T.R.; Allen, L.H. Transpiration responses to vapor pressure deficit in well watered ‘slow-wilting’ and commercial soybean. Environ. Exp. Bot. 2007, 61, 145–151. [Google Scholar] [CrossRef]
  19. Ben-Asher, J.; García, A.G.Y.; Flitcroft, I.; Hoogenboom, G. Effect of atmospheric water vapor on photosynthesis, transpiration and canopy conductance: A case study in corn. Plant Soil Environ. 2013, 59, 549–555. [Google Scholar] [CrossRef] [Green Version]
  20. Leyva, R.; Aguilar, C.C.; Sánchez-Rodríguez, E.; Romero-Gámez, M.; Soriano, T. Cooling systems in screenhouses: Effect on microclimate, productivity and plant response in a tomato crop. Biosyst. Eng. 2015, 129, 100–111. [Google Scholar] [CrossRef]
  21. Zhang, D.; Zhang, Z.; Li, J.; Chang, Y.; Du, Q.; Pan, T. Regulation of vapor pressure deficit by greenhouse micro-fog systems improved growth and productivity of tomato via enhancing photosynthesis during summer season. PLoS ONE 2015, 10, e0133919. [Google Scholar] [CrossRef] [PubMed]
  22. Lu, N.; Nukaya, T.; Kamimura, T.; Zhang, D.; Kurimoto, I.; Takagaki, M.; Maruo, T.; Kozai, T.; Yamori, W. Control of vapor pressure deficit (VPD) in greenhouse enhanced tomato growth and productivity during the winter season. Sci. Hortic. 2015, 197, 17–23. [Google Scholar] [CrossRef]
  23. Prenger, J.J.; Ling, P.P. Greenhouse Condensation Control; Fact Sheet (Series) AEX-804: Wooster, OH, USA, 2000. [Google Scholar]
  24. Ramos-Fernández, J.C.; Jean-Francois, B.; Márquez-Vera, M.A.; Lafont, F.; Pessel, N.; Espinoza-Quesada, E.S. Fuzzy modeling vapor pressure deficit to monitoring microclimate in greenhouses. IFAC 2016, 49, 371–374. [Google Scholar] [CrossRef]
  25. Mendoza, C.P.; Fuentes, L.T.; Aguilera, L.A.; De Cristaldo, R.M.O. Effect of different temperatures on physiological quality of sesame seeds. Investig. Agrar. 2015, 17, 122–128. [Google Scholar] [CrossRef] [Green Version]
  26. Prabhakaran, J.; Kavitha, D. Allelopathic Influence of Trianthima Portulacastrum, L. on growth and developmental responses of sesame (Sesamum Indicum, L.). Kongunadu Res. J. 2017, 4, 183–186. [Google Scholar] [CrossRef]
  27. Nouriyani, H. Payame Noor University effect of seed priming on germination characteristics, biochemical changes and early seedling growth of sesame (Sesamum indicum). Iran. J. Seed Res. 2019, 5, 43–58. [Google Scholar] [CrossRef] [Green Version]
  28. Tizazu, Y.; Ayalew, D.; Terefe, G.; Assefa, F. Evaluation of seed priming and coating on germination and early seedling growth of sesame (Sesamum indicum L.) under laboratory condition at Gondar, Ethiopia. Cogent Food Agric. 2019, 5, 1–9. [Google Scholar] [CrossRef]
  29. Neme, K.; Tola, Y.B.; Mohammed, A.; Tadesse, E.; Astatkie, T. Effects of variety, storage container, and duration on the physical properties, oil content, germination capacity, and seed loss due to Plodia interpunctella infestation of Ethiopian sesame. J. Sci. Food Agric. 2020, 101, 843–852. [Google Scholar] [CrossRef]
  30. Megat, R.; Noraliza, C.W.; Azrina, A.; Zulkhairi, A. Nutritional changes in germinated legumes and rice varieties. Int. Food Res. J. 2011, 18, 705–713. [Google Scholar]
  31. Mares, L.F.D.M.; Passos, M.C.; Menezes, C.C. Interference of germination time on chemical composition and antioxidant capacity of white sesame (Sesamum Indicum). Food Sci. Technol. 2018, 38, 248–253. [Google Scholar] [CrossRef] [Green Version]
  32. Biswas, U.; Das, R.; Dutta, A. Growth, yield and seed quality parameters of sesame (Sesamum indicum L.) as influenced by seed priming and pinching. Int. J. Curr. Microbiol. Appl. Sci. 2019, 8, 1112–1119. [Google Scholar] [CrossRef]
  33. Shamshiri, R.; Che Man, A.; Zakaria, A.; Beveren, P.; Wan Ismail, W.; Ahmad, D. Membership function model for defining optimality of vapor pressure deficit in closed-field cultivation of tomato. In Proceedings of the International Conference on Agricultural and Food Engineering, Kuala Lumpur, Malaysia, 21 March 2017; pp. 281–290. [Google Scholar]
  34. Terefe, G.; Wakjira, A.; Berhe, M.; Hagos, T. Sesame Production Manual; Ethiopian Institute of Agricultural Research: Adís Ababa, Ethiopia, 2012. [Google Scholar]
  35. Hahm, T.-S.; Park, S.-J.; Lo, Y.M. Effects of germination on chemical composition and functional properties of sesame (Sesamum indicum L.) seeds. Bioresour. Technol. 2009, 100, 1643–1647. [Google Scholar] [CrossRef] [PubMed]
  36. Murray, F.W. On the computation of saturation vapor pressure. J. Appl. Meteorol. 1967, 6, 203–204. [Google Scholar] [CrossRef]
  37. Cengel, Y.; Boles, M. Thermodynamics: An Engineering Approach; McGraw-Hill: New York, NY, USA, 2011. [Google Scholar]
  38. Kayacan, E.; Maslim, R. Type-2 fuzzy logic trajectory tracking control of quadrotor vtol aircraft with elliptic membership functions. IEEE/ASME Trans. Mechatron. 2016, 22, 339–348. [Google Scholar] [CrossRef]
  39. Oubehar, H.; Selmani, A.; Ed-Dahhak, A.; Lachhab, A.; Archidi, M.E.H.; Bouchikhi, B. ANFIS-based climate controller for computerized greenhouse system. Adv. Sci. Technol. Eng. Syst. J. 2020, 5, 8–12. [Google Scholar] [CrossRef]
  40. Izquierdo, S.; Izquierdo, L.R. Mamdani Fuzzy Systems for Modelling and Simulation: A Critical Assessment. J. Artif. Soc. Soc. Simul. 2018, 21. [Google Scholar] [CrossRef]
  41. Velandia, J.B.; Quintana, J.S.C.; Ayala, S.C.V. Environment humidity and temperature prediction in agriculture using Mamdani inference systems. Int. J. Electr. Comput. Eng. 2021, 11, 3502–3509. [Google Scholar] [CrossRef]
  42. Faouzi, D.; Bibi-Triki, N.; Draoui, B.; Abene, A. Modeling and simulation of fuzzy logic controller for optimization of the greenhouse microclimate management. Agric. Sci. Technol. 2017, 9, 132–139. [Google Scholar] [CrossRef]
  43. Singh, V.K.; Tiwari, K.N. Prediction of greenhouse micro-climate using artificial neural network. Appl. Ecol. Environ. Res. 2017, 15, 767–778. [Google Scholar] [CrossRef]
  44. Jung, D.-H.; Kim, H.S.; Jhin, C.; Kim, H.-J.; Park, S.H. Time-serial analysis of deep neural network models for prediction of climatic conditions inside a greenhouse. Comput. Electron. Agric. 2020, 173, 105402. [Google Scholar] [CrossRef]
  45. Hagan, M.; Demuth, H.; Beale, M.; De Jesús, O. Neural Network Design; Material: Oklahoma City, OK, USA, 2014. [Google Scholar]
  46. Mazzoleni, M.; Scandella, M.; Previdi, F. KBERG: A MatLab toolbox for nonlinear kernel-based regularization and system identification. IFAC-PapersOnLine 2020, 53, 1231–1236. [Google Scholar] [CrossRef]
  47. Wang, L.; Wang, B. Construction of greenhouse environment temperature adaptive model based on parameter identification. Comput. Electron. Agric. 2020, 174, 105477. [Google Scholar] [CrossRef]
  48. Taher Azar, A.; Hassan Ammar, H.; de Brito Silva, G.; Akmal Bin Razali, M.S. Optimal proportional integral derivative (PID) controller design for smart irrigation mobile robot with soil moisture sensor. In Proceedings of the International Conference on Advanced Machine Learning Technologies and Applications (AMLTA2019), Cairo, Egypt, 28–30 March 2019; pp. 349–359. [Google Scholar]
  49. Ogata, k. Modern Control Engineering; Pearson, Education: Madrid, Spain, 2010. [Google Scholar]
  50. Ziegler, J.; Nichols, G. Optimum settings for automatic controllers. Trans. ASME 1942, 64, 759–765. [Google Scholar] [CrossRef]
  51. Jain, R.; Joshi, I. Nutrient analysis of germinated sesame seeds and development of value added biscuits. Stud. Home Community Sci. 2015, 9, 61–64. [Google Scholar] [CrossRef]
  52. Kashani, S.-U.; Buriro, M.; Nadeem, A.; Ahmed, N.; Saeed, Z.; Mohammad, F.; Ahmed, S. Response of various sesame varieties under the influence of nitrogen and phosphorus doses. Am. J. Plant Sci. 2015, 6, 405–412. [Google Scholar] [CrossRef] [Green Version]
  53. Al-Ansari, F.; Ksiksi, T. A Quantitative assessment of germination parameters: The case of and. Open Ecol. J. 2016, 9, 13–21. [Google Scholar] [CrossRef] [Green Version]
  54. Caliskan, O.; Mavi, K.; Polat, A. Influences of presowing treatments on the germination and emergence of fig seeds (Ficus carica L.). Acta Sci. Agron. 2012, 34, 293–297. [Google Scholar] [CrossRef] [Green Version]
  55. AOAC. Official Methods of Analysis; EUA/AOAC (Association of Official Analytical Chemists): Washinton, DC, SUA, 1999. [Google Scholar]
  56. Boureima, S.; Eyletters, M.; Diouf, M.; Diop, M.; Van Damme, P. Sensitivity of seed germination and seedling radicle growth to drought stress in sesame (Sesamum indicum L.). Res. J. Environ. Sci. 2011, 5, 557–564. [Google Scholar] [CrossRef]
  57. Miladinov, Z.; Balešević-Tubić, S.; Đukić, V.; Ilić, A.; Čobanović, L.; Dozet, G.; Merkulov-Popadić, L. Effect of priming on soybean seed germination parameters. Acta Agric. Serbica 2018, 23, 15–26. [Google Scholar] [CrossRef] [Green Version]
Figure 1. Hood-type micro-greenhouse prototype.
Applsci 11 07957 g001
Figure 2. Components (a) and dimensions (mm) (b) of the micro-greenhouse.
Applsci 11 07957 g002
Figure 3. Schematic of heat exchangers for heating (a) and cooling (b).
Applsci 11 07957 g003
Figure 4. Control system general diagram.
Applsci 11 07957 g004
Figure 5. Simulation (ac) and implementation (df) graphs of temperature FL control, humidity NN control and VPD control.
Applsci 11 07957 g005
Figure 6. Simulation (a) and implementation (b) of soil moisture PID control.
Applsci 11 07957 g006
Figure 7. Sprout production in micro-greenhouse (a). Larger sprouts collected in micro-greenhouse (b) in contrast with traditional technique (c).
Applsci 11 07957 g007
Table 1. Fuzzy sets.
ErrorTempInt
SetVertex 1Vertex 2Vertex 3Vertex 4 (Trapeze)
High Negative−20−20−4−1.3
Normal Negative−2−1.3−0.6N/A
Low Negative−1.4−0.6−0.2N/A
Normal−0.200.5N/A
Low Positive012N/A
Normal Positive123N/A
High Positive251515
ErrorTempExt
Normal−2.502.5N/A
Very Low Positive Difference12.54N/A
Low Positive Difference2.54.26N/A
Normal Positive Difference468N/A
High Normal Positive Difference681717
VarTempInt
High Descent−255−255−170N/A
Normal Descent−240−170−100N/A
Low Descent−170−100−30N/A
Hold−30−1130
Very Small Ascent03060N/A
Small Ascent3070115N/A
Normal Low Ascent60115170N/A
Normal High Ascent115170230N/A
High Ascent170255255N/A
N/A = Not Applicable.
Table 2. Heating control rules.
Errorint Error e x t
NormalVery Low Positive DifferenceLow Positive DifferenceNormal Positive DifferenceHigh Normal Positive Difference
NormalHLDHLDHLDVSASA
Low PositiveNLANHAHAHAHA
Normal PositiveNHAHAHAHAHA
High PositiveHAHAHAHAHA
HLD: Hold, NLA: Normal Low Ascent, NHA: Normal High Ascent, HA: High Ascent, SA: Small Ascent, VSA: Very Small Ascent.
Table 3. Ventilation control rules.
Error Temp IntControl Action
Low NegativeLD
Normal NegativeND
High NegativeHD
LD: Lower Descent, ND: Normal Descent and HD: High Descent.
Table 4. Error comparison in simulation and implementation.
ControlSimulationImplementation
SEMAE
FL Temperature Control (°C)0.430.02 ± 0.00230.02 ± 0.08
NN Humidity Control (%)0.0577 ± 0.1177 ± 3.90
PID Soil Moisture Control (%)0.187 ± 0.5587 ± 3.95
VPD Control (kPa)1.030.93 ± 0.0040.93 ± 0.09
FL: Fuzzy Logic, NN: Neural Network, PID: Proportional–Integral–Derivative, SE: Standard Error and MAE: Mean Absolute Error.
Table 5. Germination parameter results.
TechniqueG%GI (Days)CVG (%)T50 (Days)
Micro-Greenhouse88 ± 3.51 a3.62 ± 1.52 a19.71 ± 2.52 a4.63 ± 2.52 a
Traditional32 ± 3.44 b1.03 ± 2.20 b16.40 ± 2.70 b5.79 ± 3.6 a
G%: germination percentage, GI: germination index, T50: time at 50% of germination, and CVG: coefficient of the velocity of germination. The values are the measure (a,b are the comparisons between the rows) of five independent experiments. Different letters indicate statistical differences (p < 0.05).
Table 6. Nutritional sesame sprout value.
TechniqueProtein (%)Lipids (%)Ash (%)Moisture (%)
Whole grain22.3 ± 1.5 b54.3 ± 2.1 a4.8 ± 1.1 c10.2 ± 1.5 c
Micro-Greenhouse25.4 ± 2.2 a37.5 ± 2.1 b6.7 ± 1.3 a90.1 ± 1.2 a
Traditional15.7 ± 1.7 c22.8 ± 1.8 c5.6 ± 1.1 b83.3 ± 1.6 b
The values are the measure (a–c are the comparisons between the rows) of five independent experiments. Different letters indicate statistical differences (p < 0.05).
Publisher’s Note: MDPI stays neutral with regard to jurisdictional claims in published maps and institutional affiliations.

