Abstract
Skin applications of non-thermal atmospheric pressure plasma (NTAPP) have been at-tracting attention from medical and cosmetic aspects. The reactive species generated from plasma sources have been known to play important roles in the skin. For proper applications, it is essential to know how they diffuse into the skin. In this study, the penetration of active species from NTAPP through a skin model was analyzed by UV absorption spectroscopy. The diffusions of hydrogen peroxide, nitrite, and nitrate were quantified through curve fitting. We utilized an agarose gel to mimic epidermis and dermis layers, and we used a lipid film or a pig skin sample to mimic the stratum corneum (SC). The diffusion characteristics of reactive species through this skin model and the limitations of this method were discussed
1. Introduction
Skin applications of non-thermal atmospheric pressure plasma (NTAPP) have been studied for the last decades, for both medical or cosmetic purposes. Positive effects of plasma have been reported for blood coagulation [1,2], wound healing [3,4], tissue regeneration [5], cancer treatment [6,7], drug delivery [8,9] and cosmetic purposes such as acne treatment and anti-aging [10,11]. These positive effects are attributed to the various reactive oxygen and nitrogen species (RONS) occurring in the plasma. The actions of reactive oxygen species (ROS) and reactive nitrogen species (RNS) are distinguished in biological systems [12]. ROS generally activates redox responses in cells; meanwhile RNS induces nitrosylation or nitrosation, which initiate different cellular signaling pathways that are known to be related to cell differentiation or wound healing processes [7,13]. The composition of RONS from NTAPP can be tailored by using different feeding gases, which may result in differential biological responses [14,15].
The gaseous species that can be formed from air include both ROS such as OH radicals, O, H2O2, O3, H2O2, HO2, and RNS such as NO, NO2, HNO2, HNO3, and NO3 [16,17,18]. Previous studies show that OH, O, N, and H radicals with a short lifetime show a steadily decreasing trend as the distance from the nozzle increases [16,17,18]. On the other hand, the density of long-lived reactive species such as O3, HNO2, HNO3, and H2O2 increases with the distance. When these RONS reach an aqueous interface, the aqueous density of H2O2, HNO2/NO2− and NO3− increased with time, but the densities of O3, HO2/O2− and ONOOH/ONOO− quickly decreased with depth in silico [18]. These simulations are hard to prove experimentally due to the short lifetimes and short pathlengths of highly reactive RONS in solution. Long-lived species have been measured with colorimetric assays with known indicators [19,20,21]. Recently, UV absorption spectroscopy (UVAS) was introduced as a real-time measurement method for plasma-induced RONS [22,23,24]. The analysis of absorption spectrum in UV range can distinguish between H2O2, NO2−, NO3−, and O2 in water.
For proper application of NTAPP on the skin, it is essential to understand how deep the generated active species diffuse into the tissue. In tissues, RONS reaching on the surface should penetrate gel-like structures containing cells. Their structural complexity and optical turbidity make it harder to detect RONS inside tissues. As a simplified model, homogeneous gels such as agarose or gelatin have been utilized [22,25,26,27,28]. Some studies have used mixtures of indicators and gels to visualize the position of each RONS in model tissues [25,26,27]. They showed that the diffusion of each RONS increased with time and the depth of diffusion of long-lived species reached about 2~3 mm. Some studies placed gel films on the water to analyze the penetration of RONS through gels [22,27,28]. He et al. [27] showed that the permeabilities of H2O2, NO2−, NO3−, and O3 are different through gelatin gels by colorimetric measurements. Oh et al. [22,28] used the UVAS method and showed that long-lived RONS can penetrate 2~3 mm agarose gel, and there are accumulations of RONS within the agarose. However, considering the complex structure of the skin, a homogeneous gel is not an accurate skin model. Duan et al. [19] used colorimetric assays and showed that the penetration of some kinds of the RONS could be enhanced significantly by tape stripping stratum corneum (SC) from mice skin. However, it should be noted that there are interactions between RONS and organic materials in the real skin, generating secondary RONS [21]. The byproducts from organic materials can be considered as a source of increased diffusion of RONS through tissues.
In order to investigate the impact of the SC layers on the diffusion properties of RONS from NTAPP, we used an agarose gel film with a SC layer that was artificially manufactured with lipid extracts from Hacat keratinocytes. The concentrations of long-lived species, H2O2, NO2− and NO3−, were quantified through a UVAS measurement method [23,24]. The permeation of RONS increased with the NTAPP exposure time and decreased with the distance to the sample. The agarose gel barrier effect was different for the three RONSs no matter whether the SC layer is present or not. Additionally, the outermost layer sectioned from a pig skin was investigated as another SC model. The effects of SC on the RONS diffusion and the applicability of the skin model are discussed. In the Appendix A, the accuracy of spectral analysis was validated with chemicals, and data on the effects of the thickness and the density of agarose gel films were added.
2. Materials and Methods
2.1. Non-Thermal Atmospheric Pressure Plasma (NTAPP)
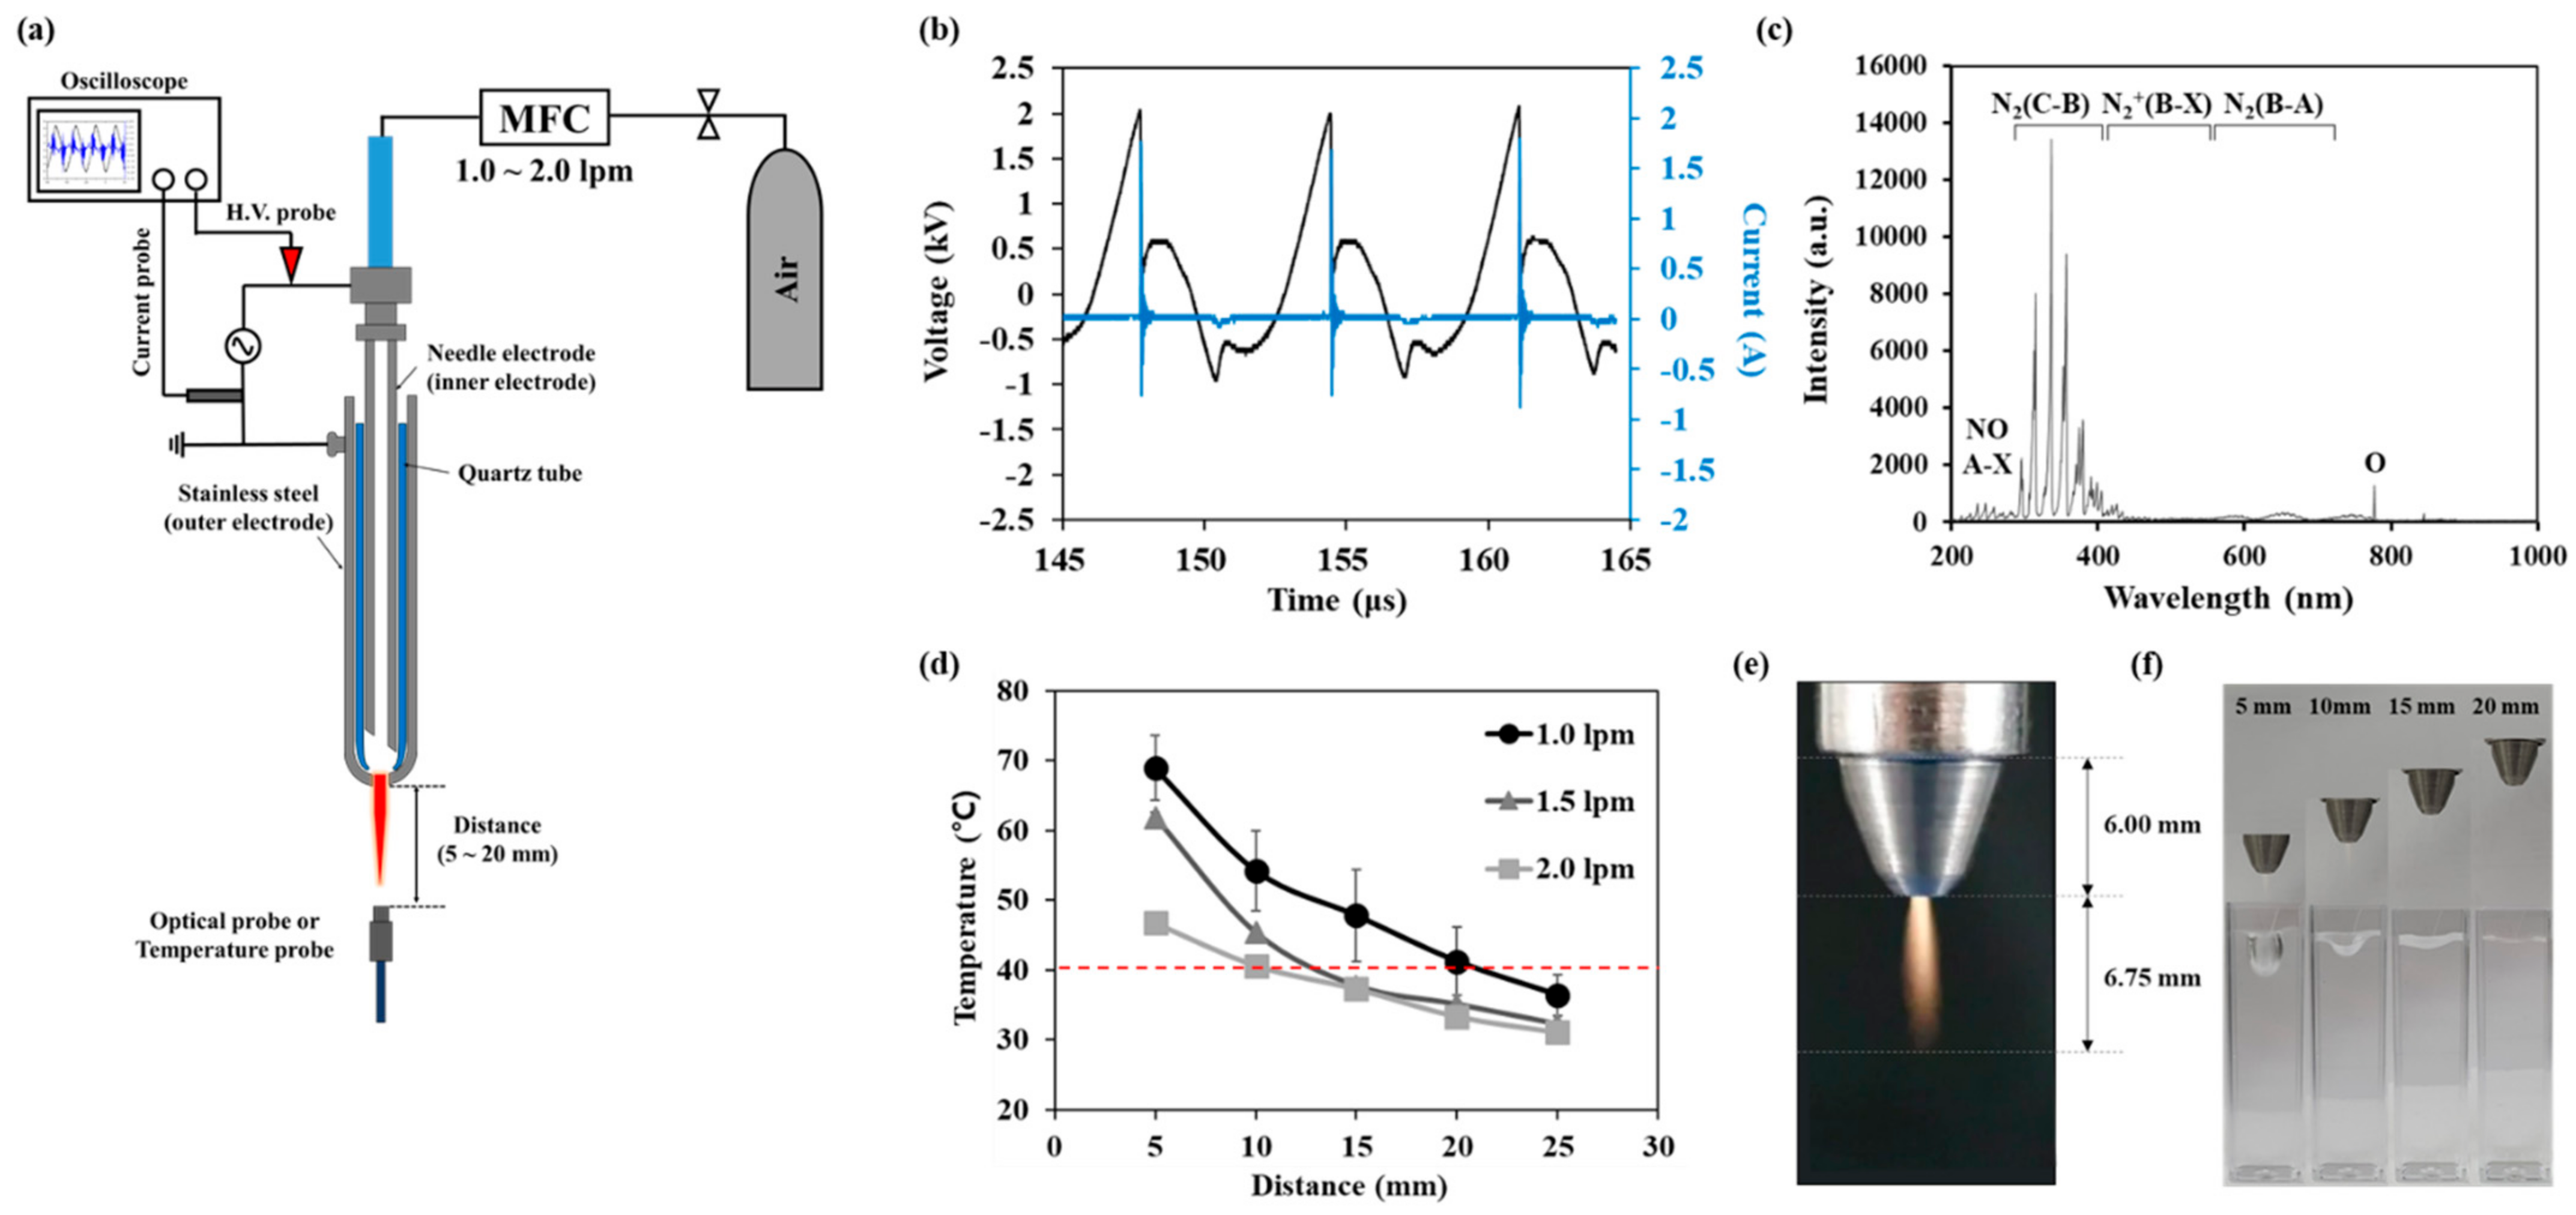
Figure 1a shows a schematic of the NTAPP. The NTAPP jet source consists of a hollow inner needle electrode placed in the center of a cylindrical quartz tube. The outer hollow stainless electrode was tightly wrapped with a quartz tube, and it is electrically grounded. Ambient air was fed into the inner needle with a fixed gas flow rate of 1.5 standard liters per minute (L/m). The DC-AC inverter provided electrical powers with a burst pulse module without generating external heat in the device. Current and voltage values were monitored by an oscilloscope (GDS-2102A, GWINSTEK, Taipei, Taiwan) using a magnetic pickup coil and a ×1000 voltage probe (P6015A and P6021A, Tektronix, Beaverton, OR, USA), respectively. Optical emission spectra (OES) and temperature of the plume were measured using a spectrometer (HR4000, Ocean Optics, Orlando, FL, USA), and temperature probe (Luxtron FOT Lab kit, LumaSense Technologies, Ballerup, Denmark), respectively, while placing an optical fiber under the plume as shown in the Figure 1e.

Figure 1.
Characteristics of the NTAPP: (a) an experimental setup, (b) voltage and current profile during discharge (c) optical emission spectra of NTAPP (d) a gas temperature according to gas flow rates and NTAPP treatment distances. All measurements were repeated three times. (e) a photograph of NTAPP plume (f) images of plasma treated water surface inside cuvette according to the distance between NTAPP device and water.
2.2. Chemicals
H2O2 (Cat. No. 2017A3503, JUNSEI), NaNO2 (Cat. No. 7601-4105, Dae Jung Chemicals, Siheung-Si, Korea), KNO2 (Cat. NO. 310484, Sigma-Aldrich, St. Louis, MO, USA), NaNO3 (Cat. NO. 7631-99-4, Samchun Pure Chemical, Pyeongtaek-si, Korea) and KNO3 (Cat. No. 7757-79-1, Dae Jung Chemicals, Siheung-Si, Korea) were used for making premixed solutions. Stock solutions of 100 mM of H2O2, NO2−, and NO3− were prepared. In each experiment, the stock solutions were diluted right before use.
2.3. UV Absorption Spectroscopy (UVAS)
Figure 2a shows a schematic diagram of the UVAS method. The circular dichroism (CD) spectrometer (j-815, JASCO, Easton, MD 21601, USA) with a wavelength range from 190–350 nm was operated in a nitrogen environment. 4 mL deionized (DI) water inside a quartz cuvette (100-QS, Hellma Analytics, Müllheim, Germany) with a standard optical path of 10 mm was treated at 1.5 mm below the NTAPP device. Right after the plasma treatment, the cuvette was transferred to the CD spectrophotometer without perturbing the solution, and the absorption spectrum of plasma activated water (PAW) was measured. The spectral resolution is 0.025 nm, the scanning speed is 200 nm/min, and the band width is 1.00 nm. The RONS concentration was determined from UV absorbance spectra by using Beer-Lambert law [29,30,31,32,33]:
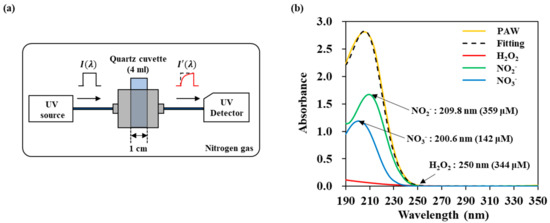
Figure 2.
UV abs spectroscopy of NTAPP treated water to monitor the transport of RONS: (a) schematic diagram, (b) deconvolution of a spectrum into three components H2O2, NO2−, and NO3− by linear curve fitting.
The absorbance (Abs), was defined by Equation (1) where is transmittance, is the light intensity after it passes through the plasma treated DI water and is the initial light intensity. And is the molar absorptivity of the chemical species at a certain wavelength, is the optical path length, and is the RONS concentration. Concentrations for the three reactive species H2O2, NO2−, and NO3− were calculated using the curve fitting method.
We plotted the obtained UV absorption spectrum using the reference spectra data of H2O2, NO2−, and NO3− through the following way. The MATLAB program was used, and the fitting is referring to the previous study of the Oh’s group base on Figure A1 [22,23].
- At first, fitting the spectrum with H2O2 reference spectrum of a region longer than 245 nm.
- Then, 195 nm to 205 nm region is fitted with the NO3− reference spectrum.
- Finally, the NO2− reference spectrum is used in the range from 205 nm to 215 nm.
2.4. Agarose Tissue Model
The 1% agarose layer was used as a skin model. The agarose powder (V3125, Promega Corporation, Madison, WI, USA) was dissolved in DI water for 3 min using a microwave oven. The dissolved agarose solution was poured into a slit with intervals of 1 mm and sufficiently cooled to form an agarose film. The agarose films were stored in a 4 °C refrigerator before use, and it was cut into 20 × 20 mm2 size to cover the top of the quartz cuvette.
2.5. Preparation of the Stratum Corneum (SC) Layer with Lipid Solution and Pig Skin
About ten volumes of chloroform-methanol (2:1 volume ratio) solution was added to the collected 107 Hacat cells after subculture, vortexed for 5 min, and centrifuged. The aqueous layer of the supernatant was removed, and the lower chloroform layer was collected. The process was repeated three times with a chloroform-methanol solution, and the lower chloroform layer was collected and washed several times with an equal volume of 0.5 M KCl in 50% methanol to remove non-lipid materials. The lipid-rich chloroform layer was dried in a nitrogen stream and redissolved in 500 μL chloroform. 50 μL lipid solution was dropped on polydimethylsiloxane (PDMS), to form a lipid membrane, ripped off and then put on the top of the agarose gel [34]. To get a real SC layer, fresh pig skin was used in this experiment. The fresh abdomen skin was purchased from a market. It was cut with small scissors, then the subcutaneous tissue of the detached skin is scraped cleanly with a surgical knife and washed with phosphate-buffered saline (PBS). After the hair of the incised skin were clearly removed, the skin was frozen in optimal cutting temperature compound (Tissue-Tek OCT Compound, Sakura Finetek, Torrance, CA, USA). The uppermost part of the skin was cryo-sectioned (CM1950, Leica, Wetzlar, Germany) and washed with deionized water. The sectioned skin tissue was transferred on the top of agarose gel, and the surface was dried lightly with Kimwipes.
2.6. Optical Microscopy and Contact Angle Measurements
Optical images of samples were taken with a phase-contrast microscope (Eclipse Ti-U, Nikon, Tokyo, Japan). Surface hydrophilicity was measured by Phoenix-MT (S.E.O co. Ltd, Suwon-si, Korea) and recorded with the company’s contact angle measurement system software at 22 °C. The water contact angle was measured to observe the hydrophilicity of agarose and stratum corneum used as a skin model. A volume of 6 μL of DI water was supplied through an inverted needle, and the contact angle was calculated from the average of the result values measured on three separately prepared samples.
3. Results
3.1. Electrical and Optical Characteristics of NTAPP
Figure 1b shows the voltage and current signal applied to the plasma jet source. The discharge voltage was 2.0 kV, and the frequency was 90 kHz with a 15% duty ratio. And the root means square (RMS) voltage and current were Vrms = 0.69 kV and Irms = 69.1 mA. The discharge power was calculated as 2.38 J/s. Figure 1c shows the OES of our NTAPP in the wavelength range between 200–1000 nm. The main peaks were the second positive system N2(C-B) in the near UV region (300–440 nm band) and N2 (B-A) first positive system (390–500 nm). Atomic oxygen (777 nm), NO-β (200–300 nm), and NO-γ (260–320 nm) system were also detected weakly in the OES spectrum. Figure 1d shows the temperature according to the gas flow rate and the distance from the end of a quartz tube. Temperature decreases with increasing the distance and with increasing the gas flow rate. Temperature was 37.7 °C when the distance was 15 mm, and the gas flow rate was 1.5 lpm. We used this condition for further studies since this temperature is adequate for biological applications. In this condition, the pressure of the discharge gas hardly effects on the sample as shown in Figure 1e. Since 1 mm agarose gel film is very thin and flexible, it is deformed with long treatment. However, it did not cause a loss of sealing between the cuvette and the gel film as shown in Figure A2.
3.2. RONS UV Absorption Spectra Profiles
In order to measure the amounts of reactive species in DI water, we measured UV absorption spectra and analyzed them with the curve fitting method. The absorption spectra of H2O2, NO2−, and NO3− were obtained from the standard solutions of H2O2, NaNO2, KNO2, NaNO3, and KNO3. Different concentrations were used to determine the molar absorptivity ε value of each reactive molecule used in Equation (1). Figure A1a shows the absorbance of each reactive species. NO2− has a maximum value at 209.8 nm, and NO3− at 200.6 nm. The same spectra were obtained when NO2− and NO3− were bonded to other cations (Na+ or K+). In the case of H2O2, it does not have the main peak in the measuring range, and the absorbance is low. Therefore, for calculating H2O2 concentration, we used a tail region over 245 nm, where the former two reactive species do not contribute to the absorbance. To determine the molar absorptivity, UV absorbance spectrum of each reactive species was measured in a concentration range from a minimum of 6 μM to a maximum of 3.125 mM (H2O2), 0.19 mM (NO2−), and 97 μM (NO3−). Figure A1a shows that the absorbance intensity increased linearly with concentration. We calculate different constant values ( for H2O2, NO2−, and NO3− from the intensity at 250 nm, 209.8 nm, and 200.6 nm, respectively. Figure A1b show the verification of the fitting. We mixed solutions of H2O2, NO2−, and NO3− with different concentrations, and fitted the spectra. We were able to obtain the concentration of three kinds of molecules within a certain error. The accuracy values are 8.54, 4.01, 3.05% for 100 μM H2O2, 20 μM NO2−, and 20 μM NO3−, respectively. In the case of hydrogen peroxide, it has a relatively large measurement uncertainty due to its low absorbance.
3.3. Generation of RONS in DI Water by NTAPP Treatment
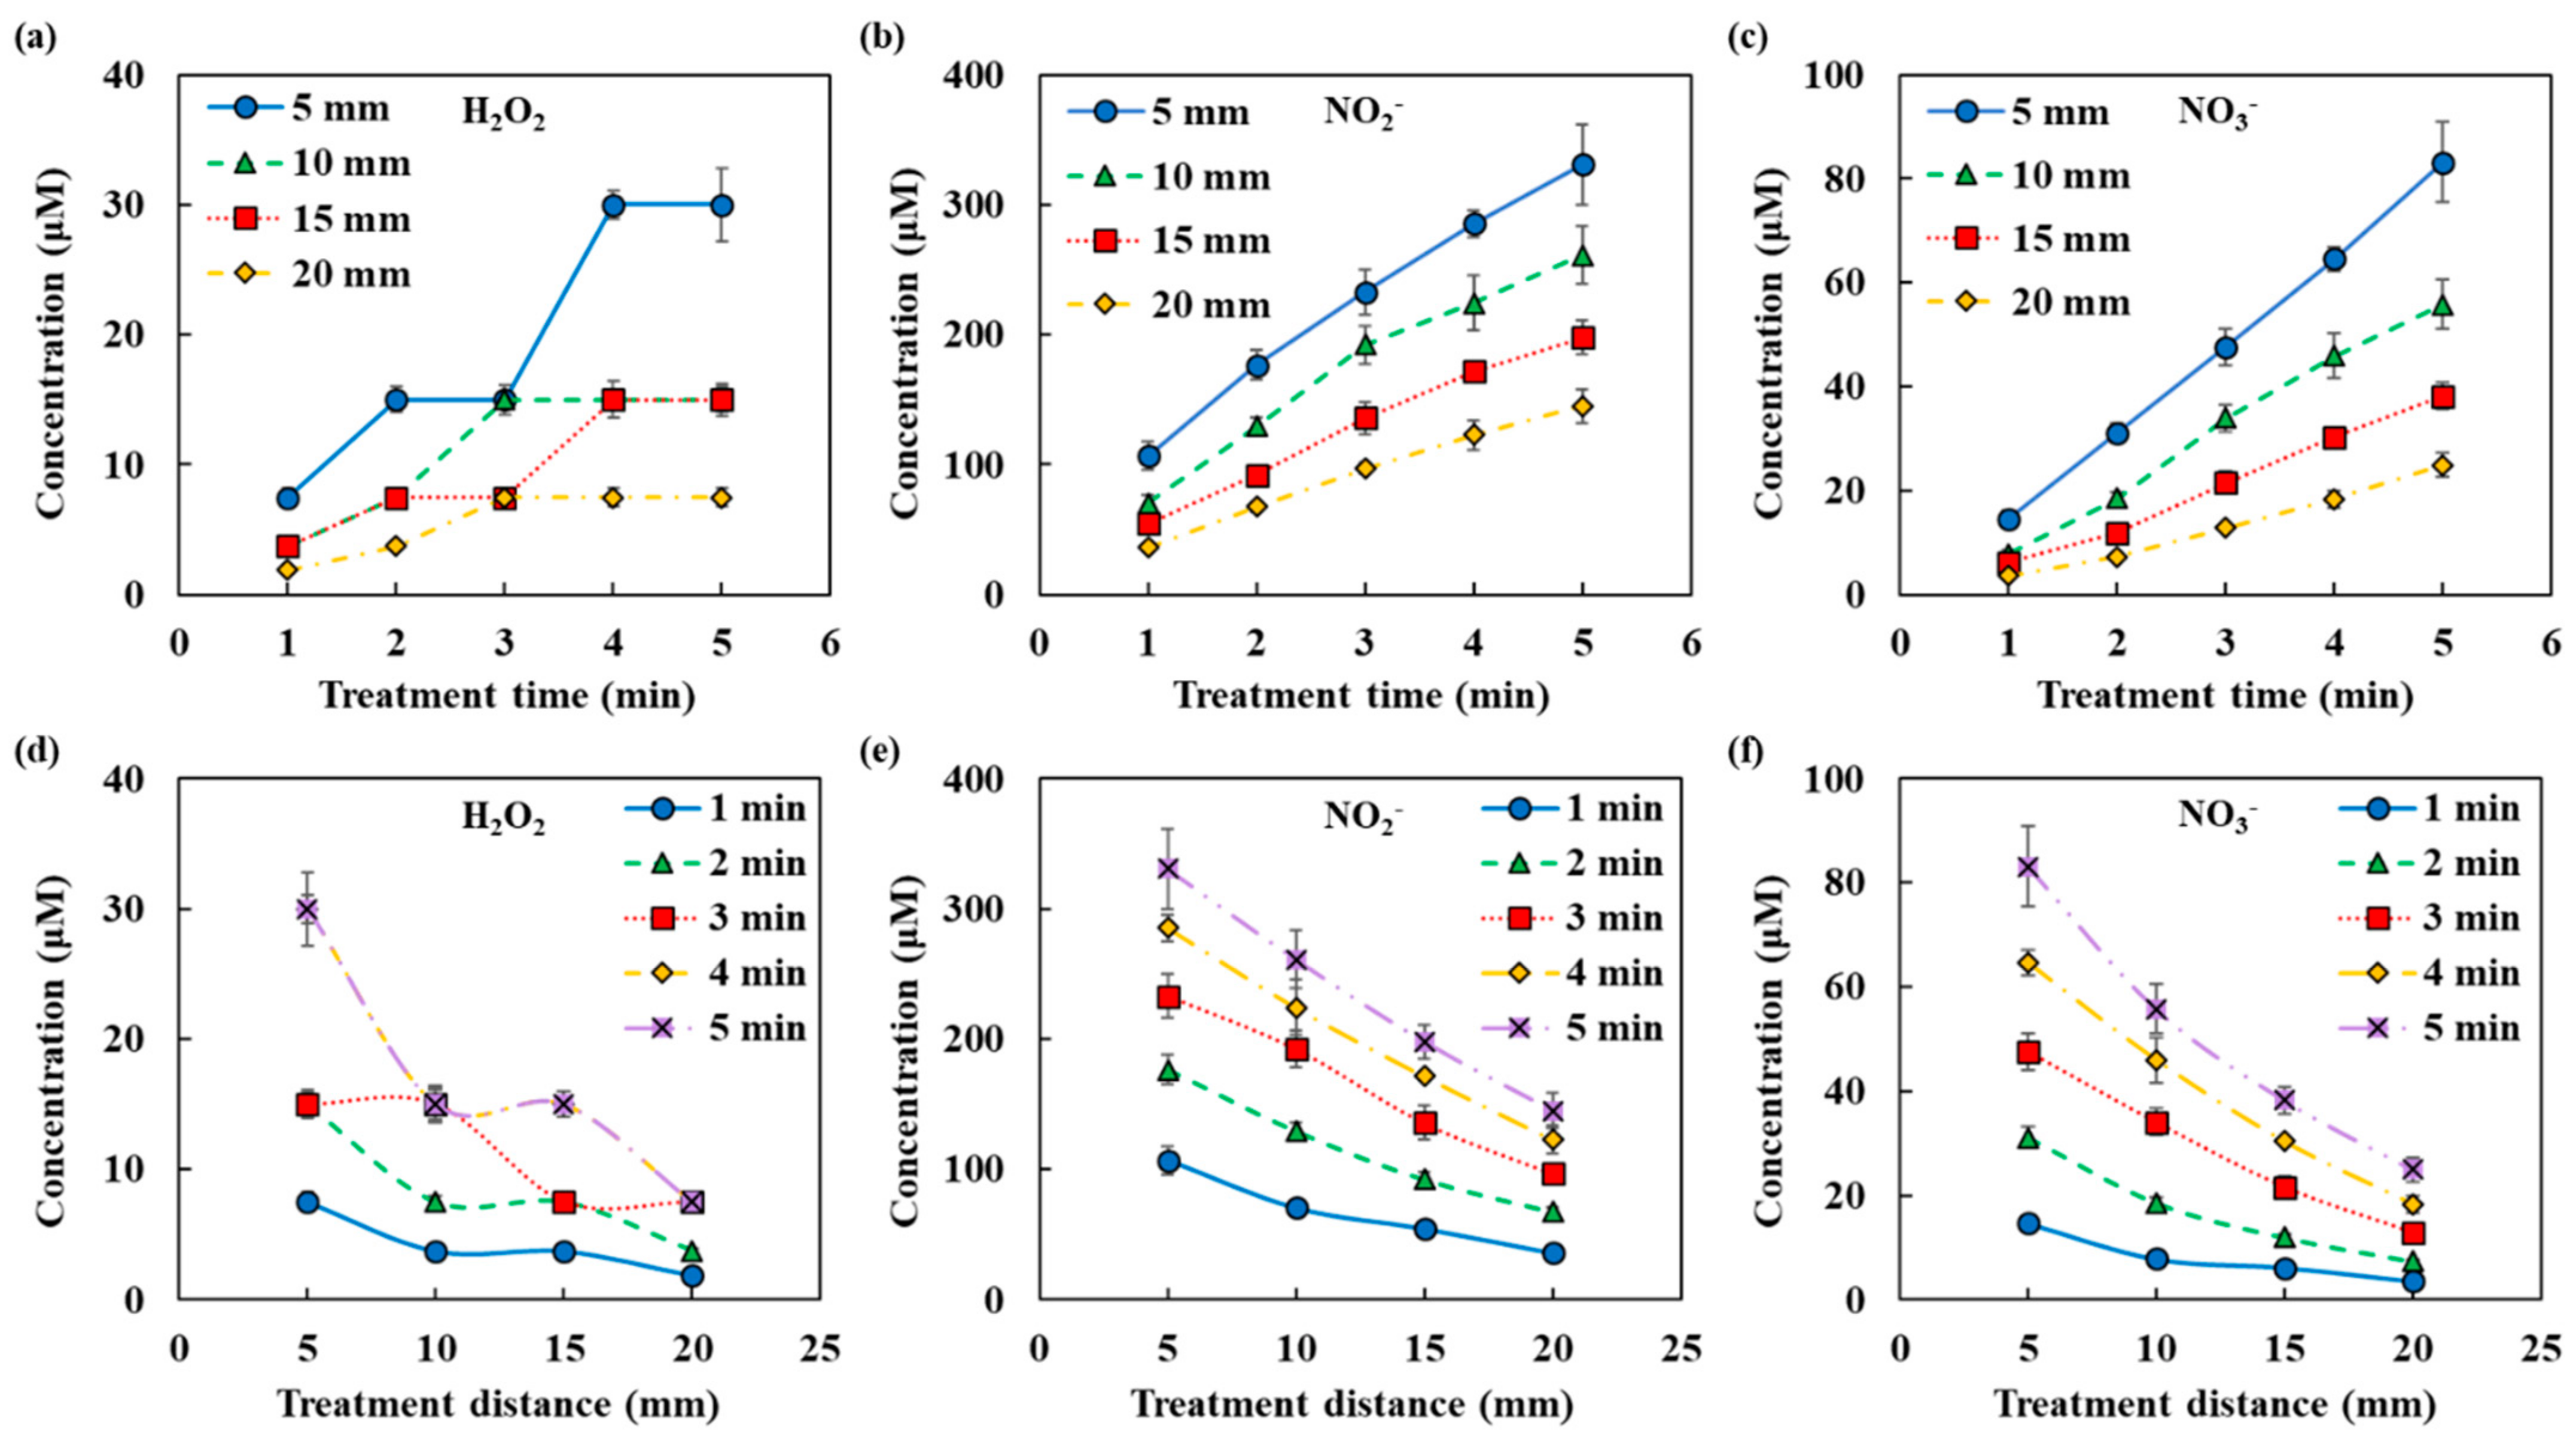
Figure 2b shows an example of a fitting of the NTAPP-treated water. The spectrum is considered as the sum of the absorbance of the respective reactive species and deconvoluted to H2O2, NO2−, and NO3−. In this example, concentrations were calculated as H2O2 344 μM, NO2− 359 μM, and NO3− 142 μM. Figure 3 shows the amounts of the reactive species in the plasma treated DI water with the change of both the distance from the plasma device and the plasma treatment time. We can confirm that the amounts of H2O2, NO2− and NO3− increased as the plasma treatment time increased but decreased as the distance increased. The non-linearity of H2O2 may be due to the low absorbance and the following high measurement limits.
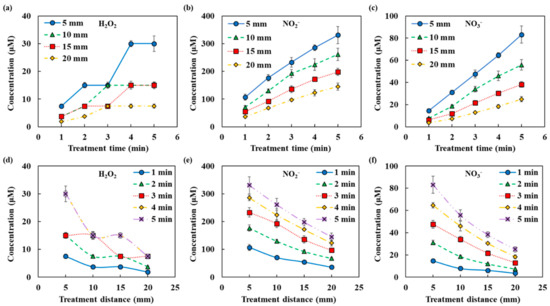
Figure 3.
RONS concentrations in NTAPP treated water according to NTAPP treatment time and distance (a,d) H2O2, (b,e) NO2−, and (c,f) NO3−. All measurements were repeated three times.
3.4. Permeation of NTAPP-Generated RONS through Agarose Gel
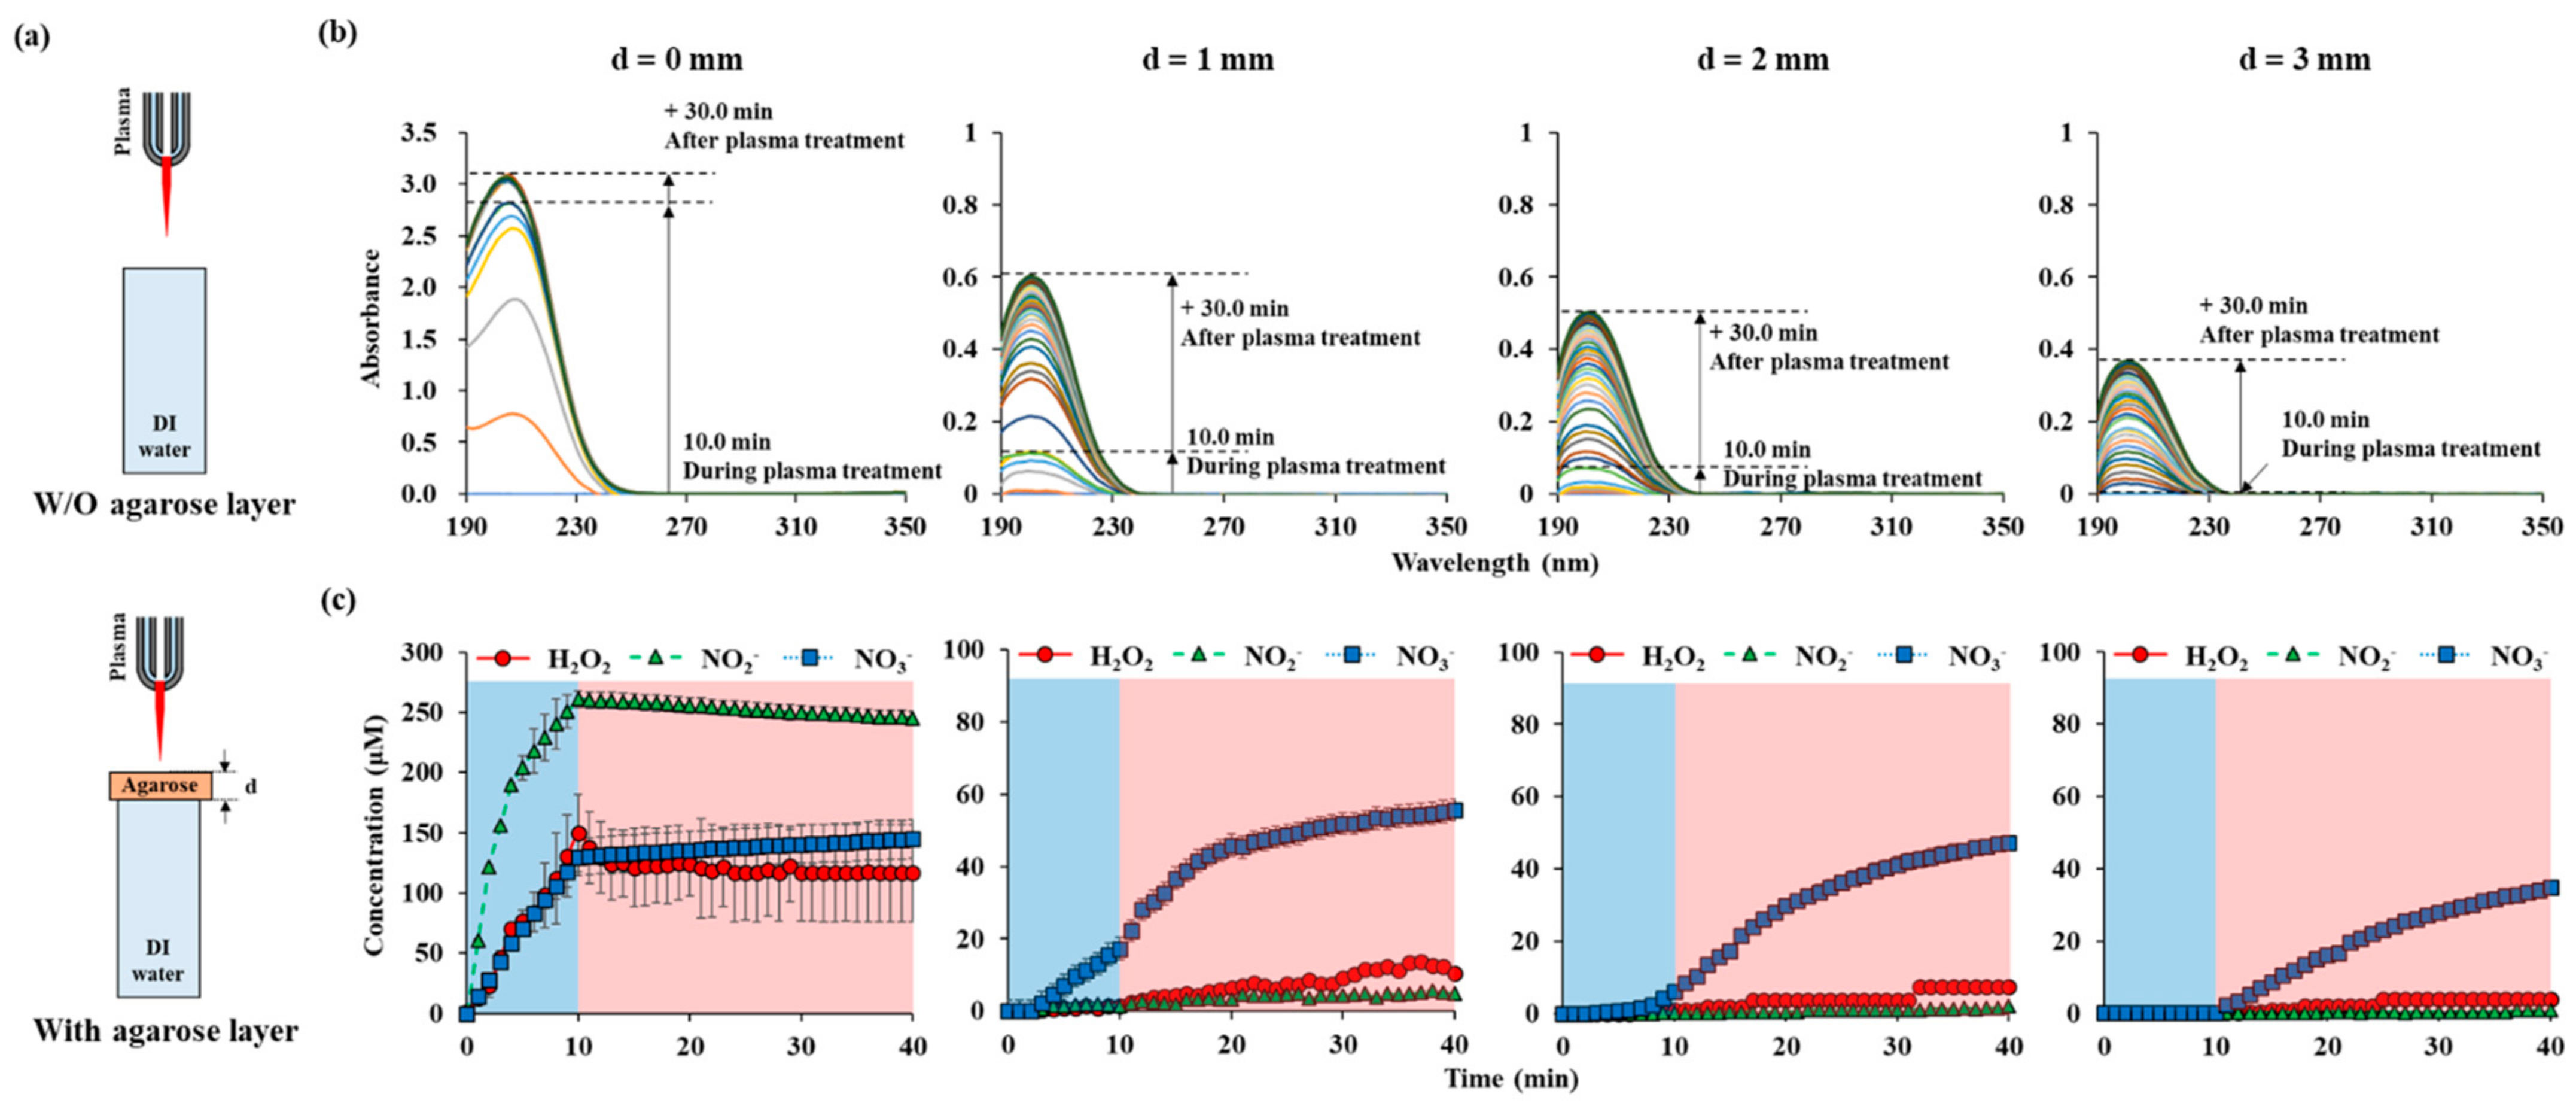
In order to investigate the effects of NTAPP applied onto the skin model, 1% agarose gel was used. The experiments were conducted according to the thickness of agarose membrane, as shown in Figure 4a. The distance between the plasma jet and the agarose membrane was kept as 15 mm, where the temperature was below 38 °C. Agarose models with thicknesses of 1, 2, and 3 mm were used. NTAPP was treated for 10 min, and the UVAS was performed at every 1 min until 30 min post-plasma treatment. Then, the agarose gel was removed, and the cuvette was quickly placed in the UV spectrometer. In the absence of agarose (d = 0 mm), the absorbance value during the plasma treatment, for 10 min, increased linearly. The calculated concentration of each RONS also increased linearly during that time. The tendency suddenly changed when plasma was off. After 10 min of plasma treatment, the concentrations of H2O2, NO2−, and NO3− were 149.8 μM, 261.0 μM, and 129.6 μM, respectively. After 40 min, the concentrations of H2O2, NO2−, and NO3− became 116.6 μM, 245.3 μM, and 144.7 μM, respectively. H2O2 and NO2− decreased and NO3− increased during the post plasma incubation time. When plasma was treated on the agarose gel membrane located on top of DI water, the absorbance reduced remarkably as shown in Figure 4b. When the membrane thickness was 1 mm, the final absorbance value was 0.6, which is 1/5 of that without the membrane. In contrast to direct plasma treatment, the absorbance continuously increased up to 30 min of the post-plasma treatment time.
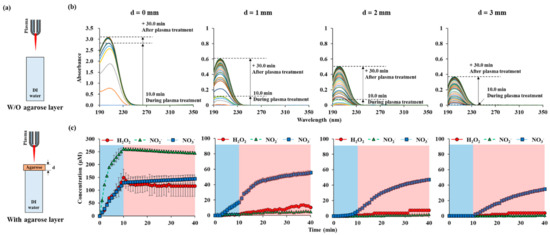
Figure 4.
RONS concentrations in water according to the thickness of agarose on top of the water: (a) drawings of NTAPP treatment on water w/and w/o agarose layer. (b) UV abs spectra of NTAPP treated water during 10 min (plasma on, blue) of NTAPP treatment and 30 min (plasma off, red) of post NTAPP treatment according to the agarose thickness from 0 to 3 mm. (c) deconvoluted graphs for 0-, 1-, 2-, and 3-mm agarose thickness for 40 min. All measurements were repeated three times.
The increase rate became higher when the plasma was turned off and became gentle again about 10 min later. The thicker the agarose gel, the gentler the slope. NO2−, which was measured in the largest amount in direct plasma treatment, was hardly measured with agarose gel. The amount of NO2− reduced from 245.3 μM to 4.8 μM with 1 mm-thickness-agarose gel after 40 min from the starting of plasma treatment. NO3− became the main permeating component, and the concentration of NO3− reduced from 144.7 μM to 50 μM, 47.2 μM, and 34.7 μM with 1 mm, 2 mm, 3 mm thickness-agarose gel after 40 min. Since it is certain that NO2− is generated from our NTAPP, it is assumed that NO2− cannot permeate the agarose gel or is converted into NO3− quickly. H2O2 was measured in an amount less than the measurement limit during plasma treatment, and gradually measured as time passed after the plasma was off. When the agarose film was 2 mm or 3 mm, H2O2 and NO2− were hardly detectable.
3.5. Effect of the Stratum Corneum Made of Lipid Extracted from Hacat Cells on the Permeability of RONS
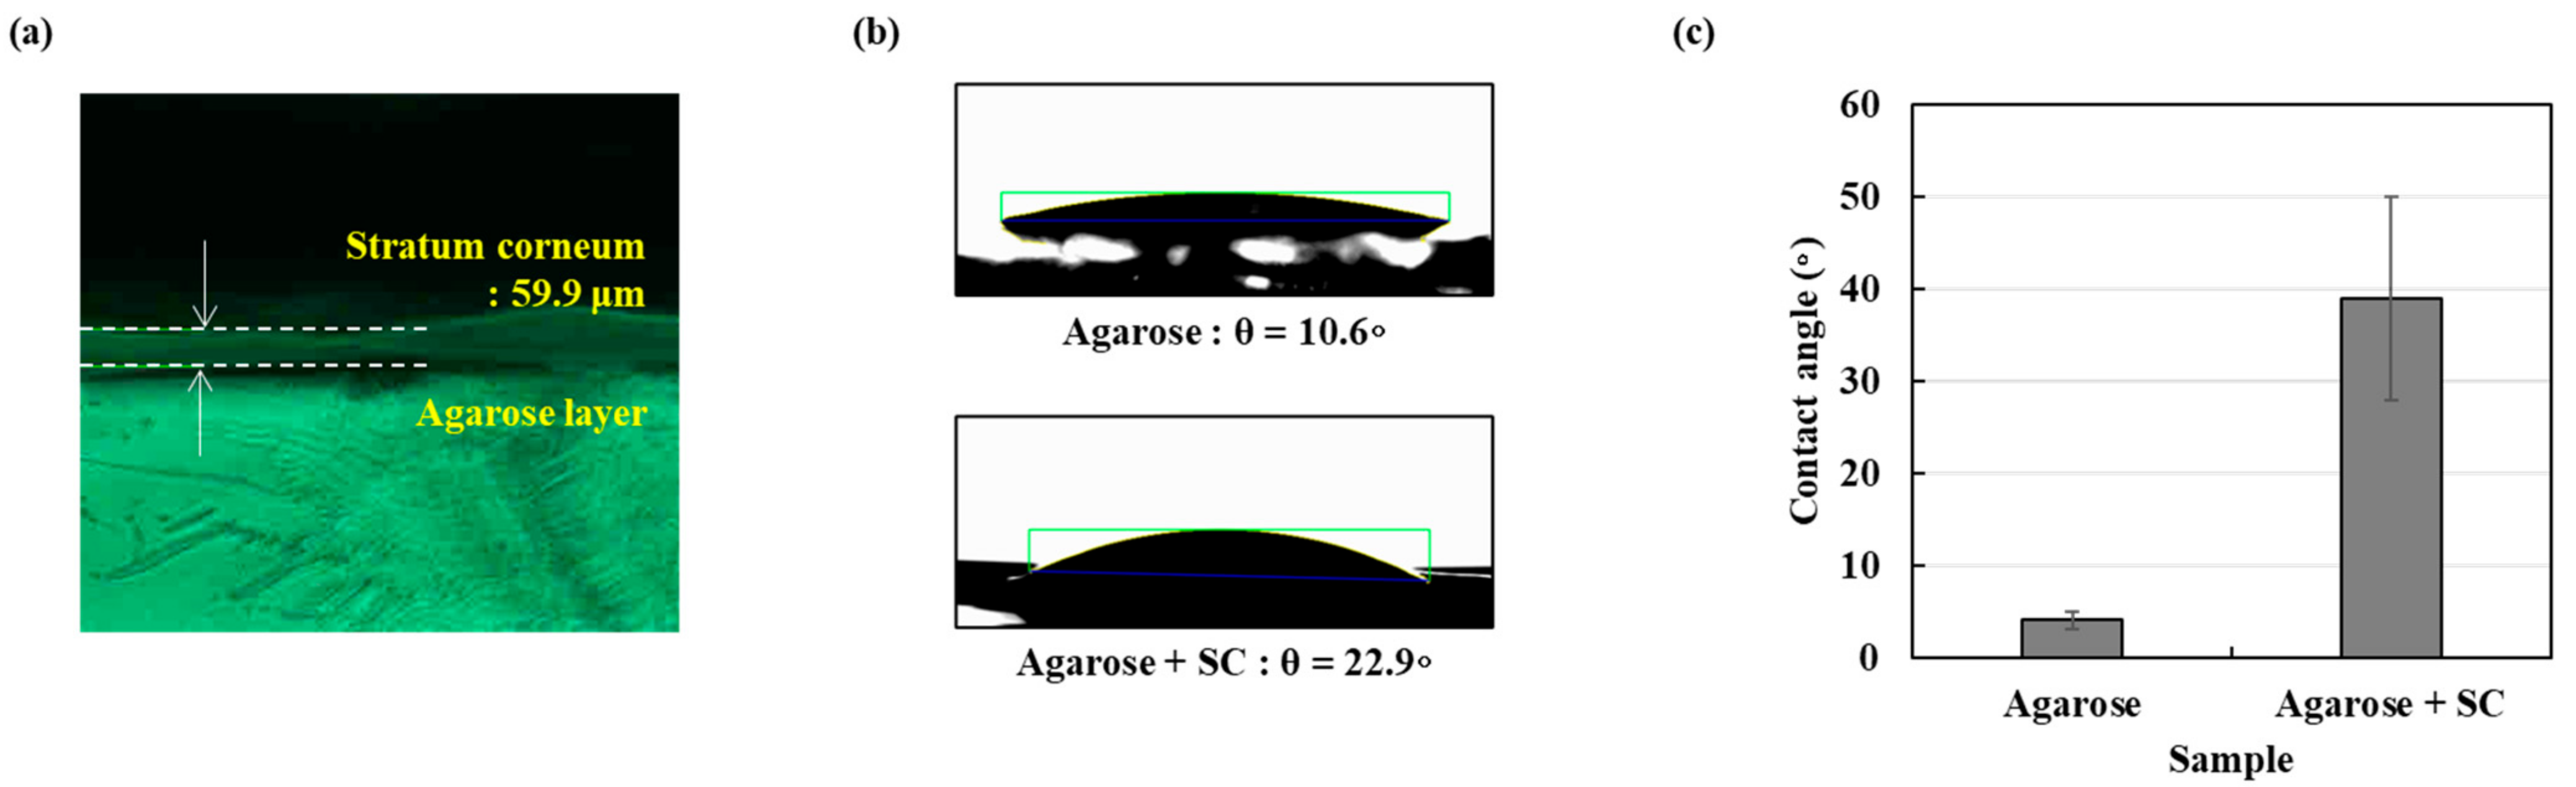
In order to investigate the effects of the stratum corneum (SC), the outermost layer of the skin, we extracted total lipids from Hacat epithelial cells. Since SC is formed from the death of these cells, we expected that the extracted lipids may have similar components to real SC. Figure 5a shows the thin film made of the extracted lipids on the agarose gel. The formation of the 59.9 μm stratum corneum on agarose gel was confirmed using microscopic measurements. We assume the lipid film as a SC barrier and agarose membrane as an epidermal layer. Figure 5b,c show the contact angle measurements with and without the lipid film. The contact angle is an important indicator that explains the wettability of a skin model. In the case of the agarose membrane, the contact angle was 10.6 ± 2.6°, and when the lipid layer was added on the agarose membrane, it was measured as 22.9 ± 2.0°.
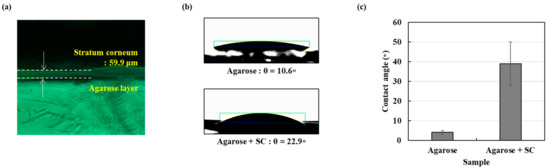
Figure 5.
The stratum corneum as a skin-like model (a) the generated agarose with SC model microscope measurement result (b) Water contact angle agarose layer and agarose with SC layer (c) graph showing water contact angle agarose and agarose with SC layer.
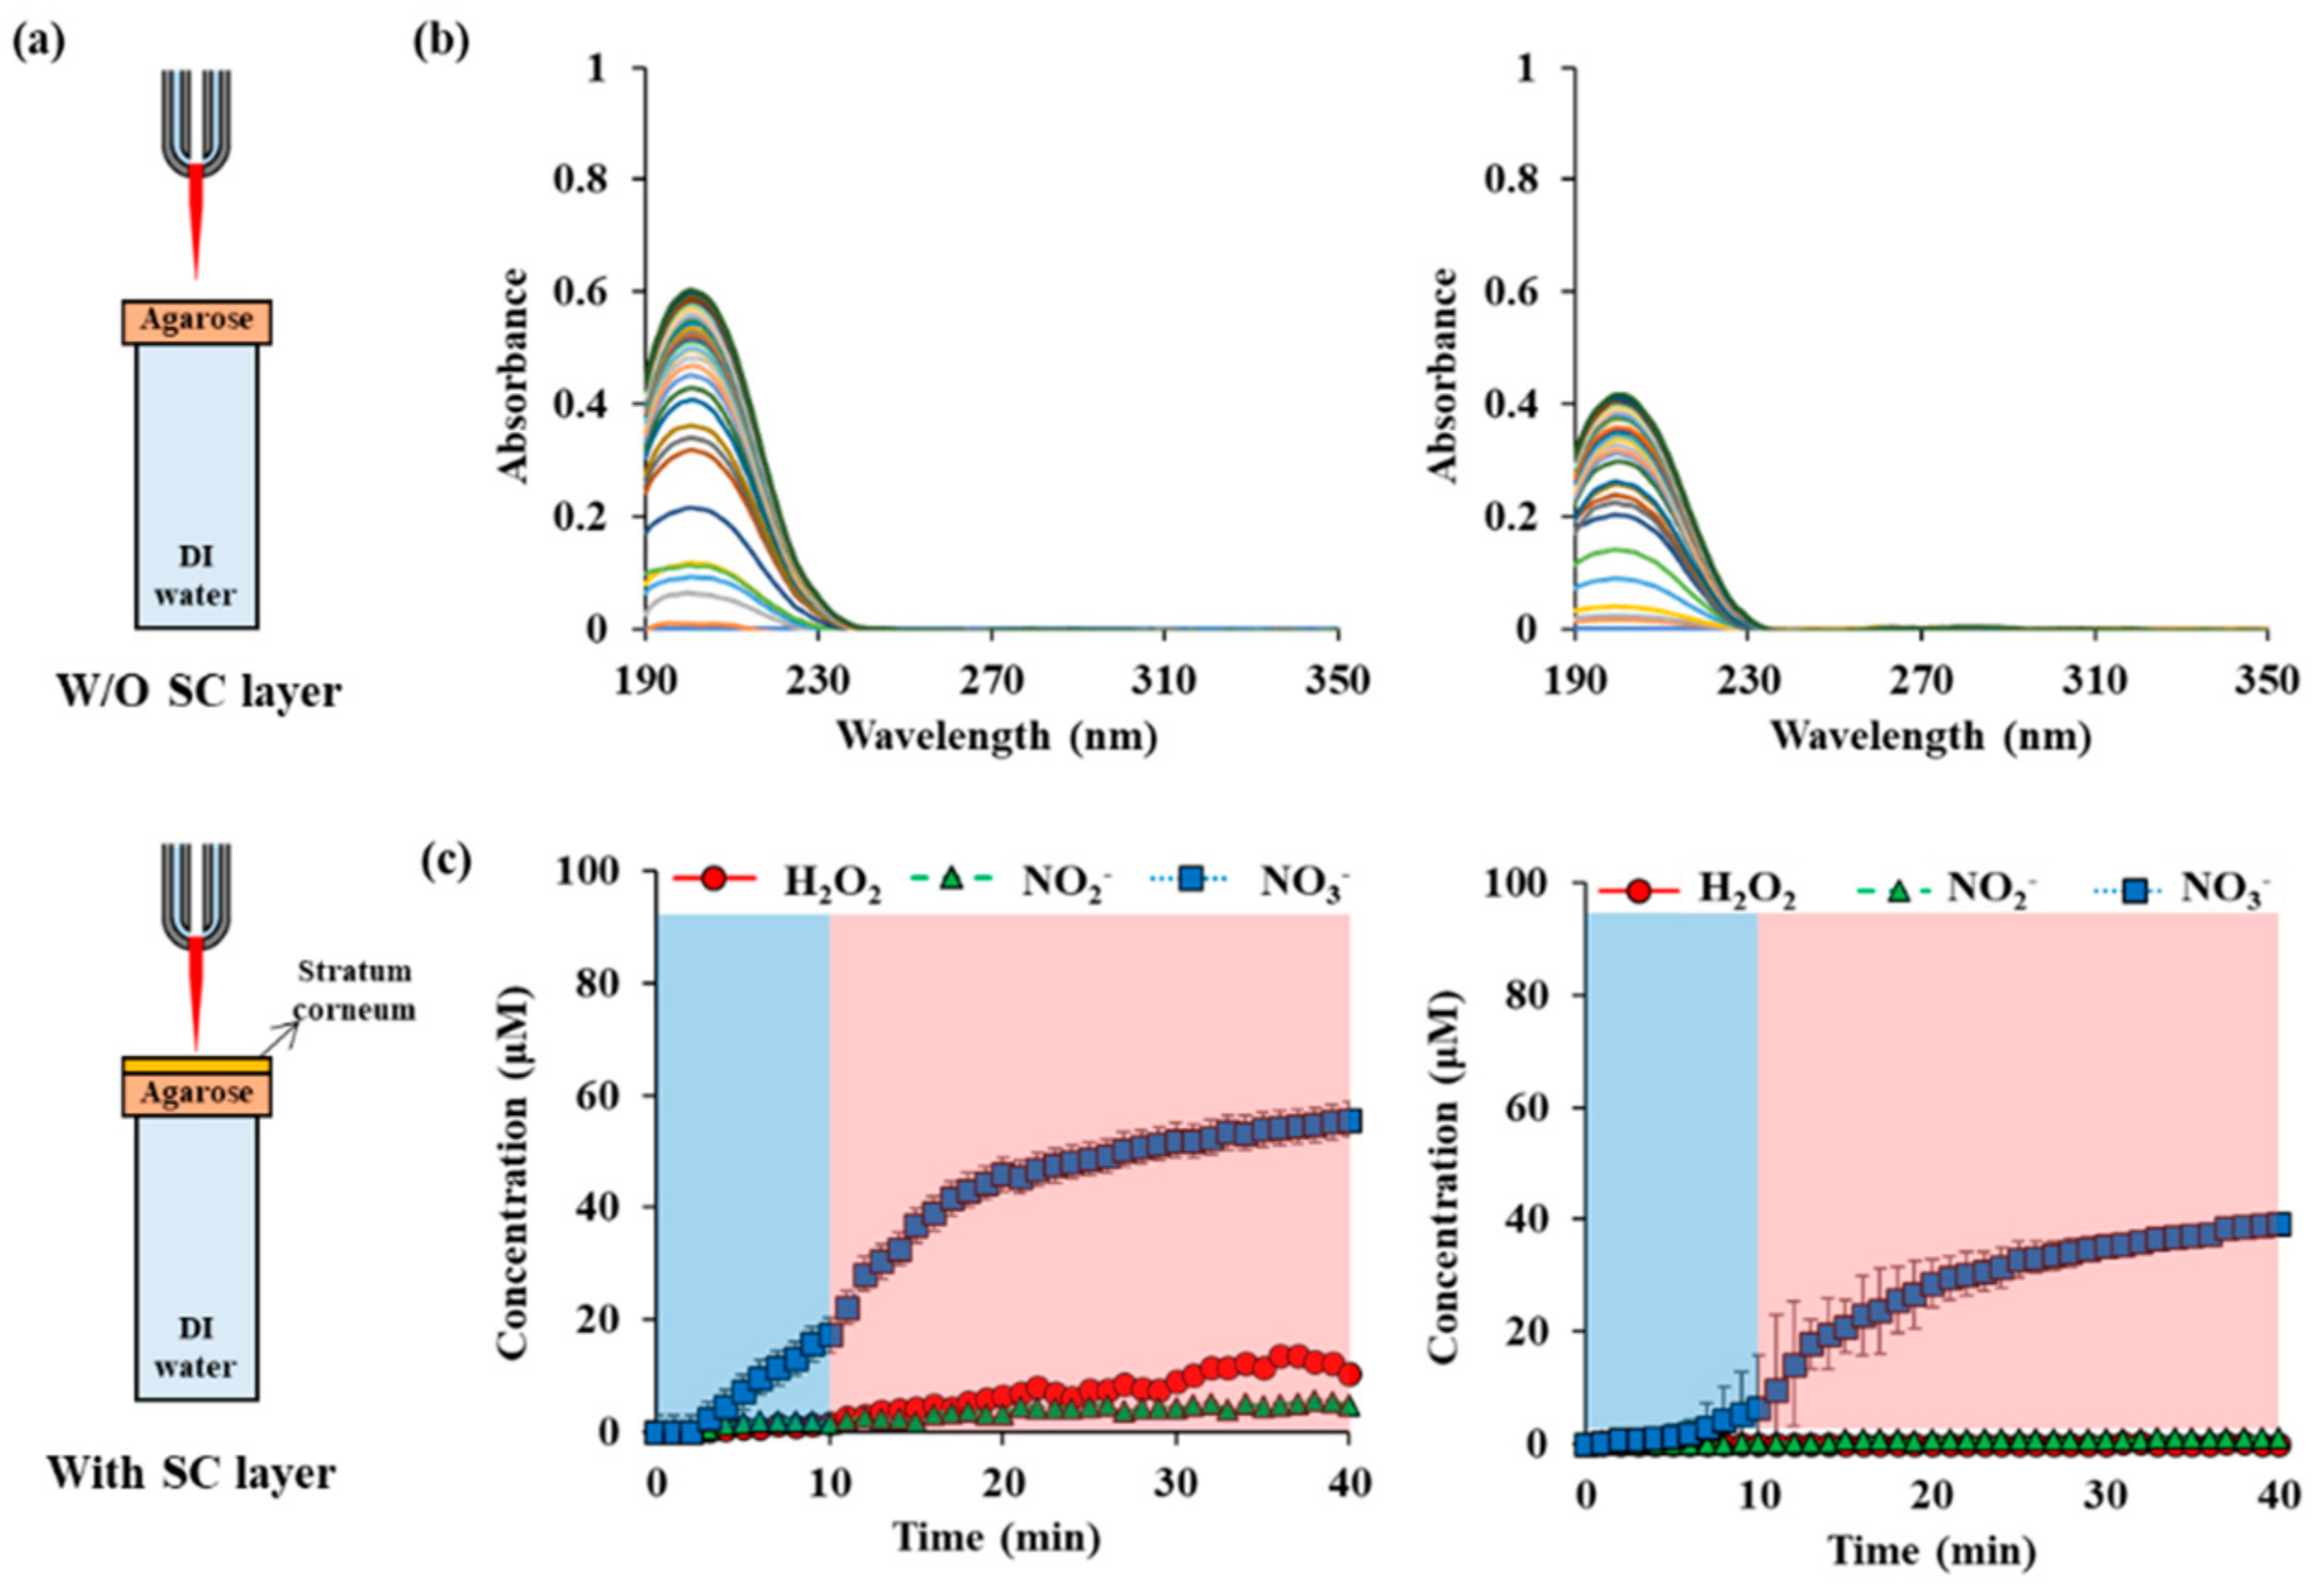
The outermost hydrophobic lipid layer affects the diffusion properties of reactive species. As shown in Figure 6a, a lipid layer did not cause abrupt changes in the permeability of reactive species. The concentration of NO3− begins to increase with a slight delay after plasma operation. The absorbance is continuously increased for 30 min after plasma operation more slowly. The final absorbance has a value of about 2/3 of that without lipid layer but including the agarose layer. In the case of H2O2 and NO2−, they were below the detection limit. In the case of NO3−, the initial delay time was even longer, and 6.5 μM was seen 10 min after the plasma started operating. After 40 min, the final treatment time, 39.3 μM, was measured.

Figure 6.
RONS concentrations in water depending on the presence or absence of the stratum corneum (SC) on the agarose membrane: (a) drawings of NTAPP treatment on agarose water w/and w/o SC layer. (b) UV abs spectra of NTAPP treated water during 10 min (plasma on, blue) of NTAPP treatment and 30 min (plasma off, red) of post NTAPP treatment according to presence of SC layer (c) deconvoluted graphs for w/and w/o SC layer for 40 min. All measurements were repeated three times.
3.6. Effect of a Pig Skin on the Permeability of RONS
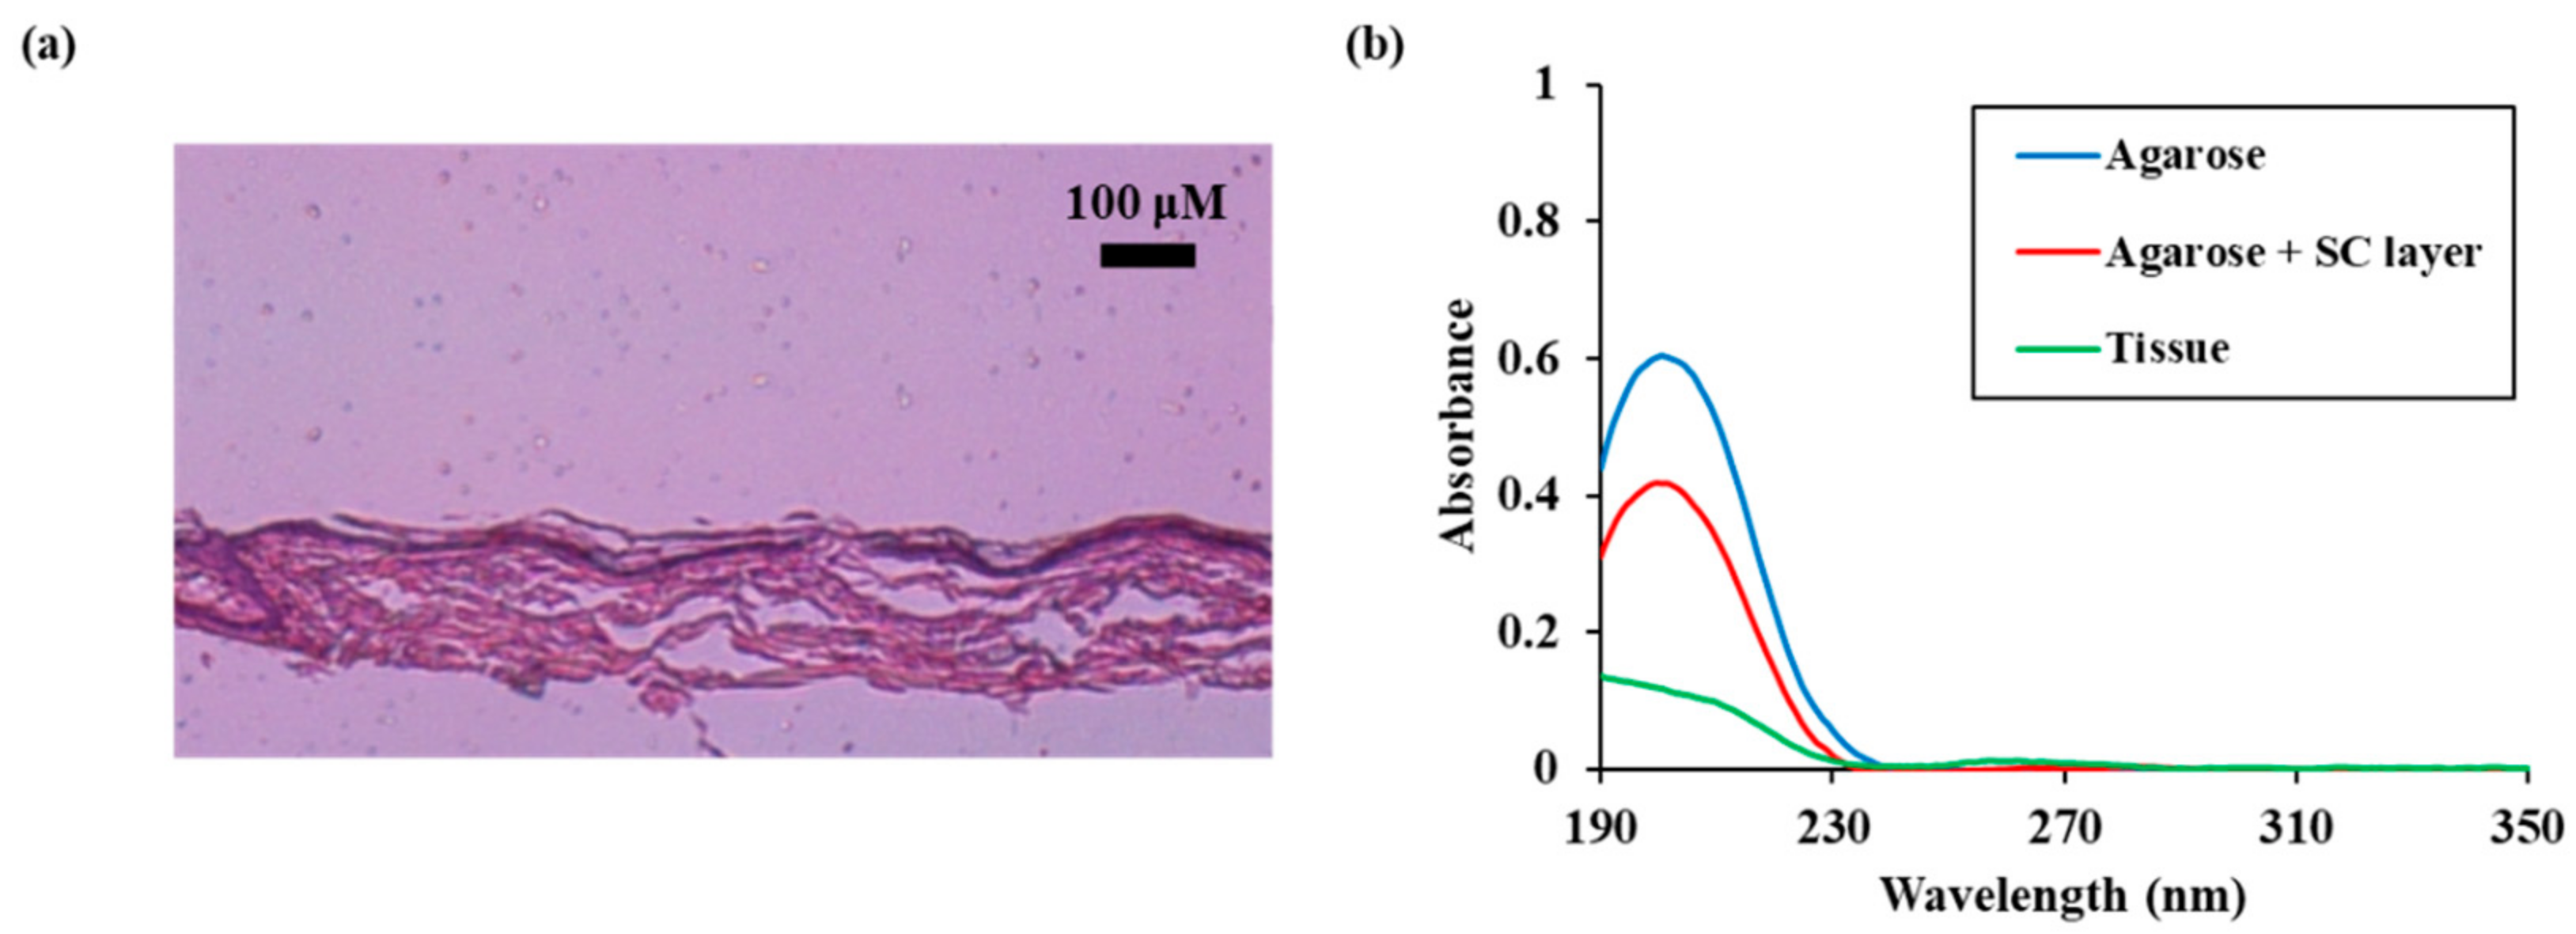
We compared the permeation characteristics of reactive species in the skin model with the added stratum corneum and the actual skin. A pig skin sample containing the stratum corneum was used as an actual skin sample. As shown in Figure 7a, a pig skin sample including a 10 μm stratum corneum and a 200 μm thick epidermal layer was placed on a 1 mm agarose membrane.
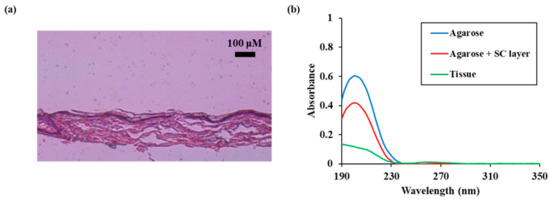
Figure 7.
Permeation characteristics of reactive species in real skin (a) Microscopic measurement result of pig skin (b) UV absorption spectra of NTAPP treated water during 10 min of NTAPP treatment and 30 min of post NTAPP treatment according to presence of agarose, agarose + SC layer, and tissue. All measurements were repeated three times.
When the pig skin model was used the absorbance was measured to be less than 0.2 because the absorbance was decreased more than when the stratum corneum model was used. Noteworthy, the absorbance at 190 nm, 260 nm, and 280 nm increased relative to the decrease in absorbance.
4. Discussion
Various types of NTAPP have been tried in skin therapy to utilize active species from atmospheric plasma [35,36,37]. The NTAPP used in this experiment was a jet-type with a weak gas flow rate, and it was adjusted until suitable for skin treatment. The discharge conditions were adjusted to ensure continuous and stable RONS generation in the air gas flow [38]. The prominent peaks in the OES in Figure 1c were the second positive system N2 (C-B) and the first positive system N2 (B-A) in the near UV region. The atomic oxygen emission line ( was measured at 777 nm. The NO-β and NO-γ systems were also weakly detected. This OES shows that nitrogen and oxygen molecules from air are supplied with enough electrons from the plasma to form reactive species [15,39].
The distance to the sample and flow rate of air gas were adjusted for the adequate heat that the sample receives. Under the conditions of 1.5 lpm and 15 mm used in the skin model, the sample temperature was measured as 37.7 °C. This is a state below the standard value of 41 °C (applied part having contact with the patient) of IEC 60601-1 [40]. The leakage current was measured as 0.002 mA. In this condition, plasma can be treated without any electric shocks to the target object and without electroporation [41]. Therefore, the plasma treatment will be painless for the patients. In this condition, the distance from the plasma plume was about 7 mm or more to reach the sample. Therefore, it can be assumed that the reactive species’ effect is the main effect in NTAPP skin treatment.
In our experiment, the overall concentration of RONS decreases because the amounts of RONS reaching the sample decreases as the plasma treatment distance increases (Figure 3). For each reactive species, the primary reaction of H2O2 generation is the interaction between OH radical molecules. As the plasma treatment distance increases, the number of electrons colliding with the water surface decreases, resulting in a reduction of the OH radical generation rate. Also, the photolysis effect due to the decline in UV intensity is reduced under the contact distance between the water surface and the plume, and the OH radical concentration decreases. As a result, the concentration of short-lived species decreases as the plasma treatment distance increases are measured only in the interface region and cannot be reached with the bulk liquid [42]. In the case of long-lived active species, they are mainly produced and accumulated at the liquid interface and finally transferred to the liquid bulk region by diffusion [17,18,43]. H2O2, NO2−, and NO3− measured in this experiment, they are formed and destroyed by the reactions summarized in Table 1. H2O2 is affected by Equations (1)–(5), NO2− is Equations (6)–(9), and NO3− is Equations (10)–(14).

Table 1.
Chemical reactions used for theoretical approaches in this study.
We used an agarose gel as a human tissue to study the barrier effect on RONS from plasma. As shown in Figure 4, the absorbance immediately increased during the plasma treatment time of 10 min in the absence of the agarose film. After the plasma was turned off, RONS was no longer generated, and the absorbance was maintained constant. In the case of plasma exposure through agarose, there is little change in absorbance during the plasma treatment time. After the plasma was turned-off, the absorbance showed a steady increase, and this tendency was maintained for a measurement time of 40 min. The thicker or the denser the agarose gel was, the longer RONS took to reach in DI water (Figure 4 and Figure A3). This was also observed in previous UVAS studies using agarose gels [23,24]. However, the differential changes of each RONS with time were analyzed first in this study.
Interestingly, the agarose gel barrier effect was different for the three RONSs, which could be attributed to the RONS-integrated chemical reaction occurring in the agarose gel. Reactive species accumulate at the agarose interface and are transferred through agarose by diffusion. We observed that each RONS has different diffusion rate by chemicals (Figure A3 and Figure A4). NO3− has the highest diffusion rate, and H2O2 has the lowest rate. However, it could not explain the significant reduction in NO2− through an agarose gel. During the slow diffusion process, NO2− at the interface between agarose and air has a high possibility of oxidation to NO3− by reactive species such as OH radicals and ozone generated from the plasma. Since agarose gels are rich in moisture, reactions with hydroxyl radical may be frequent (chemical reactions proposed in Table 1). These reactions may explain why the nitrite reduction is more substantial than H2O2 and nitrate. We tried to confirm that these reduction processes are caused by plasma-induced radicals. We mixed chemicals containing NO2− and H2O2 and measured their diffusions through an agarose gel without plasma treatment (Figure A5). The NO2− values were identical with three different concentrations of H2O2. A small amount of nitrate was observed with a high amount of H2O2. However, the concentration was almost in detection limit. Without plasma treatment, the conversion of nitrite to nitrate was not observed. Only three species were studied in this study, but it should be considered that barrier effects for some other species may have different trends [44,45].
In the case of additional SC layer in Figure 6, it is shown that the SC layer can block even the RONS with a long lifetime. H2O2 was found to be below the detection limit when SC was added. H2O2 is produced from OH radicals, and moisture is the primary variable in its formation. H2O2 reduction is induced because the SC layer blocks the interaction between plasma and water molecules. NO2− and NO3− have high hydration free energy and difficulty passing through the cell membrane due to absorption by the lipid head [46,47]. As a result, the absorption reduction under the condition of the addition of the SC layer is due to the decrease in all three reactive species H2O2, NO2−, and NO3−. The detection of NO3− can predict the reduction of the SC layer’s penetration barrier by plasma treatment and hydrophilization by plasma treatment [5,48]. When using a real pig skin model, it is noteworthy that the overall absorbance decreases but the absorbance increases at 190 nm, 260 nm, and 280 nm. This measurement result can be considered the influence of nucleic acids having maximum absorption wavelengths at 260 nm and proteins with maximum absorption wavelengths at 190 nm and 280 nm. It is possible to consider that nucleic acids and proteins contained in skin diffuse together with active species during plasma treatment and are measured [49]. As a result, it is shown that the complexity of the actual skin can further reduce the permeation and diffusion tendency of reactive species.
A recent publication by Oliveira et al., stated that nitrated membranes appear to be more permeable to hydrophilic RONS than native and peroxidized membranes [50]. They also found by applying computer simulations that hydrophilic RONS like HO2 and ONOOH are more prone to penetrate into nitrated membranes—which was not the case for hydrogen peroxide (H2O2) and hydroxyl radicals (OH). This study also reveals that hydrophobic RONS like molecular oxygen, nitrogen dioxide (NO2) and nitric oxide (NO) even have insignificant barriers for permeation. This further supports our findings. Based on these findings clinical trials should be performed in order to support the data with results from patient data. This might help to understand why plasma treatment is increasing skin microcirculation, and therefore supports wound healing in patients with chronic wounds.
We were able to confirm the effect of agarose gel and SC model on RONS diffusion in real time using the UVAS method. This method has the advantage of being able to check the diffusion of RONS in real time and has the advantage that there is no interference with changes in pH. We tried to verify the UVAS method by chemical assays, but fluctuations according to the pH change had a very strong effect on the chemical measurement. There is a disadvantage also. RONS cannot be accurately distinguished when other salt components are included. The absorption spectrum overlaps with that of salts such as chloride. This method is thought to be helpful for kinetic studies that require real-time measurement.
Applying agarose gels is a well-known way to investigate diffusion properties since the water content and density can be adjusted to mimic the properties of skin [22,26], however, it does not completely mimic human skin, since the lipid layer or even the dead cells of the stratum corneum are missing. Therefore, we added a lipid layer isolated from a human skin cell line (HaCaT) in order to investigate the penetration and diffusion of different plasma components through such a more skin related barrier. This is in good accordance with the findings of Oliveira et al.—they showed by computer simulations the effects in nitrated membranes, with similar tendencies. Adding a lipid layer to an agarose gel might be one further step to mimic real skin. However, the hydrophobicity was much lower than real SC. So, we tried mixing pure lipid components similarly to SC. However, it was difficult to physically manipulate the lipid film on the hydrophilic surface since it was not strongly combined. The actual SC has a very hydrophobic structure due to molecular crosslinking structures like bricks. Reports state that the properties of SC vary greatly according to the animal considered [51,52]. A next step might be to cultivate human cells directly on agarose—e.g., Hacat cells in a multi-layer. However, such a cultivation is very complicated and time consuming—and ultimately would still not depict real skin, since it would lack fibroblasts, immune cells and melanocytes. Adding cells to such a complex model would also add more complex interactions—especially since those cells will introduce a variety of antioxidants and ROS-degrading enzymes—counteracting any attempt to investigate the penetration and diffusion of RONS generated by a NTAPP. Furthermore, the more layers of cells or lipids a model contains the less effects based on UV or heat radiation will be observed, further minimizing the possible reactions which occur on wet surfaces such as agarose or exudate from wounds.
5. Conclusions
The penetration of RONS generated by the NTAPP jet was analyzed by measuring long-lived reactive species like H2O2, NO2− and NO3− by UV absorption spectroscopy. A delay of RONS delivery occurs when an agarose gel is used, and the RONS concentration increases steadily even 30 min after plasma treatment. In addition, the ratio between RONS has also changed significantly. Nitrite was hardly detected below the agarose gel. These changes may be due to the interactions between reactive species during delayed transmittance. When an outermost layer of skin SC was added, the transmittance was further reduced. Such a skin model could be a good way to study the penetration depth and diffusion properties of plasma-derived RONS in the skin.
Author Contributions
S.H.K. and K.Y.B. conceived and designed the experiments, analyzed the data, and wrote the manuscript. S.H.K. performed the experiments and research. E.H.C. and K.M. gave advice and guidelines in the plasma device and its skin applications. All authors have read and agreed to the published version of the manuscript.
Funding
This research was supported by the Leading Foreign Research Institute Recruitment Program through the National Research Foundation of Korea (NRF) funded by the Korea government (MSIP) (NRF-2016K1A4A3914113), by the MSIT(Ministry of Science and ICT), Korea, under the ITRC(Information Technology Research Center) support program(IITP-2020-0-01846) supervised by the IITP(Institute of Information & Communications Technology Planning & Evaluation), and by the Research Grant of Kwangwoon University in 2018.
Conflicts of Interest
The authors declare no conflict of interest.
Appendix A
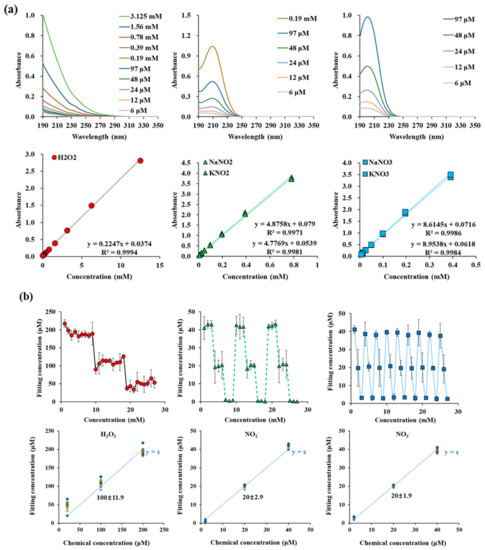
Figure A1.
(a) UV absorption spectra of H2O2, NO2−, and NO3− in the range of 190 nm and 350 nm. (b) Fitting concentration of H2O2, NO2−, and NO3− in H2O2 + NaNO2 + NaNO3 mixed sample. And RONS curve fitting method accuracy verifications.
Figure A1.
(a) UV absorption spectra of H2O2, NO2−, and NO3− in the range of 190 nm and 350 nm. (b) Fitting concentration of H2O2, NO2−, and NO3− in H2O2 + NaNO2 + NaNO3 mixed sample. And RONS curve fitting method accuracy verifications.
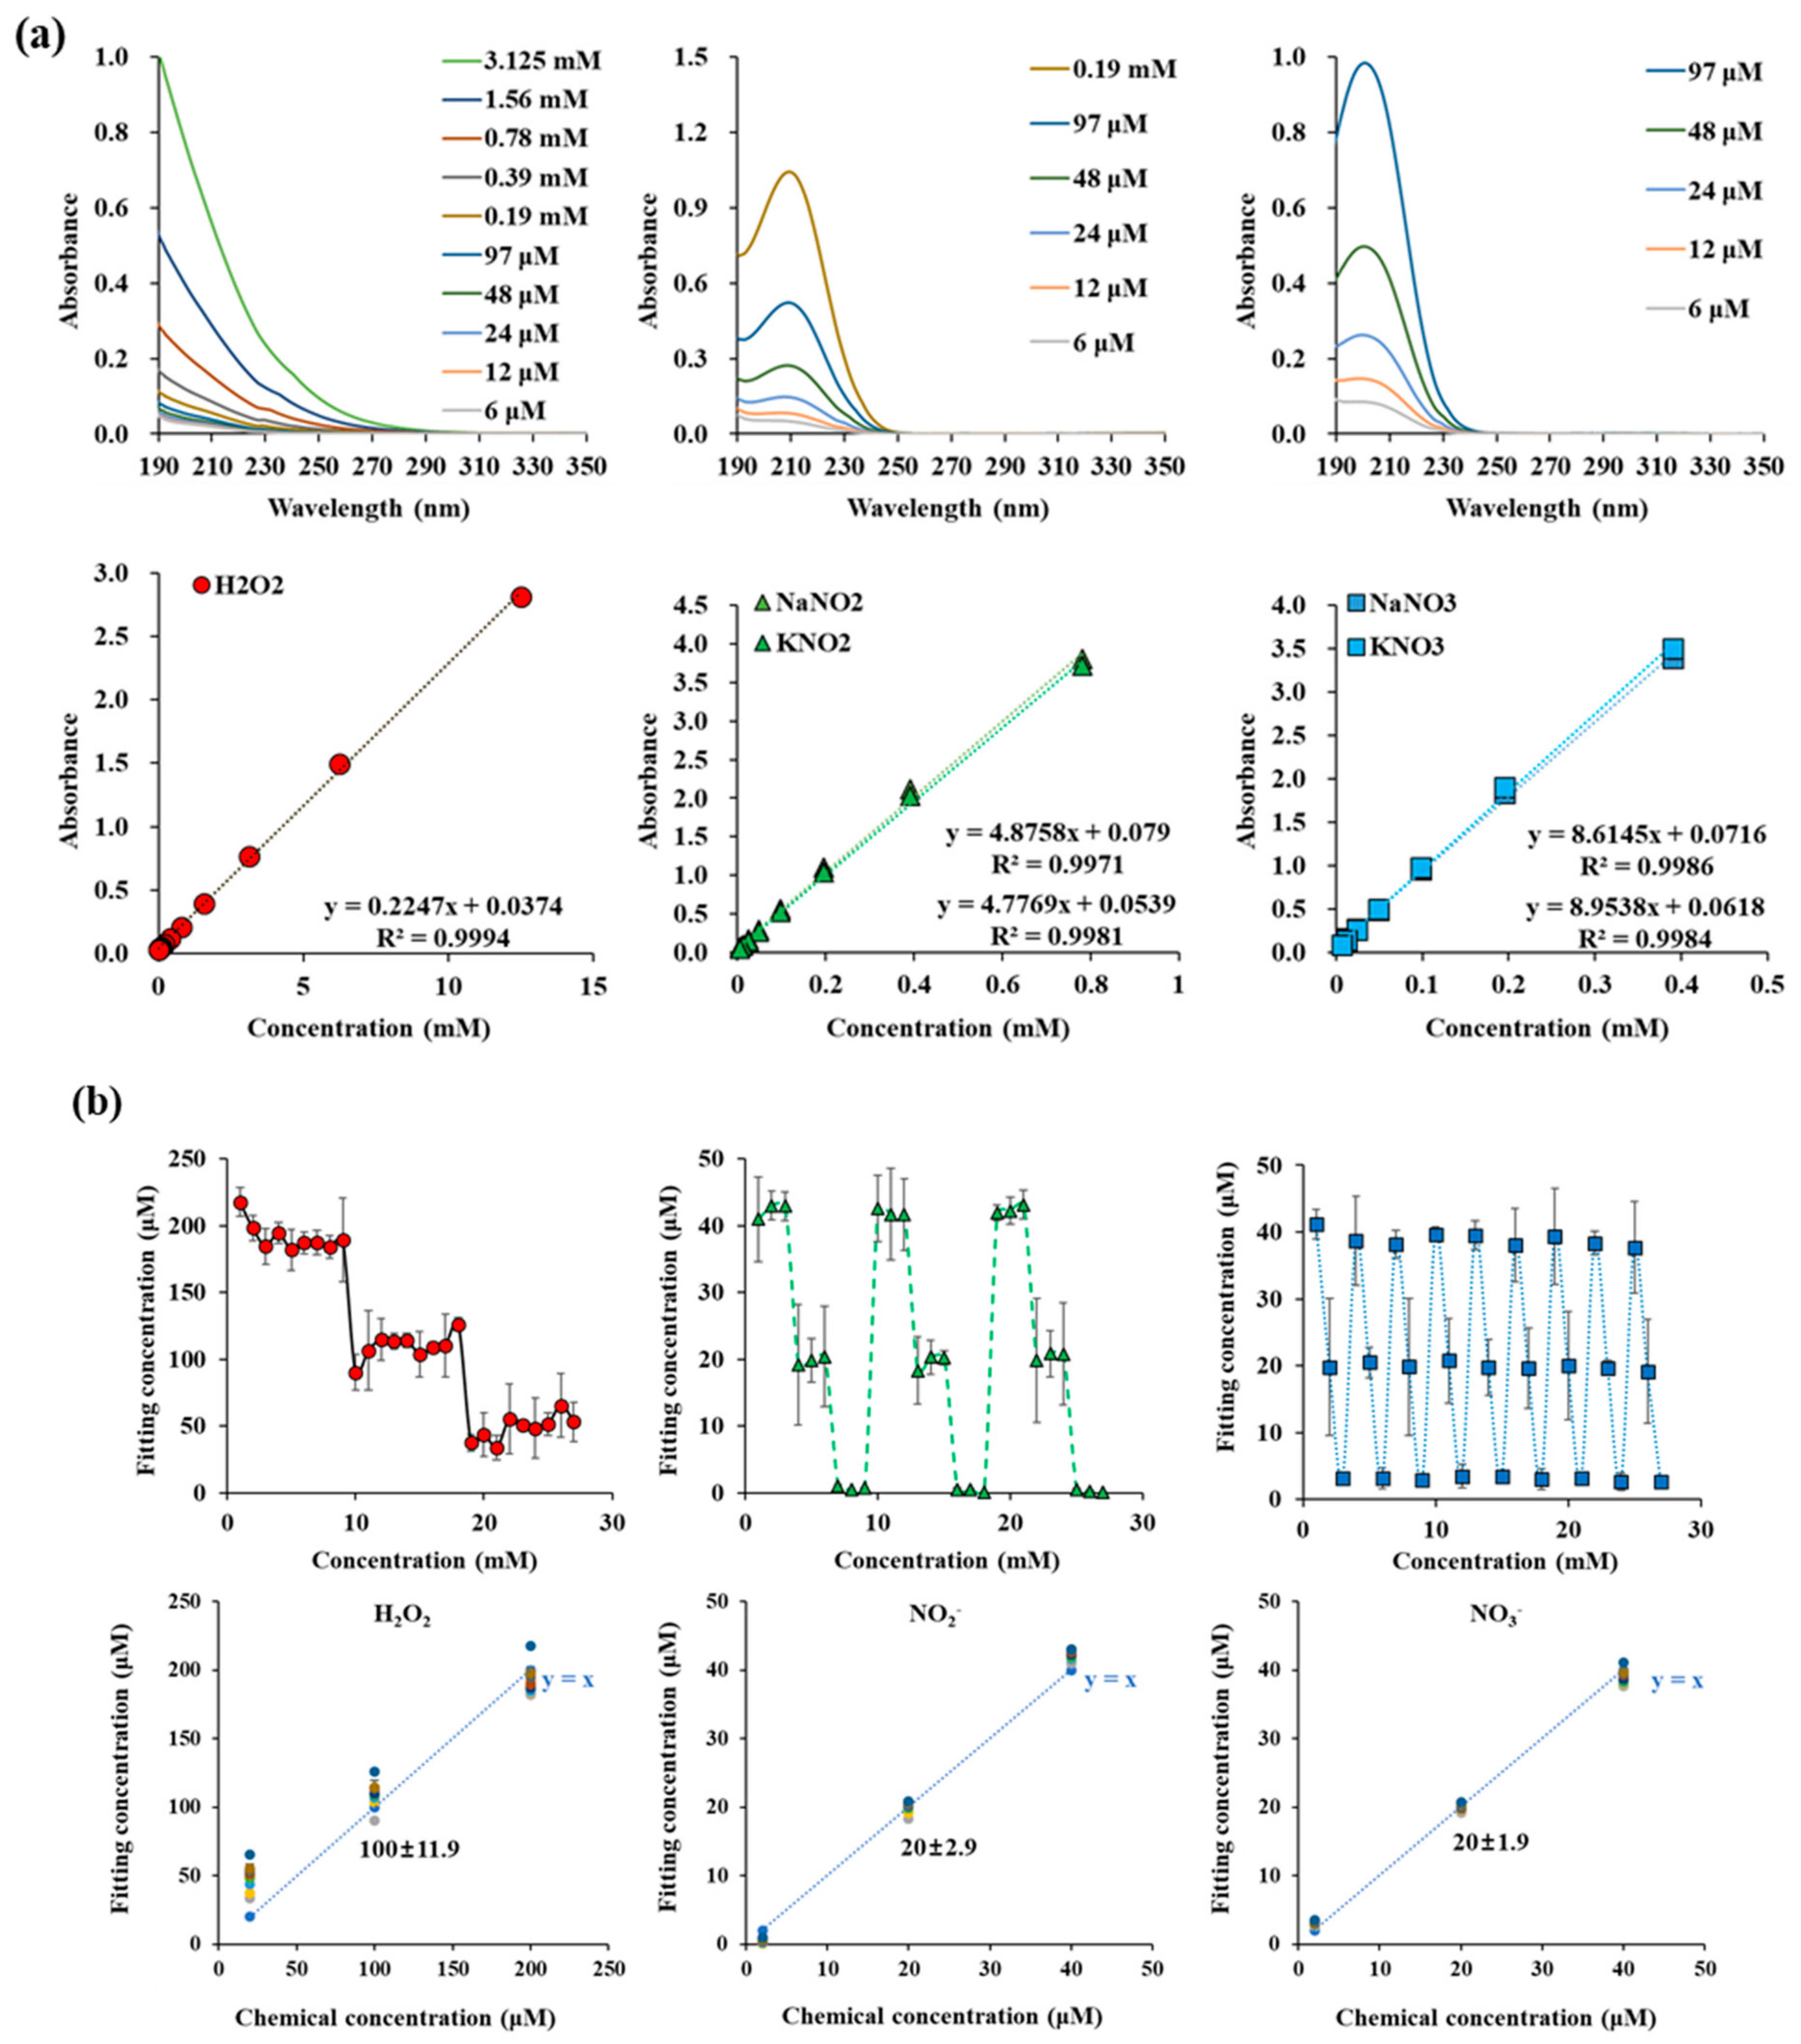
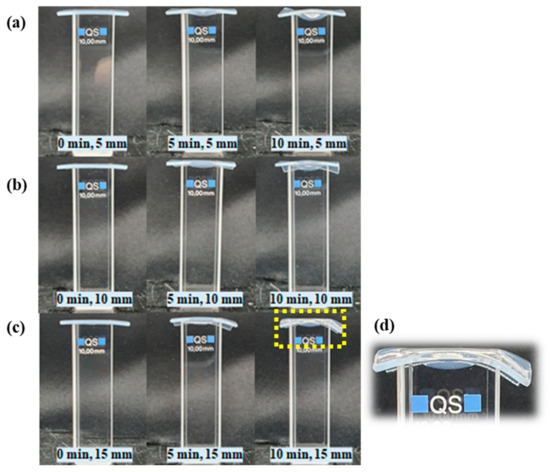
Figure A2.
The pictures show cuvettes filled with DI water and covered with 1 mm agarose gel during NTAPP treatment for 10 min when distance between the device and the sample was 5 mm (a), 10 mm (b), and 15 mm (c), respectively. The area pointed with yellow dashed line was enlarged in (d). The agarose was deformed in all distances when NTAPP exposed for 10 min. However, the gas flow did not cause a loss of sealing between the cuvetted and the agarose gel film.

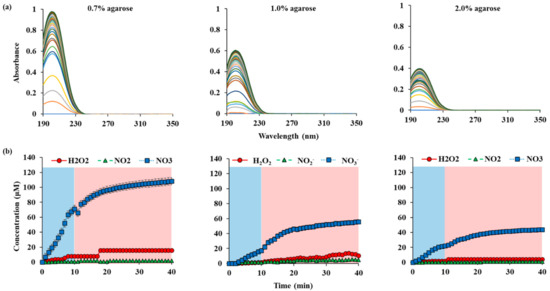
Figure A3.
RONS concentrations in water according to the thickness of agarose on top of the water: (a) UV abs spectra of NTAPP treated water during 10 min (plasma on, blue) of NTAPP treatment and 30 min (plasma off, red) of post NTAPP treatment according to the agarose concentration 0.7%, 1.0% and 2.0%. (b) deconvoluted graphs for 0.7%, 1.0% and 2.0% agarose concentration for 40 min. All measurements were repeated three times.
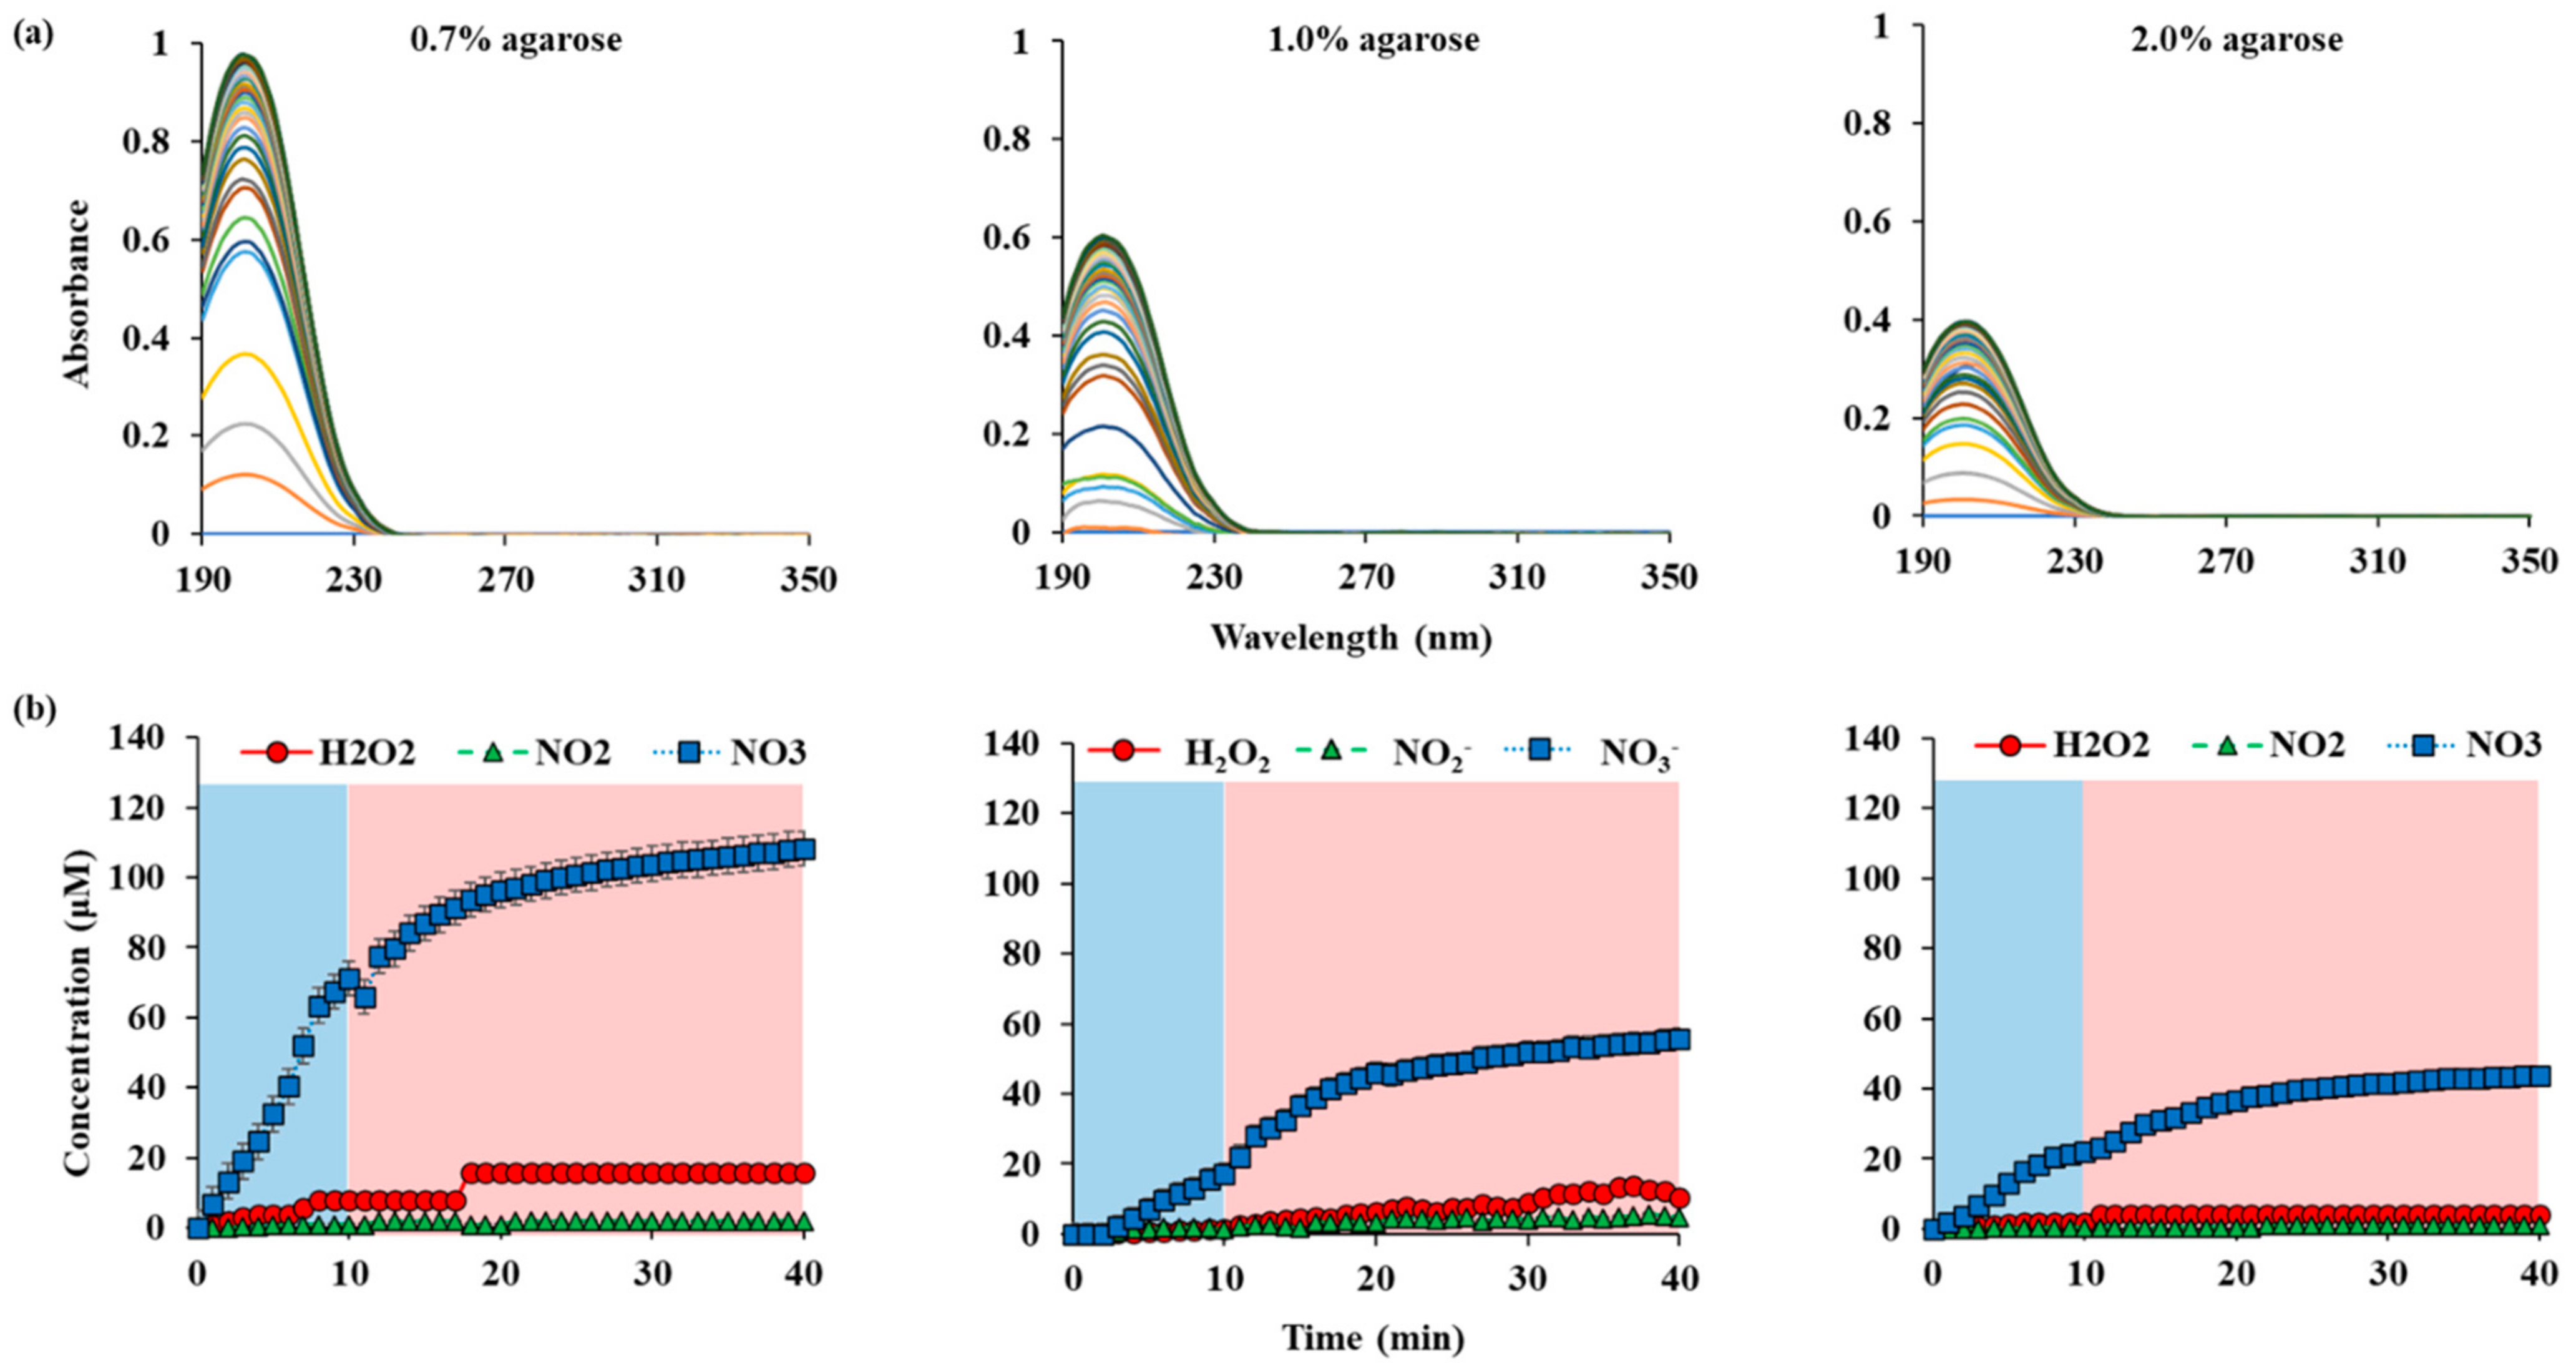
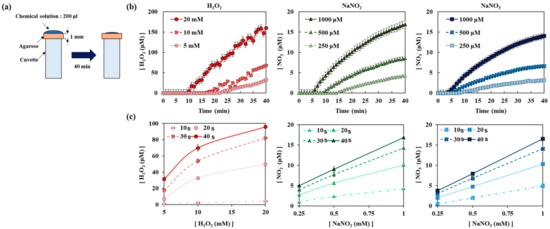
Figure A4.
Diffusion of chemicals including H2O2, NaNO2, and NaNO3 through agarose layer: (a) a schematic drawing of the experiment, (b) diffusion of each chemical solution according to time, (c) diffusion of each chemical solution according to initial concentrations.
Figure A4.
Diffusion of chemicals including H2O2, NaNO2, and NaNO3 through agarose layer: (a) a schematic drawing of the experiment, (b) diffusion of each chemical solution according to time, (c) diffusion of each chemical solution according to initial concentrations.

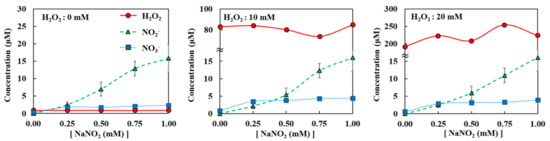
Figure A5.
Diffusion of H2O2, NO2−, and NO3− when H2O2 + NaNO2 mixture was loaded on top of agarose. All measurements were repeated three times.
Figure A5.
Diffusion of H2O2, NO2−, and NO3− when H2O2 + NaNO2 mixture was loaded on top of agarose. All measurements were repeated three times.
References
- Ikehara, S.; Sakakita, H.; Ishikawa, K.; Akimoto, Y.; Yamaguchi, T.; Yamagishi, M.; Kim, J.; Ueda, M.; Ikeda, J.-I.; Nakanishi, H.; et al. Plasma Blood Coagulation Without Involving the Activation of Platelets and Coagulation Factors. Plasma Process. Polym. 2015, 12, 1348–1353. [Google Scholar] [CrossRef]
- Yan, K.; Jin, Q.; Zheng, C.; Deng, G.; Yin, S.; Liu, Z. Pulsed cold plasma-induced blood coagulation and its pilot application in stanching bleeding during rat hepatectomy. Plasma Sci. Technol. 2018, 20, 044005. [Google Scholar] [CrossRef] [Green Version]
- Kubinova, S.; Zaviskova, K.; Uherkova, L.; Zablotskii, V.; Churpita, O.; Lunov, O.; Dejneka, A. Non-thermal air plasma promotes the healing of acute skin wounds in rats. Sci. Rep. 2017, 7, srep45183. [Google Scholar] [CrossRef] [Green Version]
- Mirpour, S.; Fathollah, S.; Mansouri, P.; Larijani, B.; Ghoranneviss, M.; Tehrani, M.M.; Amini, M.R. Cold atmospheric plasma as an effective method to treat diabetic foot ulcers: A randomized clinical trial. Sci. Rep. 2020, 10, 10440. [Google Scholar] [CrossRef] [PubMed]
- Foster, K.W.; Moy, R.L.; Fincher, E.F. Advances in plasma skin regeneration. J. Cosmet. Dermatol. 2008, 7, 169–179. [Google Scholar] [CrossRef] [PubMed]
- Adhikari, M.; Adhikari, B.; Kaushik, N.; Lee, S.-J.; Kaushik, N.K.; Choi, E.H. Melanoma Growth Analysis in Blood Serum and Tissue Using Xenograft Model with Response to Cold Atmospheric Plasma Activated Medium. Appl. Sci. 2019, 9, 4227. [Google Scholar] [CrossRef] [Green Version]
- Lee, C.B.; Seo, I.H.; Chae, M.-W.; Park, J.W.; Choi, E.H.; Uhm, H.S.; Baik, K.Y. Anticancer Activity of Liquid Treated with Microwave Plasma-Generated Gas through Macrophage Activation. Oxidative Med. Cell. Longev. 2020, 2020, 2946820-13. [Google Scholar] [CrossRef]
- Rastogi, V.; Yadav, P. Transdermal drug delivery system: An overview. Asian J. Pharm. 2012, 6, 161–170. [Google Scholar] [CrossRef]
- Mills, P.; Cross, S. Transdermal drug delivery: Basic principles for the veterinarian. Vet. J. 2006, 172, 218–233. [Google Scholar] [CrossRef]
- Hwang, S.G.; Kim, J.H.; Jo, S.Y.; Kim, Y.J.; Won, C.H. Cold Atmospheric Plasma Prevents Wrinkle Formation via an Antiaging Process. Plasma Med. 2020, 10, 91–102. [Google Scholar] [CrossRef]
- Choi, J.-H.; Lee, H.W.; Lee, J.-K.; Hong, J.-W.; Kim, G.-C. Low-temperature atmospheric plasma increases the expression of anti-aging genes of skin cells without causing cellular damages. Arch. Dermatol. Res. 2013, 305, 133–140. [Google Scholar] [CrossRef]
- Fubini, B.; Hubbard, A. Reactive oxygen species (ROS) and reactive nitrogen species (RNS) generation by silica in in-flammation and fibrosis. Free Rad. Biol. Med. 2003, 34, 1507–1516. [Google Scholar] [CrossRef]
- Thomas, D.D.; Ridnour, L.A.; Isenberg, J.S.; Flores-Santana, W.; Switzer, C.H.; Donzelli, S.; Hussain, P.; Vecoli, C.; Paolocci, N.; Ambs, S.; et al. The chemical biology of nitric oxide: Implications in cellular signaling. Free. Radic. Biol. Med. 2008, 45, 18–31. [Google Scholar] [CrossRef] [Green Version]
- Uhm, H.S.; Ki, S.H.; Baik, K.Y.; Choi, E.H. Influence of oxygen on generation of reactive chemicals from nitrogen plasma jet. Sci. Rep. 2018, 8, 9318. [Google Scholar] [CrossRef] [Green Version]
- Sarani, A.; Nikiforov, A.; Leys, C. Atmospheric pressure plasma jet in Ar and Ar/H2O mixtures: Optical emission spectroscopy and temperature measurements. Phys. Plasmas 2010, 17, 063504. [Google Scholar] [CrossRef] [Green Version]
- Naidis, G.V. Production of active species in cold helium–air plasma jets. Plasma Sources Sci. Technol. 2014, 23, 065014. [Google Scholar] [CrossRef]
- Lietz, A.M.; Kushner, M.J. Air plasma treatment of liquid covered tissue: Long timescale chemistry. J. Phys. D Appl. Phys. 2016, 49, 425204. [Google Scholar] [CrossRef]
- Verlackt, C.C.W.; Van Boxem, W.; Bogaerts, A. Transport and accumulation of plasma generated species in aqueous solution. Phys. Chem. Chem. Phys. 2018, 20, 6845–6859. [Google Scholar] [CrossRef] [PubMed]
- Duan, J.; Gan, L.; Nie, L.; Sun, F.; Lu, X.; He, G. On the penetration of reactive oxygen and nitrogen species generated by a plasma jet into and through mice skin with/without stratum corneum. Phys. Plasmas 2019, 26, 043504. [Google Scholar] [CrossRef]
- Kawasaki, T.; Koga, K.; Shiratani, M. Experimental identification of the reactive oxygen species transported into a liquid by plasma irradiation. Jpn. J. Appl. Phys. 2020, 59, 110502. [Google Scholar] [CrossRef]
- Nie, L.; Yang, Y.; Duan, J.; Sun, F.; Lu, X.P.; He, G. Effect of tissue thickness and liquid composition on the penetration of long-lifetime reactive oxygen and nitrogen species (RONS) generated by a plasma jet. J. Phys. D Appl. Phys. 2018, 51, 345204. [Google Scholar] [CrossRef]
- Oh, J.-S.; Szili, E.J.; Gaur, N.; Hong, S.H.; Furuta, H.; Kurita, H.; Mizuno, A.; Hatta, A.; Short, R.D. How to assess the plasma delivery of RONS into tissue fluid and tissue. J. Phys. D Appl. Phys. 2016, 49, 304005. [Google Scholar] [CrossRef]
- Oh, J.-S.; Szili, E.J.; Ogawa, K.; Short, R.; Ito, M.; Furuta, H.; Hatta, A. UV–vis spectroscopy study of plasma-activated water: Dependence of the chemical composition on plasma exposure time and treatment distance. Jpn. J. Appl. Phys. 2017, 57, 0102B9. [Google Scholar] [CrossRef]
- Liu, Z.; Zhou, C.; Liu, D.; He, T.; Guo, L.; Xu, D.; Kong, M. Quantifying the concentration and penetration depth of long-lived RONS in plasma-activated water by UV absorption spectroscopy. AIP Adv. 2019, 9, 015014. [Google Scholar] [CrossRef] [Green Version]
- Dobrynin, D.; Fridman, G.; Friedman, G.; Fridman, A.A. Deep Penetration into Tissues of Reactive Oxygen Species Generated in Floating-Electrode Dielectric Barrier Discharge (FE-DBD): An In Vitro Agarose Gel Model Mimicking an Open Wound. Plasma Med. 2012, 2, 71–83. [Google Scholar] [CrossRef]
- Szili, E.J.; Bradley, J.; Short, R. A ‘tissue model’ to study the plasma delivery of reactive oxygen species. J. Phys. D Appl. Phys. 2014, 47, 152002. [Google Scholar] [CrossRef]
- He, T.; Liu, D.; Xu, H.; Liu, Z.; Xu, D.; Li, D.; Li, Q.; Rong, M.; Kong, M. A ‘tissue model’ to study the barrier effects of living tissues on the reactive species generated by surface air discharge. J. Phys. D Appl. Phys. 2016, 49, 205204. [Google Scholar] [CrossRef] [Green Version]
- Szili, E.J.; Oh, J.-S.; Hong, S.H.; Hatta, A.; Short, R. Probing the transport of plasma-generated RONS in an agarose target as surrogate for real tissue: Dependency on time, distance and material composition. J. Phys. D Appl. Phys. 2015, 48, 202001. [Google Scholar] [CrossRef]
- Arakaki, T.; Miyake, T.; Hirakawa, T.; Sakugawa, H. pH Dependent Photoformation of Hydroxyl Radical and Absorbance of Aqueous-Phase N(III) (HNO2and NO2-). Environ. Sci. Technol. 1999, 33, 2561–2565. [Google Scholar] [CrossRef]
- Riordan, E.; Minogue, N.; Healy, D.; O’Driscoll, P.; Sodeau, J.R. Spectroscopic and Optimization Modeling Study of Nitrous Acid in Aqueous Solution. J. Phys. Chem. A 2005, 109, 779–786. [Google Scholar] [CrossRef]
- Anastasio, C.; Chu, L. Photochemistry of Nitrous Acid (HONO) and Nitrous Acidium Ion (H2ONO+) in Aqueous Solution and Ice. Environ. Sci. Technol. 2009, 43, 1108–1114. [Google Scholar] [CrossRef]
- Gaffney, J.S.; Marley, N.A.; Cunningham, M.M. Measurement of the absorption constants for nitrate in water between 270 and 335 nm. Environ. Sci. Technol. 1992, 26, 207–209. [Google Scholar] [CrossRef]
- Holt, R.B.; McLane, C.K.; Oldenberg, O. Ultraviolet Absorption Spectrum of Hydrogen Peroxide. J. Chem. Phys. 1948, 16, 225–229. [Google Scholar] [CrossRef]
- Adosraku, R.K.; Choi, G.T.; Constantinou-Kokotos, V.; Anderson, M.M.; Gibbons, W.A. NMR lipid profiles of cells, tissues, and body fluids: Proton NMR analysis of human erythrocyte lipids. J. Lipid Res. 1994, 35, 1925–1931. [Google Scholar] [CrossRef]
- Focus, A.; King, B.Y.M. Focus on Plasma: The application of plasma devices in aesthetic medicine. PMFA J. 2017, 4, 5–7. [Google Scholar]
- Xiong, Z. Cold Atmospheric Pressure Plasmas (CAPs) for Skin Wound Healing. In Plasma Medicine-Concepts and Clinical Applicaions; IntechOpen: London, UK, 2018; pp. 121–133. [Google Scholar] [CrossRef] [Green Version]
- Bernhardt, T.; Semmler, M.L.; Schäfer, M.; Bekeschus, S.; Emmert, S.; Boeckmann, L. Plasma Medicine: Applications of Cold Atmospheric Pressure Plasma in Dermatology. Oxidative Med. Cell. Longev. 2019, 2019, 1–10. [Google Scholar] [CrossRef] [Green Version]
- Xaubet, M.; Giuliani, L.; Grondona, D.; Minotti, F. Experimental and theoretical study of an atmospheric air plasma-jet. Phys. Plasmas 2017, 24, 013502. [Google Scholar] [CrossRef]
- Westblom, U.; Agrup, S.; Aldén, M.; Cederbalk, P. Detection of nitrogen atoms in flames using two-photon laser-induced fluorescence and investigations of photochemical effects. Appl. Opt. 1991, 30, 2990–3002. [Google Scholar] [CrossRef]
- Mann, M.S.; Tiede, R.; Gavenis, K.; Daeschlein, G.; Bussiahn, R.; Weltmann, K.-D.; Emmert, S.; Von Woedtke, T.; Ahmed, R. Introduction to DIN-specification 91315 based on the characterization of the plasma jet kINPen® MED. Clin. Plasma Med. 2016, 4, 35–45. [Google Scholar] [CrossRef]
- Pirc, E.; Balosetti, B.; Miklavčič, D.; Reberšek, M. Electronic Emulator of Biological Tissue as an Electrical Load during Electroporation. Appl. Sci. 2020, 10, 3103. [Google Scholar] [CrossRef]
- Ghimire, B.; Szili, E.J.; Lamichhane, P.; Short, R.D.; Lim, J.S.; Attri, P.; Masur, K.; Weltmann, K.-D.; Hong, S.-H.; Choi, E.H. The role of UV photolysis and molecular transport in the generation of reactive species in a tissue model with a cold atmospheric pressure plasma jet. Appl. Phys. Lett. 2019, 114, 093701. [Google Scholar] [CrossRef] [Green Version]
- Kruszelnicki, J.A.; Lietz, A.M.; Kushner, M.J. Atmospheric pressure plasma activation of water droplets. J. Phys. D Appl. Phys. 2019, 52, 355207. [Google Scholar] [CrossRef] [Green Version]
- Kasper, J.M.; Iii, C.A.C.; Cooper, C.D. Control of Nitrogen Oxide Emissions by Hydrogen Peroxide-Enhanced Gas-Phase Oxidation of Nitric Oxide. J. Air Waste Manag. Assoc. 1996, 46, 127–133. [Google Scholar] [CrossRef] [PubMed] [Green Version]
- Garaix, G.; Horne, G.P.; Venault, L.; Moisy, P.; Pimblott, S.M.; Marignier, J.; Mostafavi, M. Decay Mechanism of NO3• Radical in Highly Concentrated Nitrate and Nitric Acidic Solutions in the Absence and Presence of Hydrazine. J. Phys. Chem. B 2016, 120, 5008–5014. [Google Scholar] [CrossRef] [Green Version]
- Duan, J.; Ma, M.; Yusupov, M.; Cordeiro, R.M.; Lu, X.; Bogaerts, A. The penetration of reactive oxygen and nitrogen species across the stratum corneum. Plasma Process. Polym. 2020, 17, 202000005. [Google Scholar] [CrossRef]
- LeDuc, M.; Guay, D.; Leask, R.; Coulombe, S. Cell permeabilization using a non-thermal plasma. New J. Phys. 2009, 11, 115021. [Google Scholar] [CrossRef]
- Athanasopoulos, D.; Svarnas, P.; Gerakis, A. Cold plasma bullet influence on the water contact angle of human skin surface. J. Electrost. 2019, 102, 103378. [Google Scholar] [CrossRef]
- Armbrecht, M. Detection of contamination in DNA and protein samples by photometric measurements. Appl. Note 2013, 279, 1–6. [Google Scholar]
- Oliveira, M.C.; Yusupov, M.; Cordeiro, R.M.; Bogaerts, A. Unraveling the permeation of reactive species across nitrated membranes by computer simulations. Comput. Biol. Med. 2021, 136, 104768. [Google Scholar] [CrossRef]
- Shakel, Z.; Nunes, C.; Lima, S.; Reis, S. Development of a novel human stratum corneum model, as a tool in the optimization of drug formulations. Int. J. Pharm. 2019, 569, 118571. [Google Scholar] [CrossRef]
- Schmitt, T.; Neubert, R.H. State of the Art in Stratum Corneum Research. Part II: Hypothetical Stratum Corneum Lipid Matrix Models. Skin Pharmacol. Physiol. 2020, 33, 213–230. [Google Scholar] [CrossRef] [PubMed]

Publisher’s Note: MDPI stays neutral with regard to jurisdictional claims in published maps and institutional affiliations. |
© 2021 by the authors. Licensee MDPI, Basel, Switzerland. This article is an open access article distributed under the terms and conditions of the Creative Commons Attribution (CC BY) license (https://creativecommons.org/licenses/by/4.0/).