
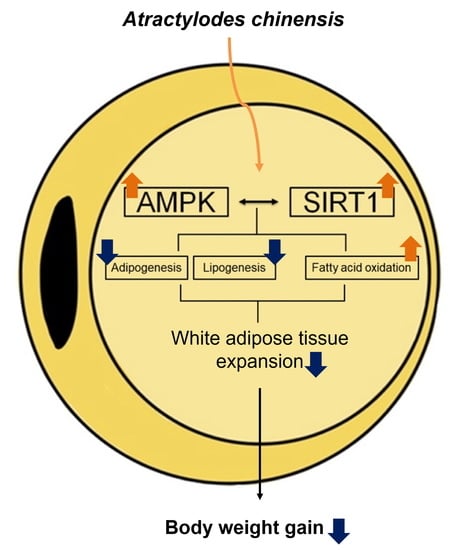
Atractylodes chinensis Water Extract Ameliorates Obesity via Promotion of the SIRT1/AMPK Expression in High-Fat Diet-Induced Obese Mice


Abstract
:
1. Introduction
2. Materials and Methods
2.1. Preparation of Ac
2.2. HFD-Induced Obesity Mouse Model
2.3. Blood Metabolite Profile Analysis
2.4. Histological Analysis
2.5. Western Blot Analysis
2.6. Quantitative Reverse-Transcription Polymerase Chain Reaction (qRT-PCR) Analysis
2.7. Statistical Analysis
3. Results
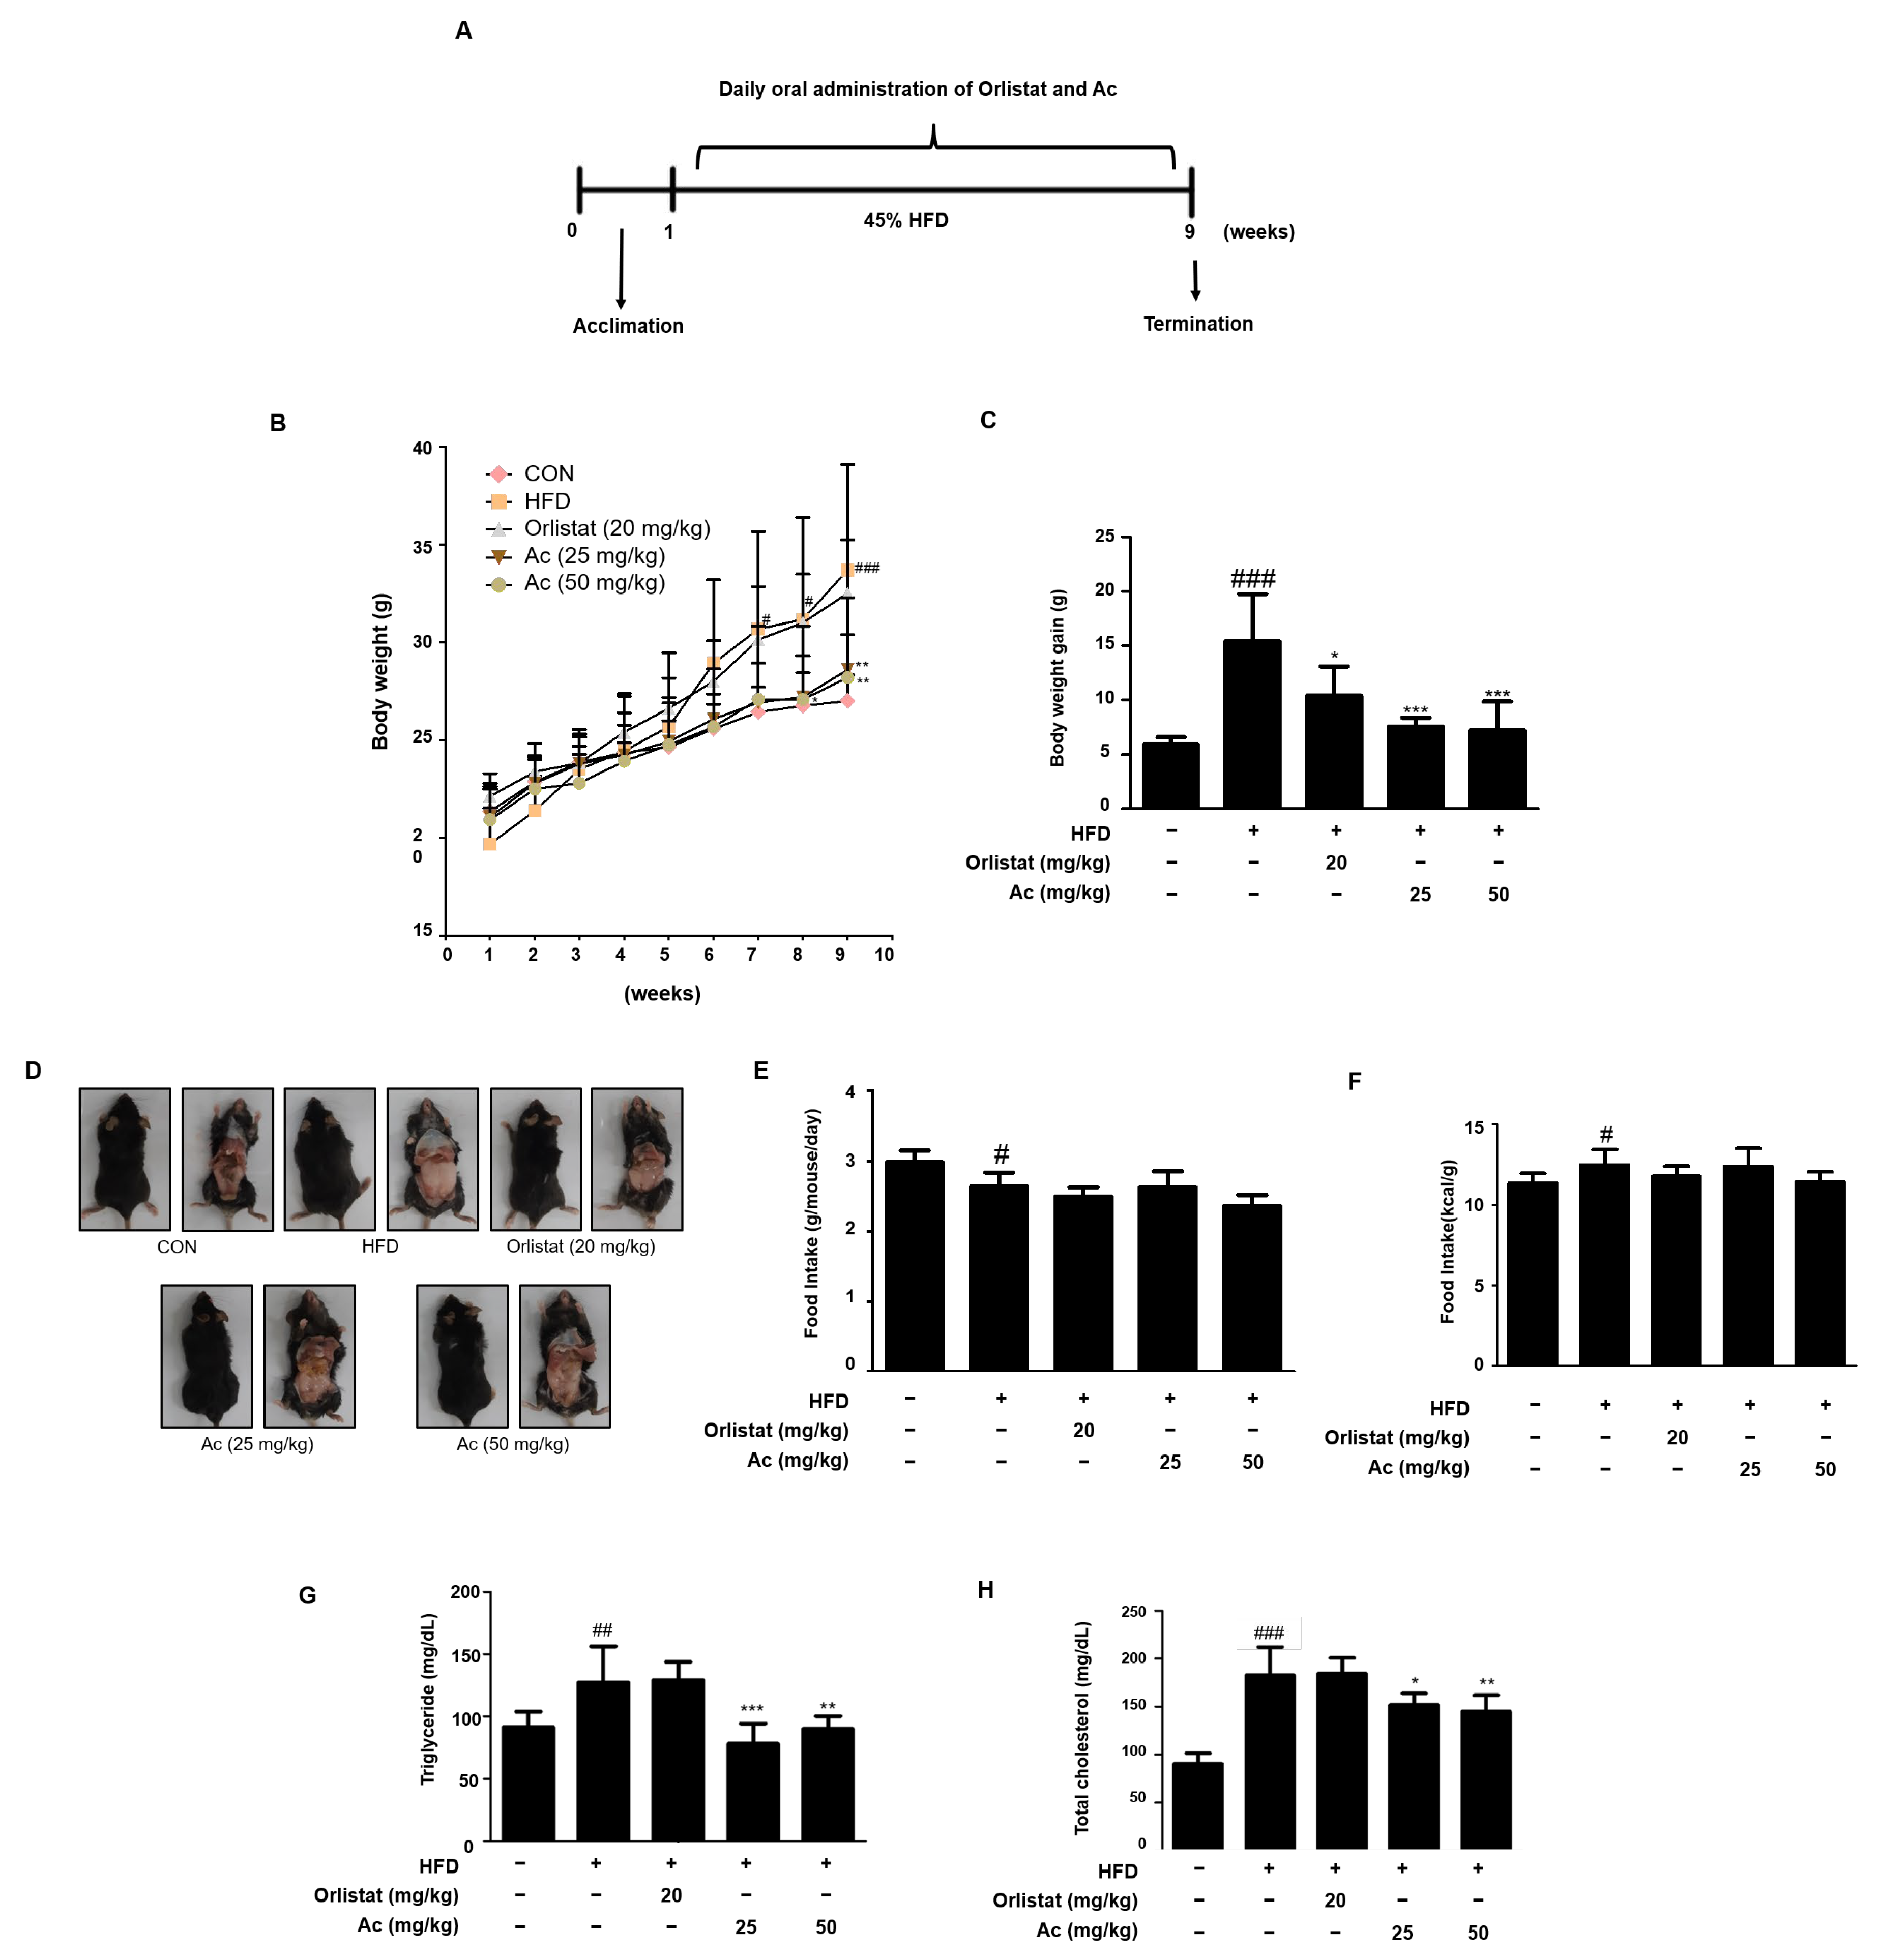
3.1. Reduced Body Weight, Serum Triglyceride, and Total Cholesterol Levels in Ac-Treated Obese Mice
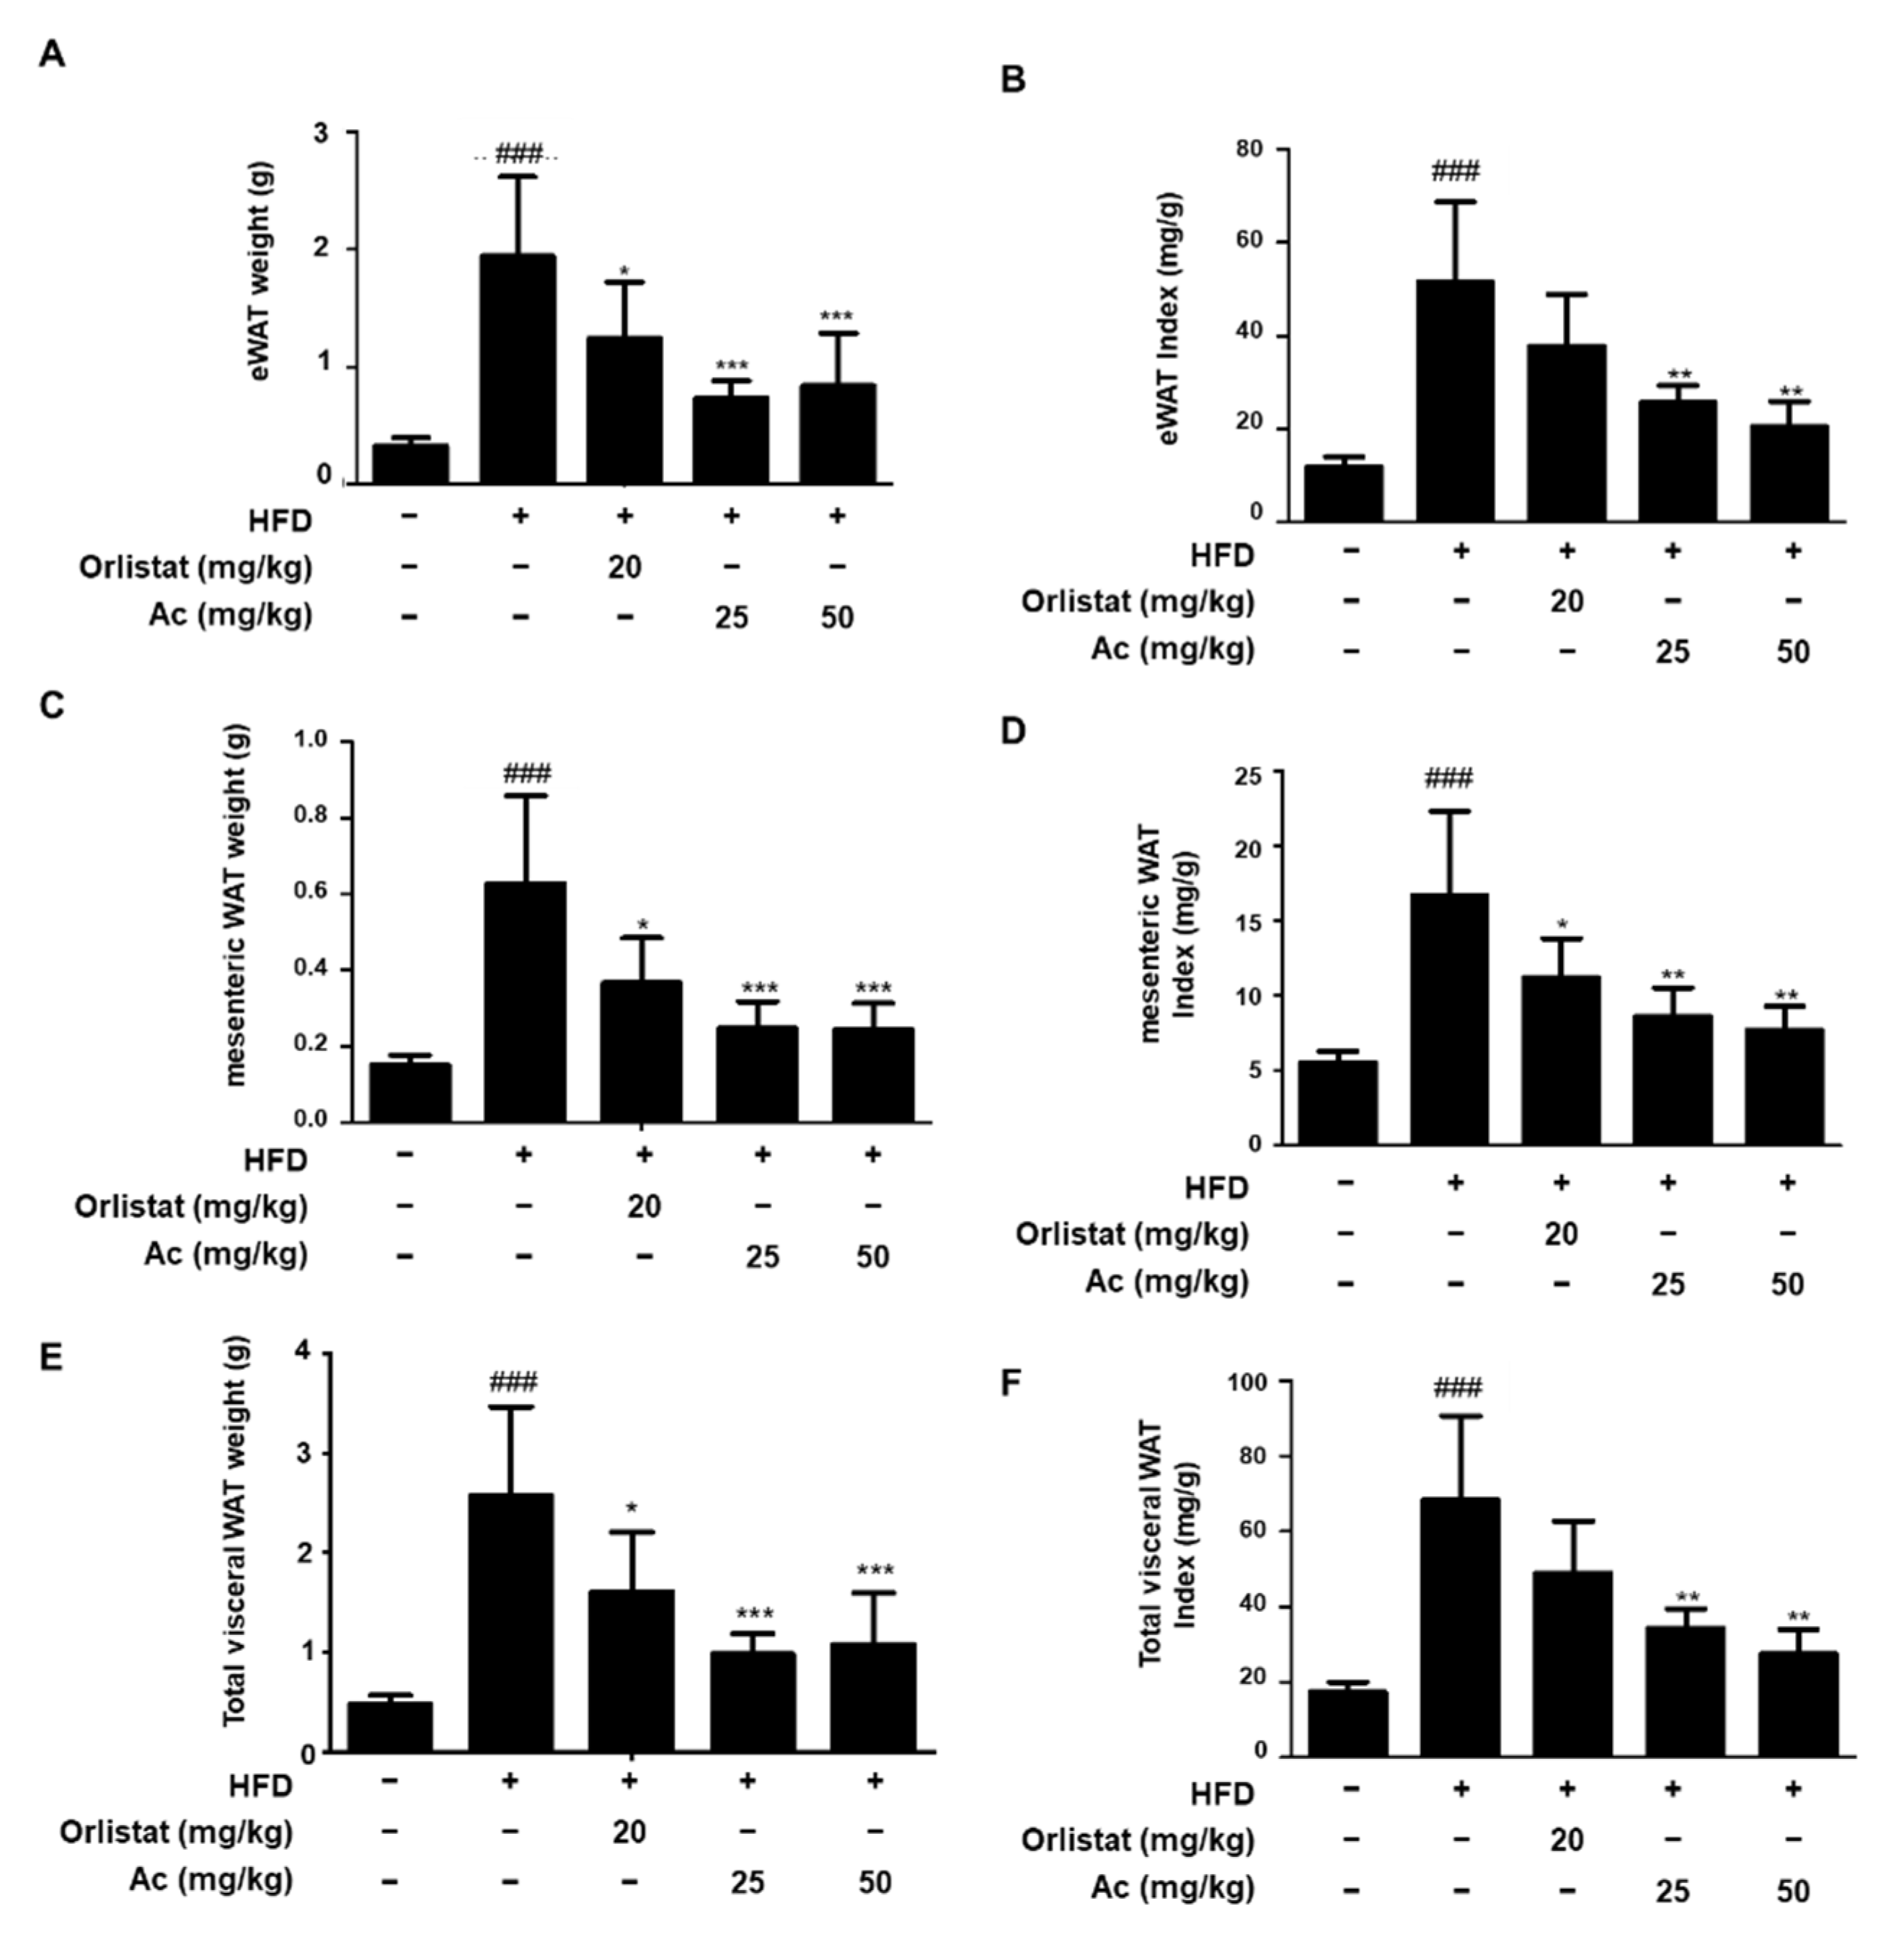
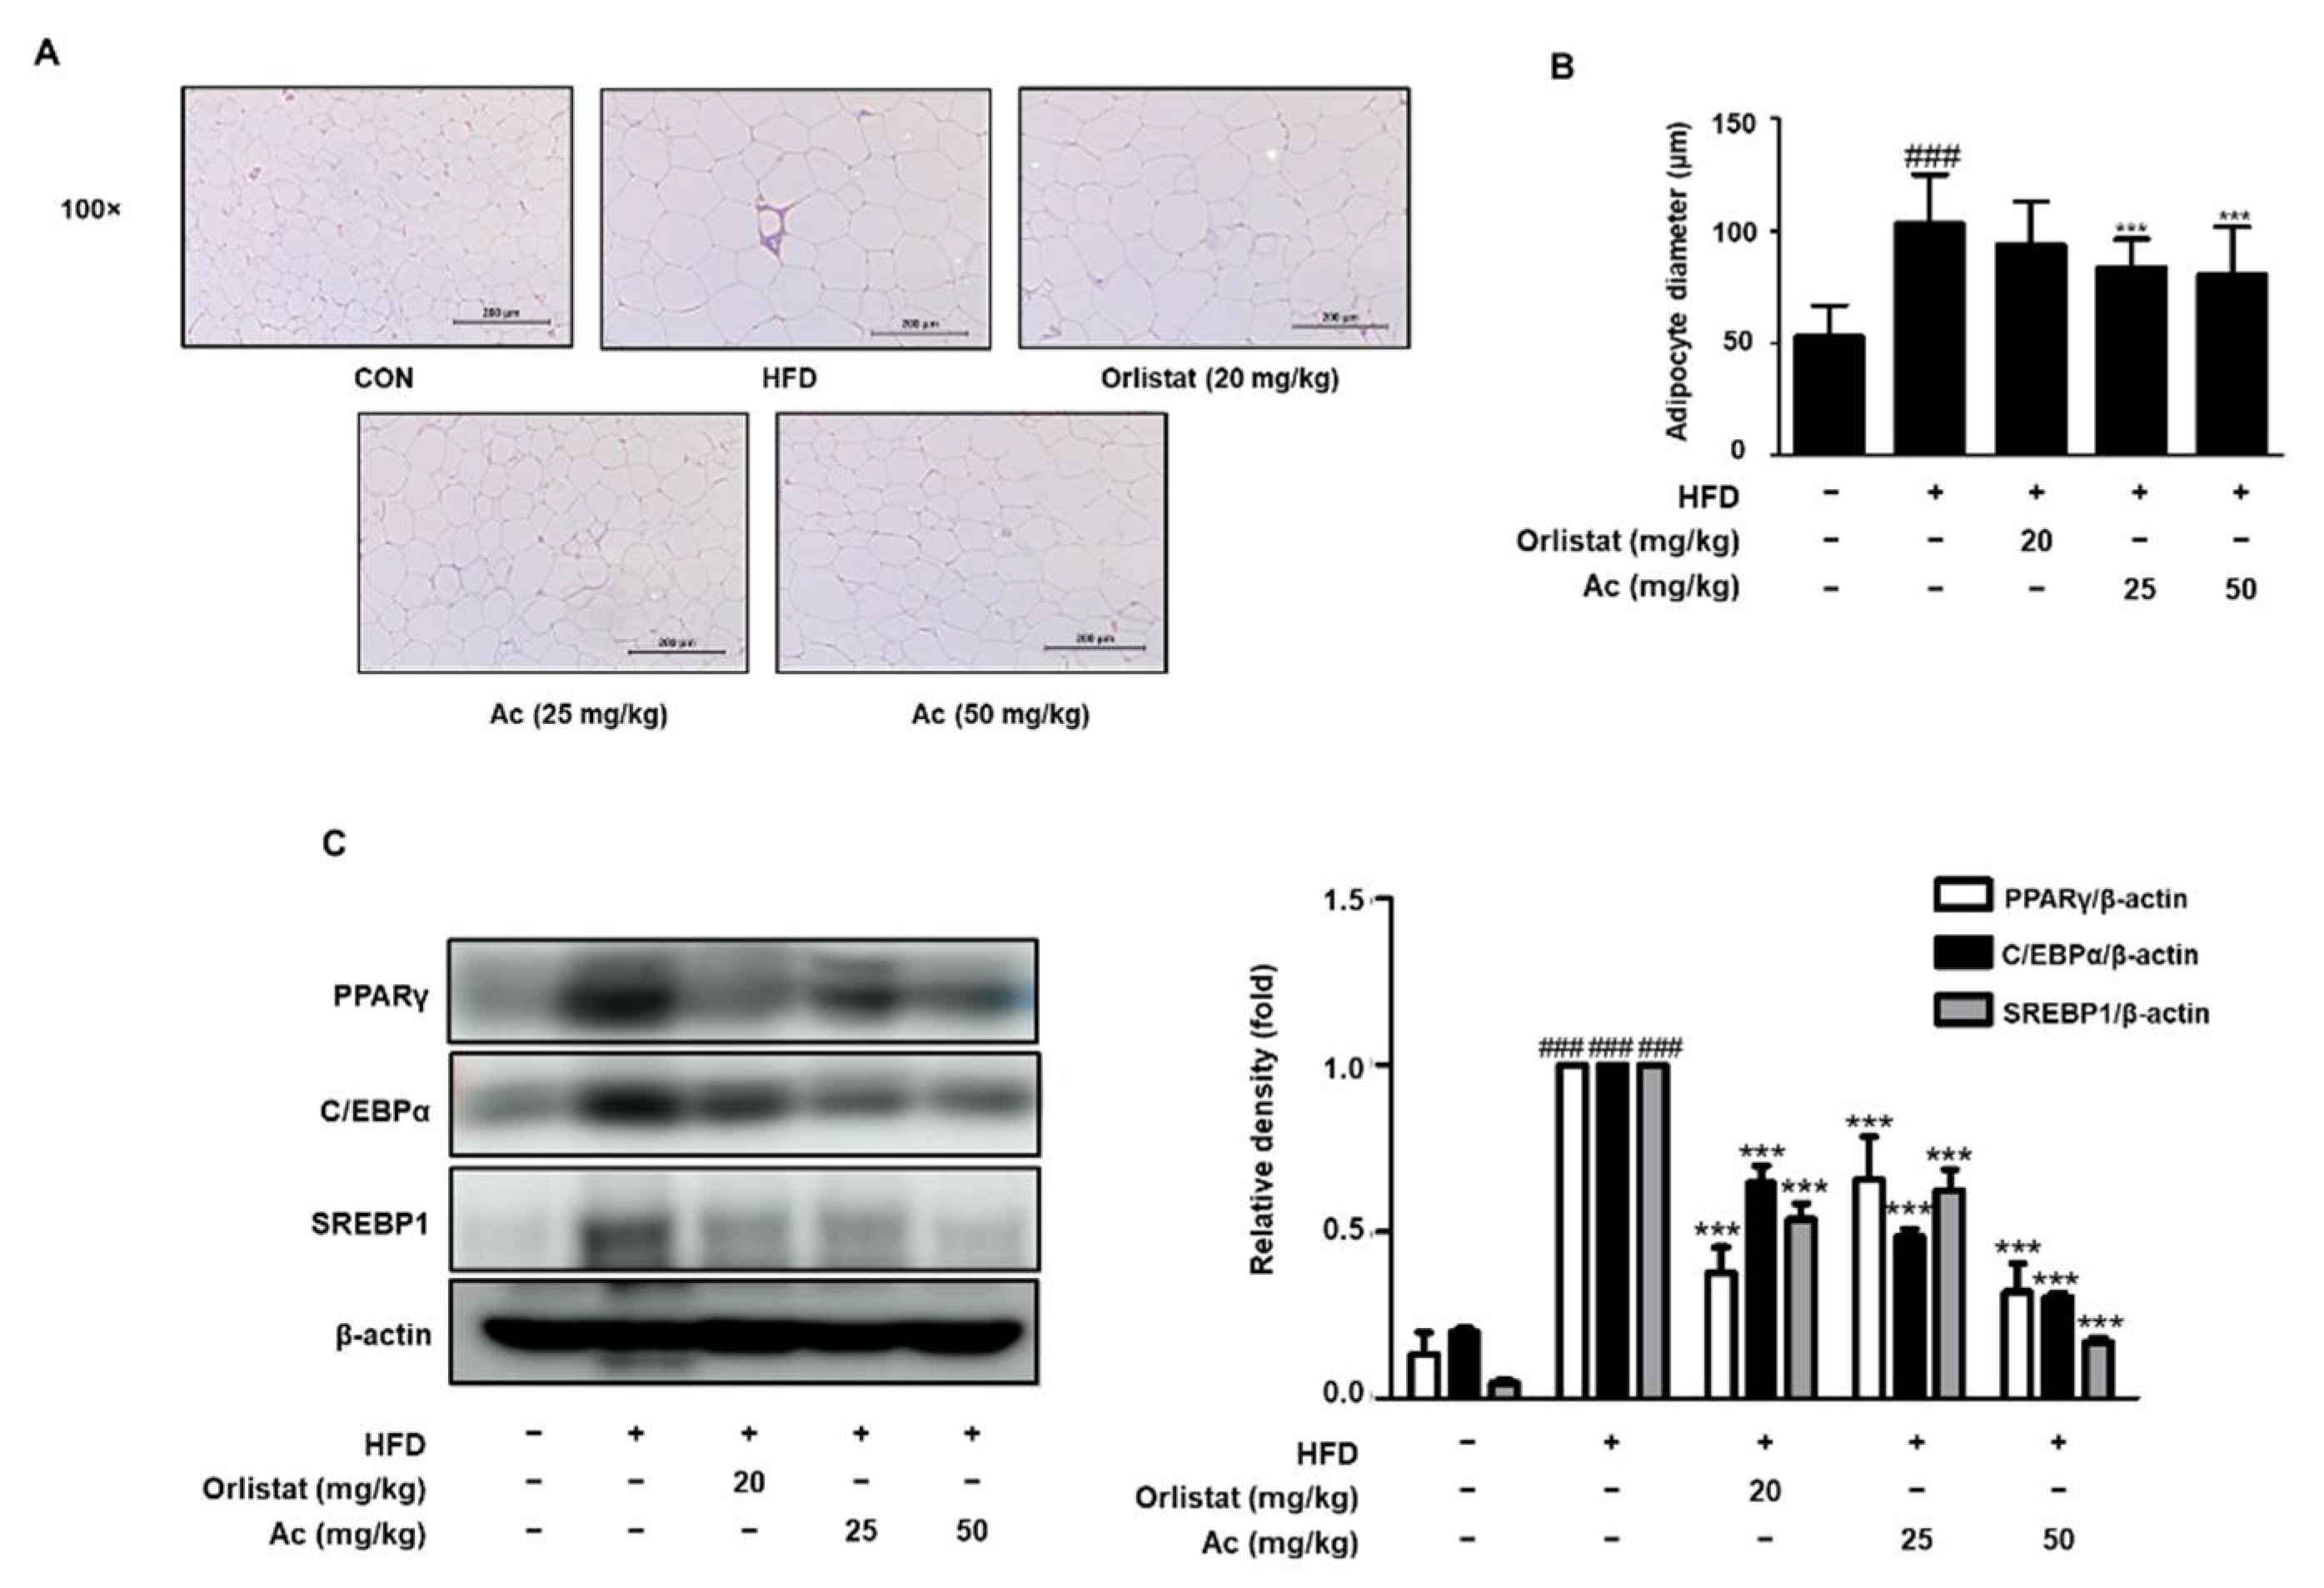
3.2. Reduced Adipose Tissue Expansion and Adipocyte Differentiation in eWAT of Ac-Treated Obese Mice
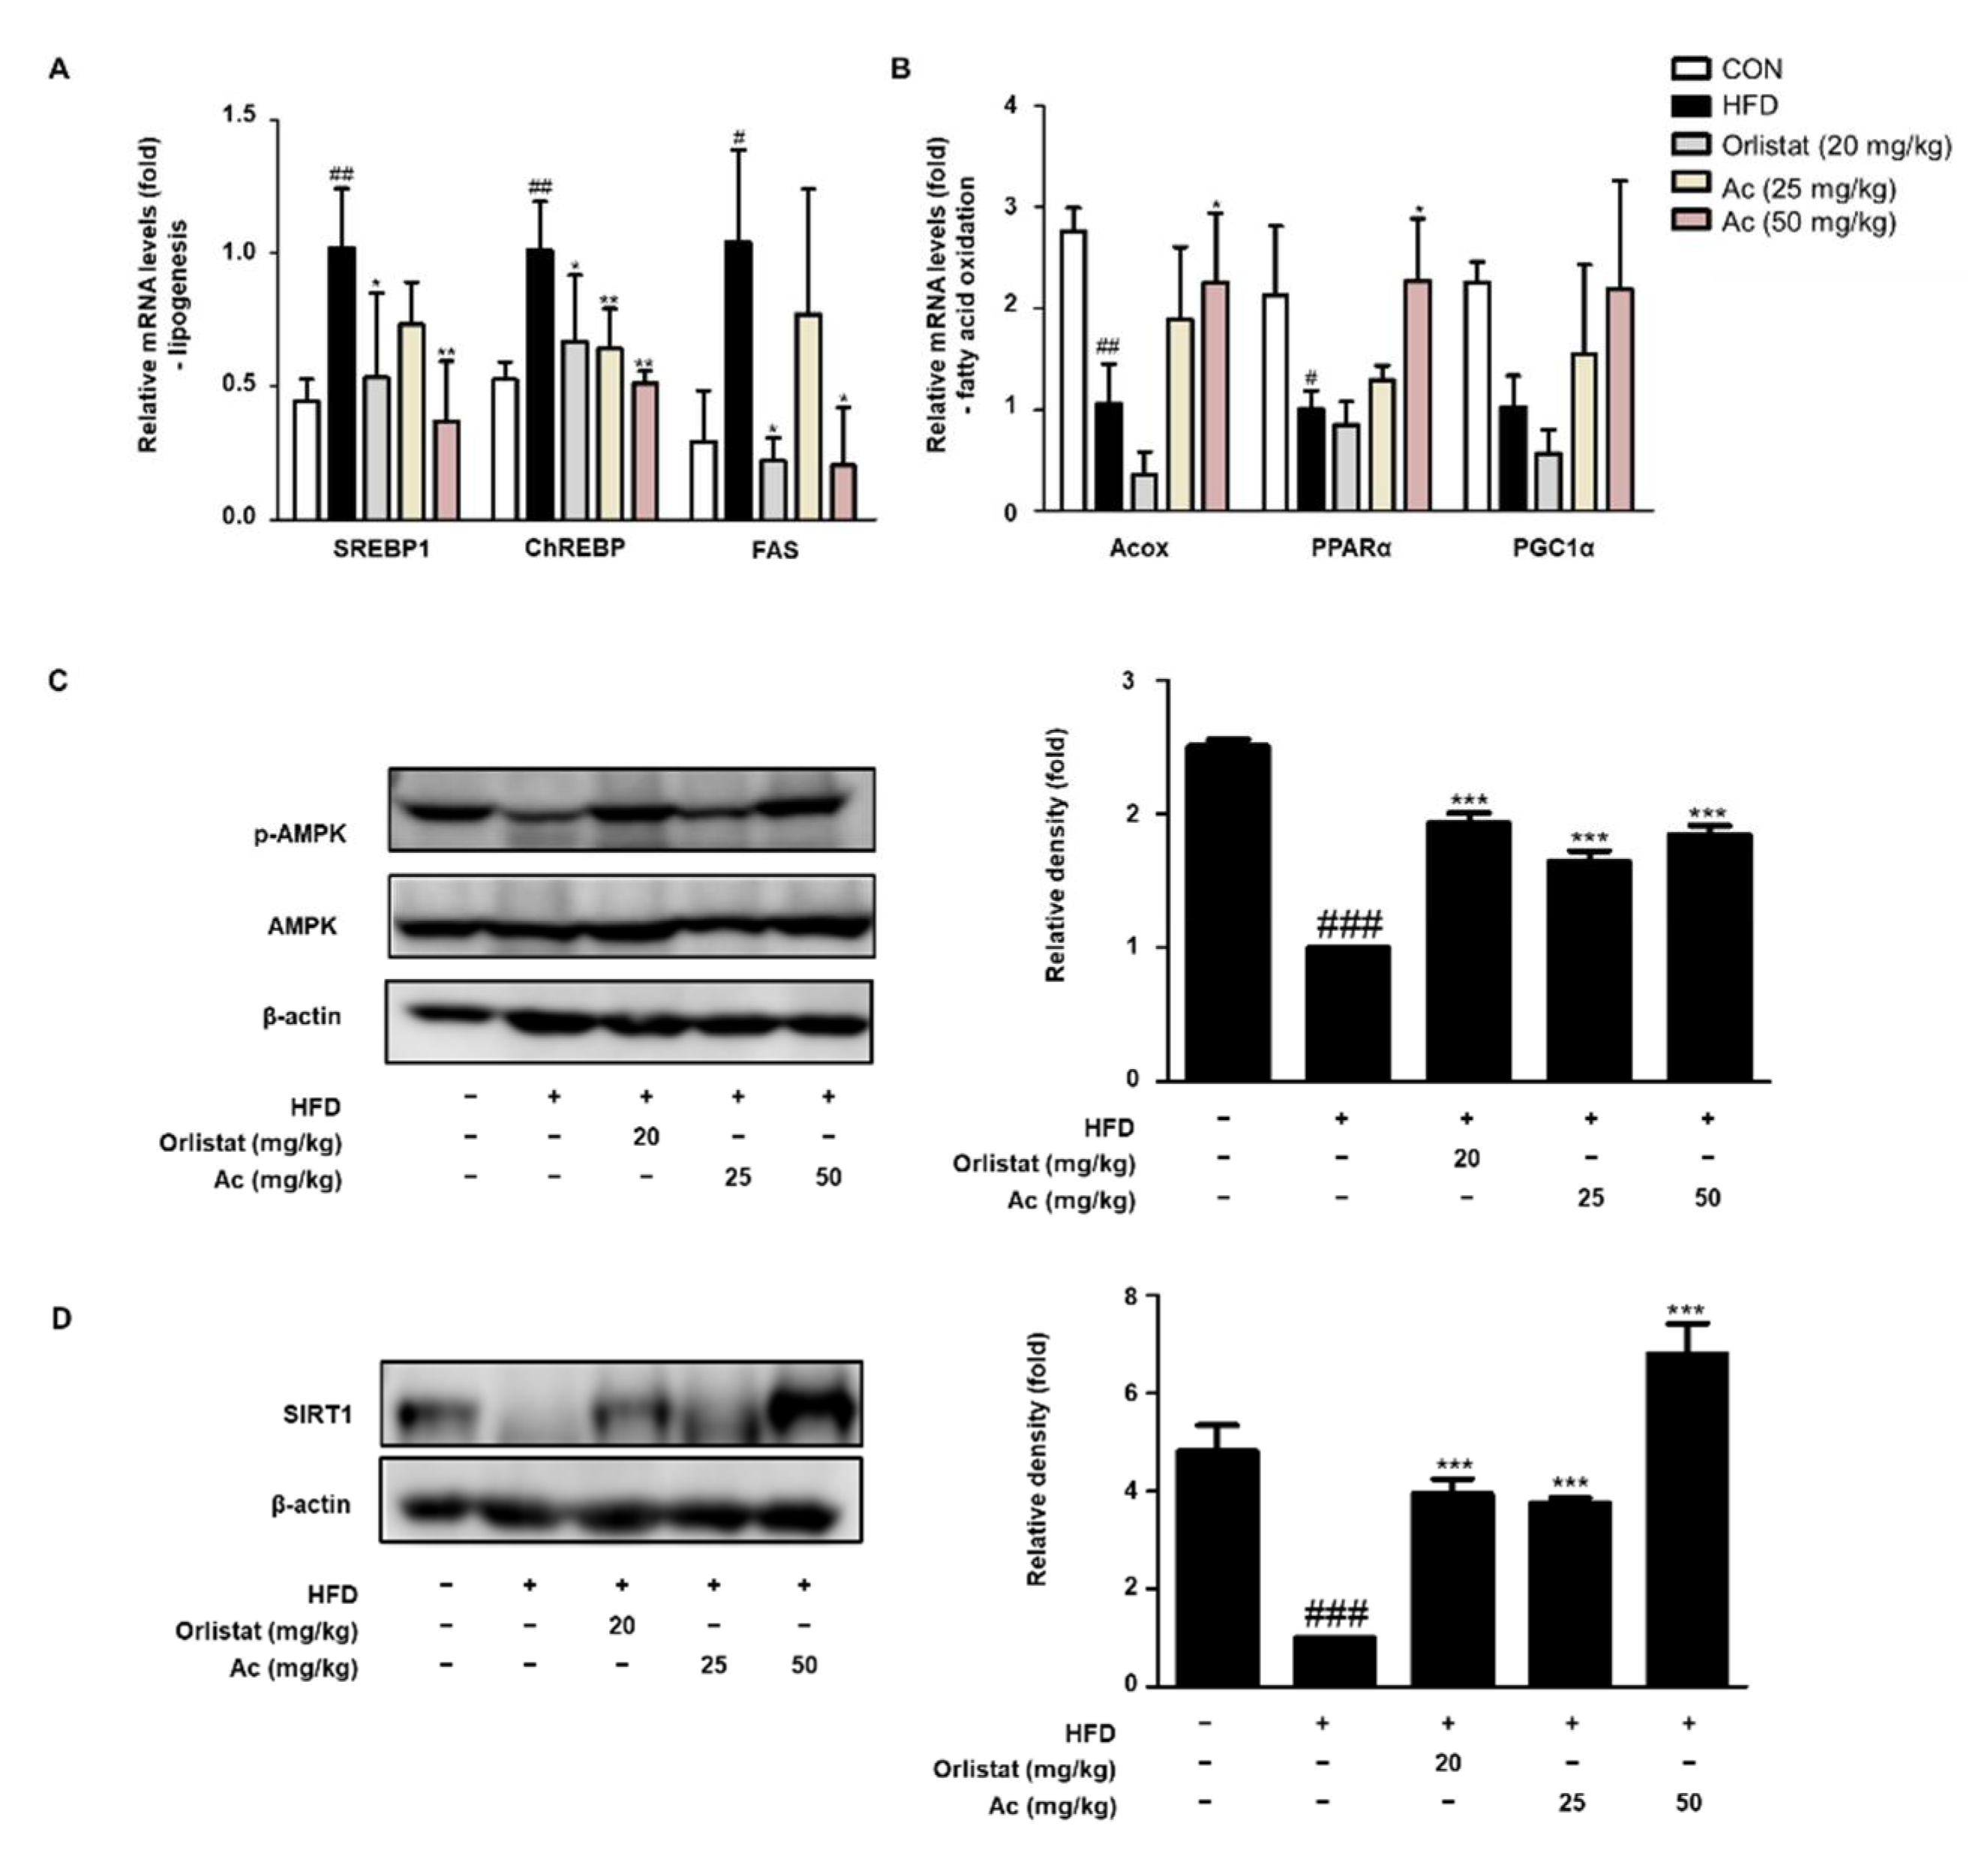
3.3. Reduced Lipid Metabolism in eWAT of Ac-Treated Obese Mice
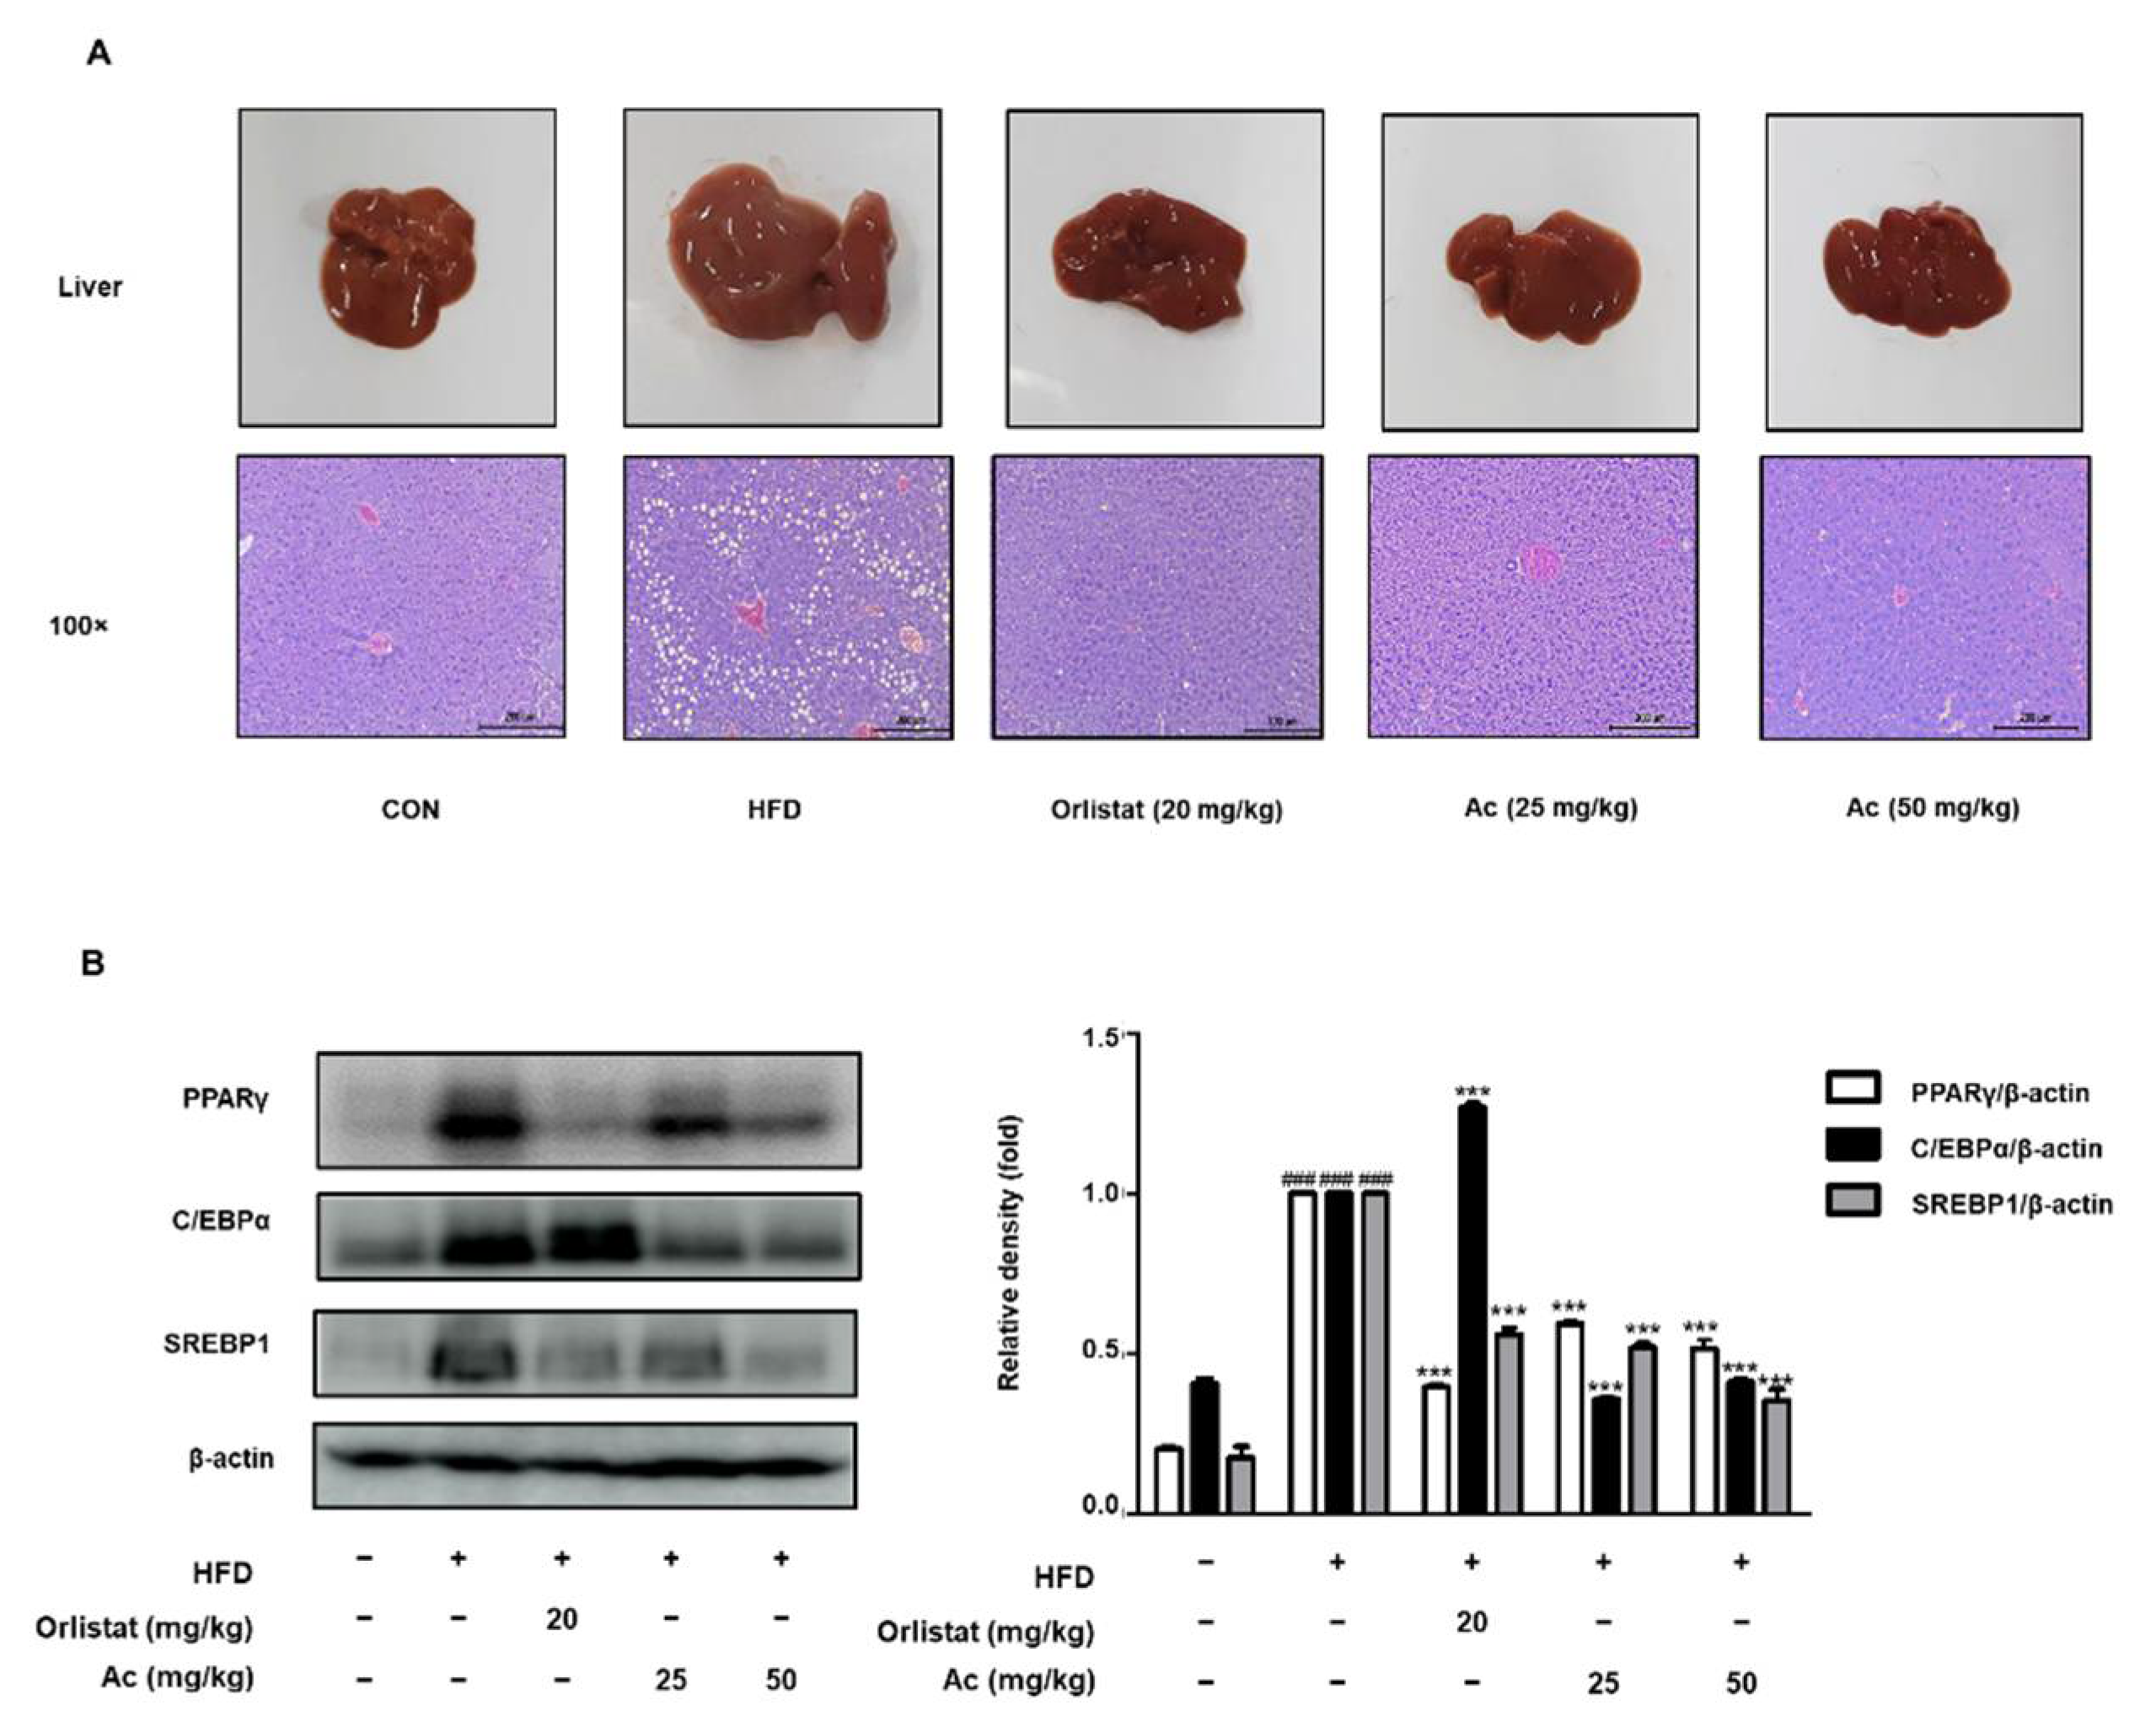
3.4. Reduced Steatosis and Adipogenesis in the Liver of Ac-Treated Obese Mice
4. Discussion
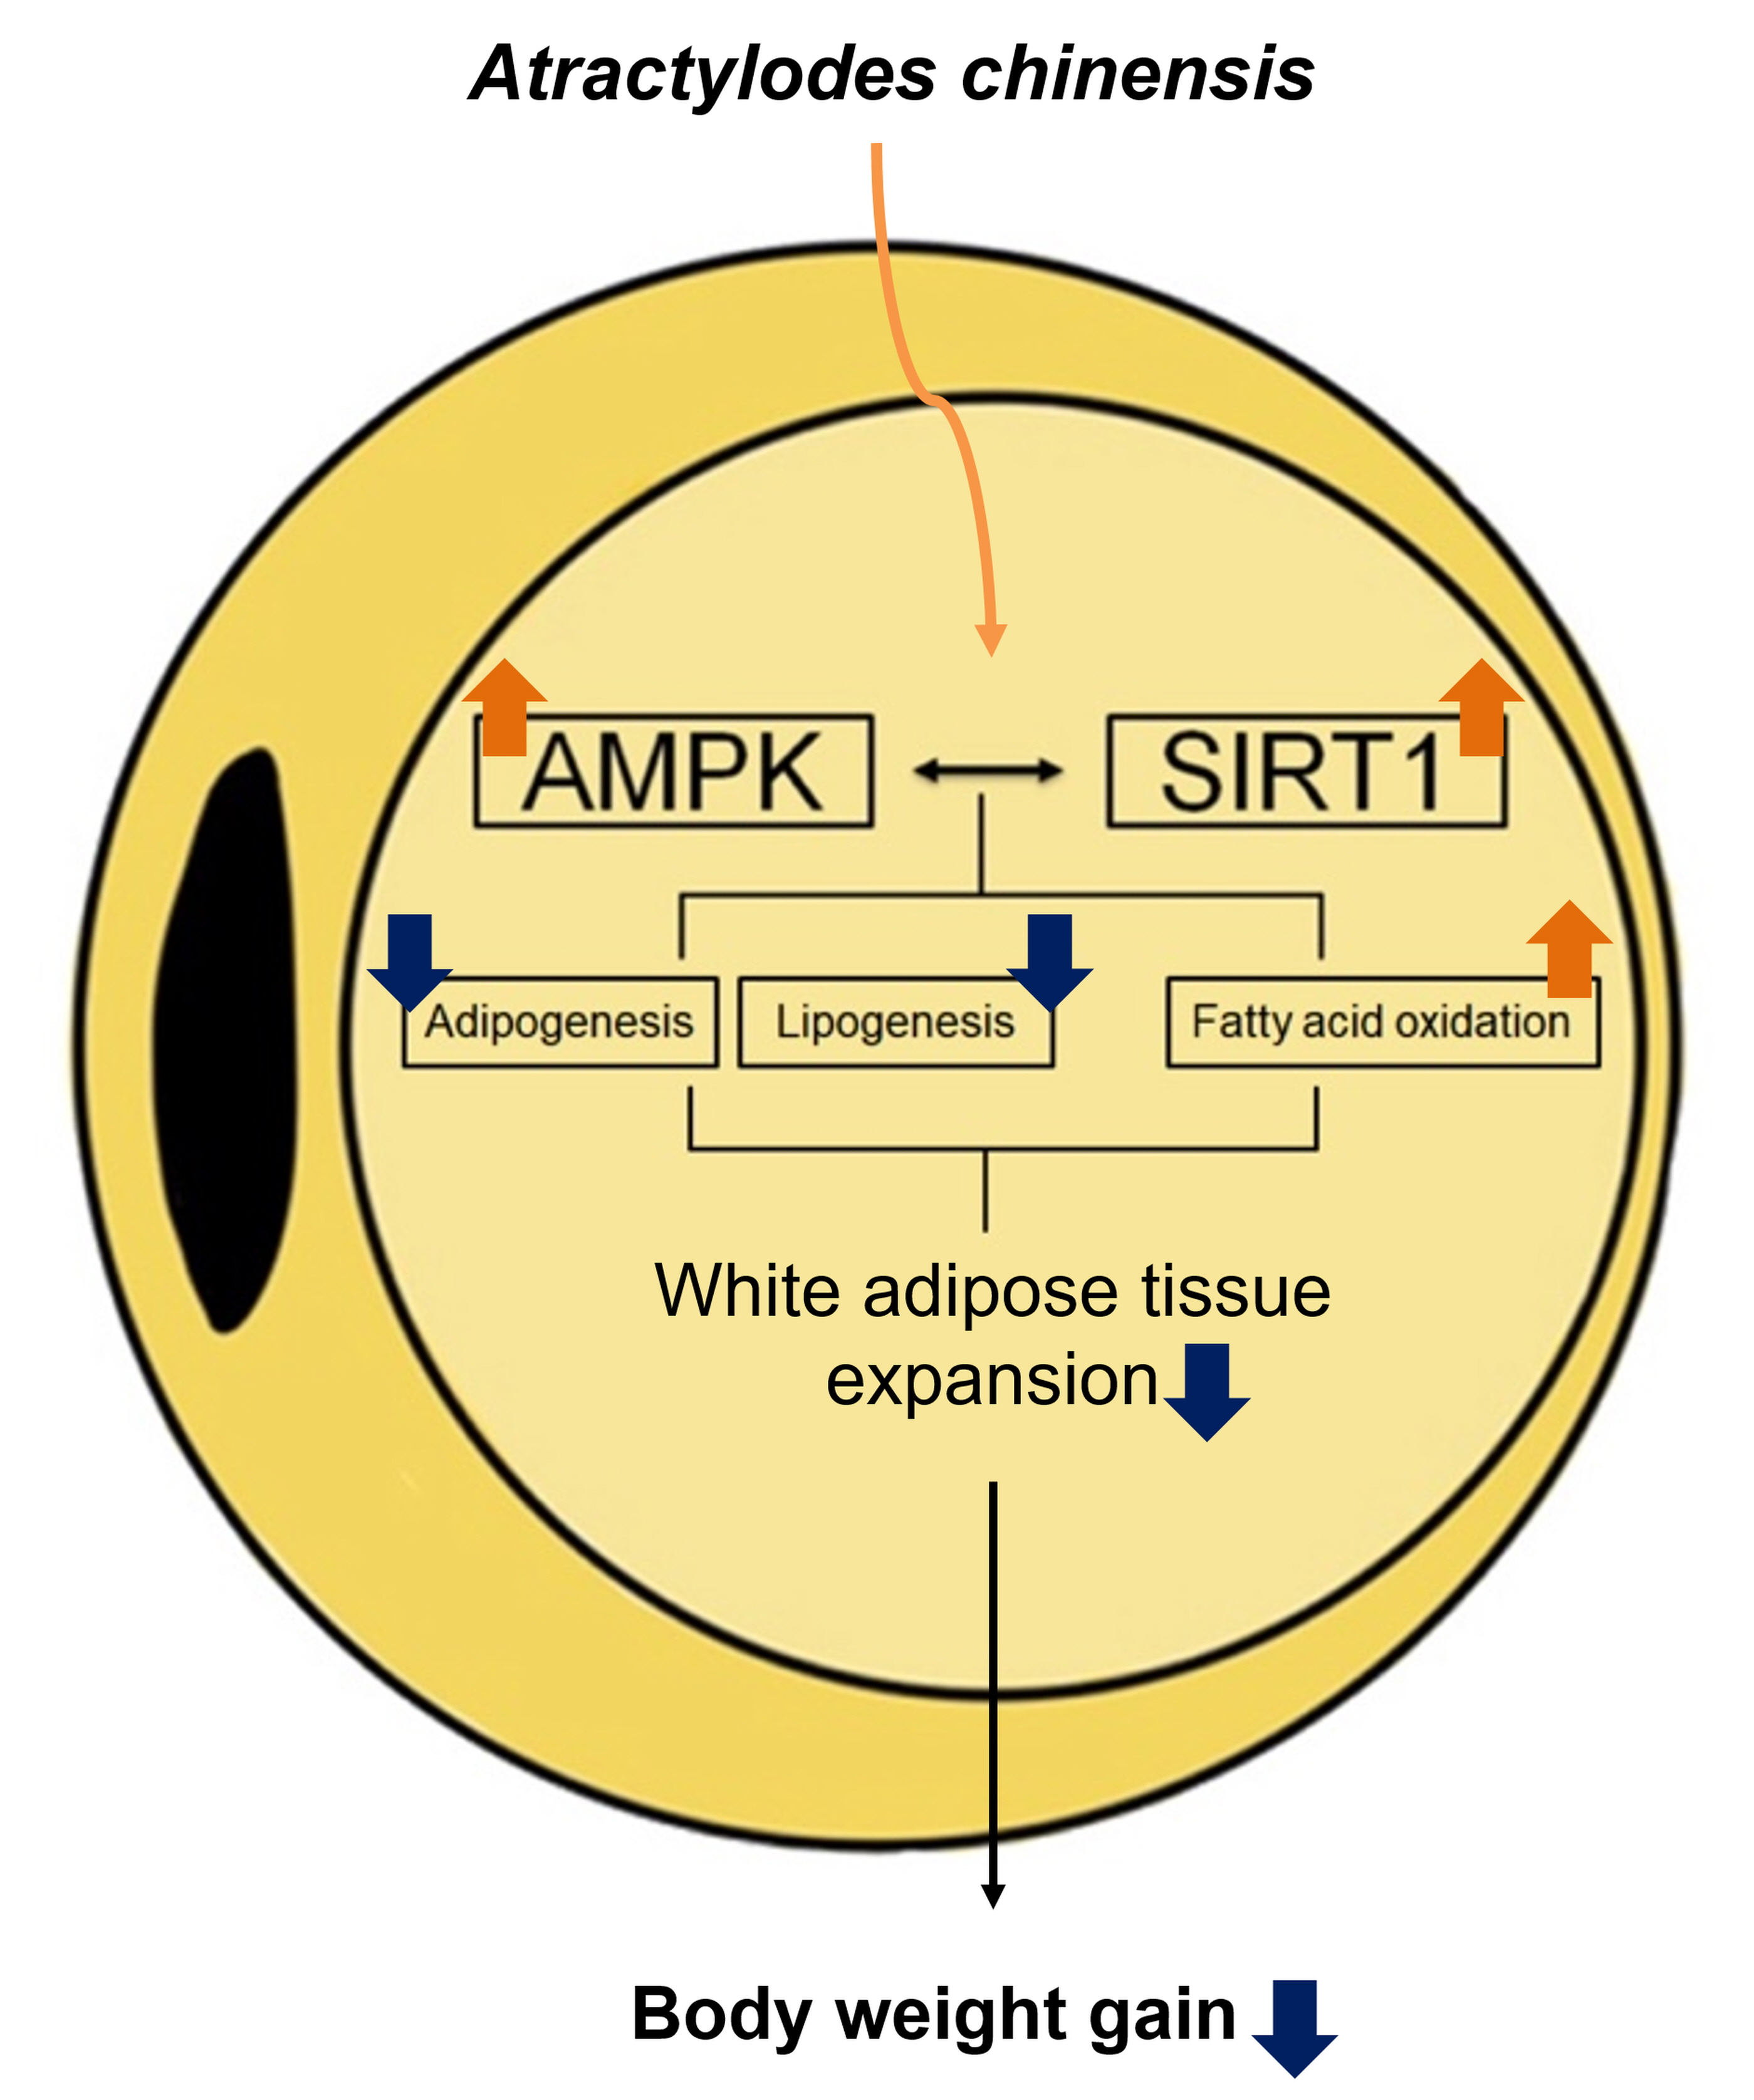
5. Conclusions
Author Contributions
Funding
Institutional Review Board Statement
Informed Consent Statement
Data Availability Statement
Conflicts of Interest
References
- Gadde, K.M.; Martin, C.K.; Berthoud, H.R.; Heymsfield, S.B. Obesity: Pathophysiology and Management. J. Am. Coll. Cardiol. 2018, 71, 69–84. [Google Scholar] [CrossRef]
- Kusminski, C.M.; Bickel, P.E.; Scherer, P.E. Targeting adipose tissue in the treatment of obesity-associated diabetes. Nat. Rev. Drug Discov. 2016, 15, 639–660. [Google Scholar] [CrossRef] [PubMed]
- Serra, D.; Mera, P.; Malandrino, M.I.; Mir, J.F.; Herrero, L. Mitochondrial fatty acid oxidation in obesity. Antioxid. Redox Signal. 2013, 19, 269–284. [Google Scholar] [CrossRef] [Green Version]
- Ibrahim, M.M. Subcutaneous and visceral adipose tissue: Structural and functional differences. Obes. Rev. Off. J. Int. Assoc. Study Obes. 2010, 11, 11–18. [Google Scholar] [CrossRef]
- Martinez-Jimenez, V.; Cortez-Espinosa, N.; Rodriguez-Varela, E.; Vega-Cardenas, M.; Briones-Espinoza, M.; Ruiz-Rodriguez, V.M.; Lopez-Lopez, N.; Briseno-Medina, A.; Turijan-Espinoza, E.; Portales-Perez, D.P. Altered levels of sirtuin genes (SIRT1, SIRT2, SIRT3 and SIRT6) and their target genes in adipose tissue from individual with obesity. Diabetes Metab. Syndr. 2019, 13, 582–589. [Google Scholar] [CrossRef]
- Nogueiras, R.; Habegger, K.M.; Chaudhary, N.; Finan, B.; Banks, A.S.; Dietrich, M.O.; Horvath, T.L.; Sinclair, D.A.; Pfluger, P.T.; Tschop, M.H. Sirtuin 1 and sirtuin 3: Physiological modulators of metabolism. Physiol. Rev. 2012, 92, 1479–1514. [Google Scholar] [CrossRef] [Green Version]
- Zillikens, M.C.; van Meurs, J.B.; Rivadeneira, F.; Amin, N.; Hofman, A.; Oostra, B.A.; Sijbrands, E.J.; Witteman, J.C.; Pols, H.A.; van Duijn, C.M.; et al. SIRT1 genetic variation is related to BMI and risk of obesity. Diabetes 2009, 58, 2828–2834. [Google Scholar] [CrossRef] [PubMed] [Green Version]
- Picard, F.; Kurtev, M.; Chung, N.; Topark-Ngarm, A.; Senawong, T.; Machado De Oliveira, R.; Leid, M.; McBurney, M.W.; Guarente, L. Sirt1 promotes fat mobilization in white adipocytes by repressing PPAR-gamma. Nature 2004, 429, 771–776. [Google Scholar] [CrossRef]
- Frescas, D.; Valenti, L.; Accili, D. Nuclear trapping of the forkhead transcription factor FoxO1 via Sirt-dependent deacetylation promotes expression of glucogenetic genes. J. Biol. Chem. 2005, 280, 20589–20595. [Google Scholar] [CrossRef] [Green Version]
- Moynihan, K.A.; Grimm, A.A.; Plueger, M.M.; Bernal-Mizrachi, E.; Ford, E.; Cras-Meneur, C.; Permutt, M.A.; Imai, S. Increased dosage of mammalian Sir2 in pancreatic beta cells enhances glucose-stimulated insulin secretion in mice. Cell Metab. 2005, 2, 105–117. [Google Scholar] [CrossRef] [PubMed] [Green Version]
- Bordone, L.; Motta, M.C.; Picard, F.; Robinson, A.; Jhala, U.S.; Apfeld, J.; McDonagh, T.; Lemieux, M.; McBurney, M.; Szilvasi, A.; et al. Sirt1 regulates insulin secretion by repressing UCP2 in pancreatic beta cells. PLoS Biol. 2006, 4, e31. [Google Scholar] [CrossRef] [Green Version]
- Rodgers, J.T.; Lerin, C.; Haas, W.; Gygi, S.P.; Spiegelman, B.M.; Puigserver, P. Nutrient control of glucose homeostasis through a complex of PGC-1alpha and SIRT1. Nature 2005, 434, 113–118. [Google Scholar] [CrossRef] [PubMed]
- Lagouge, M.; Argmann, C.; Gerhart-Hines, Z.; Meziane, H.; Lerin, C.; Daussin, F.; Messadeq, N.; Milne, J.; Lambert, P.; Elliott, P.; et al. Resveratrol improves mitochondrial function and protects against metabolic disease by activating SIRT1 and PGC-1alpha. Cell 2006, 127, 1109–1122. [Google Scholar] [CrossRef] [PubMed]
- Schug, T.T.; Li, X. Sirtuin 1 in lipid metabolism and obesity. Ann. Med. 2011, 43, 198–211. [Google Scholar] [CrossRef] [PubMed]
- Kupeli Akkol, E.; Tatli Cankaya, I.; Seker Karatoprak, G.; Carpar, E.; Sobarzo-Sanchez, E.; Capasso, R. Natural Compounds as Medical Strategies in the Prevention and Treatment of Psychiatric Disorders Seen in Neurological Diseases. Front. Pharmacol. 2021, 12, 669638. [Google Scholar] [CrossRef] [PubMed]
- Freitas, M.A.; Vasconcelos, A.; Goncalves, E.C.D.; Ferrarini, E.G.; Vieira, G.B.; Cicia, D.; Cola, M.; Capasso, R.; Dutra, R.C. Involvement of Opioid System and TRPM8/TRPA1 Channels in the Antinociceptive Effect of Spirulina platensis. Biomolecules 2021, 11, 592. [Google Scholar] [CrossRef] [PubMed]
- Chakraborty, A.J.; Mitra, S.; Tallei, T.E.; Tareq, A.M.; Nainu, F.; Cicia, D.; Dhama, K.; Emran, T.B.; Simal-Gandara, J.; Capasso, R. Bromelain a Potential Bioactive Compound: A Comprehensive Overview from a Pharmacological Perspective. Life 2021, 11, 317. [Google Scholar] [CrossRef] [PubMed]
- Ishii, T.; Okuyama, T.; Noguchi, N.; Nishidono, Y.; Okumura, T.; Kaibori, M.; Tanaka, K.; Terabayashi, S.; Ikeya, Y.; Nishizawa, M. Antiinflammatory constituents of Atractylodes chinensis rhizome improve glomerular lesions in immunoglobulin A nephropathy model mice. J. Nat. Med. 2020, 74, 51–64. [Google Scholar] [CrossRef]
- Liu, Y.; Zhang, B.; Cai, Q. Study on the pharmacodynamics and metabolomics of five medicinal species in Atractylodes DC. on rats with rheumatoid arthritis. Biomed. Pharmacother. 2020, 131, 110554. [Google Scholar] [CrossRef] [PubMed]
- Hossen, M.J.; Chou, J.Y.; Li, S.M.; Fu, X.Q.; Yin, C.; Guo, H.; Amin, A.; Chou, G.X.; Yu, Z.L. An ethanol extract of the rhizome of Atractylodes chinensis exerts anti-gastritis activities and inhibits Akt/NF-kappaB signaling. J. Ethnopharmacol. 2019, 228, 18–25. [Google Scholar] [CrossRef] [PubMed]
- Xu, J.; Chen, D.; Liu, C.; Wu, X.Z.; Dong, C.X.; Zhou, J. Structural characterization and anti-tumor effects of an inulin-type fructan from Atractylodes chinensis. Int. J. Biol. Macromol. 2016, 82, 765–771. [Google Scholar] [CrossRef]
- Wang, J.; Wang, Q.; Li, L.; Li, Y.; Zhang, H.; Zheng, L.; Yang, L.; Zheng, Y.; Yang, Y.; Peng, G.; et al. Phlegm-dampness constitution: Genomics, susceptibility, adjustment and treatment with traditional Chinese medicine. Am. J. Chin. Med. 2013, 41, 253–262. [Google Scholar] [CrossRef] [PubMed]
- Park, Y.J.; Lee, G.S.; Cheon, S.Y.; Cha, Y.Y.; An, H.J. The anti-obesity effects of Tongbi-san in a high-fat diet-induced obese mouse model. BMC Complement. Altern. Med. 2019, 19, 1. [Google Scholar] [CrossRef] [PubMed]
- Cruz, M.M.; Simao, J.J.; de Sa, R.; Farias, T.S.M.; da Silva, V.S.; Abdala, F.; Antraco, V.J.; Armelin-Correa, L.; Alonso-Vale, M.I.C. Palmitoleic Acid Decreases Non-alcoholic Hepatic Steatosis and Increases Lipogenesis and Fatty Acid Oxidation in Adipose Tissue From Obese Mice. Front. Endocrinol. 2020, 11, 537061. [Google Scholar] [CrossRef] [PubMed]
- Payne, V.A.; Au, W.S.; Lowe, C.E.; Rahman, S.M.; Friedman, J.E.; O’Rahilly, S.; Rochford, J.J. C/EBP transcription factors regulate SREBP1c gene expression during adipogenesis. Biochem. J. 2009, 425, 215–223. [Google Scholar] [CrossRef] [PubMed] [Green Version]
- Bertolio, R.; Napoletano, F.; Mano, M.; Maurer-Stroh, S.; Fantuz, M.; Zannini, A.; Bicciato, S.; Sorrentino, G.; Del Sal, G. Sterol regulatory element binding protein 1 couples mechanical cues and lipid metabolism. Nat. Commun. 2019, 10, 1326. [Google Scholar] [CrossRef] [Green Version]
- Gosmain, Y.; Dif, N.; Berbe, V.; Loizon, E.; Rieusset, J.; Vidal, H.; Lefai, E. Regulation of SREBP-1 expression and transcriptional action on HKII and FAS genes during fasting and refeeding in rat tissues. J. Lipid Res. 2005, 46, 697–705. [Google Scholar] [CrossRef] [PubMed] [Green Version]
- Iizuka, K.; Takao, K.; Yabe, D. ChREBP-Mediated Regulation of Lipid Metabolism: Involvement of the Gut Microbiota, Liver, and Adipose Tissue. Front. Endocrinol. 2020, 11, 587189. [Google Scholar] [CrossRef] [PubMed]
- Cheng, C.F.; Ku, H.C.; Lin, H. PGC-1alpha as a Pivotal Factor in Lipid and Metabolic Regulation. Int. J. Mol. Sci. 2018, 19, 3447. [Google Scholar] [CrossRef] [PubMed] [Green Version]
- He, A.; Chen, X.; Tan, M.; Chen, Y.; Lu, D.; Zhang, X.; Dean, J.M.; Razani, B.; Lodhi, I.J. Acetyl-CoA Derived from Hepatic Peroxisomal beta-Oxidation Inhibits Autophagy and Promotes Steatosis via mTORC1 Activation. Mol. Cell 2020, 79, 30–42.e34. [Google Scholar] [CrossRef]
- Ruderman, N.B.; Xu, X.J.; Nelson, L.; Cacicedo, J.M.; Saha, A.K.; Lan, F.; Ido, Y. AMPK and SIRT1: A long-standing partnership? American journal of physiology. Endocrinol. Metab. 2010, 298, E751–E760. [Google Scholar] [CrossRef]
- Vazquez, M.J.; Toro, C.A.; Castellano, J.M.; Ruiz-Pino, F.; Roa, J.; Beiroa, D.; Heras, V.; Velasco, I.; Dieguez, C.; Pinilla, L.; et al. SIRT1 mediates obesity- and nutrient-dependent perturbation of pubertal timing by epigenetically controlling Kiss1 expression. Nat. Commun. 2018, 9, 4194. [Google Scholar] [CrossRef] [PubMed] [Green Version]
- Chang, H.C.; Guarente, L. SIRT1 and other sirtuins in metabolism. Trends Endocrinol. Metab. TEM 2014, 25, 138–145. [Google Scholar] [CrossRef] [PubMed]
- Cohen, H.Y.; Miller, C.; Bitterman, K.J.; Wall, N.R.; Hekking, B.; Kessler, B.; Howitz, K.T.; Gorospe, M.; de Cabo, R.; Sinclair, D.A. Calorie restriction promotes mammalian cell survival by inducing the SIRT1 deacetylase. Science 2004, 305, 390–392. [Google Scholar] [CrossRef] [Green Version]
- Chen, W.L.; Kang, C.H.; Wang, S.G.; Lee, H.M. alpha-Lipoic acid regulates lipid metabolism through induction of sirtuin 1 (SIRT1) and activation of AMP-activated protein kinase. Diabetologia 2012, 55, 1824–1835. [Google Scholar] [CrossRef] [PubMed] [Green Version]
- Zang, Y.; Fan, L.; Chen, J.; Huang, R.; Qin, H. Improvement of Lipid and Glucose Metabolism by Capsiate in Palmitic Acid-Treated HepG2 Cells via Activation of the AMPK/SIRT1 Signaling Pathway. J. Agric. Food Chem. 2018, 66, 6772–6781. [Google Scholar] [CrossRef] [PubMed]
- Liou, C.J.; Wei, C.H.; Chen, Y.L.; Cheng, C.Y.; Wang, C.L.; Huang, W.C. Fisetin Protects against Hepatic Steatosis through Regulation of the Sirt1/AMPK and Fatty Acid beta-Oxidation Signaling Pathway in High-Fat Diet-Induced Obese Mice. Cell. Physiol. Biochem. 2018, 49, 1870–1884. [Google Scholar] [CrossRef] [PubMed]
- Shiota, A.; Shimabukuro, M.; Fukuda, D.; Soeki, T.; Sato, H.; Uematsu, E.; Hirata, Y.; Kurobe, H.; Maeda, N.; Sakaue, H.; et al. Telmisartan ameliorates insulin sensitivity by activating the AMPK/SIRT1 pathway in skeletal muscle of obese db/db mice. Cardiovasc. Diabetol. 2012, 11, 139. [Google Scholar] [CrossRef] [Green Version]
- Yoshizaki, T.; Milne, J.C.; Imamura, T.; Schenk, S.; Sonoda, N.; Babendure, J.L.; Lu, J.C.; Smith, J.J.; Jirousek, M.R.; Olefsky, J.M. SIRT1 exerts anti-inflammatory effects and improves insulin sensitivity in adipocytes. Mol. Cell. Biol. 2009, 29, 1363–1374. [Google Scholar] [CrossRef] [PubMed] [Green Version]
- Hui, X.; Zhang, M.; Gu, P.; Li, K.; Gao, Y.; Wu, D.; Wang, Y.; Xu, A. Adipocyte SIRT1 controls systemic insulin sensitivity by modulating macrophages in adipose tissue. EMBO Rep. 2017, 18, 645–657. [Google Scholar] [CrossRef] [PubMed] [Green Version]
- Murphy, E.A.; Velazquez, K.T.; Herbert, K.M. Influence of high-fat diet on gut microbiota: A driving force for chronic disease risk. Curr. Opin. Clin. Nutr. Metab. Care 2015, 18, 515–520. [Google Scholar] [CrossRef] [PubMed]


| Content (kcal%) | Diets | |
|---|---|---|
| HFD | Chow Diet | |
| Fat % | 45 | 5 |
| Protein % | 20 | 18 |
| Carbohydrate % | 35 | 75.9 |
| Energy (kcal/kg) | 4730 | 3811 |
| Cholesterol (mg/kg) | 196.5 | - |
| Protein ingredients | Casein, L-Cystein | - |
| Fat ingredients | Soybean oil, Lard | - |
| Carbohydrate ingredients | Corn Starch, Maltodextrin, Sucrose | - |
| Antibody | Dilution | Source | Vendor | Catalog No. |
|---|---|---|---|---|
| PPARγ | 1:2000 | Mouse | Santa Cruz Biotechnology | sc-7273 |
| SREBP1 | 1:2000 | Mouse | Santa Cruz Biotechnology | sc-13551 |
| C/EBPα | 1:1000 | Mouse | Santa Cruz Biotechnology | sc-365318 |
| p-AMPK | 1:2000 | Rabbit | Cell Signaling Technology | #2531 |
| AMPK | 1:2000 | Rabbit | Cell Signaling Technology | #2532 |
| SIRT1 | 1:1000 | Mouse | Santa Cruz Biotechnology | Sc-74465 |
| β-actin | 1:2500 | Mouse | Santa Cruz Biotechnology | sc-81178 |
| Gene | Forward (5′-3′) | Reverse (3′-5′) |
|---|---|---|
| SREBP1 | ATCGCAAACAAGCTGACCTG | AGATCCAGGTTTGAGGTGGG |
| ChREBP | CACTCAGGGAATACAGCGCTAC | ATCTTGGTCTTAGGGTCTTCAGG |
| FAS | AGGGGTCGACCTGGTCCTCA | GCCATGCCCAGAGGGTGGTT |
| Acox | TAACTTCCTCACTCGAAGCCA | AGTTCCATGACCCATCTCTGTC |
| PPARα | CAGGAGAGCAGGGATTTGCA | CCTACGCTCAGCCCTCTTCAT |
| PGC1α | TATGGAGTGACATAGAGTGTGCT | CCACTTCAATCCACCCAGAAAG |
| GAPDH | GACGGCCGCATCTTCTTGT | CACACCGACCTTCACCATTTT |
| Parameters | ||
|---|---|---|
| Groups | ALT (U/L) | BUN (mg/dL) |
| CON | 28.40 ± 6.53 | 22.05 ± 2.46 |
| HFD | 37.36 ± 5.44 | 22.18 ± 1.76 |
| Orlistat (20 mg/kg) | 33.99 ± 5.12 | 22.53 ± 1.29 |
| Ac (25 mg/kg) | 30.99 ± 7.24 | 21.79 ± 2.89 |
| Ac (50 mg/kg) | 30.36 ± 3.50 | 18.41 ± 1.08 |
Publisher’s Note: MDPI stays neutral with regard to jurisdictional claims in published maps and institutional affiliations. |
© 2021 by the authors. Licensee MDPI, Basel, Switzerland. This article is an open access article distributed under the terms and conditions of the Creative Commons Attribution (CC BY) license (https://creativecommons.org/licenses/by/4.0/).
Share and Cite
Park, Y.-J.; Seo, M.-g.; Cominguez, D.C.; Han, I.; An, H.-J. Atractylodes chinensis Water Extract Ameliorates Obesity via Promotion of the SIRT1/AMPK Expression in High-Fat Diet-Induced Obese Mice. Nutrients 2021, 13, 2992. https://doi.org/10.3390/nu13092992
Park Y-J, Seo M-g, Cominguez DC, Han I, An H-J. Atractylodes chinensis Water Extract Ameliorates Obesity via Promotion of the SIRT1/AMPK Expression in High-Fat Diet-Induced Obese Mice. Nutrients. 2021; 13(9):2992. https://doi.org/10.3390/nu13092992
Chicago/Turabian StylePark, Yea-Jin, Min-gyu Seo, Divina C. Cominguez, Insik Han, and Hyo-Jin An. 2021. "Atractylodes chinensis Water Extract Ameliorates Obesity via Promotion of the SIRT1/AMPK Expression in High-Fat Diet-Induced Obese Mice" Nutrients 13, no. 9: 2992. https://doi.org/10.3390/nu13092992