
Validation of Adhesive and Temperature Property Characteristics of Microsurfacing by Performance-Based Mixture Design Approach

Abstract
:1. Introduction
2. Materials and Sample Preparation
2.1. Materials
2.2. Sample Preparation
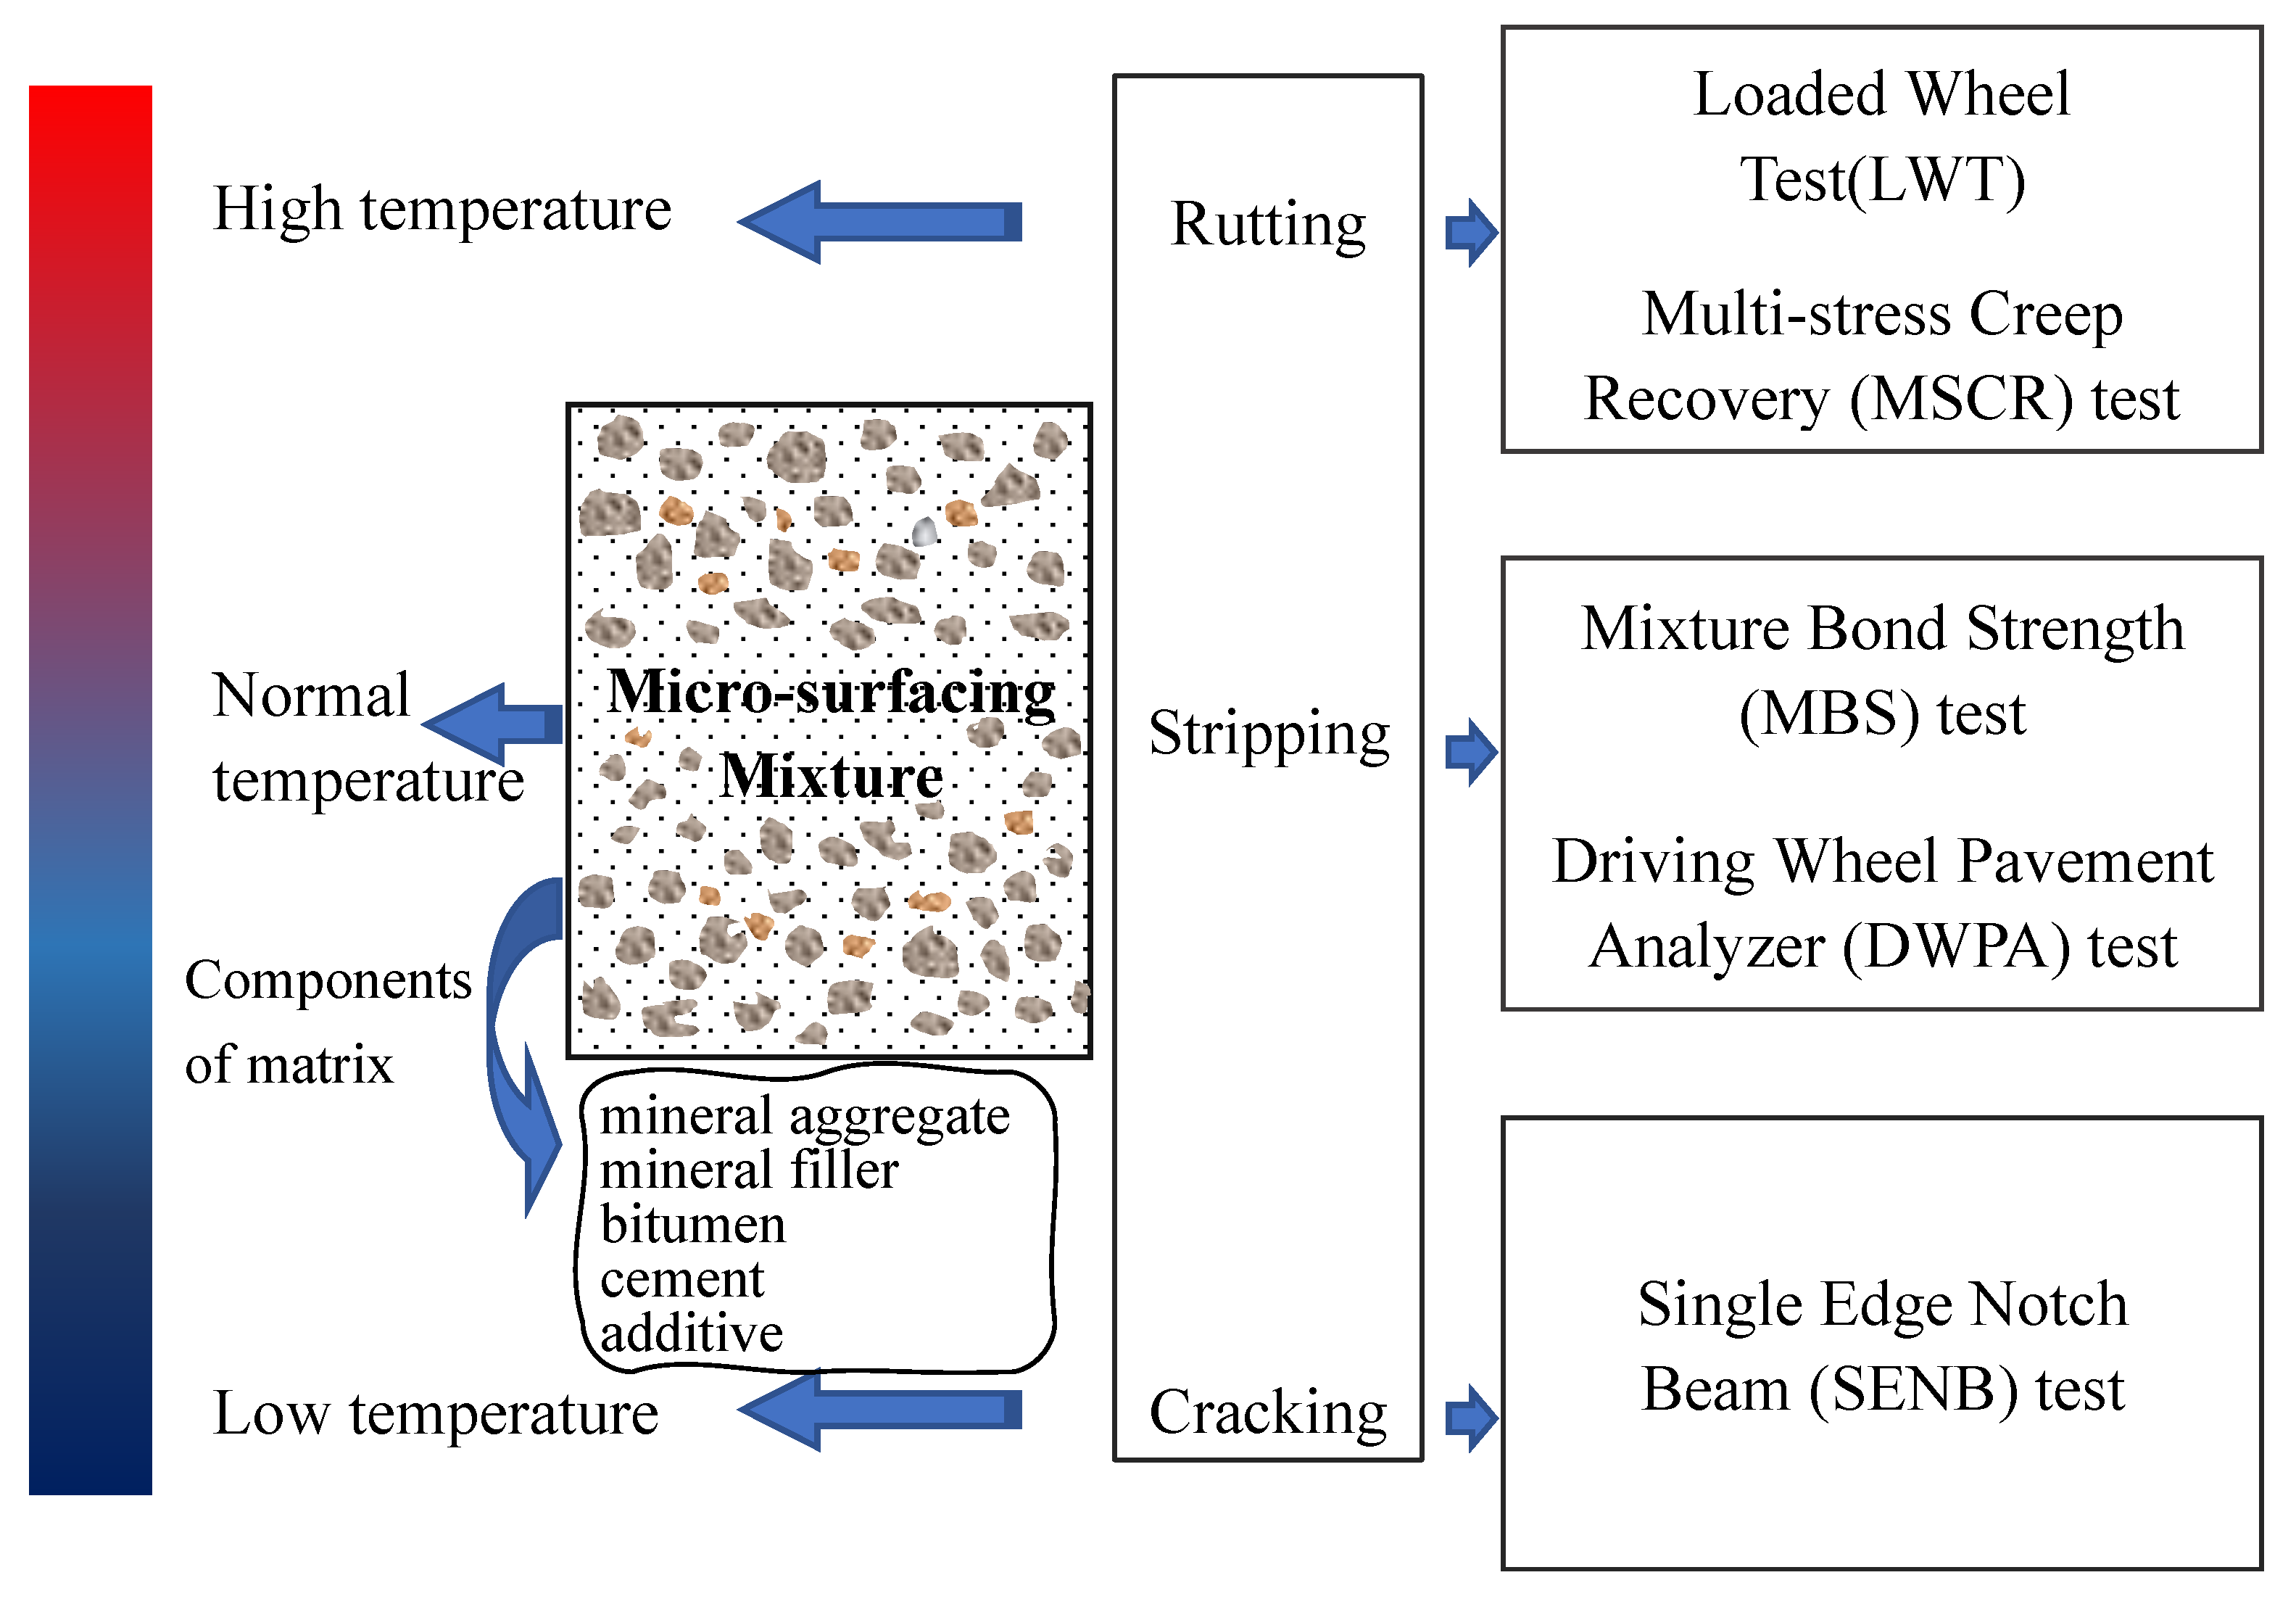
3. Testing Program
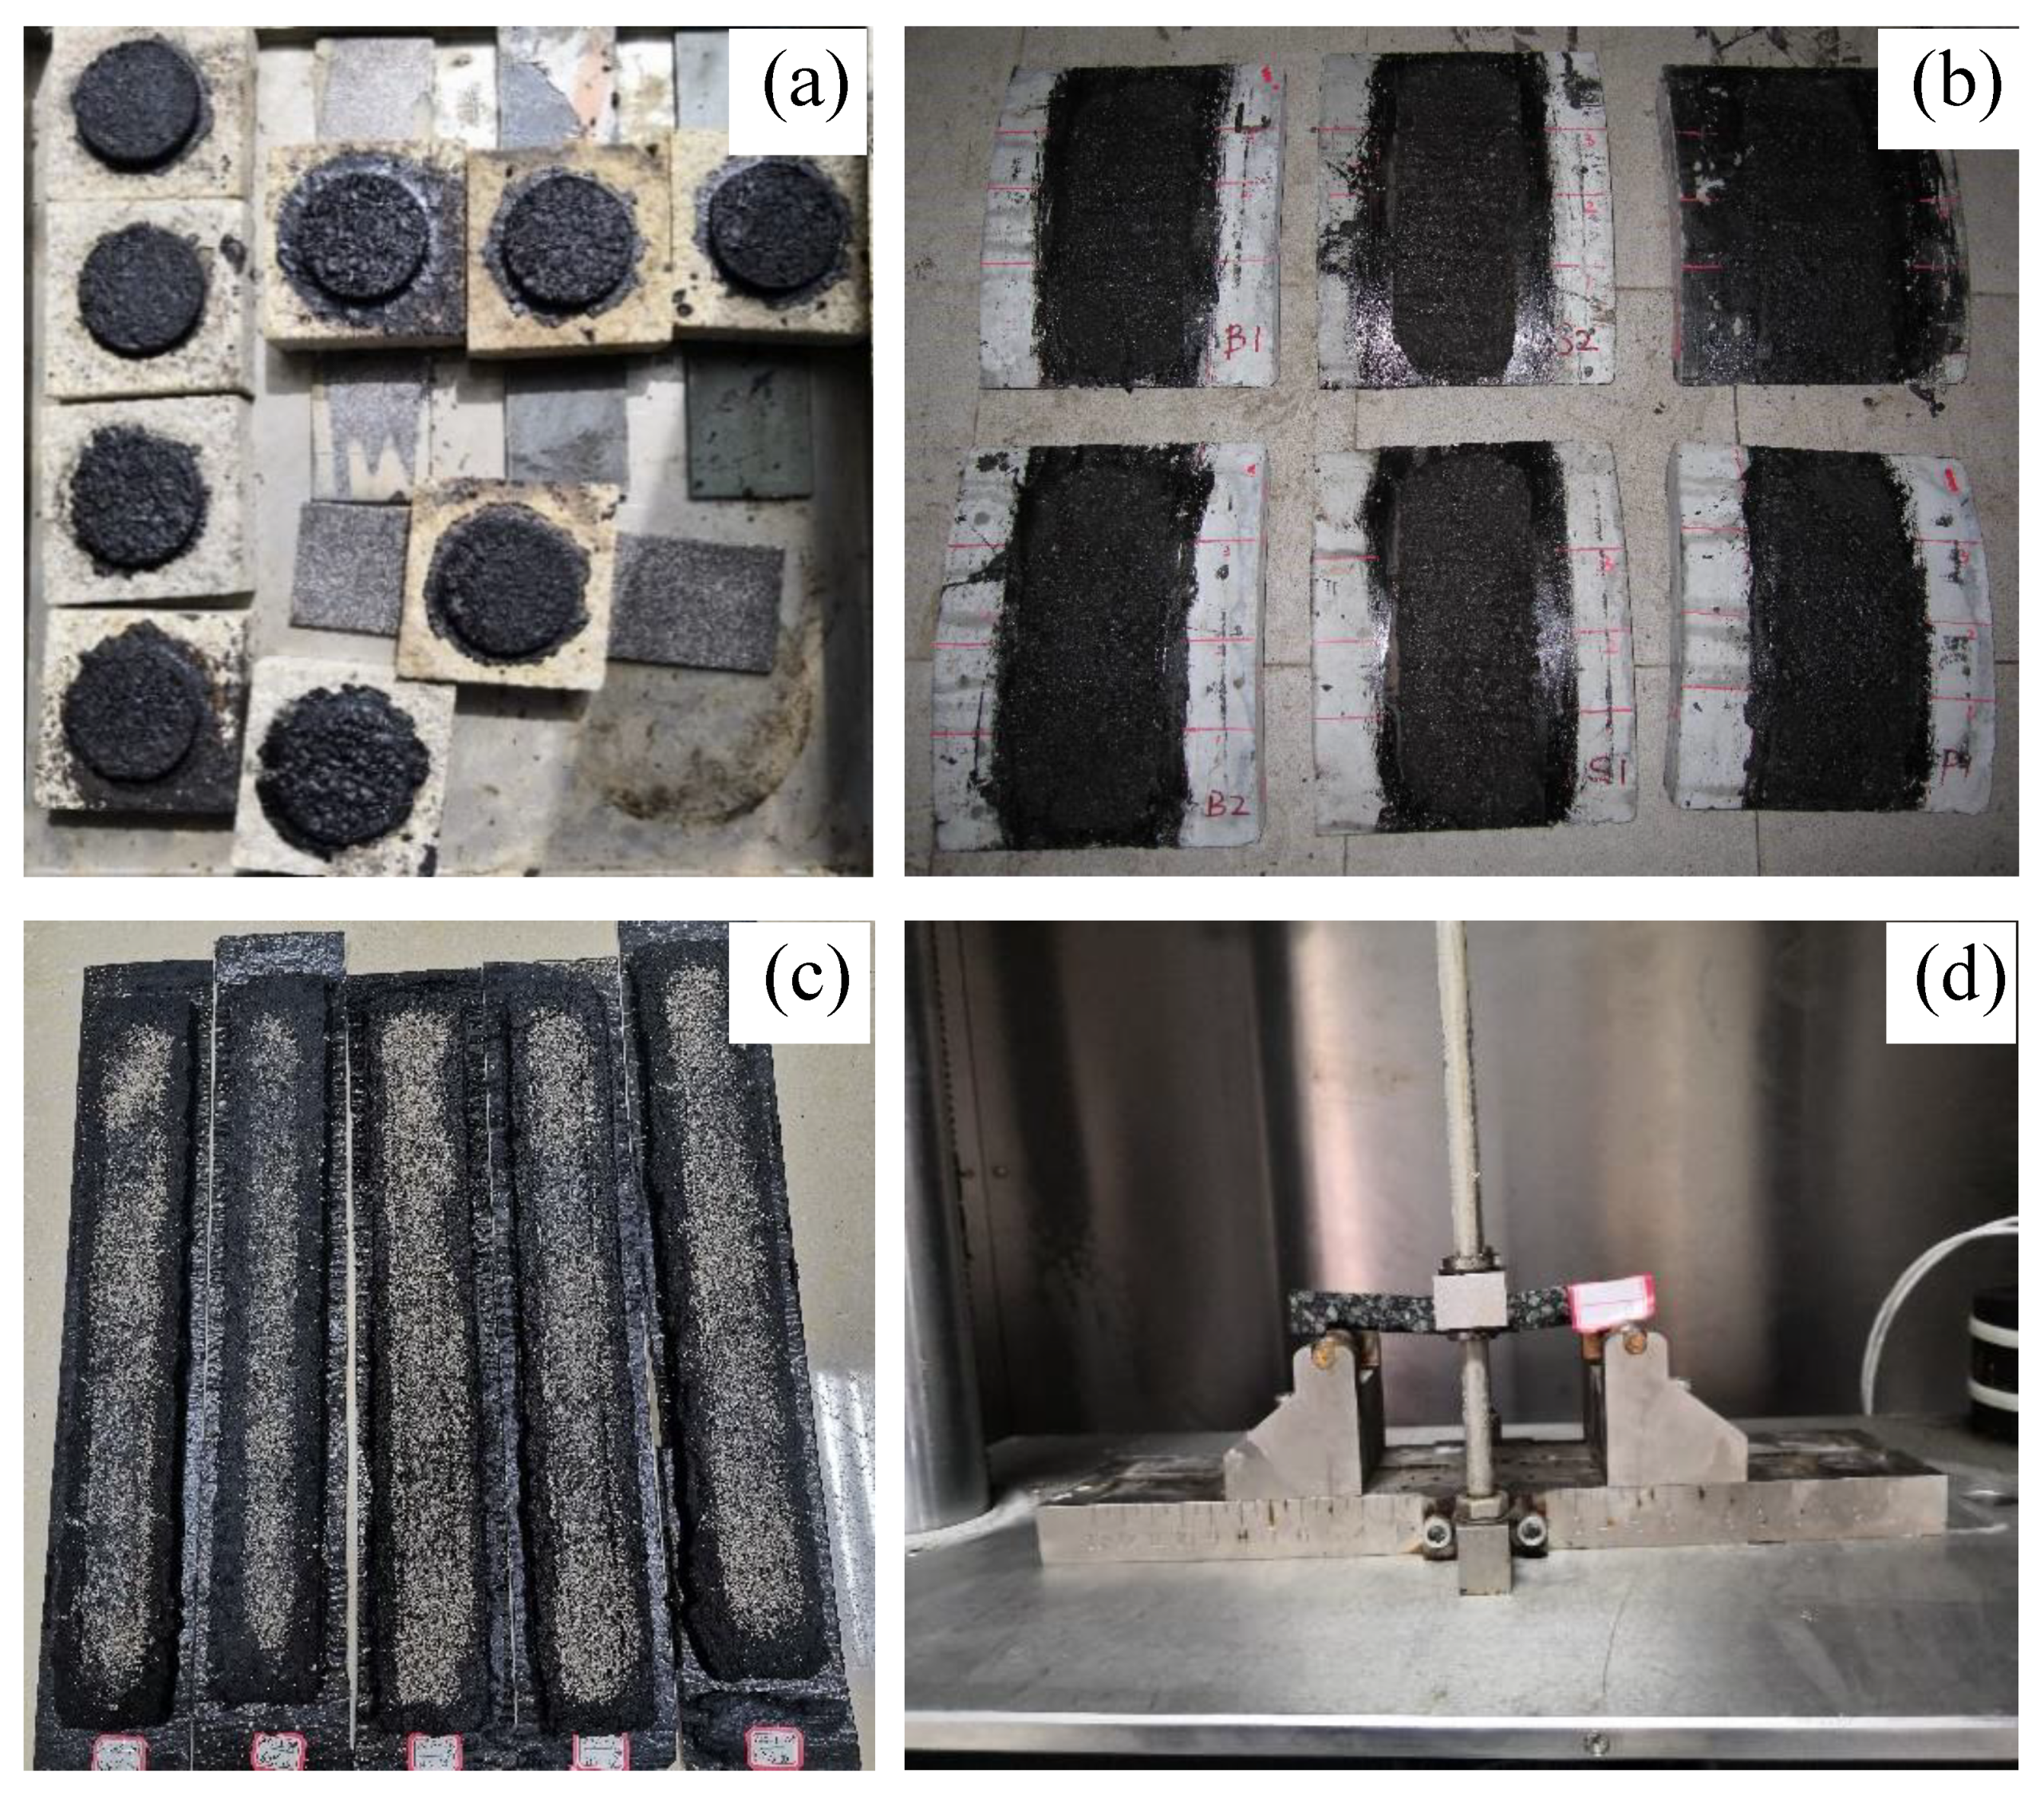
3.1. Mixture Bond Strength (MBS) Test
3.2. Driving Wheel Pavement Analyzer (DWPA) Test
3.3. Rutting Resistance and Surfacing Bleeding
3.3.1. Multi-Stress Creep Recovery (MSCR) Test
3.3.2. Loaded Wheel Test (LWT)
3.4. Low-Temperature Resistance Test
3.5. Optimum Material Parameters and Experimental Design Using RSM
4. Results and Discussion
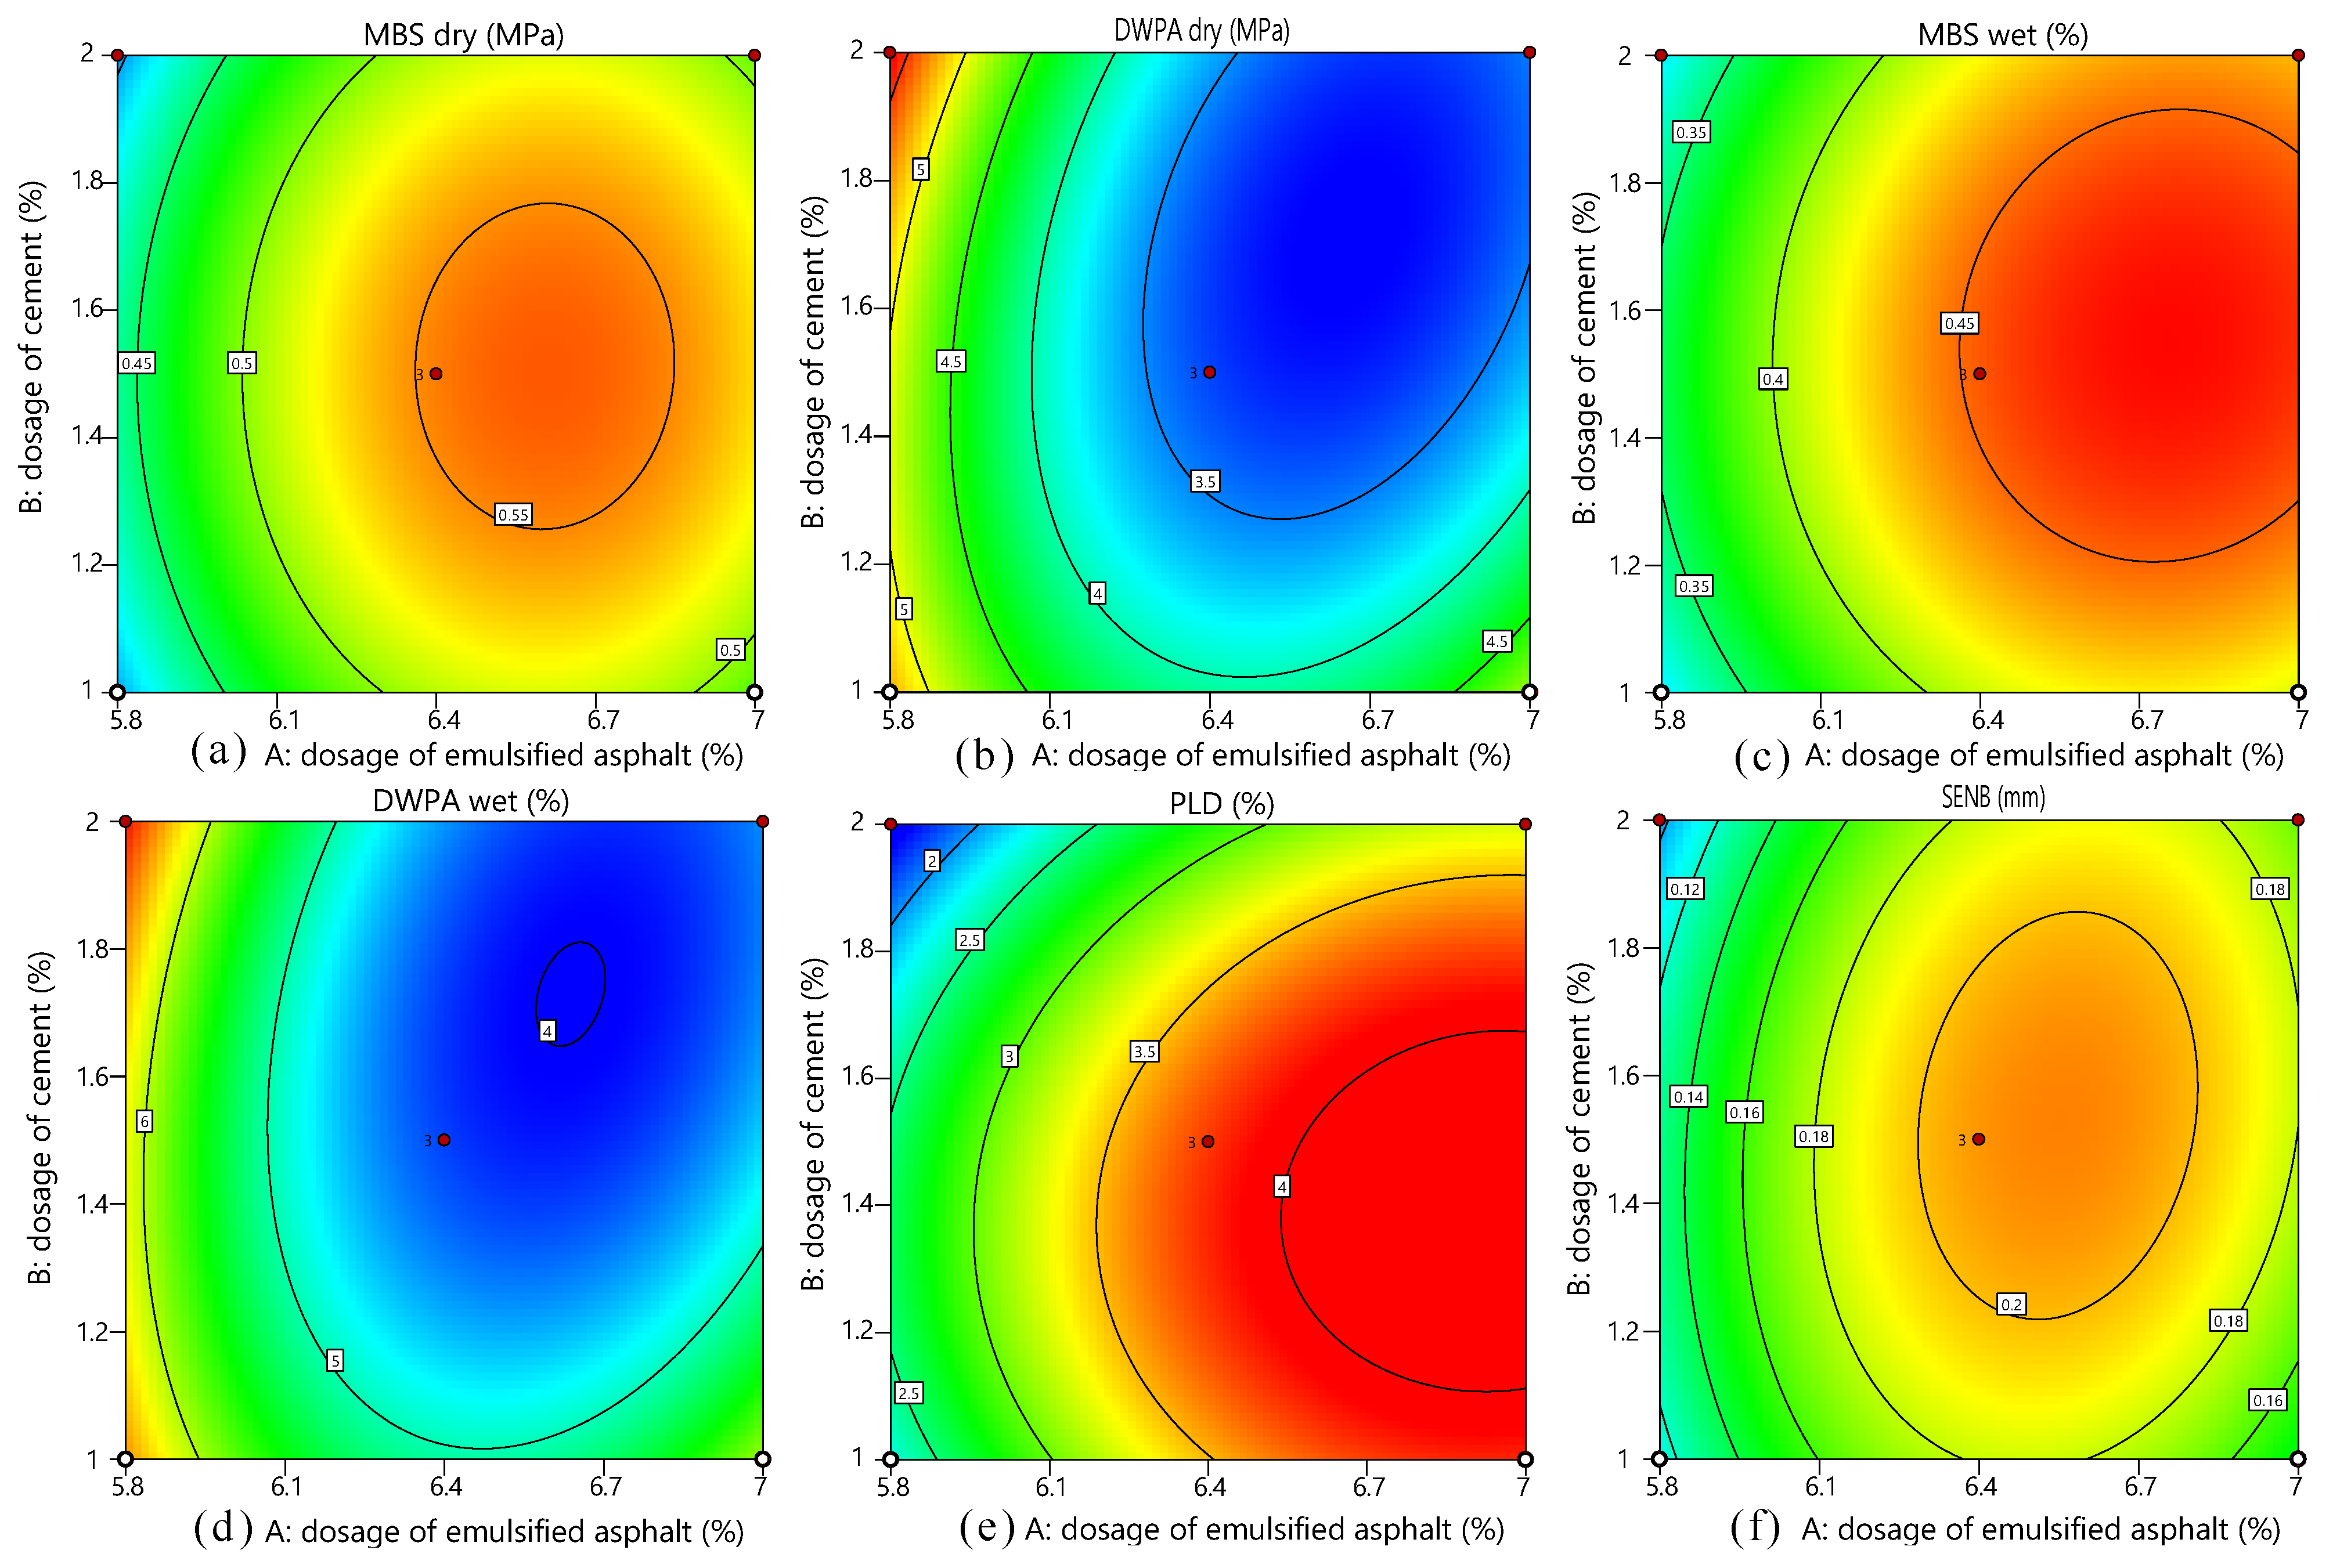
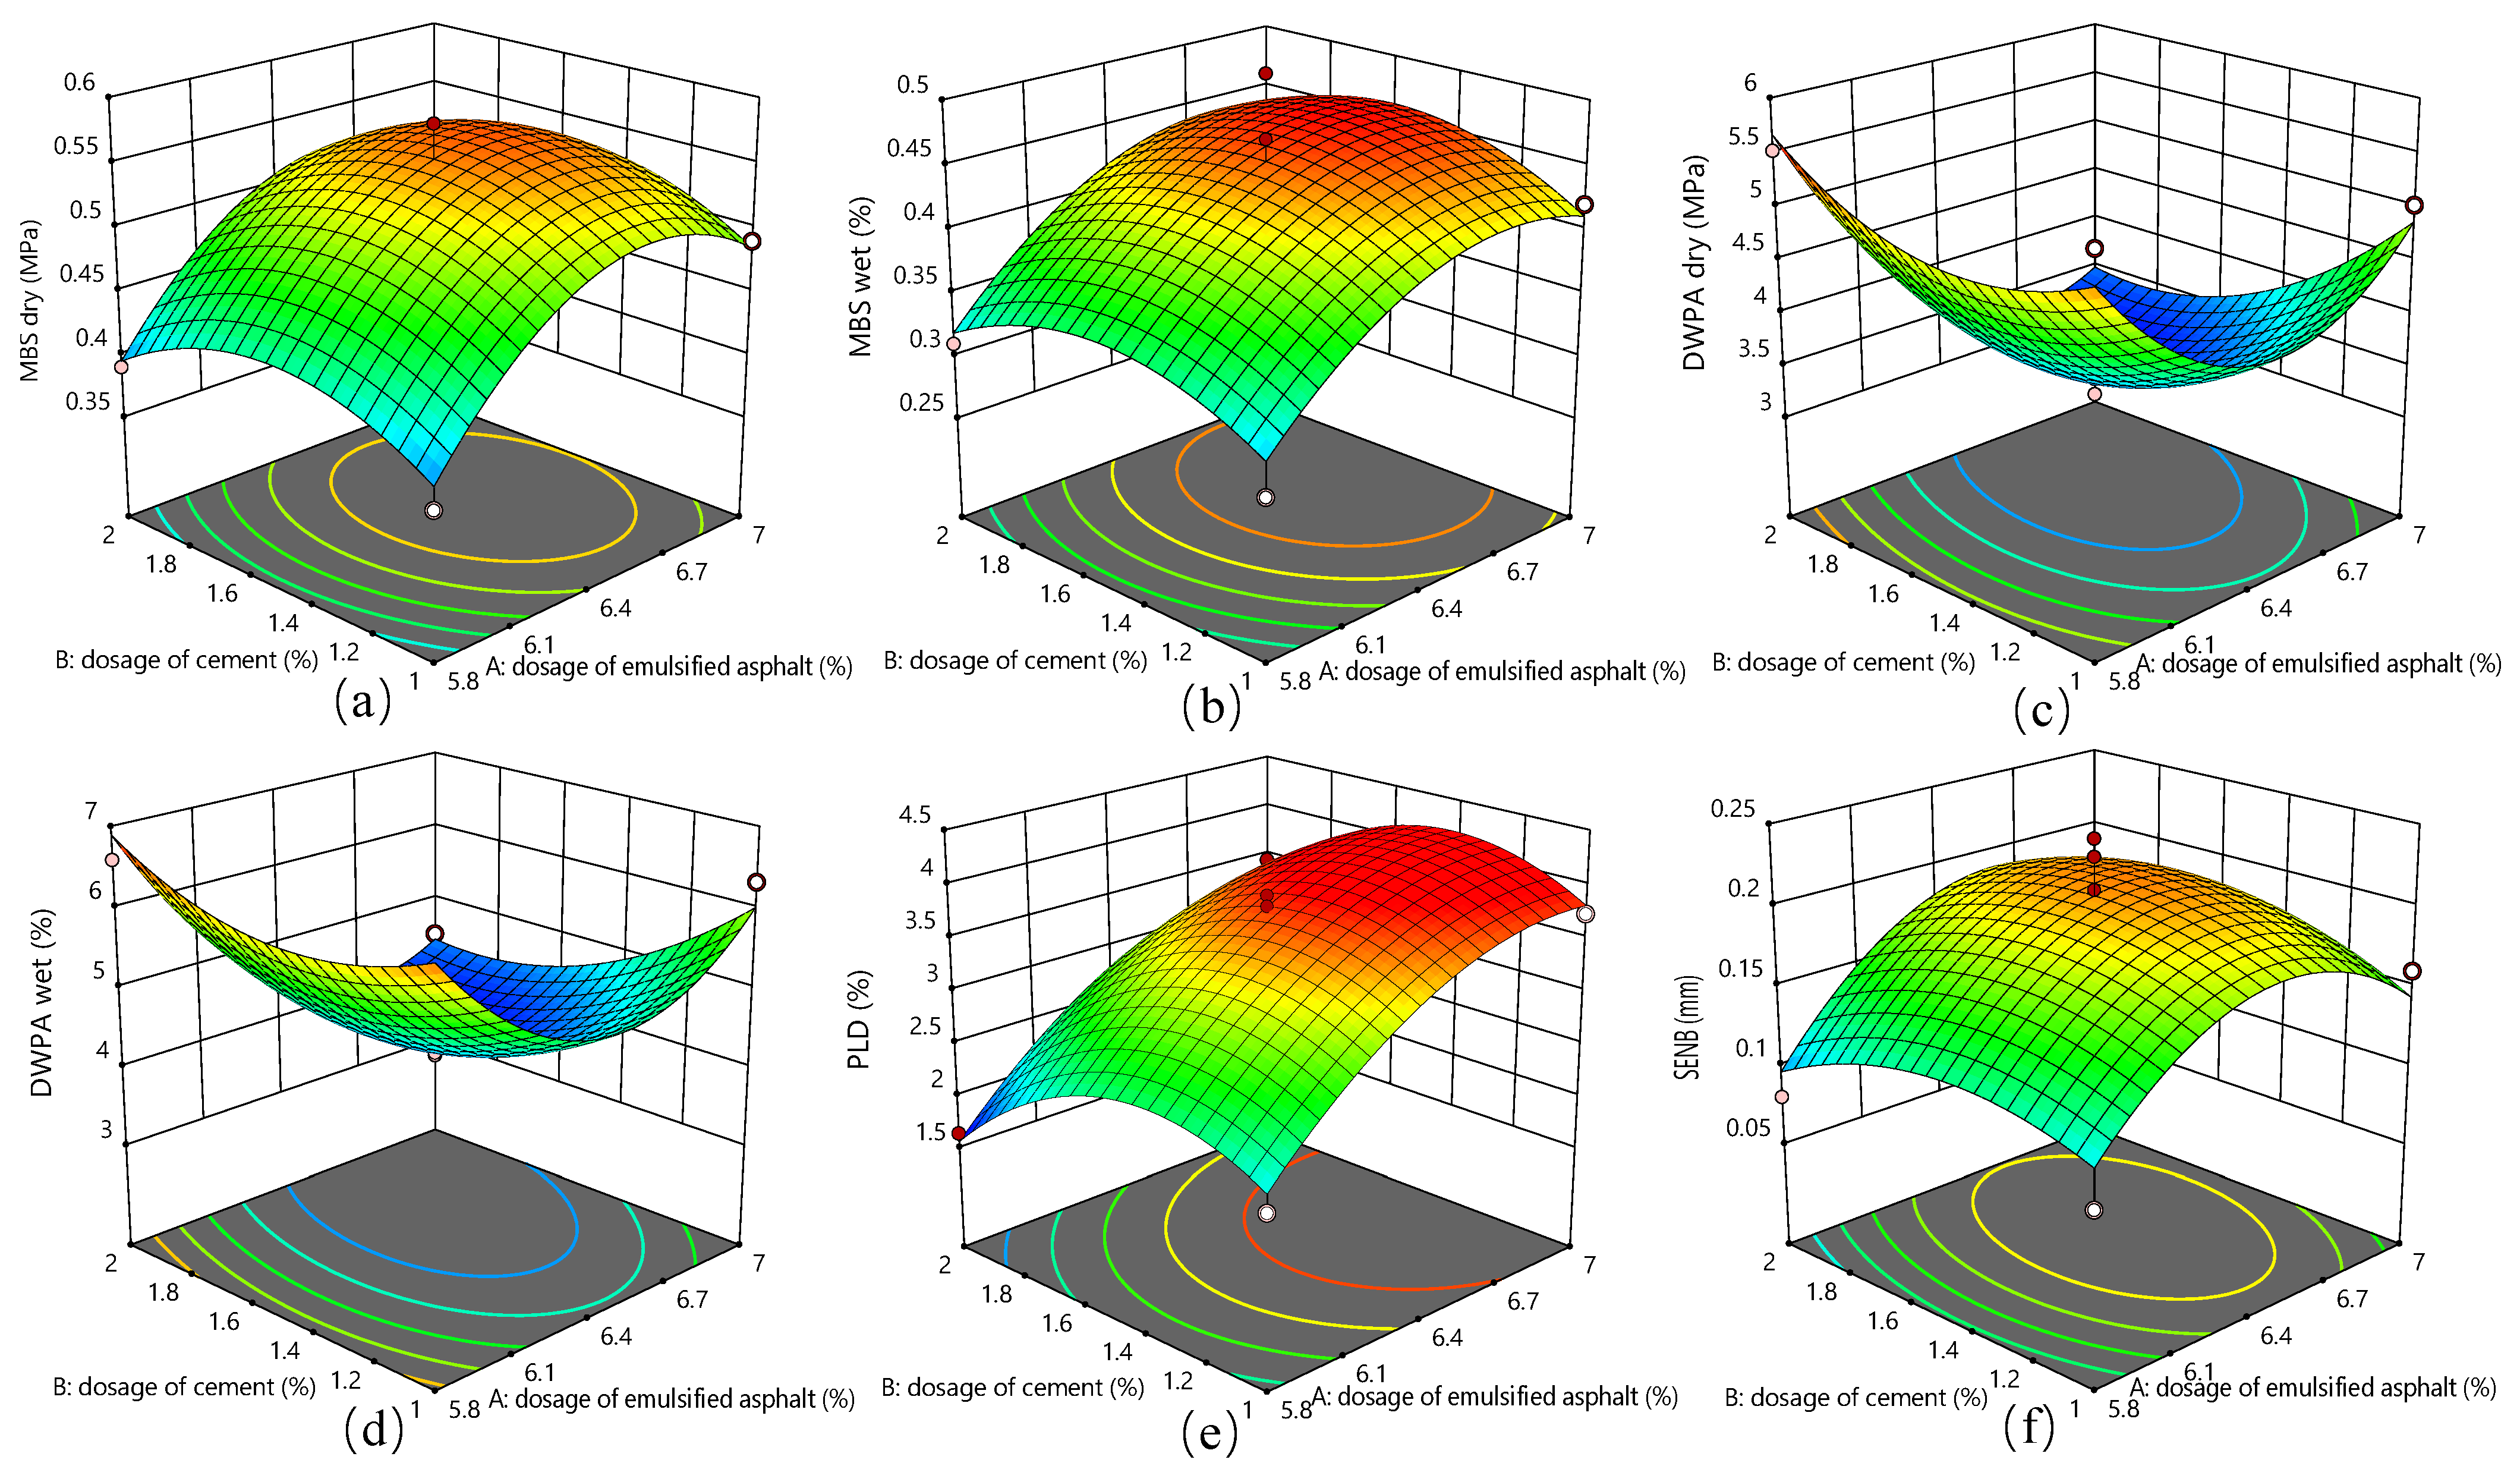
4.1. Optimum Comprehensive Properties Determination
4.2. High-Temperature Deformation Resistance Results and Analysis
5. Conclusions
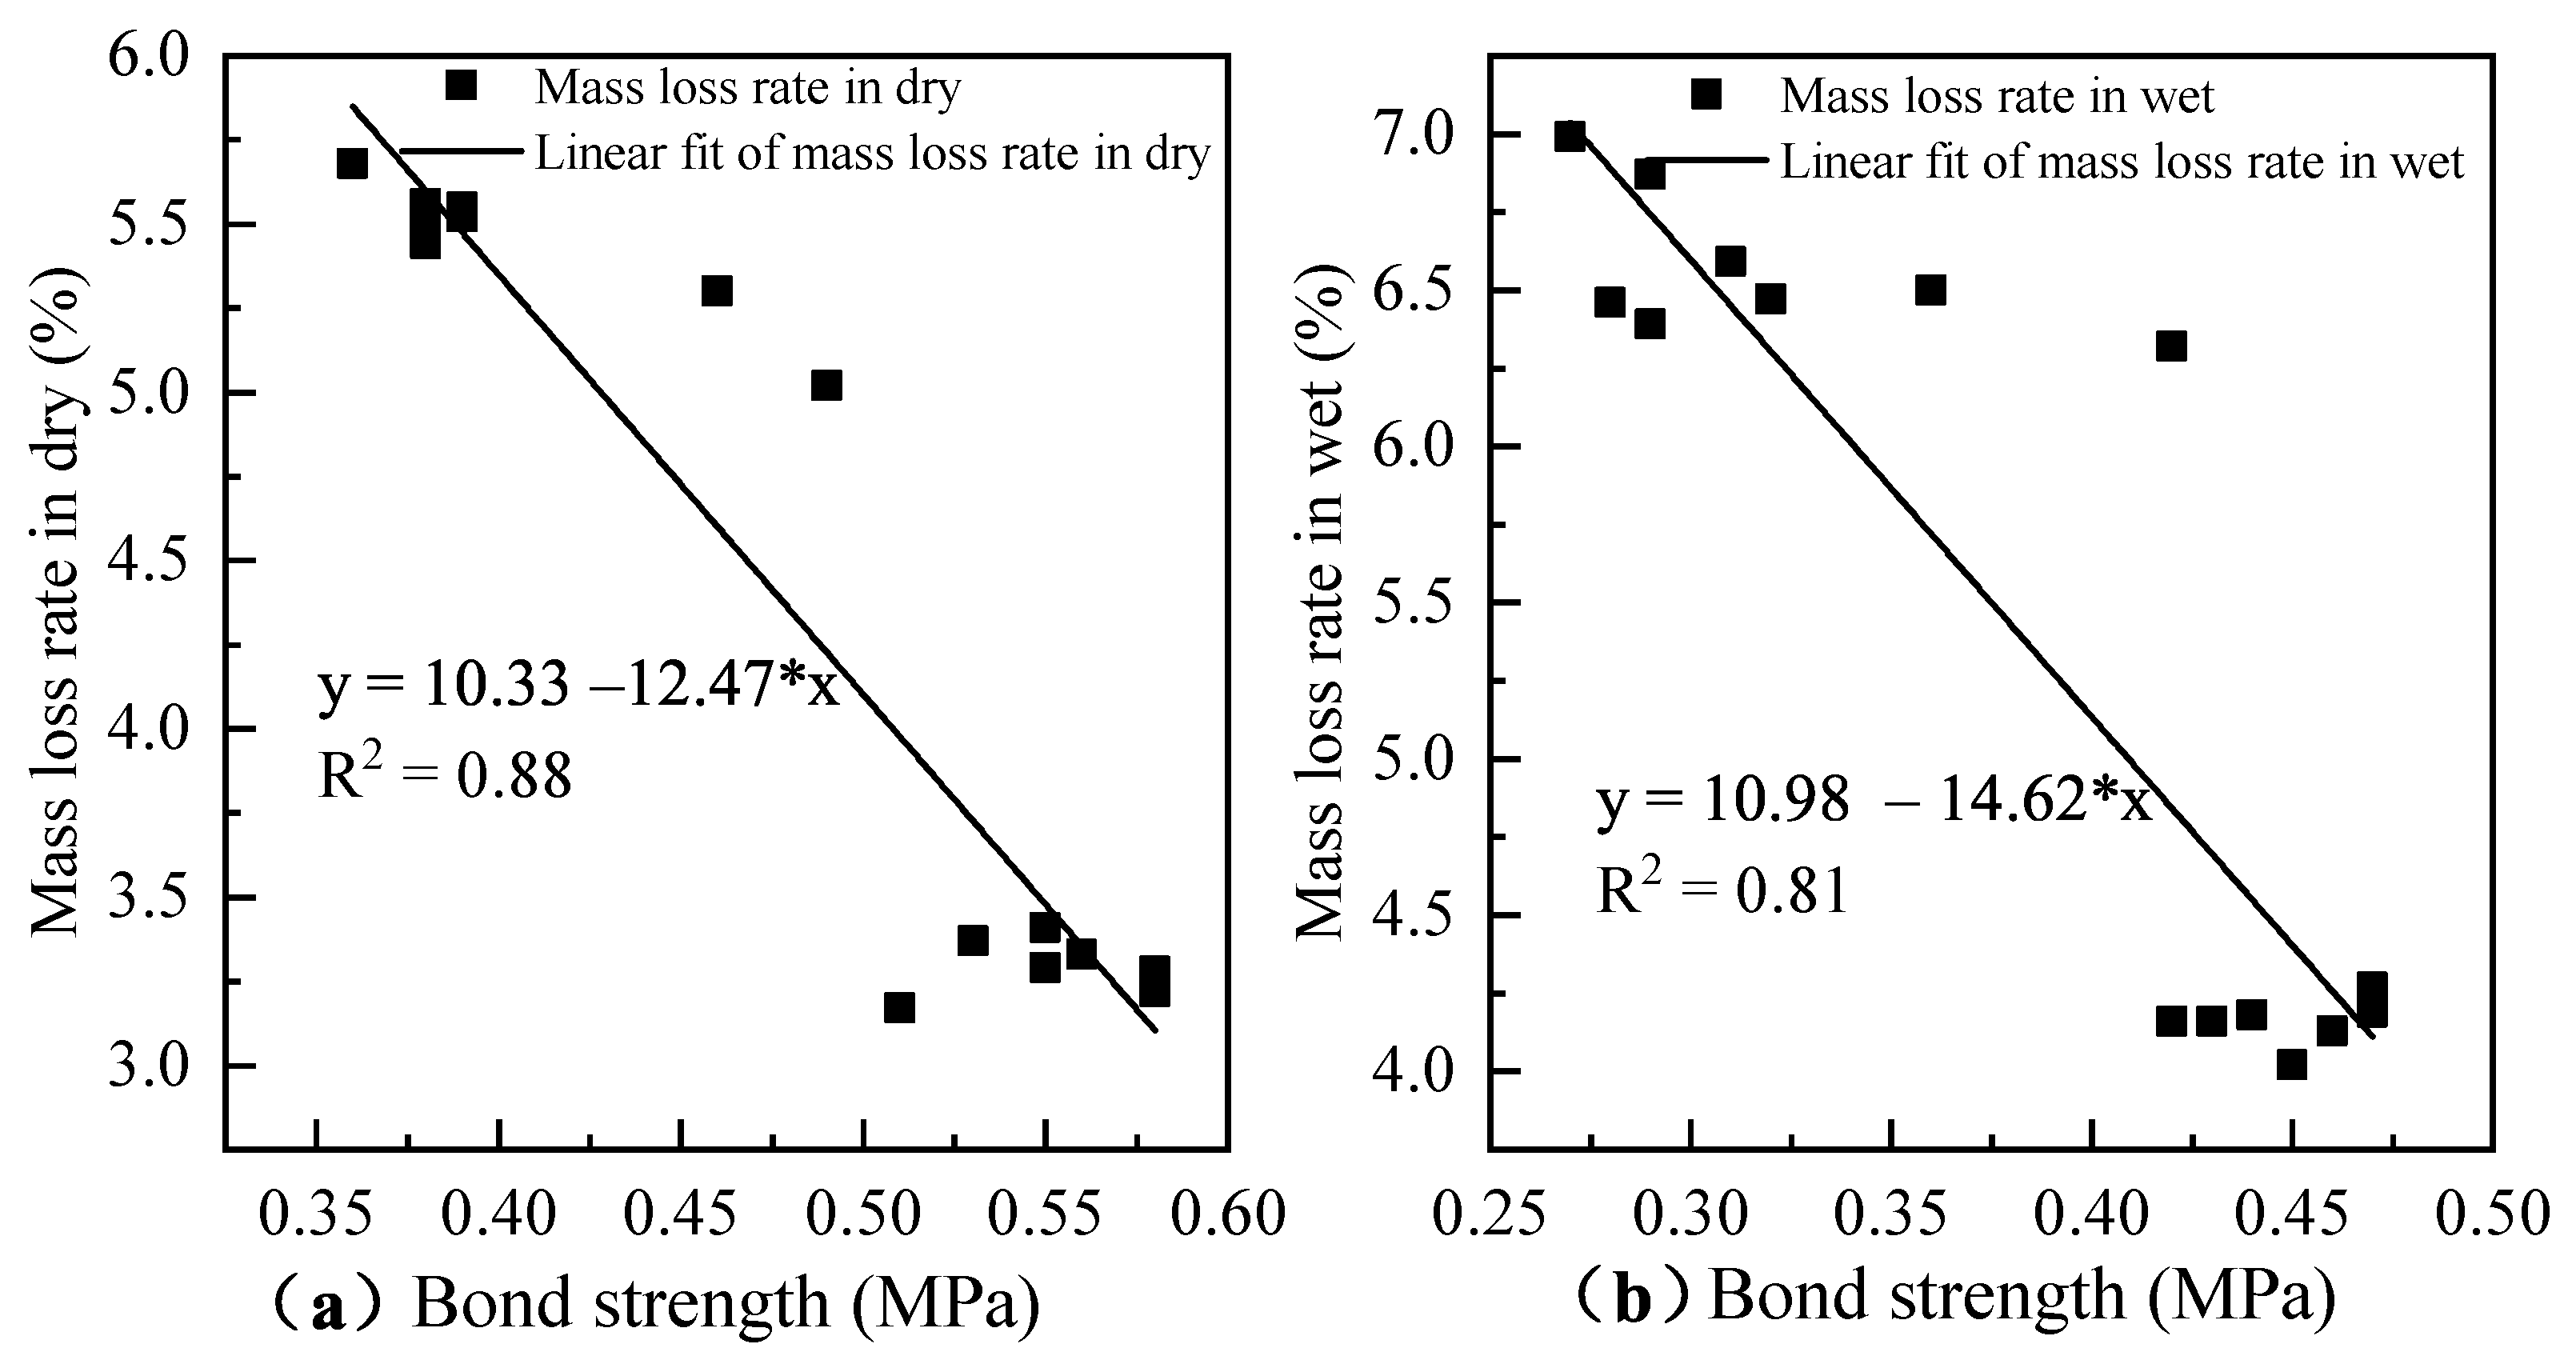
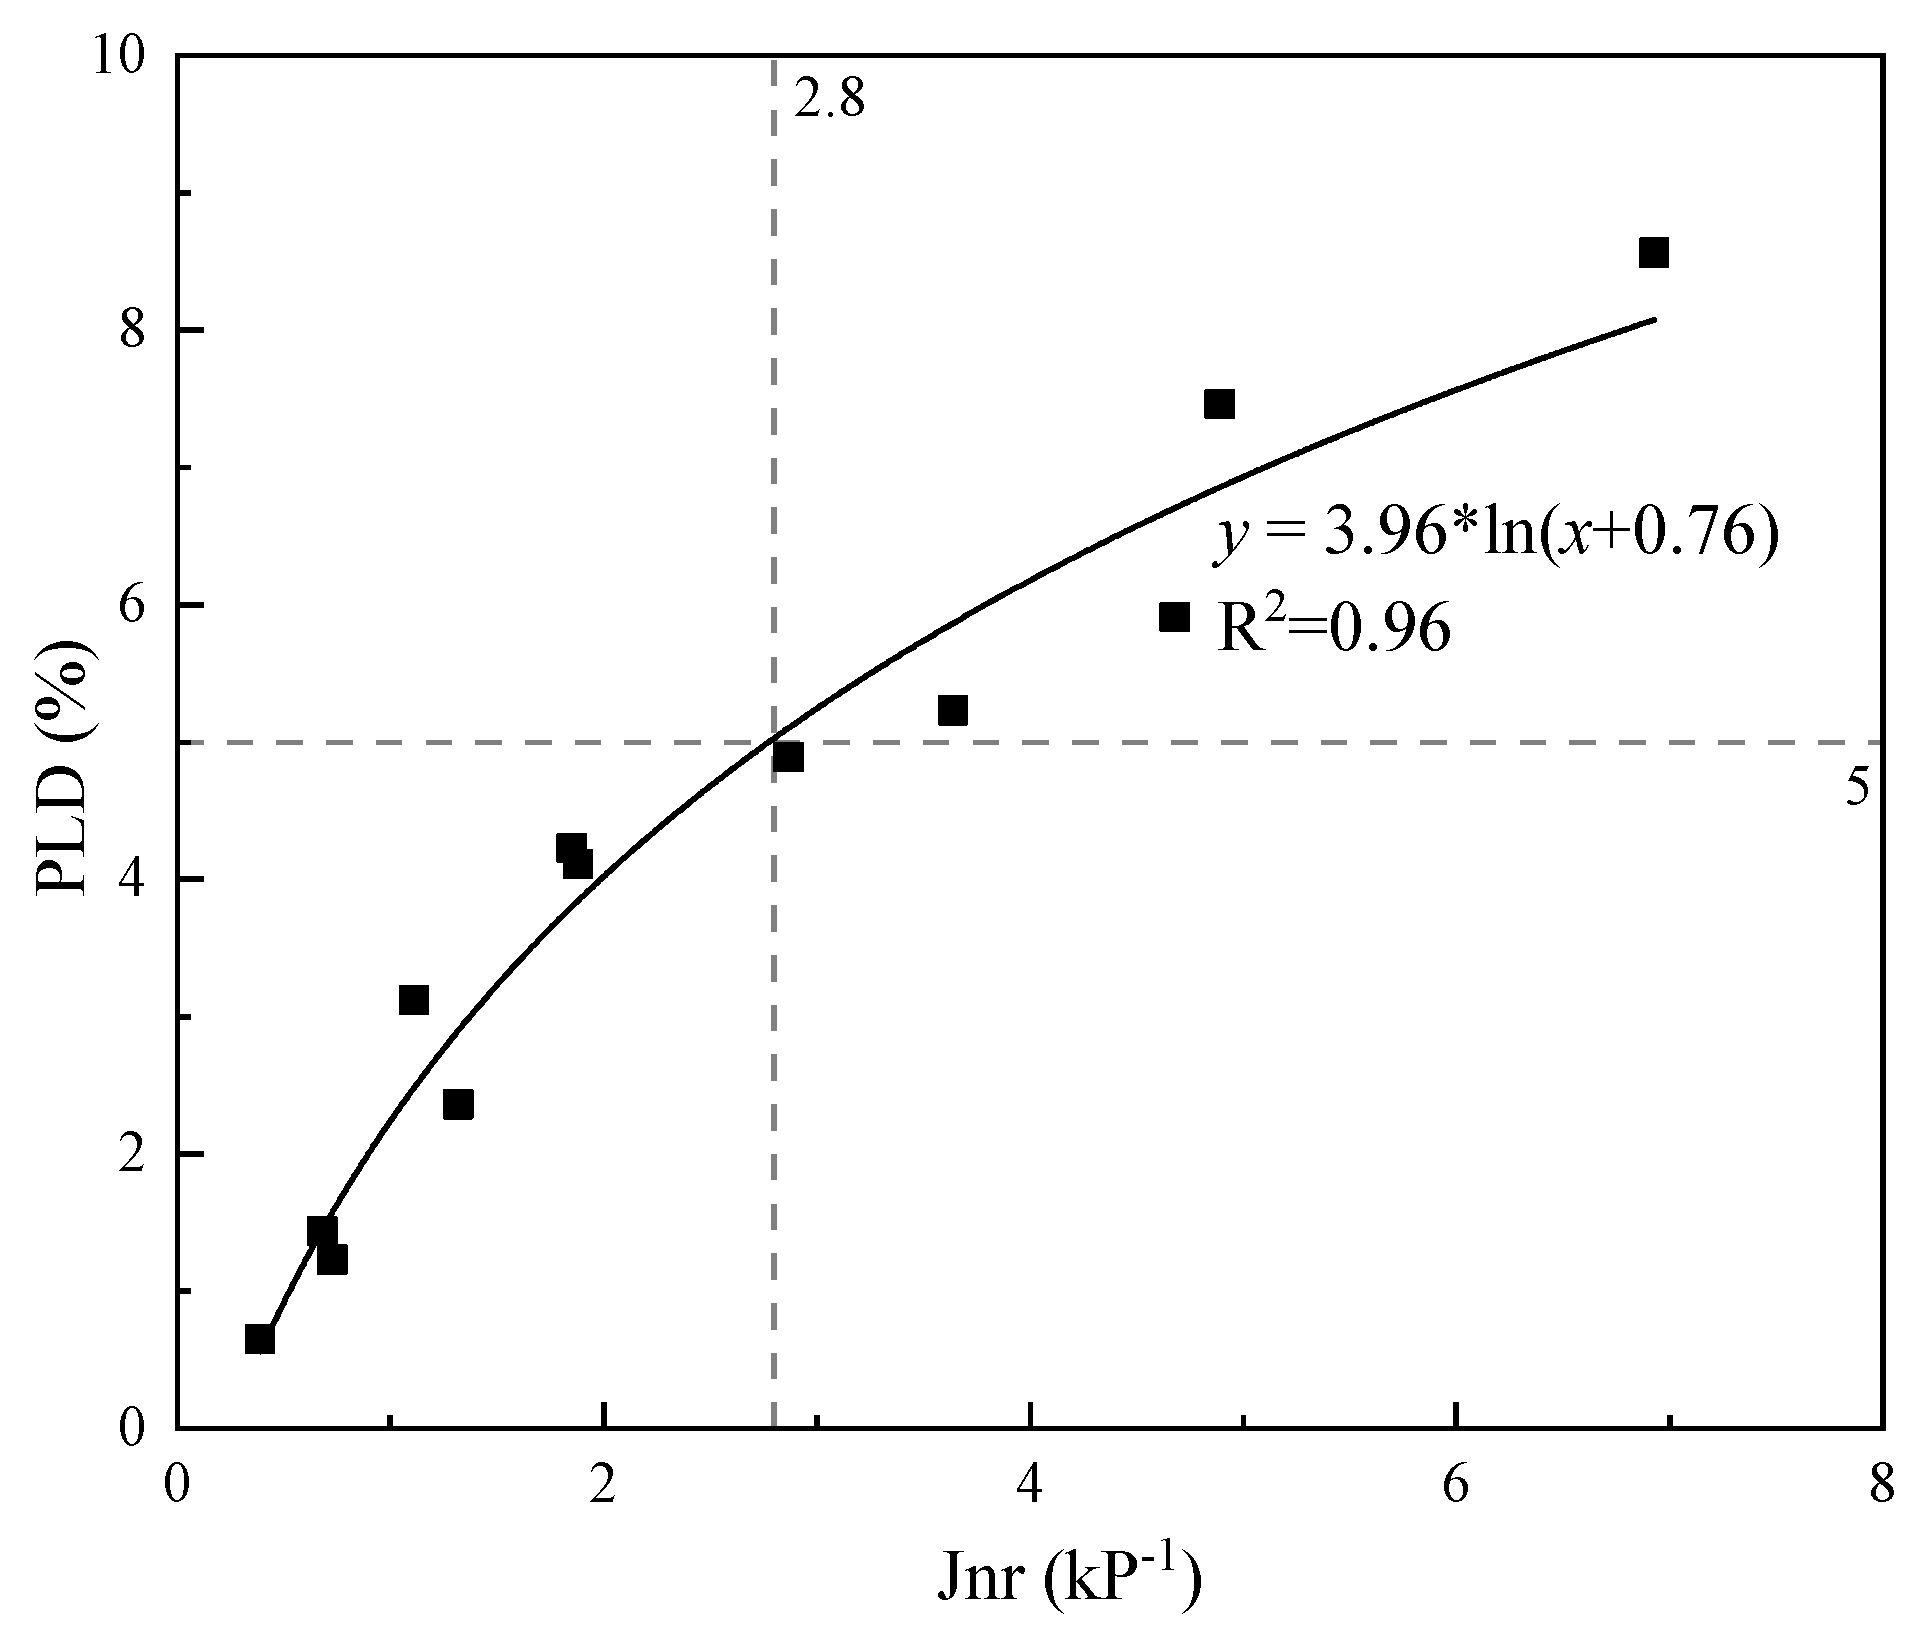
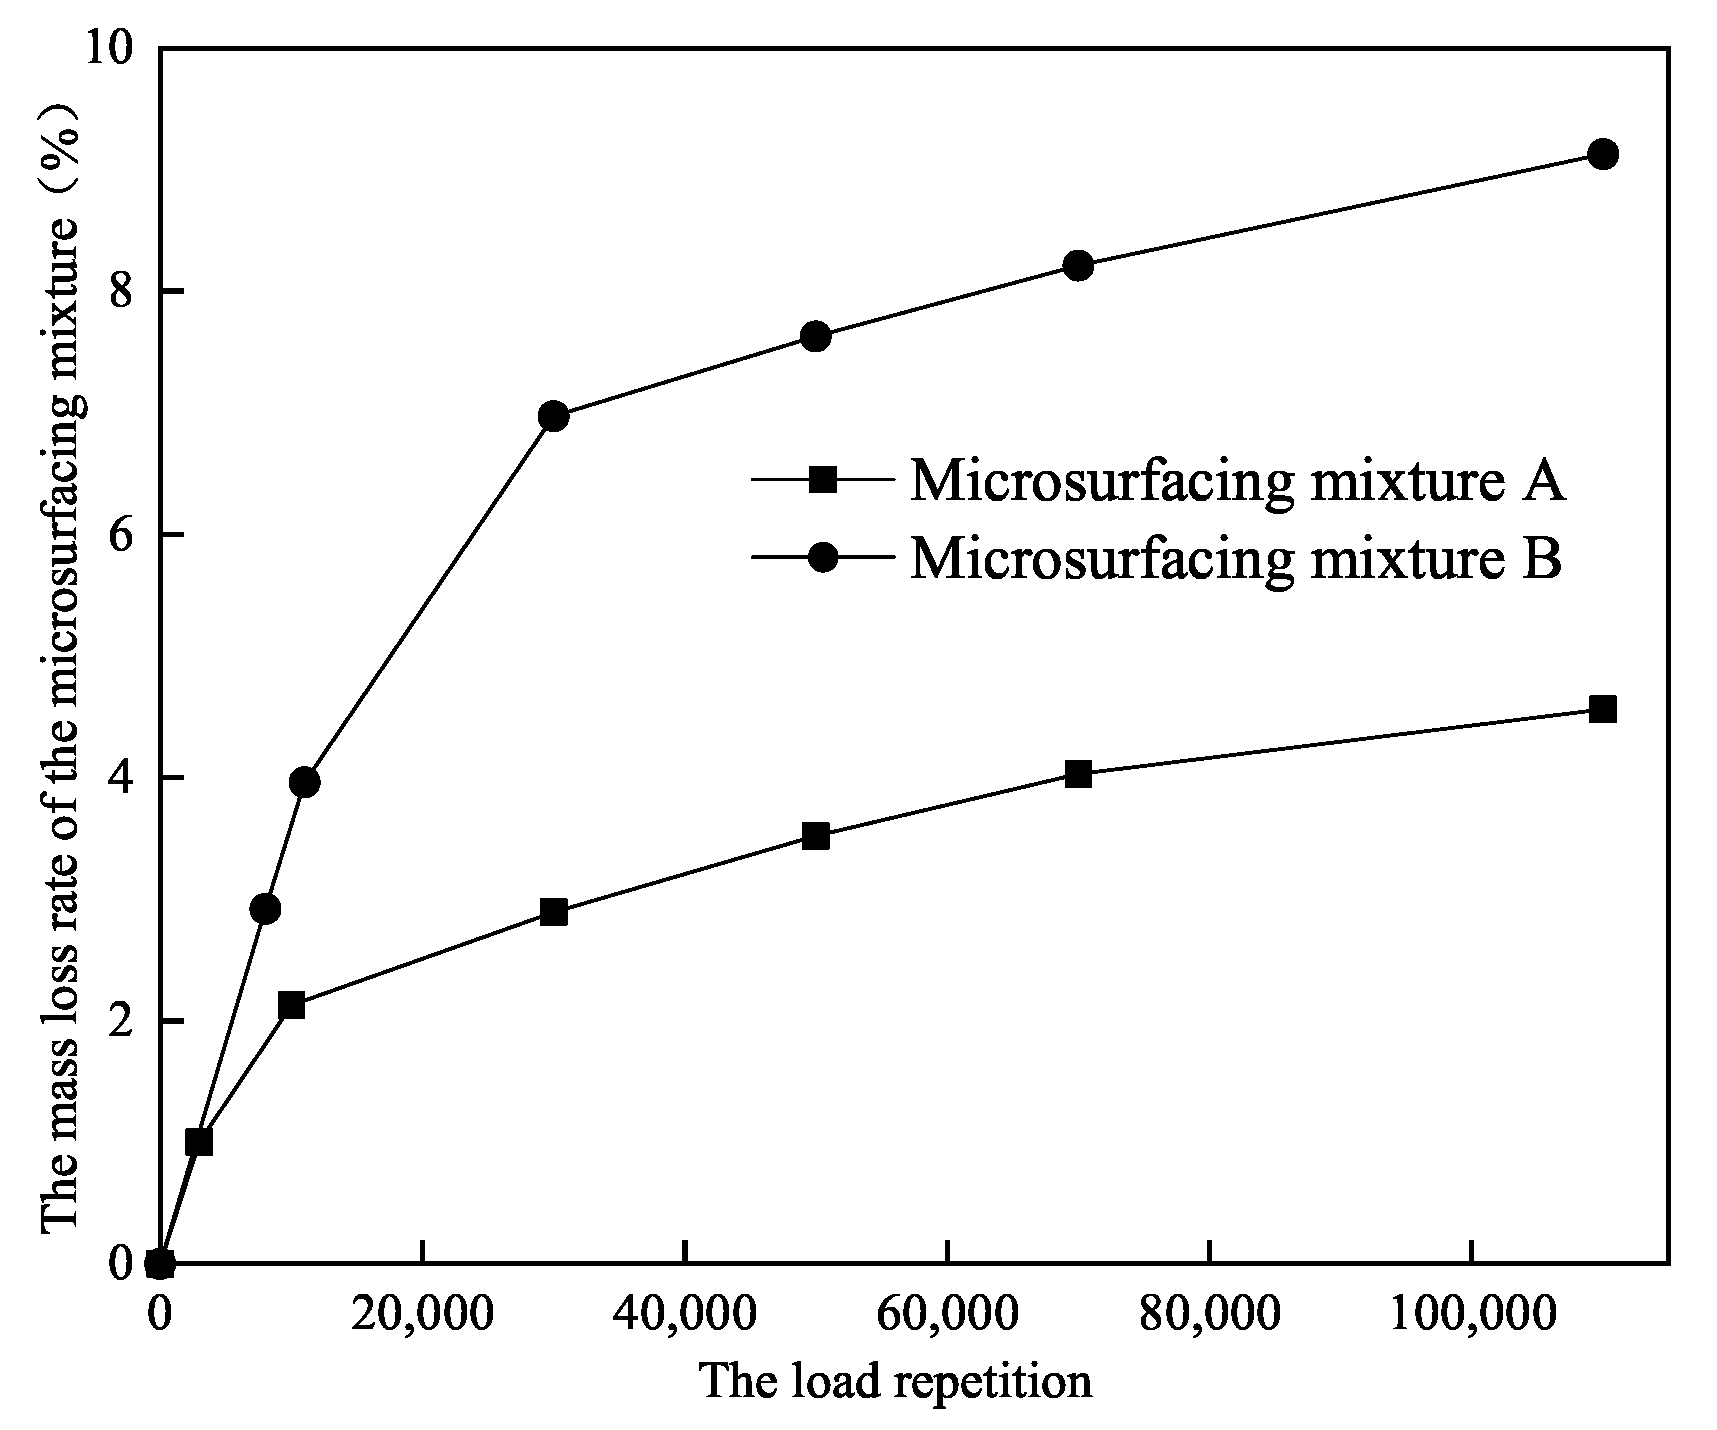
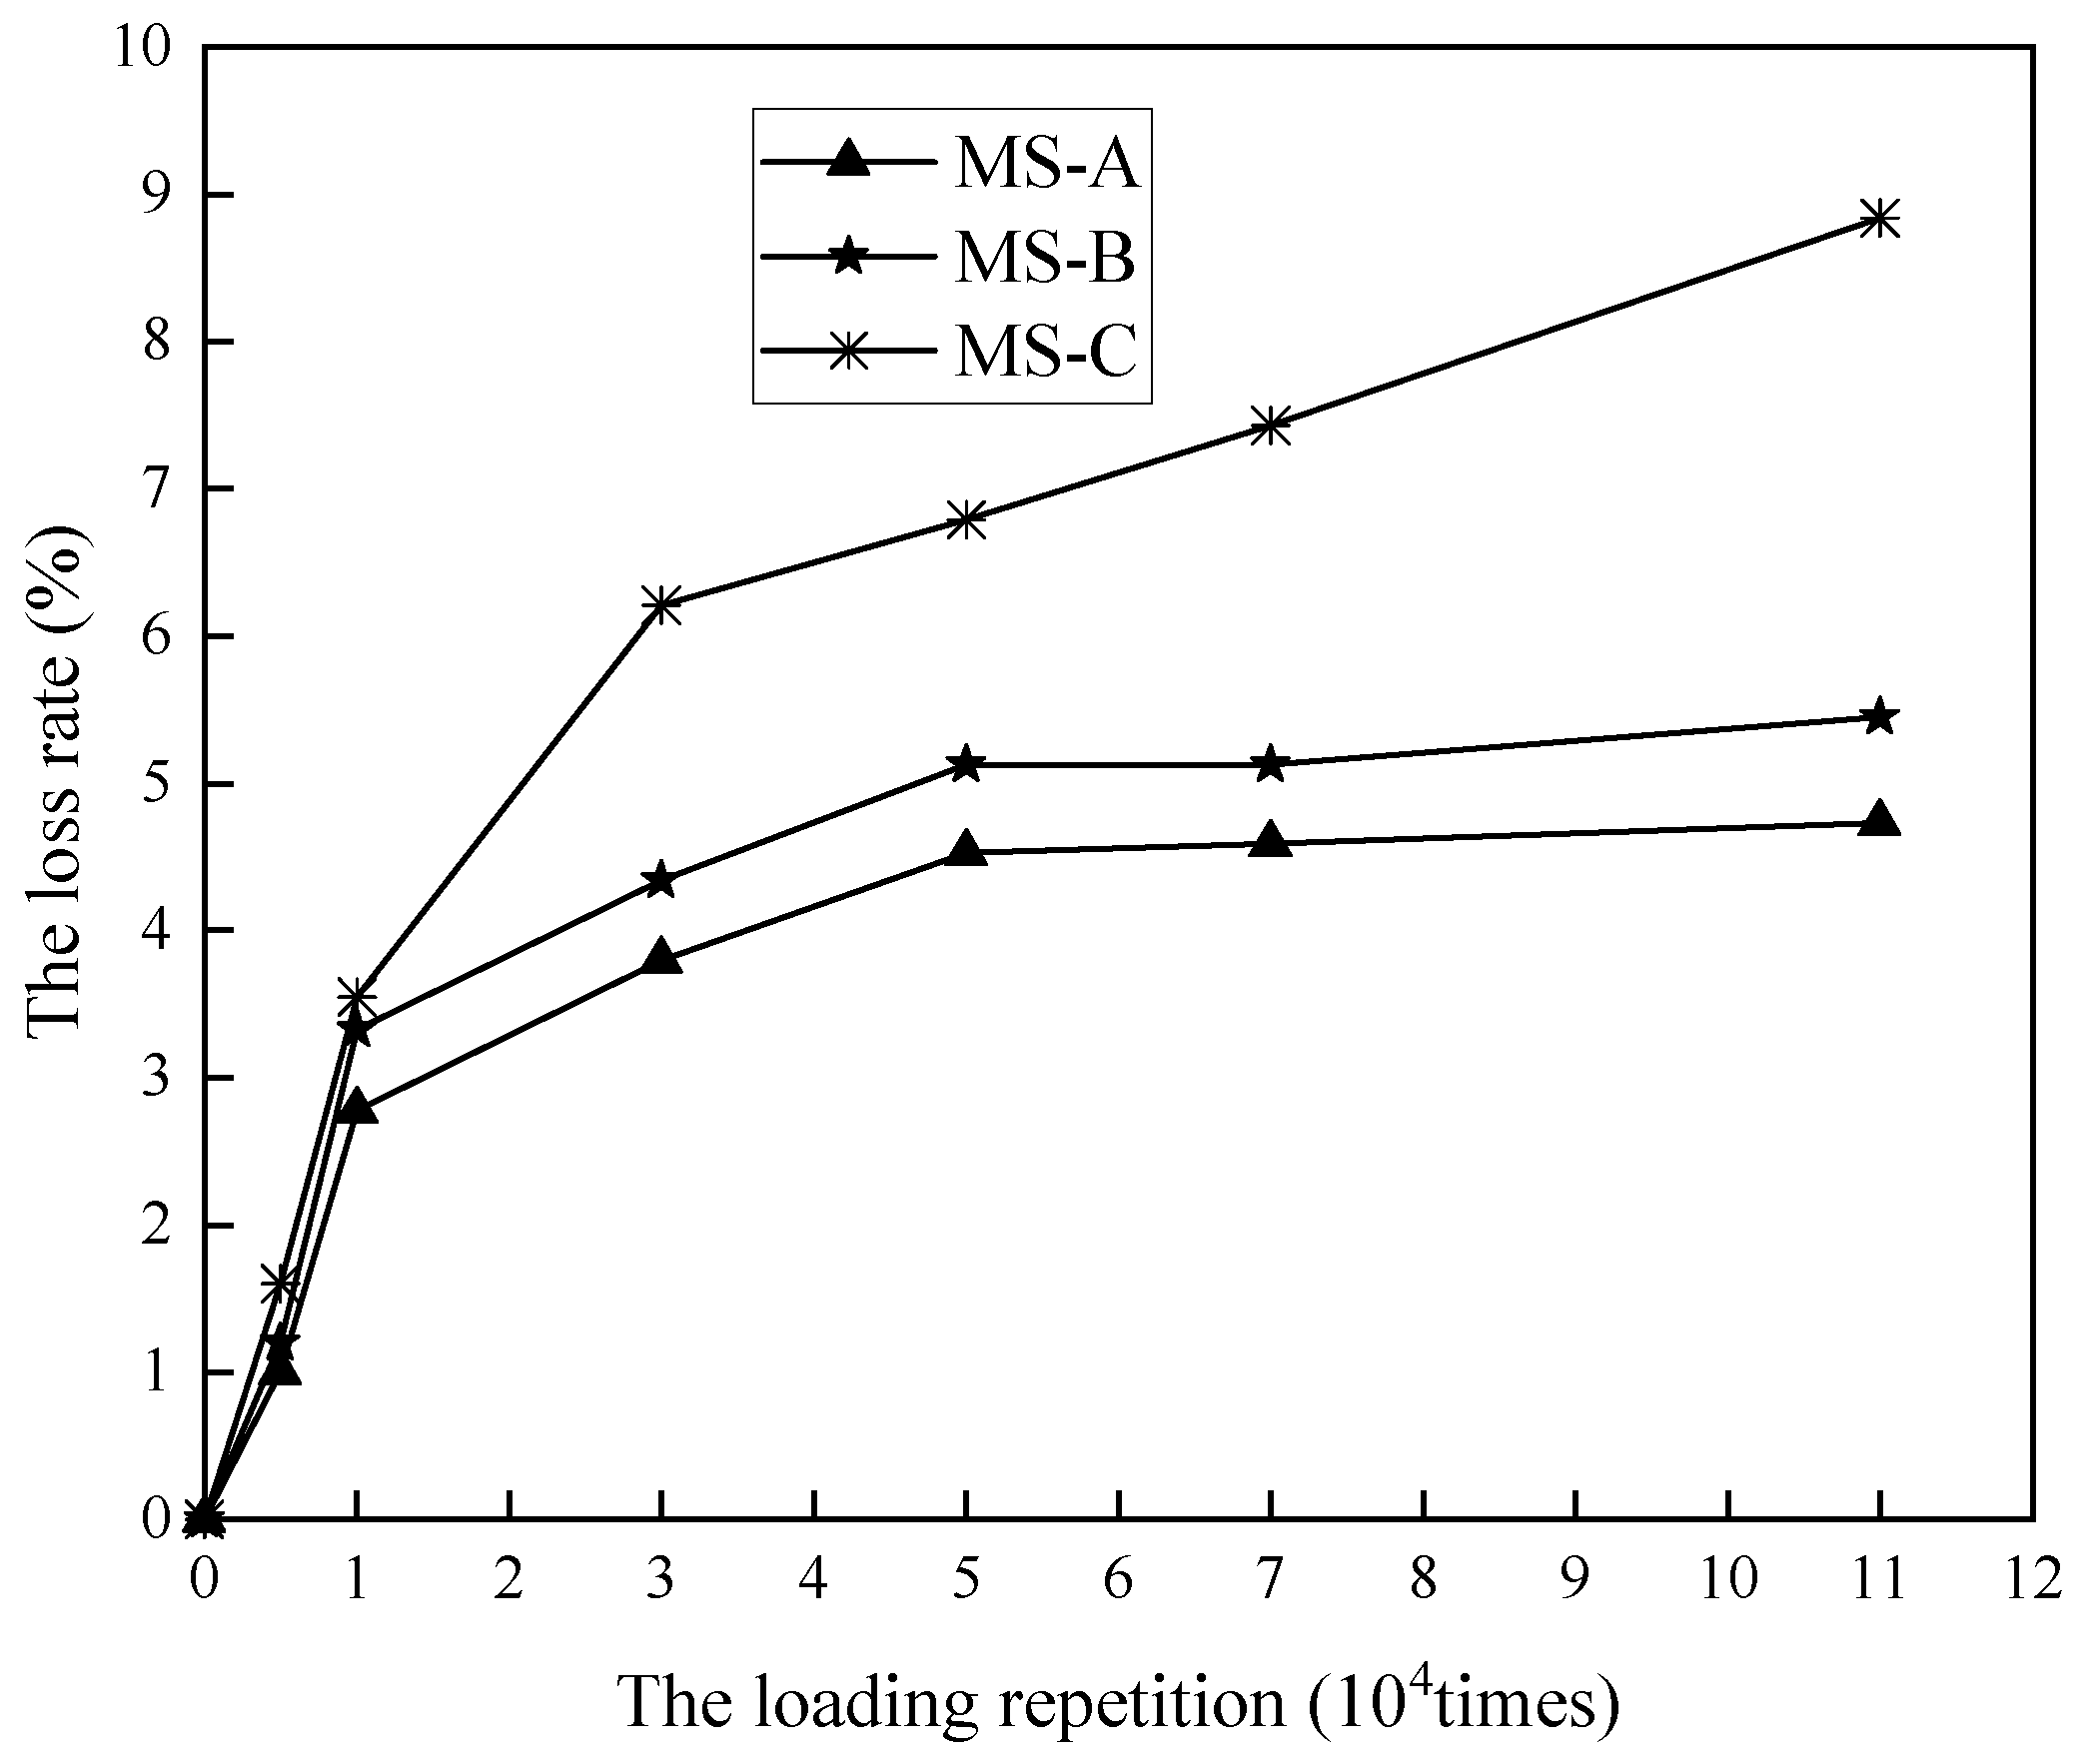
- When the DWPA test load was performed 10,000 times, the mass loss rate appears at the inflection point, and tends to be stable when the DWPA test load was performed 50,000 times; therefore, the DWPA test is recommended as the test index of bonding performance of microsurfacing mixture.
- Considering adhesive strength, rutting, and cracking resistance, microsurfacing incorporated with 6.5% modified asphalt emulsion, 1.5% cement, and curing at a temperature of 60 °C has optimum comprehensive characteristics. The order of influence on comprehensive performance is asphalt content, temperature, and cement content.
- The value of evaporation residue is an important factor affecting the high temperature stability of mixture, which is slightly lower than the requirement of HMA. The low-temperature cracking resistance of mixture depends on the creep stiffness of evaporation residue.
- The adhesive, rutting, and cracking resistance can be characterized by MBS, DWPA, LWT, and SENB test results. This study proposes to comprehensively utilize those parameters as quantitative evaluation indexes of microsurfacing performance.
Author Contributions
Funding
Institutional Review Board Statement
Informed Consent Statement
Data Availability Statement
Acknowledgments
Conflicts of Interest
References
- Gransberg, D.D. Microsurfacing; Number 411 in NCHRP Synthesis; Transportation Research Board: Washington, DC, USA, 2010. [Google Scholar]
- Broughton, B.; Lee, S.J. Microsurfacing as a preventative maintenance program in Texas. Int. J. Pavement Res. Technol. 2012, 5, 405–410. [Google Scholar]
- Robati, M.; Carter, A.; Perraton, D. Repeatability and reproducibility of micro-surfacing mixture design tests and effect of aggregates surface areas on test results. Aust. J. Civ. Eng. 2016, 11, 17. [Google Scholar] [CrossRef]
- Robati, M.; Carter, A.; Perraton, D. Evaluation of a modification of current microsurfacing mix design procedures. Can. J. Civ. Eng. 2015, 42, 319–328. [Google Scholar] [CrossRef] [Green Version]
- Broughton, B.; Lee, S.J.; Kim, Y.J. 30 years of microsurfacing: A review. ISRN Civ. Eng. 2012, 2012, 1–7. [Google Scholar] [CrossRef] [Green Version]
- MOHAMMAD, I. Development of Performance-Related Specification for Fresh Emulsions Used for Surface Treatments and Performance Study of Chip Seals and Microsurfacing. Ph.D. Thesis, North Carolina State University, Raleigh, NC, USA, 2015. [Google Scholar]
- Barcena, R.; Epps Martin, A.; Hazlett, D. Performance-graded binder specification for surface treatments. Transp. Res. Rec. J. Transp. Res. Board 2002, 1810, 63–71. [Google Scholar] [CrossRef] [Green Version]
- Kim, Y.R.; Adams, J.; Castorena, C.; Ilias, M.; Im, J.H.; Bahia, H.; Chaturabong, P.; Hanz, A.; Johannes, P.T. Performance-Related Specifications for Emulsified Asphaltic Binders Used in Preservation Surface Treatments; Number Project 09-50; Transportation Research Board: Washington, DC, USA, 2017. [Google Scholar]
- Vijaykumar, A.; Martin, A.E.; Arambula, E. Revision and further validation of surface performance-graded specification for chip seal binders. Transp. Res. Rec. J. Transp. Res. Board 2013, 2370, 44–52. [Google Scholar] [CrossRef]
- AASHTO. PP72. 11: Standard Practice for Recovering Residue from Emulsified Asphalt Using Low-Temperature Evaporative Techniques; AASHTO: Washington, DC, USA, 2011. [Google Scholar]
- AASHTO, MP19: Standard Specification for Performance-Graded Asphalt Binder Using Multiple Stress Creep Recovery (MSCR) Test; American Association of State and Highway Transportation Officials: Washington, DC, USA, 2010.
- Asphalt, E. Progress toward Performance-Graded Emulsified Asphalt Specifications; Transportation Research Board: Washington, DC, USA, 2013. [Google Scholar]
- Shackil, G.; Ali, A.; Mehta, Y.; Papuc, D. Evaluating the laboratory cracking performance of pavement preservation materials using the Texas overlay tester. Constr. Build. Mater. 2020, 262, 120802. [Google Scholar] [CrossRef]
- Broughton, B.; Lee, S.J. Microsurfacing in Texas; Technical Report; Texas Transportation Institute: College Station, TX, USA, 2012. [Google Scholar]
- Al-Hdabi, A.; Al Nageim, H.; Seton, L. Superior cold rolled asphalt mixtures using supplementary cementations materials. Constr. Build. Mater. 2014, 64, 95–102. [Google Scholar] [CrossRef]
- Liu, L.; Gharaibeh, N.G. Simulation-based methodology for developing performance-related specifications for pavement preservation treatments. J. Transp. Eng. 2015, 141, 04015011. [Google Scholar] [CrossRef]
- Gransberg, D.D.; Pittenger, D.M.; Tighe, S.M. Microsurfacing Best Practices in North America. In Proceedings of the Seventh International Conference on Maintenance and Rehabilitation of Pavements and Technological Control, Auckland, New Zealand, 28–30 August 2012; pp. 51.1–51.9. [Google Scholar]
- Hajj, E.Y.; Cortez, E.; Gibson, S. Effective timing for two sequential applications of slurry seal on asphalt pavement. J. Transp. Eng. 2013, 139, 476–484. [Google Scholar] [CrossRef]
- Bhargava, N.; Siddagangaiah, A.K.; Ryntathiang, T.L. State of the art review on design and performance of microsurfacing. Road Mater. Pavement Des. 2020, 21, 2091–2125. [Google Scholar] [CrossRef]
- Hajj, E.Y.; Loria, L.; Sebaaly, P.E.; Borroel, C.M.; Leiva, P. Optimum time for application of slurry seal to asphalt concrete pavements. Transp. Res. Rec. J. Transp. Res. Board. 2011, 2235, 66–81. [Google Scholar] [CrossRef]
- Ouyang, J.; Tan, Y.; Corr, D.J.; Shah, S.P. Viscosity prediction of fresh cement asphalt emulsion pastes. Mater. Struct. 2017, 50, 59. [Google Scholar] [CrossRef]
- Motamed, A.; Salomon, D.; Sakib, N.; Bhasin, A. Emulsified asphalt residue recovery and characterization: Combined use of moisture analyzer balance and dynamic shear rheometer. Transp. Res. Rec. J. Transp. Res. Board. 2014, 2444, 88–96. [Google Scholar] [CrossRef] [Green Version]
- Gã, B. A proposed methodology for the global study of the mechanical properties of cold asphalt mixtures. Mater. Des. 2014, 57, 520–527. [Google Scholar]
- Takamura, K.; James, A. Paving with asphalt emulsions. In Advances in Asphalt Materials; Elsevier: Amsterdam, The Netherlands, 2015; pp. 393–426. [Google Scholar]
- Zulu, K.; Mukendi, K.K. An in-depth evaluation of micro-surfacing treatment. Civ. Eng. 2018, 4, 2242. [Google Scholar] [CrossRef] [Green Version]
- Xiao, Y.; Wang, F.; Cui, P.; Lei, L.; Lin, J.; Yi, M. Evaluation of fine aggregate morphology by image method and its effect on skid-resistance of micro-surfacing. Materials 2018, 11, 920. [Google Scholar] [CrossRef] [Green Version]
- Yu, J.; Zhang, X.; Xiong, C. A methodology for evaluating micro-surfacing treatment on asphalt pavement based on grey system models and grey rational degree theory. Constr. Build. Mater. 2017, 150, 214–226. [Google Scholar] [CrossRef]
- Recommended Performance Guideline for Micro Surfacing; Technical Report A143; International Slurry Surfacing Association: Glen Ellyn, IL, USA, 2020.
- Robati, M.; Carter, A.; Perraton, D. New conceptual model for filler stiffening effect on asphalt mastic of microsurfacing. J. Mater. Civ. Eng. 2015, 27, 04015033. [Google Scholar] [CrossRef]
- Bashar, M.Z.; Elseifi, M.A.; Mousa, M.R.; Zhang, Z.; Gaspard, K. Optimizing the performance of microsurfacing treatments in flexible pavements and assessing its effects on moisture damage. Transp. Res. Rec. J. Transp. Res. Board. 2019, 2673, 217–229. [Google Scholar] [CrossRef]
- AASHTO. Standard Specification for Performance-Graded Asphalt Binder; American Association of State Highway and Transportation Officials: Washington, DC, USA, 2017. [Google Scholar]
- AASHTO. TP 70-11. In Multiple Stress Creep Recovery (MSCR) Test of Asphalt Binder Using a Dynamic Shear Rheometer (DSR); American Association of State Highway and Transportation Officials: Washington, DC, USA, 2011. [Google Scholar]
- Erwin, T.; Tighe, S.L. Safety effect of preventive maintenance: A case study of microsurfacing. Transp. Res. Rec. J. Transp. Res. Board. 2008, 2044, 79–85. [Google Scholar] [CrossRef]
- Fang, X.; Garcia-Hernandez, A.; Lura, P. Overview on cold cement bitumen emulsion asphalt. RILEM Tech. Lett. 2016, 1, 116. [Google Scholar] [CrossRef] [Green Version]
- Nassar, A.I.; Thom, N.; Parry, T. Optimizing the mix design of cold bitumen emulsion mixtures using response surface methodology. Constr. Build. Mater. 2016, 104, 216–229. [Google Scholar] [CrossRef]
- Garfa, A.; Carter, A.; Dony, A. Rutting resistance of HMA rehabilitated with micro-Surfacing. Open J. Civ. Eng. 2018, 8, 245–255. [Google Scholar] [CrossRef] [Green Version]
- Ronald, M.; Luis, F.P. Asphalt emulsions formulation: State-of-the-art and dependency of formulation on emulsions properties. Constr. Build. Mater. 2016, 123, 162–173. [Google Scholar] [CrossRef]
- Hou, S.; Chen, C.; Zhang, J.; Shen, H.; Gu, F. Thermal and mechanical evaluations of asphalt emulsions and mixtures for microsurfacing. Constr. Build. Mater. 2018, 191, 1221–1229. [Google Scholar] [CrossRef]
- Luo, Y.; Zhang, K.; Xie, X.; Yao, X. Performance evaluation and material optimization of micro-surfacing based on cracking and rutting resistance. Constr. Build. Mater. 2019, 206, 193–200. [Google Scholar] [CrossRef]
- Bhargava, N.; Siddagangaiah, A.K.; Lyngdoh Ryntathiang, T. Systematic approach to address challenges in microsurfacing mix design. Constr. Build. Mater. 2021, 270, 121759. [Google Scholar] [CrossRef]


| Type | MS-A | MS-B | MS-C | Required Value |
|---|---|---|---|---|
| Residual sieve (%) | 0.06 | 0.01 | 0.01 | ≤0.01 |
| Standard viscosity | 46 | 32 | 33 | 12–60 |
| Residue percentage (%) | 61 | 62 | 60.5 | ≥60 |
| Penetration at 25 °C (0.1 mm) | 77 | 78 | 89 | 40–150 |
| Softening point (°C) | 56 | 59 | 56 | ≥53 |
| Ductility 5 °C | 63 | 67 | 62 | ≥20 |
| Solubility | 98.5 | 97.5 | 99 | ≥97.5 |
| Storage stability (1 d) | 0.2 | 0.6 | 0.8 | ≤1 |
| Storage stability (5 d) | 4.8 | 4.5 | 2.6 | ≤5 |
| Gradation Type | Percentage by Mass (%) Passing the Following Sieve (mm) | |||||||
|---|---|---|---|---|---|---|---|---|
| 9.5 | 4.75 | 2.36 | 1.18 | 0.6 | 0.3 | 0.15 | 0.075 | |
| MS-3 standard | 100 | 70–90 | 45–70 | 28–50 | 19–34 | 12–25 | 7–18 | 5–15 |
| Actual value | 100 | 80 | 62.5 | 39 | 26.5 | 18.5 | 12.5 | 10 |
| Run | X1 | X2 | X3 | MBSdry | DWPAdry | MBSwet | DWPAwet | PLD | SENB |
|---|---|---|---|---|---|---|---|---|---|
| 1 | 5.8 | 1 | 42.5 | 0.38 | 5.56 | 0.29 | 6.87 | 2.1 | 0.09 |
| 2 | 7.0 | 1 | 42.5 | 0.49 | 5.02 | 0.42 | 6.32 | 3.73 | 0.16 |
| 3 | 5.8 | 2 | 42.5 | 0.39 | 5.52 | 0.31 | 6.59 | 1.63 | 0.08 |
| 4 | 7.0 | 2 | 42.5 | 0.51 | 3.17 | 0.46 | 4.13 | 3.44 | 0.19 |
| 5 | 5.8 | 1.5 | 25 | 0.36 | 5.68 | 0.27 | 6.99 | 2.16 | 0.07 |
| 6 | 7.0 | 1.5 | 25 | 0.38 | 5.44 | 0.32 | 6.47 | 3.88 | 0.11 |
| 7 | 5.8 | 1.5 | 60 | 0.46 | 5.3 | 0.36 | 6.5 | 2.23 | 0.18 |
| 8 | 7.0 | 1.5 | 60 | 0.58 | 3.28 | 0.45 | 4.02 | 3.6 | 0.16 |
| 9 | 6.4 | 1 | 25 | 0.39 | 5.55 | 0.28 | 6.46 | 2.54 | 0.09 |
| 10 | 6.4 | 2 | 25 | 0.38 | 5.5 | 0.29 | 6.39 | 2.37 | 0.1 |
| 11 | 6.4 | 1 | 60 | 0.56 | 3.33 | 0.44 | 4.18 | 3.91 | 0.23 |
| 12 | 6.4 | 2 | 60 | 0.55 | 3.29 | 0.43 | 4.16 | 2.16 | 0.22 |
| 13 | 6.4 | 1.5 | 42.5 | 0.55 | 3.41 | 0.47 | 4.27 | 3.7 | 0.21 |
| 14 | 6.4 | 1.5 | 42.5 | 0.53 | 3.37 | 0.42 | 4.16 | 3.9 | 0.23 |
| 15 | 6.4 | 1.5 | 42.5 | 0.58 | 3.22 | 0.47 | 4.19 | 3.8 | 0.18 |
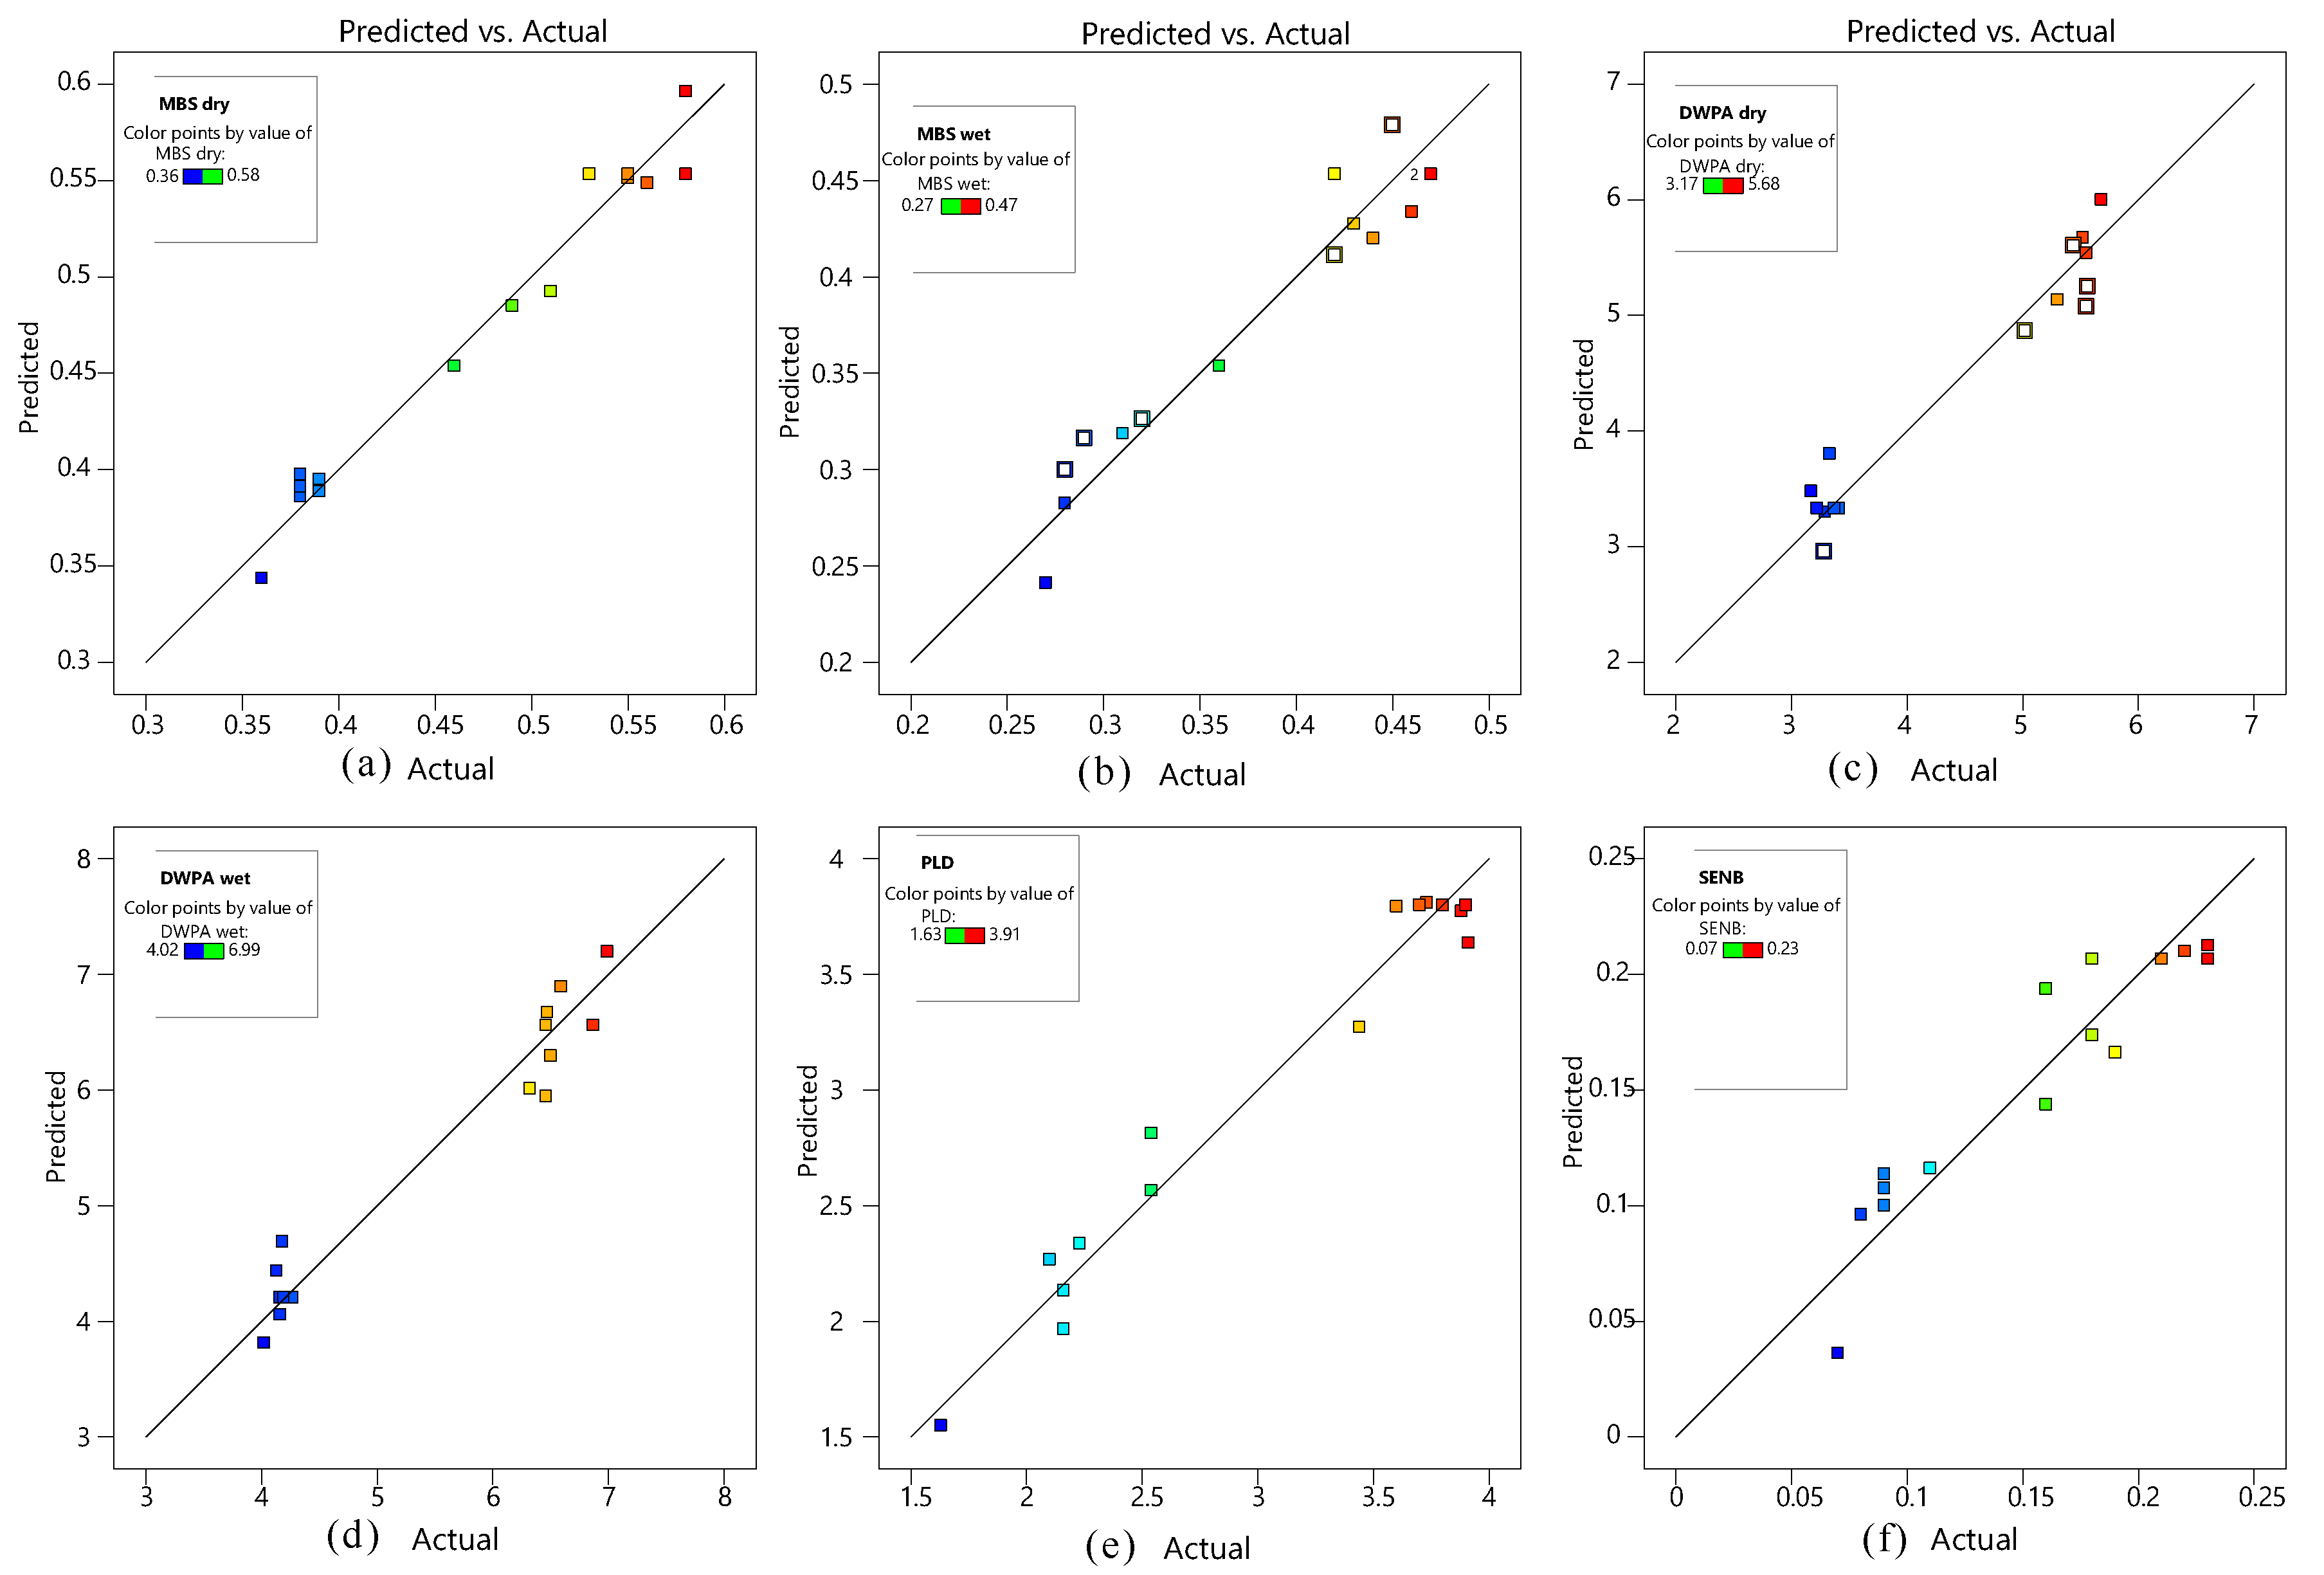
| Response | R | Adjusted R | Predicted R2 | Model F-Value | Model p-Value | Significance |
|---|---|---|---|---|---|---|
| 0.972 | 0.922 | 0.727 | 19.32 | 0.0023 | significant | |
| 0.936 | 0.821 | 0.25 | 8.14 | 0.016 | significant | |
| 0.903 | 0.773 | 0.167 | 6.95 | 0.0015 | significant | |
| 0.954 | 0.871 | 0.267 | 11.5 | 0.0075 | significant | |
| 0.956 | 0.876 | 0.321 | 12.03 | 0.0068 | significant | |
| 0.856 | 0.439 | 0.264 | 4.65 | 0.025 | significant |
| No. | ABSdry | DWPAdry | ABSwet | DWPAwet | PLD | SENB | Desirability | – |
|---|---|---|---|---|---|---|---|---|
| RSM | 0.61 | 2.78 | 0.48 | 3.53 | 3.73 | 0.2 | 0.618 | Selected |
| experimental | 0.57 | 2.86 | 0.46 | 3.42 | 3.79 | 0.21 | – | – |
| Testing Method | Traffic Levels | 3.2 (kPa−1) | |
|---|---|---|---|
| Grade | Traffic Volume | ||
| Modified hot asphalt AASHTO MP19-2010 (no greater than) | Standard(S) | ESALs < 1 × 10 Standard axle load speed > 70 km/h | 4 |
| Heavy traffic (H) | ESALs 1 × 10 to 3 × 10 Standard axle load speed 20∼70 km/h | 2 | |
| Overweight traffic (V) | ESALs > 3 × 10 or standard axle load speed < 20 km/h | 1 | |
| Very-heavy traffic (E) | ESALs > 3 × 10 and standard axle load speed < 20 km/h | 0.5 | |
| Microsurfacing NCHRP research report 837 | Low-traffic volume (L) | AADT < 500 | 5 |
| Medium-traffic volume (M) | 501 < AADT < 2500 | 1.5 | |
| High-traffic volume (H) | 2501 < AADT < 20,000 | 1.5 | |
Publisher’s Note: MDPI stays neutral with regard to jurisdictional claims in published maps and institutional affiliations. |
© 2021 by the authors. Licensee MDPI, Basel, Switzerland. This article is an open access article distributed under the terms and conditions of the Creative Commons Attribution (CC BY) license (https://creativecommons.org/licenses/by/4.0/).
Share and Cite
Shi, J.; Jia, S.; Wang, L.; Zhang, Q.; Han, H.; Chen, Y.; Song, Z.; Zhao, L. Validation of Adhesive and Temperature Property Characteristics of Microsurfacing by Performance-Based Mixture Design Approach. Materials 2021, 14, 4532. https://doi.org/10.3390/ma14164532
Shi J, Jia S, Wang L, Zhang Q, Han H, Chen Y, Song Z, Zhao L. Validation of Adhesive and Temperature Property Characteristics of Microsurfacing by Performance-Based Mixture Design Approach. Materials. 2021; 14(16):4532. https://doi.org/10.3390/ma14164532
Chicago/Turabian StyleShi, Jicun, Shili Jia, Lan Wang, Qing Zhang, Hongxing Han, Yilong Chen, Zige Song, and Lei Zhao. 2021. "Validation of Adhesive and Temperature Property Characteristics of Microsurfacing by Performance-Based Mixture Design Approach" Materials 14, no. 16: 4532. https://doi.org/10.3390/ma14164532
APA StyleShi, J., Jia, S., Wang, L., Zhang, Q., Han, H., Chen, Y., Song, Z., & Zhao, L. (2021). Validation of Adhesive and Temperature Property Characteristics of Microsurfacing by Performance-Based Mixture Design Approach. Materials, 14(16), 4532. https://doi.org/10.3390/ma14164532