
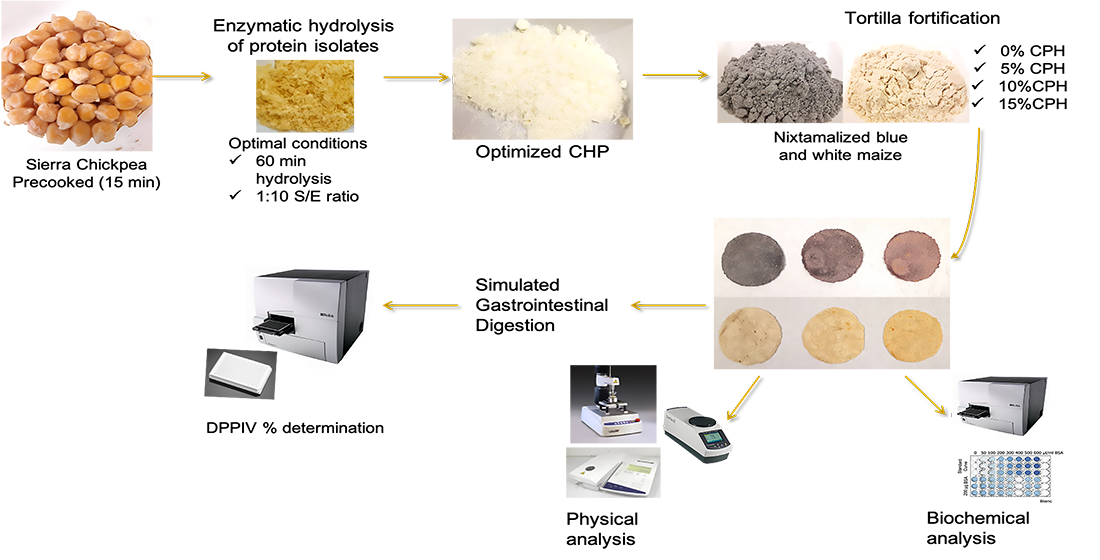
Fortification of Maize Tortilla with an Optimized Chickpea Hydrolysate and Its Effect on DPPIV Inhibition Capacity and Physicochemical Characteristics


Abstract
:
1. Introduction
2. Materials and Methods
2.1. Materials
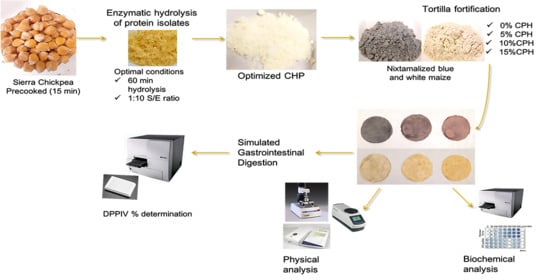
2.2. Chickpea Protein Isolation and Optimized Enzymatic Hydrolysis
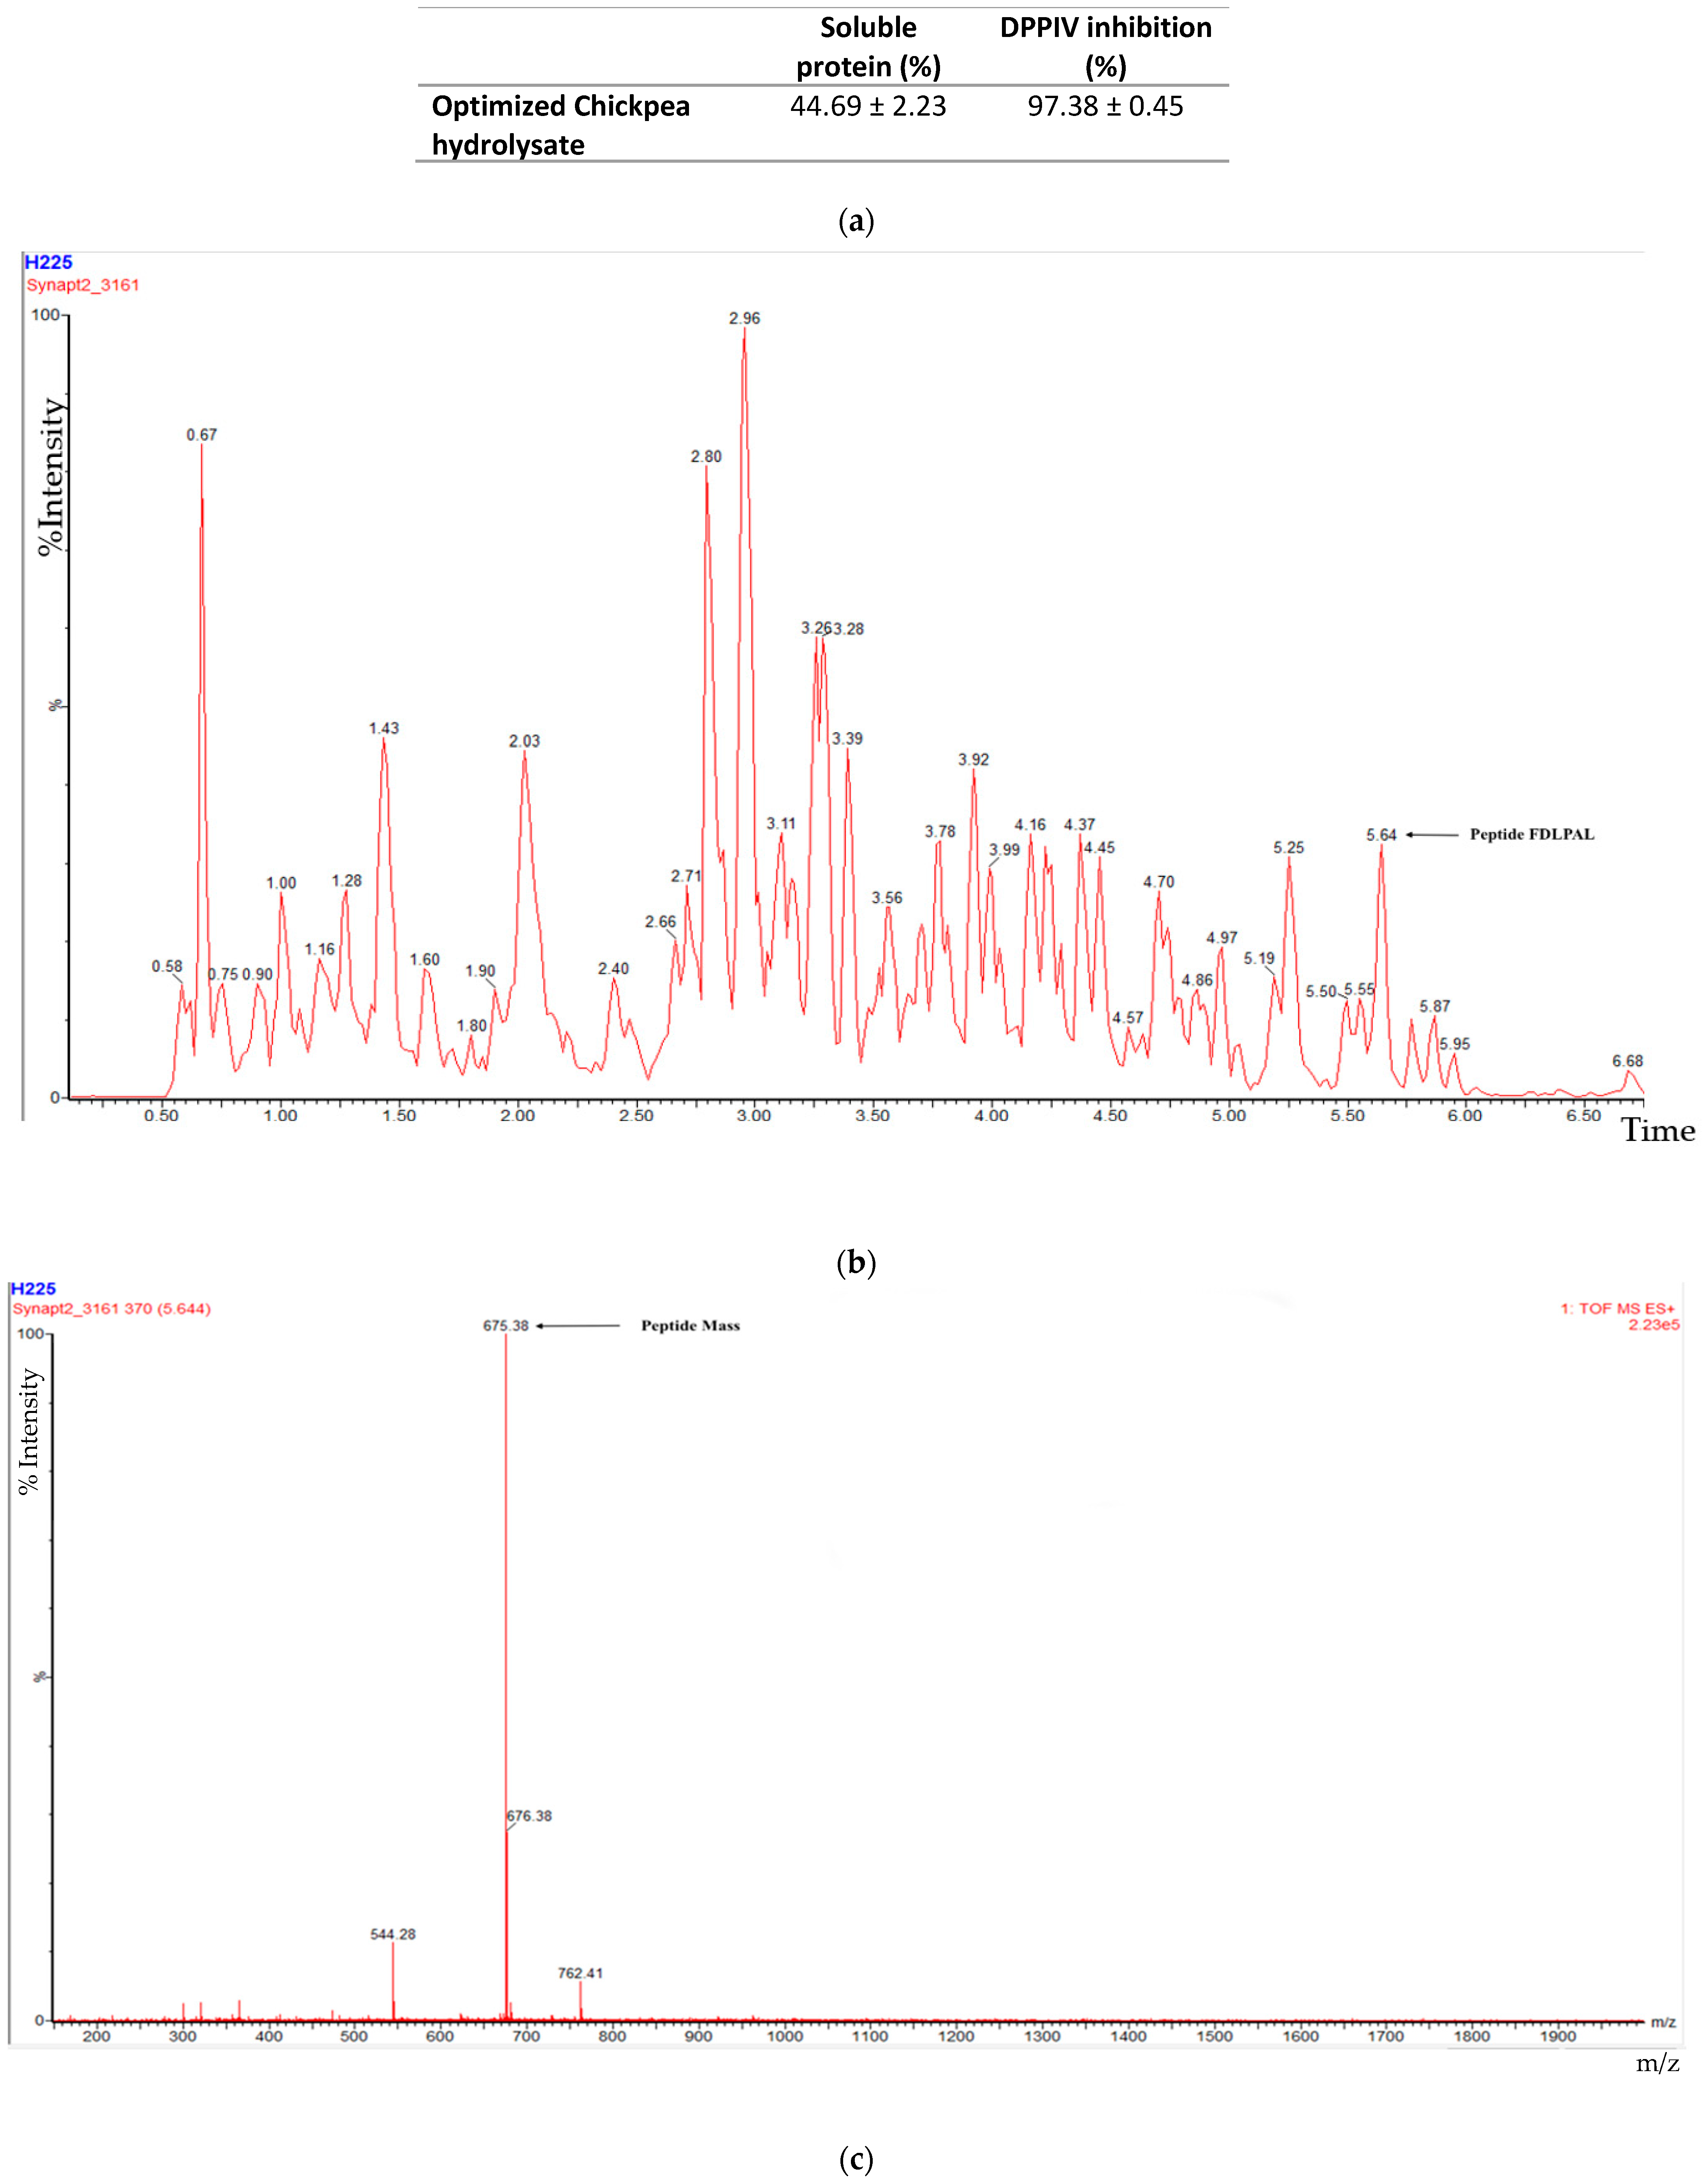
2.3. LC-ESI-MSMS Peptide Sequencing
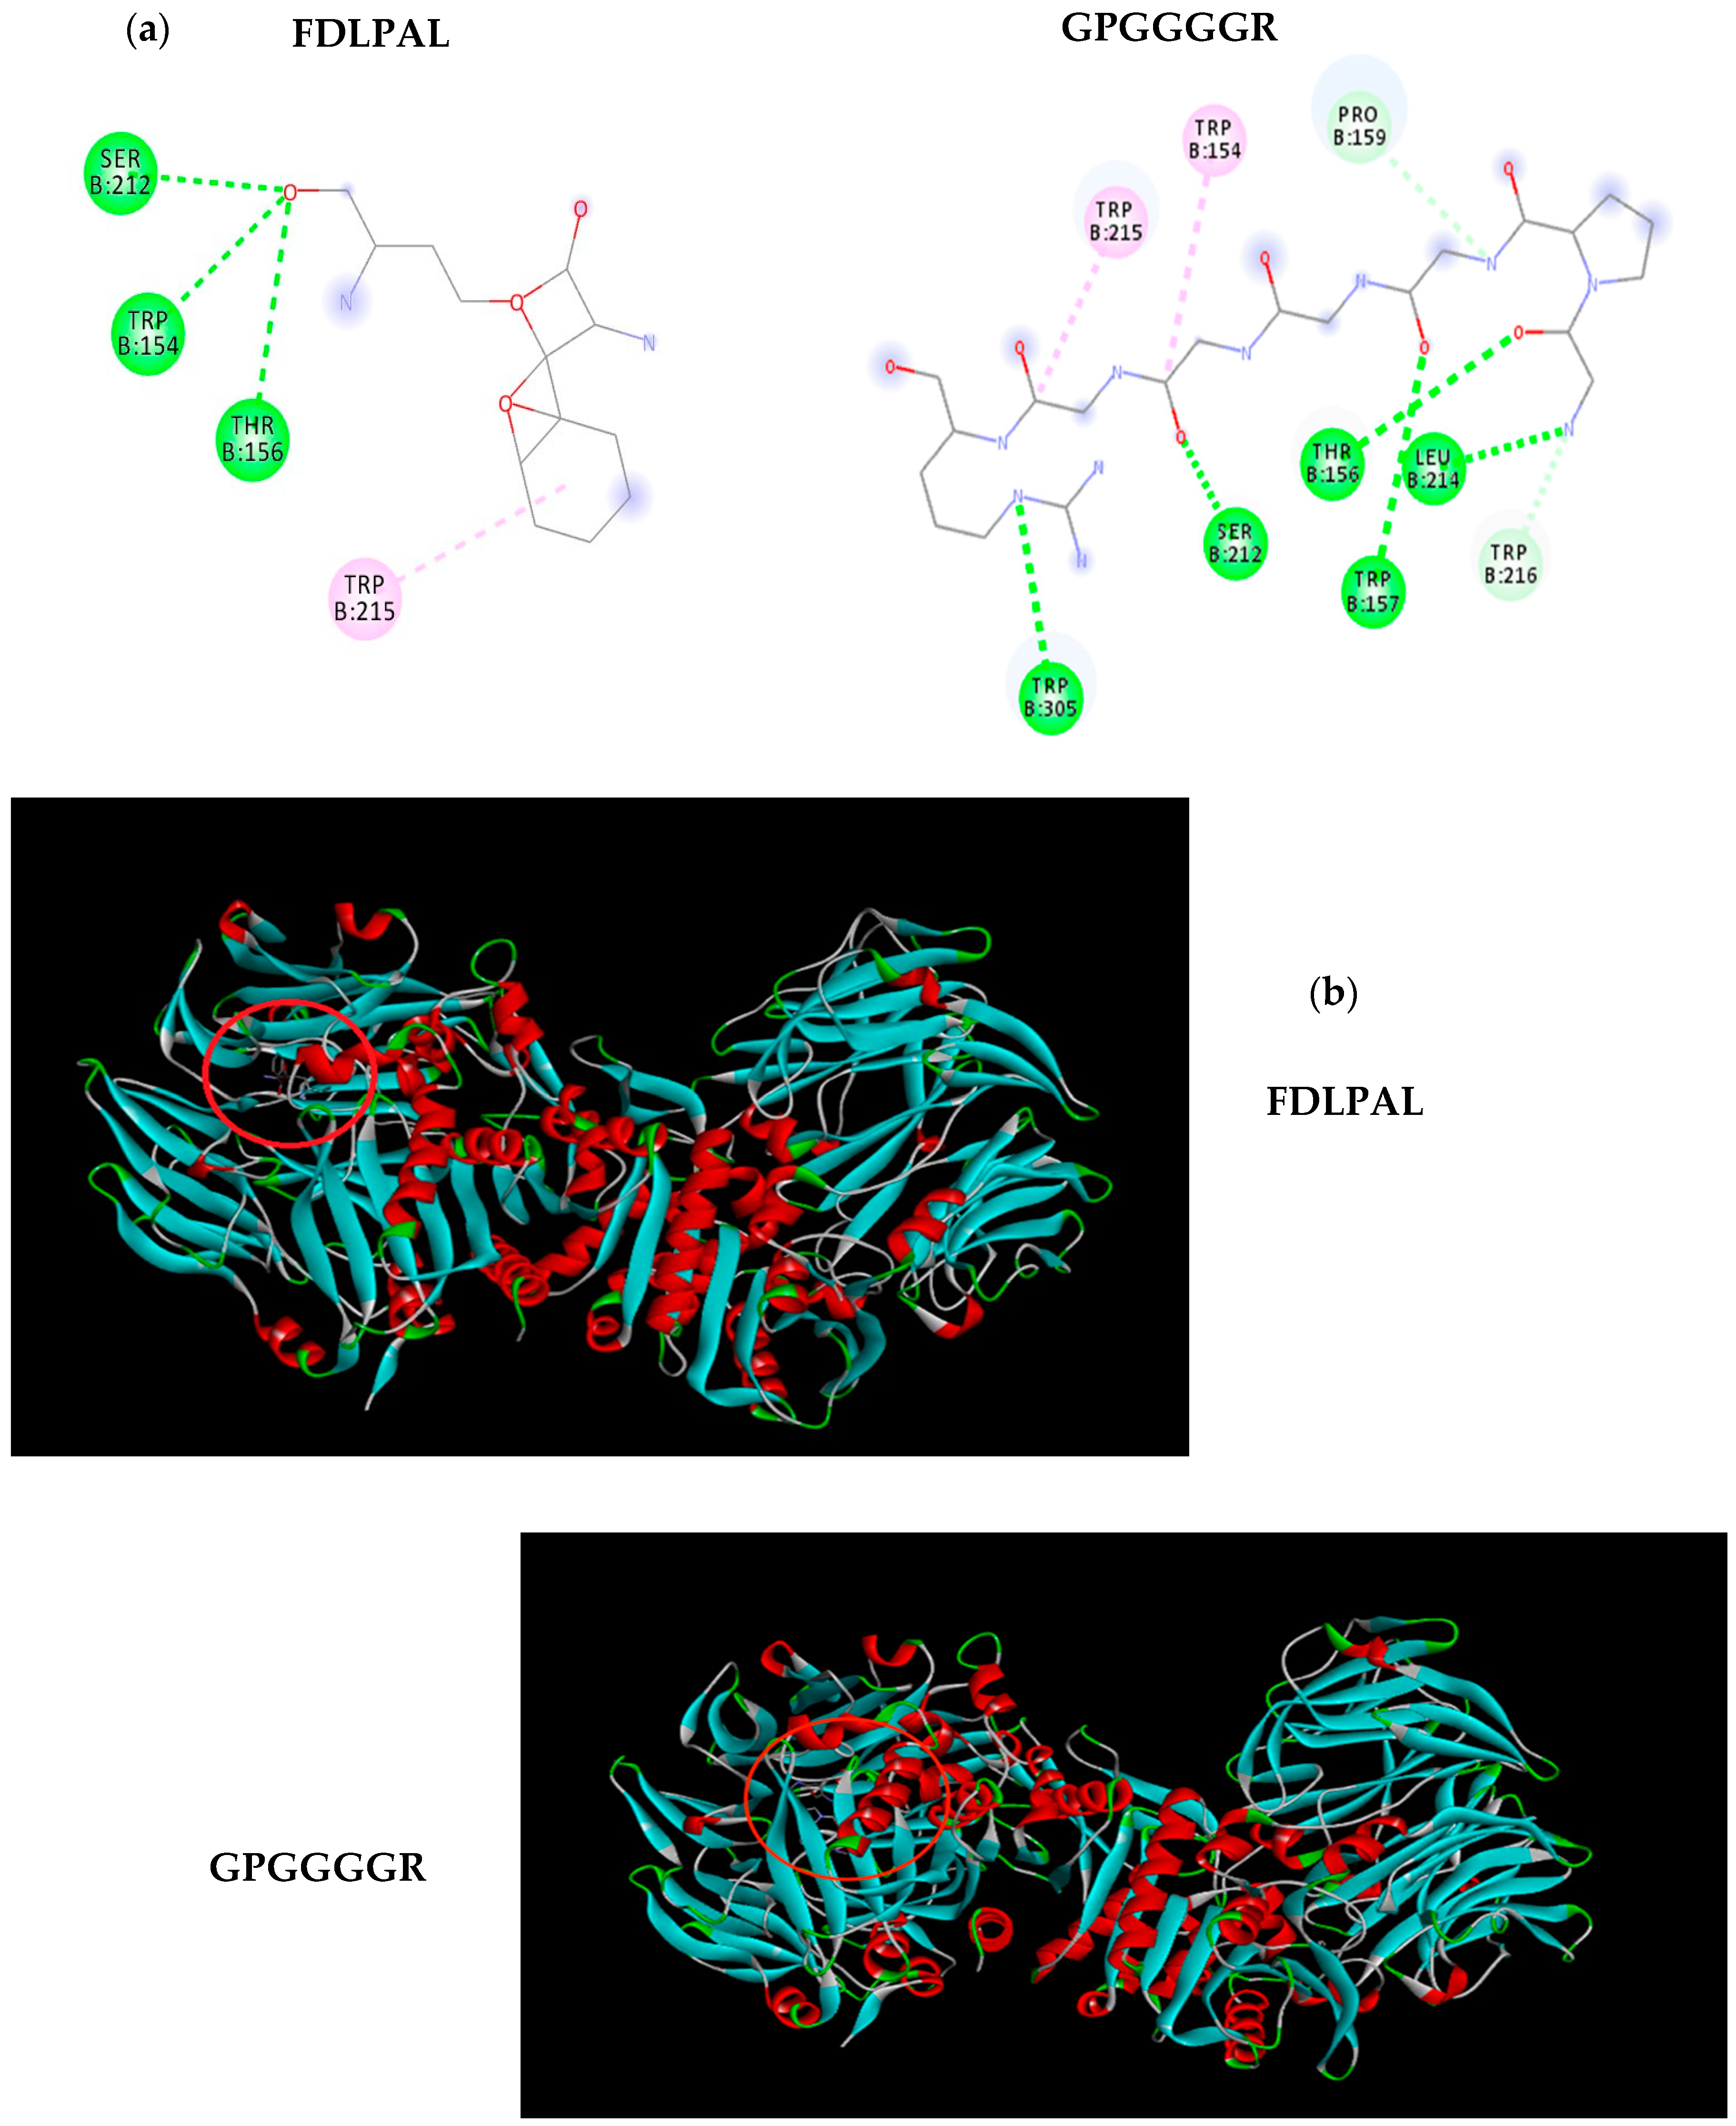
2.4. Molecular Docking
2.5. Tortilla Preparation and Fortification with Chickpea Hydrolysate
2.6. Soluble Protein Determination (BCA)
2.7. SDS PAGE Electrophoresis
2.8. Color Analysis
2.9. Moisture Analysis
2.10. Texture Analysis: Hardness, Cohesiveness, and Penetration Test
2.11. Dipeptidyl Peptidase Inhibition Biochemical Assay
2.12. Simulated Gastrointestinal Digestion (SGID) of Chickpea-Fortified Tortillas
2.13. Statistical Analysis
3. Results
3.1. Peptide Sequencing, Soluble Protein, and DPPIV Inhibition
3.2. Moisture Analysis
3.3. Texture Analysis
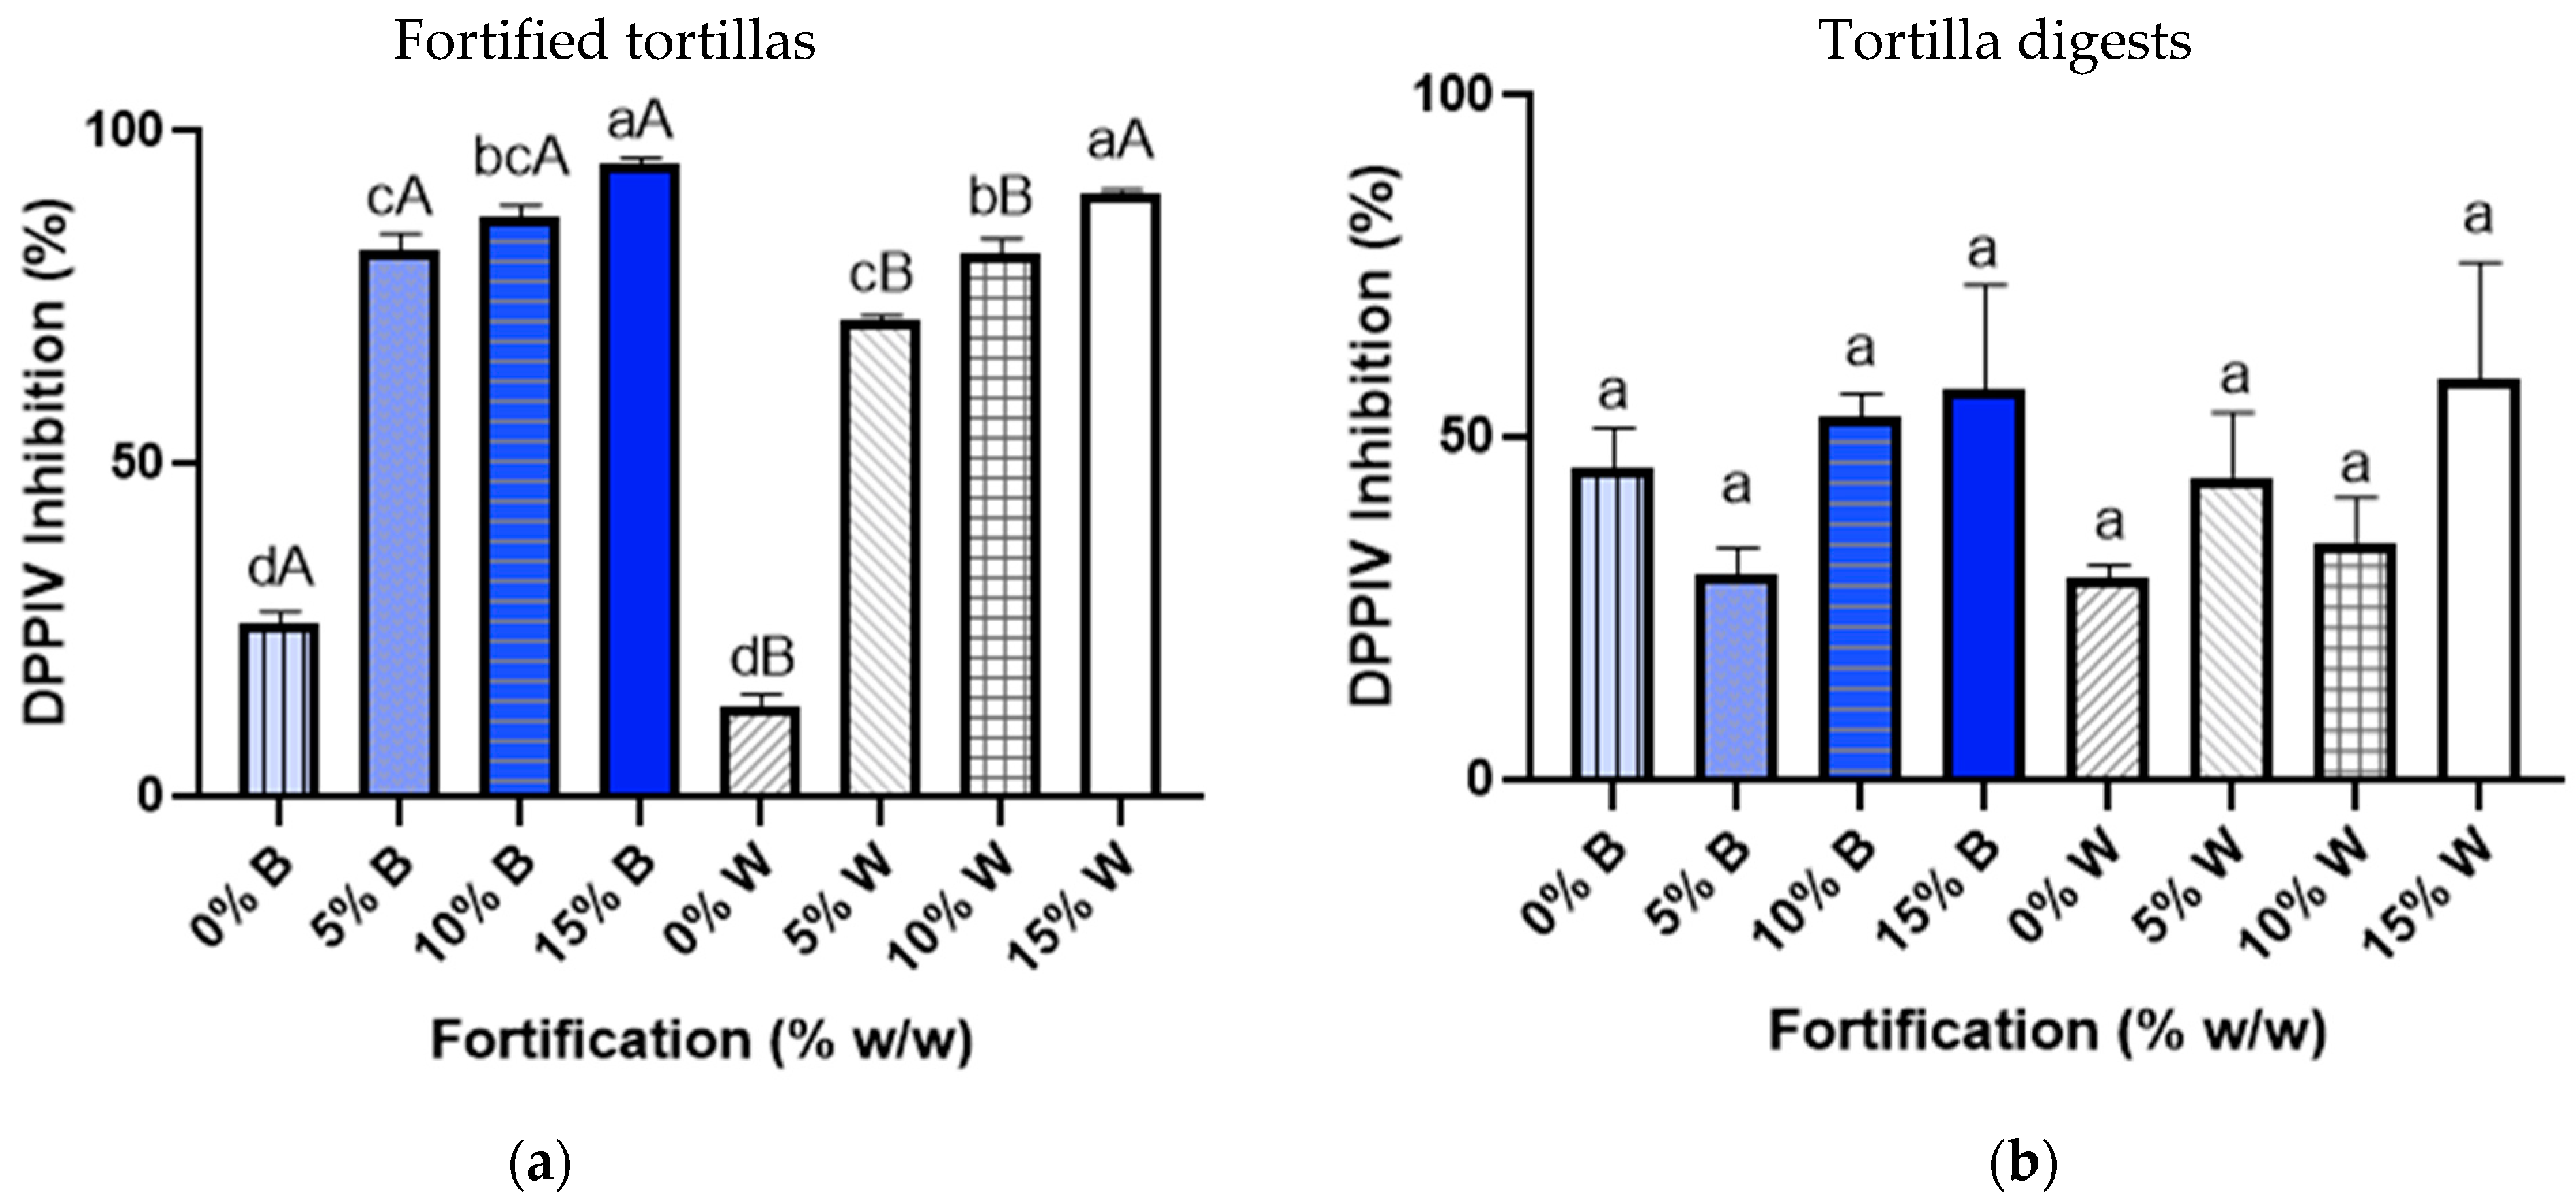
3.4. DPPIV Inhibitory Activity
4. Discussion
5. Conclusions
Supplementary Materials
Author Contributions
Funding
Data Availability Statement
Acknowledgments
Conflicts of Interest
References
- Gautam, A.K.; Gupta, N.; Narvekar, D.T.; Bhadkariya, R.; Bhagyawant, S.S. Characterization of chickpea (Cicer arietinum L.) lectin for biological activity. Physiol. Mol. Biol. Plants 2018, 24, 389–397. [Google Scholar] [CrossRef]
- Hussein, H.; Awad, S.; El-Sayed, I.; Ibrahim, A. Impact of chickpea as prebiotic, antioxidant and thickener agent of stirred bio-yoghurt. Ann. Agric. Sci. 2020, 65, 49–58. [Google Scholar] [CrossRef]
- Faridy, J.-C.M.; Stephanie, C.-G.M.; Gabriela, M.-M.O.; Cristian, J.-M. Biological Activities of Chickpea in Human Health (Cicer arietinum L.). A Review. Plant Foods Hum. Nutr. 2020, 75, 142–153. [Google Scholar] [CrossRef]
- Real Hernandez, L.M.; Gonzalez de Mejia, E. Enzymatic production, bioactivity, and bitterness of chickpea (Cicer arietinum) peptides. Comprehen. Rev. Food Sci. Food Saf. 2019, 18, 1913–1946. [Google Scholar] [CrossRef] [PubMed] [Green Version]
- Gabrial, S.; Shakib, M.-C.; Haleem, M.S.M.A.; Gabrial, G.N.; El-Shobaki, F.A. Hypoglycemic Potential of Supplementation with a Vegetable and Legume Juice Formula in Type 2 Diabetic Patients. Pak. J. Biol. Sci. 2020, 23, 132–138. [Google Scholar] [CrossRef] [Green Version]
- Di Stefano, E.; Tsopmo, A.; Oliviero, T.; Fogliano, V.; Udenigwe, C.C. Bioprocessing of common pulses changed seed microstructures, and improved dipeptidyl peptidase-IV and α-glucosidase inhibitory activities. Sci. Rep. 2019, 9, 15308. [Google Scholar] [CrossRef] [Green Version]
- Bhagyawant, S.S.; Narvekar, D.T.; Gupta, N.; Bhadkaria, A.; Gautam, A.K.; Srivastava, N. Chickpea (Cicer arietinum L.) Lectin Exhibit Inhibition of ACE-I, α-amylase and α-glucosidase Activity. Protein Pept. Lett. 2019, 26, 494–501. [Google Scholar] [CrossRef] [PubMed]
- Chandrasekaran, S.; Luna-Vital, D.; De Mejia, E.G. Identification and Comparison of Peptides from Chickpea Protein Hydrolysates Using Either Bromelain or Gastrointestinal Enzymes and Their Relationship with Markers of Type 2 Diabetes and Bitterness. Nutrients 2020, 12, 3843. [Google Scholar] [CrossRef] [PubMed]
- Centers for Disease Control and Prevention (CDC). National Diabetes Statistics Report. Estimates of Diabetes and Its Burden in the United States. Available online: https://www.cdc.gov/diabetes/pdfs/data/statistics/national-diabetes-statistics-report.pdf (accessed on 28 January 2021).
- International Diabetes Federation, International Diabete Federation. IDF North America and Caribbean Members. Available online: https://www.idf.org/our-network/regions-members/north-america-and-caribbean/members/74-usa.html (accessed on 10 December 2019).
- Aisa, H.A.; Gao, Y.; Yili, A.; Ma, Q.; Cheng, Z. Beneficial Role of Chickpea (Cicer arietinum L.) Functional Factors in the Intervention of Metabolic Syndrome and Diabetes Mellitus. In Bioactive Food as Dietary Interventions for Diabetes, 2nd ed.; Academic Press: Cambridge, MA, USA, 2019; pp. 615–627. [Google Scholar] [CrossRef]
- Schierhorn, C. Cold Snacks Heat up. Food Technol. 2020, 74, 27–38. [Google Scholar]
- Mintel Reports. US Plant-Based Proteins Market Report; Mintel: London, UK, 2019. [Google Scholar]
- Statista. Corn Production by Country. 2018. Available online: https://www.statista.com/statistics/254292/global-corn-production-by-country/ (accessed on 19 May 2021).
- Dominguez-Hernandez, E.M.; Zepeda-Bautista, R.; Valderrama-Bravo, M.D.C.; Dominguez-Hernandez, E.; Hernandez-Aguilar, C. Sustainability assessment of traditional maize (Zea mays L.) agroecosystem in Sierra Norte of Puebla, Mexico. Agroecol. Sustain. Food Syst. 2017, 42, 383–406. [Google Scholar] [CrossRef]
- Statista. Corn Tortillas Production Mexico. Available online: https://www.statista.com/statistics/1044245/production-of-corn-tortillas-mexico/ (accessed on 19 May 2021).
- Statista. Forecast: Industry Revenue of “Tortilla Manufacturing” in the U.S. 2012. Available online: https://www.statista.com/forecasts/310798/tortilla-manufacturing-revenue-in-the-us (accessed on 19 May 2021).
- Argüello-García, E.; Martínez-Herrera, J.; Córdova-Téllez, L.; Sánchez-Sánchez, O.; Corona-Torres, T. Textural, chemical and sensorial properties of maize tortillas fortified with nontoxic Jatropha curcas L. flour. CyTA J. Food 2016, 15, 301–306. [Google Scholar] [CrossRef] [Green Version]
- Cardoso, R.V.; Fernandes, Â.; González-Paramás, A.M.; Barros, L.; Ferreira, I.C. Flour fortification for nutritional and health improvement: A review. Food Res. Int. 2019, 125, 108576. [Google Scholar] [CrossRef] [Green Version]
- Luna, G.C.; Martin-Gonzalez, F.S.; Mauer, L.; Liceaga, A. Cricket (Acheta domesticus) protein hydrolysates’ impact on the physicochemical, structural and sensory properties of tortillas and tortilla chips. J. Insects Food Feed. 2021, 7, 109–120. [Google Scholar] [CrossRef]
- Méndez-Lagunas, L.L.; Cruz-Gracida, M.; Barriada-Bernal, L.G.; Rodríguez-Méndez, L.I. Profile of phenolic acids, antioxidant activity and total phenolic compounds during blue corn tortilla processing and its bioaccessibility. J. Food Sci. Technol. 2020, 57, 4688–4696. [Google Scholar] [CrossRef] [PubMed]
- Liu, J.; Yuan, T.; Wang, R.; Liu, Y.; Fang, G. The Properties and Tortilla Making of Corn Flour from Enzymatic Wet-Milling. Molecules 2019, 24, 2137. [Google Scholar] [CrossRef] [PubMed] [Green Version]
- Ramírez-Jiménez, A.K.; Castro-Muñoz, R. Emerging techniques assisting nixtamalization products and by-products processing: An overview. Crit. Rev. Food Sci. Nutr. 2020, 1–14. [Google Scholar] [CrossRef]
- Cabrera-Ramírez, A.H.; Luzardo-Ocampo, I.; Ramírez-Jiménez, A.; Morales-Sánchez, E.; Campos-Vega, R.; Gaytán-Martínez, M. Effect of the nixtamalization process on the protein bioaccessibility of white and red sorghum flours during in vitro gastrointestinal digestion. Food Res. Int. 2020, 134, 109234. [Google Scholar] [CrossRef]
- Escalante-Aburto, A.; Mariscal-Moreno, R.M.; Santiago-Ramos, D.; Ponce-García, N. An Update of Different Nixtamalization Technologies, and Its Effects on Chemical Composition and Nutritional Value of Corn Tortillas. Food Rev. Int. 2019, 36, 456–498. [Google Scholar] [CrossRef]
- Morales, J.C.; Zepeda, R.A.G. Effect of Different Corn Processing Techniques in the Nutritional Composition of Nixtamalized Corn Tortillas. J. Nutr. Food Sci. 2017, 7, 1–7. [Google Scholar] [CrossRef]
- Zhang, Q.; de Mejia, E.G.; Luna-Vital, D.A.; Tao, T.; Chandrasekaran, S.; Chatham, L.; Juvik, J.; Singh, V.; Kumar, D. Relationship of phenolic composition of selected purple maize (Zea mays L.) genotypes with their anti-inflammatory, anti-adipogenic and anti-diabetic potential. Food Chem. 2019, 289, 739–750. [Google Scholar] [CrossRef] [PubMed]
- Rohrborn, D.; Wronkowitz, N.; Eckel, J. DPP4 in Diabetes. Front. Immunol. 2015, 6, 386. [Google Scholar] [CrossRef] [Green Version]
- Martinez, K.A.A.; Yang, M.M.; de Mejia, E.G. Technological properties of chickpea (Cicer arietinum): Production of snacks and health benefits related to type-2 diabetes. Compr. Rev. Food Sci. Food Saf. 2021. [Google Scholar] [CrossRef]
- Future Market Insights. Tortilla Market: Unique Recipes Incorporating Different Types of Tortilla to Foster Revenue Growth: Global Industry Analysis (2013–2017) & Opportunity Assessment (2018–2028). Published 2018. Available online: https://www.futuremarketinsights.com/reports/food-and-beverage (accessed on 19 May 2021).
- Martínez, K.A.A.; de Mejia, E.G. Comparison of five chickpea varieties, optimization of hydrolysates production and evaluation of biomarkers for type 2 diabetes. Food Res. Int. 2021, 147, 110572. [Google Scholar] [CrossRef]
- Yongqing, T.; Wilmann, P.G.; Pan, J.; West, M.L.; Brown, T.J.; Mynott, T.; Pike, R.N.; Wijeyewickrema, L.C. Determination of the crystal structure and substrate specificity of ananain. Biochimie 2019, 166, 194–202. [Google Scholar] [CrossRef]
- Pancreatin from Porcine Pancreas 8 × USP Specifications|8049-47. Available online: https://www.sigmaaldrich.com/US/en/product/sigma/p7545 (accessed on 13 July 2021).
- Sánchez-Vioque, R.; Clemente, A.; Vioque, J.; Bautista, J.; Millán, F. Protein isolates from chickpea (Cicer arietinum L.): Chemical composition, functional properties and protein characterization. Food Chem. 1999, 64, 237–243. [Google Scholar] [CrossRef]
- Burley, S.K.; Berman, H.; Bhikadiya, C.; Bi, C.; Chen, L.; Di Costanzo, L.; Christie, C.; Dalenberg, K.; Duarte, J.M.; Dutta, S.; et al. RCSB Protein Data Bank: Biological macromolecular structures enabling research and education in fundamental biology, biomedicine, biotechnology and energy. Nucleic Acids Res. 2018, 47, D464–D474. [Google Scholar] [CrossRef] [PubMed] [Green Version]
- Forli, S.; Huey, R.; Pique, M.E.; Sanner, M.F.; Goodsell, D.S.; Olson, A.J. Computational protein–ligand docking and virtual drug screening with the AutoDock suite. Nat. Protoc. 2016, 11, 905–919. [Google Scholar] [CrossRef] [Green Version]
- Trott, O.; Olson, A.J. AutoDock Vina: Improving the speed and accuracy of docking with a new scoring function, efficient optimization, and multithreading. J. Comput. Chem. 2009, 31, 455–461. [Google Scholar] [CrossRef] [Green Version]
- Smith, P.; Krohn, R.; Hermanson, G.; Mallia, A.; Gartner, F.; Provenzano, M.; Fujimoto, E.; Goeke, N.; Olson, B.; Klenk, D. Measurement of protein using bicinchoninic acid. Anal. Biochem. 1985, 150, 76–85. [Google Scholar] [CrossRef]
- Laemlli, U.K. Cleavage of structural proteins during the assembly of the head of bacteriophage T4. Nature 1970, 227, 680–685. [Google Scholar] [CrossRef]
- Megías, C.; Pedroche, J.; Yust, M.D.M.; Giron-Calle, J.; Alaiz, M.; Millán, F.; Vioque, J. Affinity Purification of Copper Chelating Peptides from Chickpea Protein Hydrolysates. J. Agric. Food Chem. 2007, 55, 3949–3954. [Google Scholar] [CrossRef]
- Moreno, Y.S.; Fonseca, M.R.J.; Díaz-Ramírez, J.L.; De La Torre, I.A. Factors influencing anthocyanin loss during nixtamalization of blue purple maize grain. J. Food Sci. Technol. 2017, 54, 4493–4500. [Google Scholar] [CrossRef]
- Ghribi, A.M.; Gafsi, I.M.; Sila, A.; Blecker, C.; Danthine, S.; Attia, H.; Bougatef, A.; Besbes, S. Effects of enzymatic hydrolysis on conformational and functional properties of chickpea protein isolate. Food Chem. 2015, 187, 322–330. [Google Scholar] [CrossRef]
- Jeewanthi, R.K.C.; Lee, N.-K.; Paik, H.-D. Improved Functional Characteristics of Whey Protein Hydrolysates in Food Industry. Food Sci. Anim. Resour. 2015, 35, 350–359. [Google Scholar] [CrossRef] [PubMed] [Green Version]
- Ramli, A.N.M.; Manas, N.H.A.; Hamid, A.A.A.; Hamid, H.A.; Illias, R.M. Comparative structural analysis of fruit and stem bromelain from Ananas comosus. Food Chem. 2018, 266, 183–191. [Google Scholar] [CrossRef]
- Almeida-Dominguez, H.D.; Ordoñez-Durán, G.G.; Almeida, N.G. Influence of Kernel Damage on Corn Nutrient Composition, Dry Matter Losses, and Processability during Alkaline Cooking. Cereal Chem. J. 1998, 75, 124–128. [Google Scholar] [CrossRef]
- Planta, J.; Xiang, X.; Leustek, T.; Messing, J. Engineering sulfur storage in maize seed proteins without apparent yield loss. Proc. Natl. Acad. Sci. USA 2017, 114, 11386–11391. [Google Scholar] [CrossRef] [PubMed] [Green Version]
- U.S. Food and Drug Administration. CFR-Code of Federal Regulations. Available online: https://www.accessdata.fda.gov/scripts/cdrh/cfdocs/cfcfr/cfrsearch.cfm?fr=104.20 (accessed on 28 May 2021).
- Eckert, E.; Han, J.; Swallow, K.; Tian, Z.; Jarpa-Parra, M.; Chen, L. Effects of enzymatic hydrolysis and ultrafiltration on physicochemical and functional properties of faba bean protein. Cereal Chem. J. 2019, 96, 725–741. [Google Scholar] [CrossRef]
- Samaei, S.P.; Ghorbani, M.; Tagliazucchi, D.; Martini, S.; Gotti, R.; Themelis, T.; Tesini, F.; Gianotti, A.; Toschi, T.G.; Babini, E. Functional, nutritional, antioxidant, sensory properties and comparative peptidomic profile of faba bean (Vicia faba L.) seed protein hydrolysates and fortified apple juice. Food Chem. 2020, 330, 127120. [Google Scholar] [CrossRef]
- Campas-Baypoli, O.N.; Rosas-Burgos, E.; Torres-Chávez, P.I.; Ramírez-Wong, B.; Serna-Saldívar, S.O. Physicochemical Changes of Starch in Maize Tortillas During Storage at Room and Refrigeration Temperatures. Starch-Stärke 2002, 54, 358–363. [Google Scholar] [CrossRef]
- Bueso, F.J.; Waniska, R.D.; Moreira, R.; Seetharaman, K.; Rooney, L.W. Effect of temperature on texture of corn tortilla with and without antistaling agents. Cereal Chem. J. 2006, 83, 348–353. [Google Scholar] [CrossRef]
- Alvarez-Ramirez, J.; García-Díaz, S.; Vernon-Carter, E.J.; Bello-Perez, L.A. A novel, simple, economic and effective method for retarding maize tortilla staling. J. Sci. Food Agric. 2018, 98, 4403–4410. [Google Scholar] [CrossRef]
- García-Rosas, M.; Bello-Pérez, A.; Yee-Madeira, H.; Ramos, G.; Flores-Morales, A.; Mora-Escobedo, R. Resistant Starch Content and Structural Changes in Maize (Zea mays) Tortillas during Storage. Starch-Staerke 2009, 61, 414–421. [Google Scholar] [CrossRef]
- Hermansson, A.-M. Functional properties of proteins for foods-flow properties. J. Texture Stud. 1975, 5, 425–439. [Google Scholar] [CrossRef]
- Zayas, J.F. Water Holding Capacity of Proteins. Water holding capacity of proteins. In Functionality of Proteins in Food; Springer: Berlin/Heidelberg, Germany, 1997; pp. 76–133. [Google Scholar] [CrossRef]
- Raschke, T.M. Water structure and interactions with protein surfaces. Curr. Opin. Struct. Biol. 2006, 16, 152–159. [Google Scholar] [CrossRef]
- Buitimea-Cantúa, N.E.; Gutiérrez-Uribe, J.A.; Serna-Saldívar, S.O. Phenolic–Protein Interactions: Effects on Food Properties and Health Benefits. J. Med. Food 2018, 21, 188–198. [Google Scholar] [CrossRef] [PubMed]
- Hernández, C.E.C.; Serna-Saldivar, S.O. Soybean-Fortified Nixtamalized Corn Tortillas and Related Products. In Flour and Breads and Their Fortification in Health and Disease Prevention; Elsevier: Amsterdam, The Netherlands, 2019; pp. 319–332. [Google Scholar] [CrossRef]
- Correia, R.; Grace, M.; Esposito, D.; Lila, M.A. Wild blueberry polyphenol-protein food ingredients produced by three drying methods: Comparative physico-chemical properties, phytochemical content, and stability during storage. Food Chem. 2017, 235, 76–85. [Google Scholar] [CrossRef]
- Pan, X.; Fang, Y.; Wang, L.; Shi, Y.; Xie, M.; Xia, J.; Pei, F.; Li, P.; Xiong, W.; Shen, X.; et al. Covalent Interaction between Rice Protein Hydrolysates and Chlorogenic Acid: Improving the Stability of Oil-in-Water Emulsions. J. Agric. Food Chem. 2019, 67, 4023–4030. [Google Scholar] [CrossRef]
- Schröder, A.; Berton-Carabin, C.; Venema, P.; Cornacchia, L. Interfacial properties of whey protein and whey protein hydrolysates and their influence on O/W emulsion stability. Food Hydrocoll. 2017, 73, 129–140. [Google Scholar] [CrossRef]
- Miklus, M.B. Identification of Novel Starch and Protein Structures Related to Corn Masa Texture. Ph.D. Thesis, Purdue University, West Lafayette, IN, USA, 1999. [Google Scholar]
- Santos, E.M.; Quintanar-Guzman, A.; Solorza-Feria, J.; Sanchez-Ortega, I.; Rodriguez, J.A.; Wang, Y.-J. Thermal and rheological properties of masa from nixtamalized corn subjected to a sequential protein extraction. J. Cereal Sci. 2014, 60, 490–496. [Google Scholar] [CrossRef]
- Lecuona-Villanueva, A.; Betancur-Ancona, D.A.; Chel-Guerrero, L.A.; Castellanos-Ruelas, A.F. Protein Fortification of Corn Tortillas: Effects on Physicochemical Characteristics, Nutritional Value and Acceptance. Food Nutr. Sci. 2012, 3, 1658–1663. [Google Scholar] [CrossRef] [Green Version]
- Rosell, C.M.; Bajerska, J.; El Sheikha, A.F. Nutritional and Nutraceutical Features of Regular and Protein Fortifi ed Corn Tortillas. In Bread and Its Fortification: Nutrition and Health Benefits; CRC Press: Boca Raton, FL, USA, 2015; pp. 332–364. [Google Scholar] [CrossRef]
- Smorowska, A.J.; Żołnierczyk, A.K.; Nawirska-Olszańska, A.; Sowiński, J.; Szumny, A. Nutritional Properties and In Vitro Antidiabetic Activities of Blue and Yellow Corn Extracts: A Comparative Study. J. Food Qual. 2021, 2021, 8813613. [Google Scholar] [CrossRef]
- Damián-Medina, K.; Salinas-Moreno, Y.; Milenkovic, D.; Yáñez, F.; Marino-Marmolejo, E.; Higuera-Ciapara, I.; Vallejo-Cardona, A.; Lugo-Cervantes, E. In silico analysis of antidiabetic potential of phenolic compounds from blue corn (Zea mays L.) and black bean (Phaseolus vulgaris L.). Heliyon 2020, 6, e03632. [Google Scholar] [CrossRef] [PubMed]
- Velickovic, T.D.C.; Stanic-Vucinic, D. The Role of Dietary Phenolic Compounds in Protein Digestion and Processing Technologies to Improve Their Antinutritive Properties. Compr. Rev. Food Sci. Food Saf. 2017, 17, 82–103. [Google Scholar] [CrossRef] [Green Version]
- Nasri, M. Protein Hydrolysates and Biopeptides. A review. Adv. Food Nutr. Res. 2017, 81, 109–159. [Google Scholar] [CrossRef] [PubMed]

| Peptide Sequence | Molecular Mass (g/mol) | Blast Match Parental Protein | PI | Net Charge | Hydrophobicity (Kcal * mol −1) | Chemical Structure |
|---|---|---|---|---|---|---|
| KDGGTAPAAGSGGGGAR | 1385.663 | Metabolic protein | 9.8 | 1 | 27.05 | 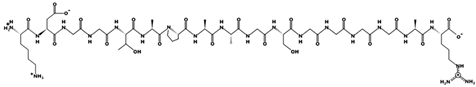 |
| LVSGGGGAR | 772.418 | Metabolic protein | 11.11 | 1 | 13.56 |  |
| FDLPAL | 674.363 | 2S Albumin-like, 11S Globulin seed storage protein 2-like | 3.12 | −1 | 7.97 | 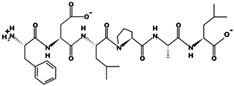 |
| GPGGGGR | 556.271 | Trypsin inhibitor | 11.13 | 1 | 15.60 | 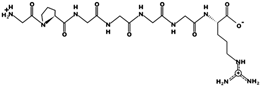 |
| SPGAGAP | 555.265 | Metabolic protein | 5.18 | 0 | 11.94 | 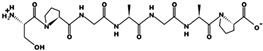 |
| HTGAGV | 540.265 | Metabolic protein | 7.69 | 0 | 12.82 |  |
| FGAR | 449.238 | Metabolic protein | 10.9 | 1 | 9.65 | 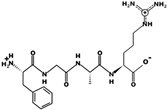 |
| LPGR | 441.269 | Metabolic protein | 11.11 | 1 | 9.75 | 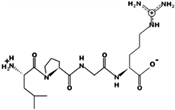 |
| LVGGP | 441.258 | Metabolic protein | 5.23 | 0 | 8.63 | 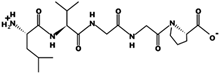 |
| VAGR | 401.238 | Metabolic protein | 11.11 | 1 | 10.90 | 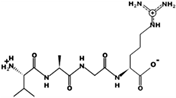 |
| LLR | 400.279 | Metabolic protein | 11.11 | 1 | 7.21 | 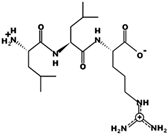 |
| Ratios of Chickpea Hydrolysate Added to Tortilla (%, w/w) | Soluble Protein (g/100 g Tortilla) | L* | a* | b* | Hue Angle (Radians) | Color Match | ||
|---|---|---|---|---|---|---|---|---|
| White maize tortilla | 0 | 4.02 ± 0.91 d | 73.47 ± 0.67 a | 2.00 ± 0.01 c | 26.90 ± 0.01 c | 1.50 ± 0.01 a | n/a |  |
| 5 | 7.65 ± 0.80 c | 71.78 ± 0.04 a | 2.56 ± 0.02 c | 28.71 ± 0.04 bc | 1.48 ± 0.01 b | 3.10 ± 0.01 |  | |
| 10 | 10.46 ± 0.43 b | 73.08 ± 1.16 a | 3.70 ± 0.64 b | 30.74 ± 2.86 b | 1.45 ± 0.01 c | 4.42 ± 3.01 |  | |
| 15 | 13.06 ± 1.12 a | 69.07 ± 0.01 b | 5.30 ± 0.01 a | 34.56 ± 0.03 a | 1.42 ± 0.01 d | 9.81 ± 0.02 |  | |
| Blue maize tortilla | 0 | 4.03 ± 0.04 d | 29.85 ± 0.11 d | −0.64 ± 0.07 d | 2.89 ± 0.10 c | 1.78 ± 0.01 a | n/a |  |
| 5 | 8.21 ± 0.70 bc | 42.57 ± 0.35 b | 5.12 ± 0.12 c | 6.46 ± 0.12 b | 0.90 ± 0.01 b | 14.08 ± 0.05 |  | |
| 10 | 10.05 ± 0.24 b | 38.71 ± 0.14 c | 7.07 ± 0.25 b | 6.49 ± 0.37 b | 0.74 ± 0.05 d | 11.86 ± 0.04 |  | |
| 15 | 12.61 ± 1.76 a | 45.86 ± 0.17 a | 8.50 ± 0.36 a | 9.09 ± 0.06 a | 0.82 ± 0.01 c | 19.04 ± 0.03 |  | |
| Fortification Ratio (%, w/w) | Thickness (mm) | Diameter (mm) | Moisture (%) | |||
|---|---|---|---|---|---|---|
| Fresh Tortilla | Fresh Tortilla | 0 h | 48 h | 7 days | ||
| White maize tortilla | 0 | 2.09 ± 0.25 a | 80.08 ± 1.33a | 34.47 ± 1.65 Bc | 70.97 ± 7.30 Aa | 64.93 ± 4.77 Aa |
| 5 | 1.80 ± 0.09 a | 81.13 ± 1.23 a | 43.86 ± 0.40 Ab | 52.04 ± 6.36 Abc | 45.64 ± 5.98 Ab | |
| 10 | 2.03 ± 0.06 a | 82.91 ± 0.19 a | 52.09 ± 4.84 Aa | 55.24 ± 8.49 Aab | 59.87 ± 3.91 Aa | |
| 15 | 1.87 ± 0.12 a | 80.11 ± 1.14 a | 36.94 ± 1.81 Abc | 37.28 ± 0.31 Ac | 41.25 ± 3.21 Ab | |
| Blue maize tortilla | 0 | 2.09 ± 0.10 a | 81.89 ± 0.33 a | 39.48 ± 4.12 Bb | 56.75 ± 8.94 Aa | 48.23 ± 2.87 ABab |
| 5 | 1.94 ± 0.10 a | 81.07 ± 1.27 a | 46.29 ± 4.31 Ab | 38.19 ± 8.01 Aa | 44.83 ± 2.29 Ab | |
| 10 | 2.17 ± 0.09 a | 79.11 ± 1.09 ab | 59.94 ± 3.81 Aa | 55.45 ± 9.85 Aa | 56.28 ± 299 Aa | |
| 15 | 1.97 ± 0.13 a | 78.00 ± 0.94 b | 36.55 ± 2.82 Ab | 36.08 ± 4.92 Aa | 37.91 ± 4.50 Ab | |
| Fortified Tortilla (% w/w) | 0 h | 48 h | 7 days | |||||||
|---|---|---|---|---|---|---|---|---|---|---|
| Hardness (N) | Cohesiveness | Penetration Force (N) | Hardness (N) | Cohesiveness | Penetration Force (N) | Hardness (N) | Cohesiveness | Penetration Force (N) | ||
| White maize tortilla | 0 | 13.56 ± 1.66 Bb | 0.90 ± 0.04 Aa | 0.18 ± 0.01 Ba | 16.97 ± 0.49 Ab | 0.92 ± 0.05 Aa | 0.18 ± 0.02 Bb | 3.63 ± 0.37 Cd | 0.91 ± 0.02 Aa | 0.35 ± 0.04 Aa |
| 5 | 9.96 ± 0.76 Bb | 0.89 ± 0.03 Aa | 0.22 ± 0.05 Aa | 12.15 ± 3.15 Bb | 0.92 ± 0.05 Aa | 0.26 ± 0.05 Aa | 18.60 ± 0.48 Ac | 0.94 ± 0.03 Aa | 0.35 ± 0.10 Aa | |
| 10 | 27.47 ± 3.18 Ba | 0.94 ± 0.02 Aa | 0.15 ± 0.04 Aa | 25.51 ± 1.96 Ba | 0.93 ± 0.05 Aa | 0.20 ± 0.01 Aa | 32.38 ± 1.12 Aa | 0.95 ± 0.03 Aa | 0.20 ± 0.03 Ab | |
| 15 | 25.58 ± 4.01 Aa | 0.90 ± 0.04 Aa | 0.21 ± 0.01 Aa | 24.24 ± 2.02 Aa | 0.90 ± 0.05 Aa | 0.21 ± 0.03 Aa | 25.39 ± 1.51 Ab | 0.96 ± 0.01 Aa | 0.21 ± 0.03 Aab | |
| Blue maize tortilla | 0 | 26.63 ± 1.99 Aa | 0.95 ± 0.02 Aa | 0.13 ± 0.01 Cc | 14.34 ± 0.95 Ba | 0.93 ± 0.04 Aa | 0.20 ± 0.02 Bb | 5.74 ± 0.35 Cc | 0.91 ± 0.05 Aa | 0.61 ± 0.03 Aa |
| 5 | 20.34 ± 3.97 Aa | 0.89 ± 0.03 Aa | 0.28 ± 0.02 Ba | 19.50 ± 3.72 Aa | 0.92 ± 0.04 Aa | 0.28 ± 0.03 Ba | 11.43 ± 0.48 Bb | 0.94 ± 0.01 Aa | 0.34 ± 0.01 Ab | |
| 10 | 26.39 ± 3.76 Aa | 0.94 ± 0.03 Aa | 0.13 ± 0.02 Bc | 14.38 ± 2.55 Ba | 0.91 ± 0.05 Aa | 0.20 ± 0.01 Ab | 21.53 ± 2.45 Aa | 0.94 ± 0.01 Aa | 0.18 ± 0.03 Ac | |
| 15 | 16.71 ± 2.63 Ab | 0.91 ± 0.02 Aa | 0.22 ± 0.02 Bb | 12.98 ± 2.84 Aa | 0.93 ± 0.02 Aa | 0.25 ± 0.01 ABa | 13.38 ± 0.90 Ab | 0.93 ± 0.03 Aa | 0.29 ± 0.03 Ab | |
Publisher’s Note: MDPI stays neutral with regard to jurisdictional claims in published maps and institutional affiliations. |
© 2021 by the authors. Licensee MDPI, Basel, Switzerland. This article is an open access article distributed under the terms and conditions of the Creative Commons Attribution (CC BY) license (https://creativecommons.org/licenses/by/4.0/).
Share and Cite
Acevedo-Martinez, K.A.; Gonzalez de Mejia, E. Fortification of Maize Tortilla with an Optimized Chickpea Hydrolysate and Its Effect on DPPIV Inhibition Capacity and Physicochemical Characteristics. Foods 2021, 10, 1835. https://doi.org/10.3390/foods10081835
Acevedo-Martinez KA, Gonzalez de Mejia E. Fortification of Maize Tortilla with an Optimized Chickpea Hydrolysate and Its Effect on DPPIV Inhibition Capacity and Physicochemical Characteristics. Foods. 2021; 10(8):1835. https://doi.org/10.3390/foods10081835
Chicago/Turabian StyleAcevedo-Martinez, Karla A., and Elvira Gonzalez de Mejia. 2021. "Fortification of Maize Tortilla with an Optimized Chickpea Hydrolysate and Its Effect on DPPIV Inhibition Capacity and Physicochemical Characteristics" Foods 10, no. 8: 1835. https://doi.org/10.3390/foods10081835