
High-Throughput Phenotyping Methods for Breeding Drought-Tolerant Crops

 , and
, and
Abstract
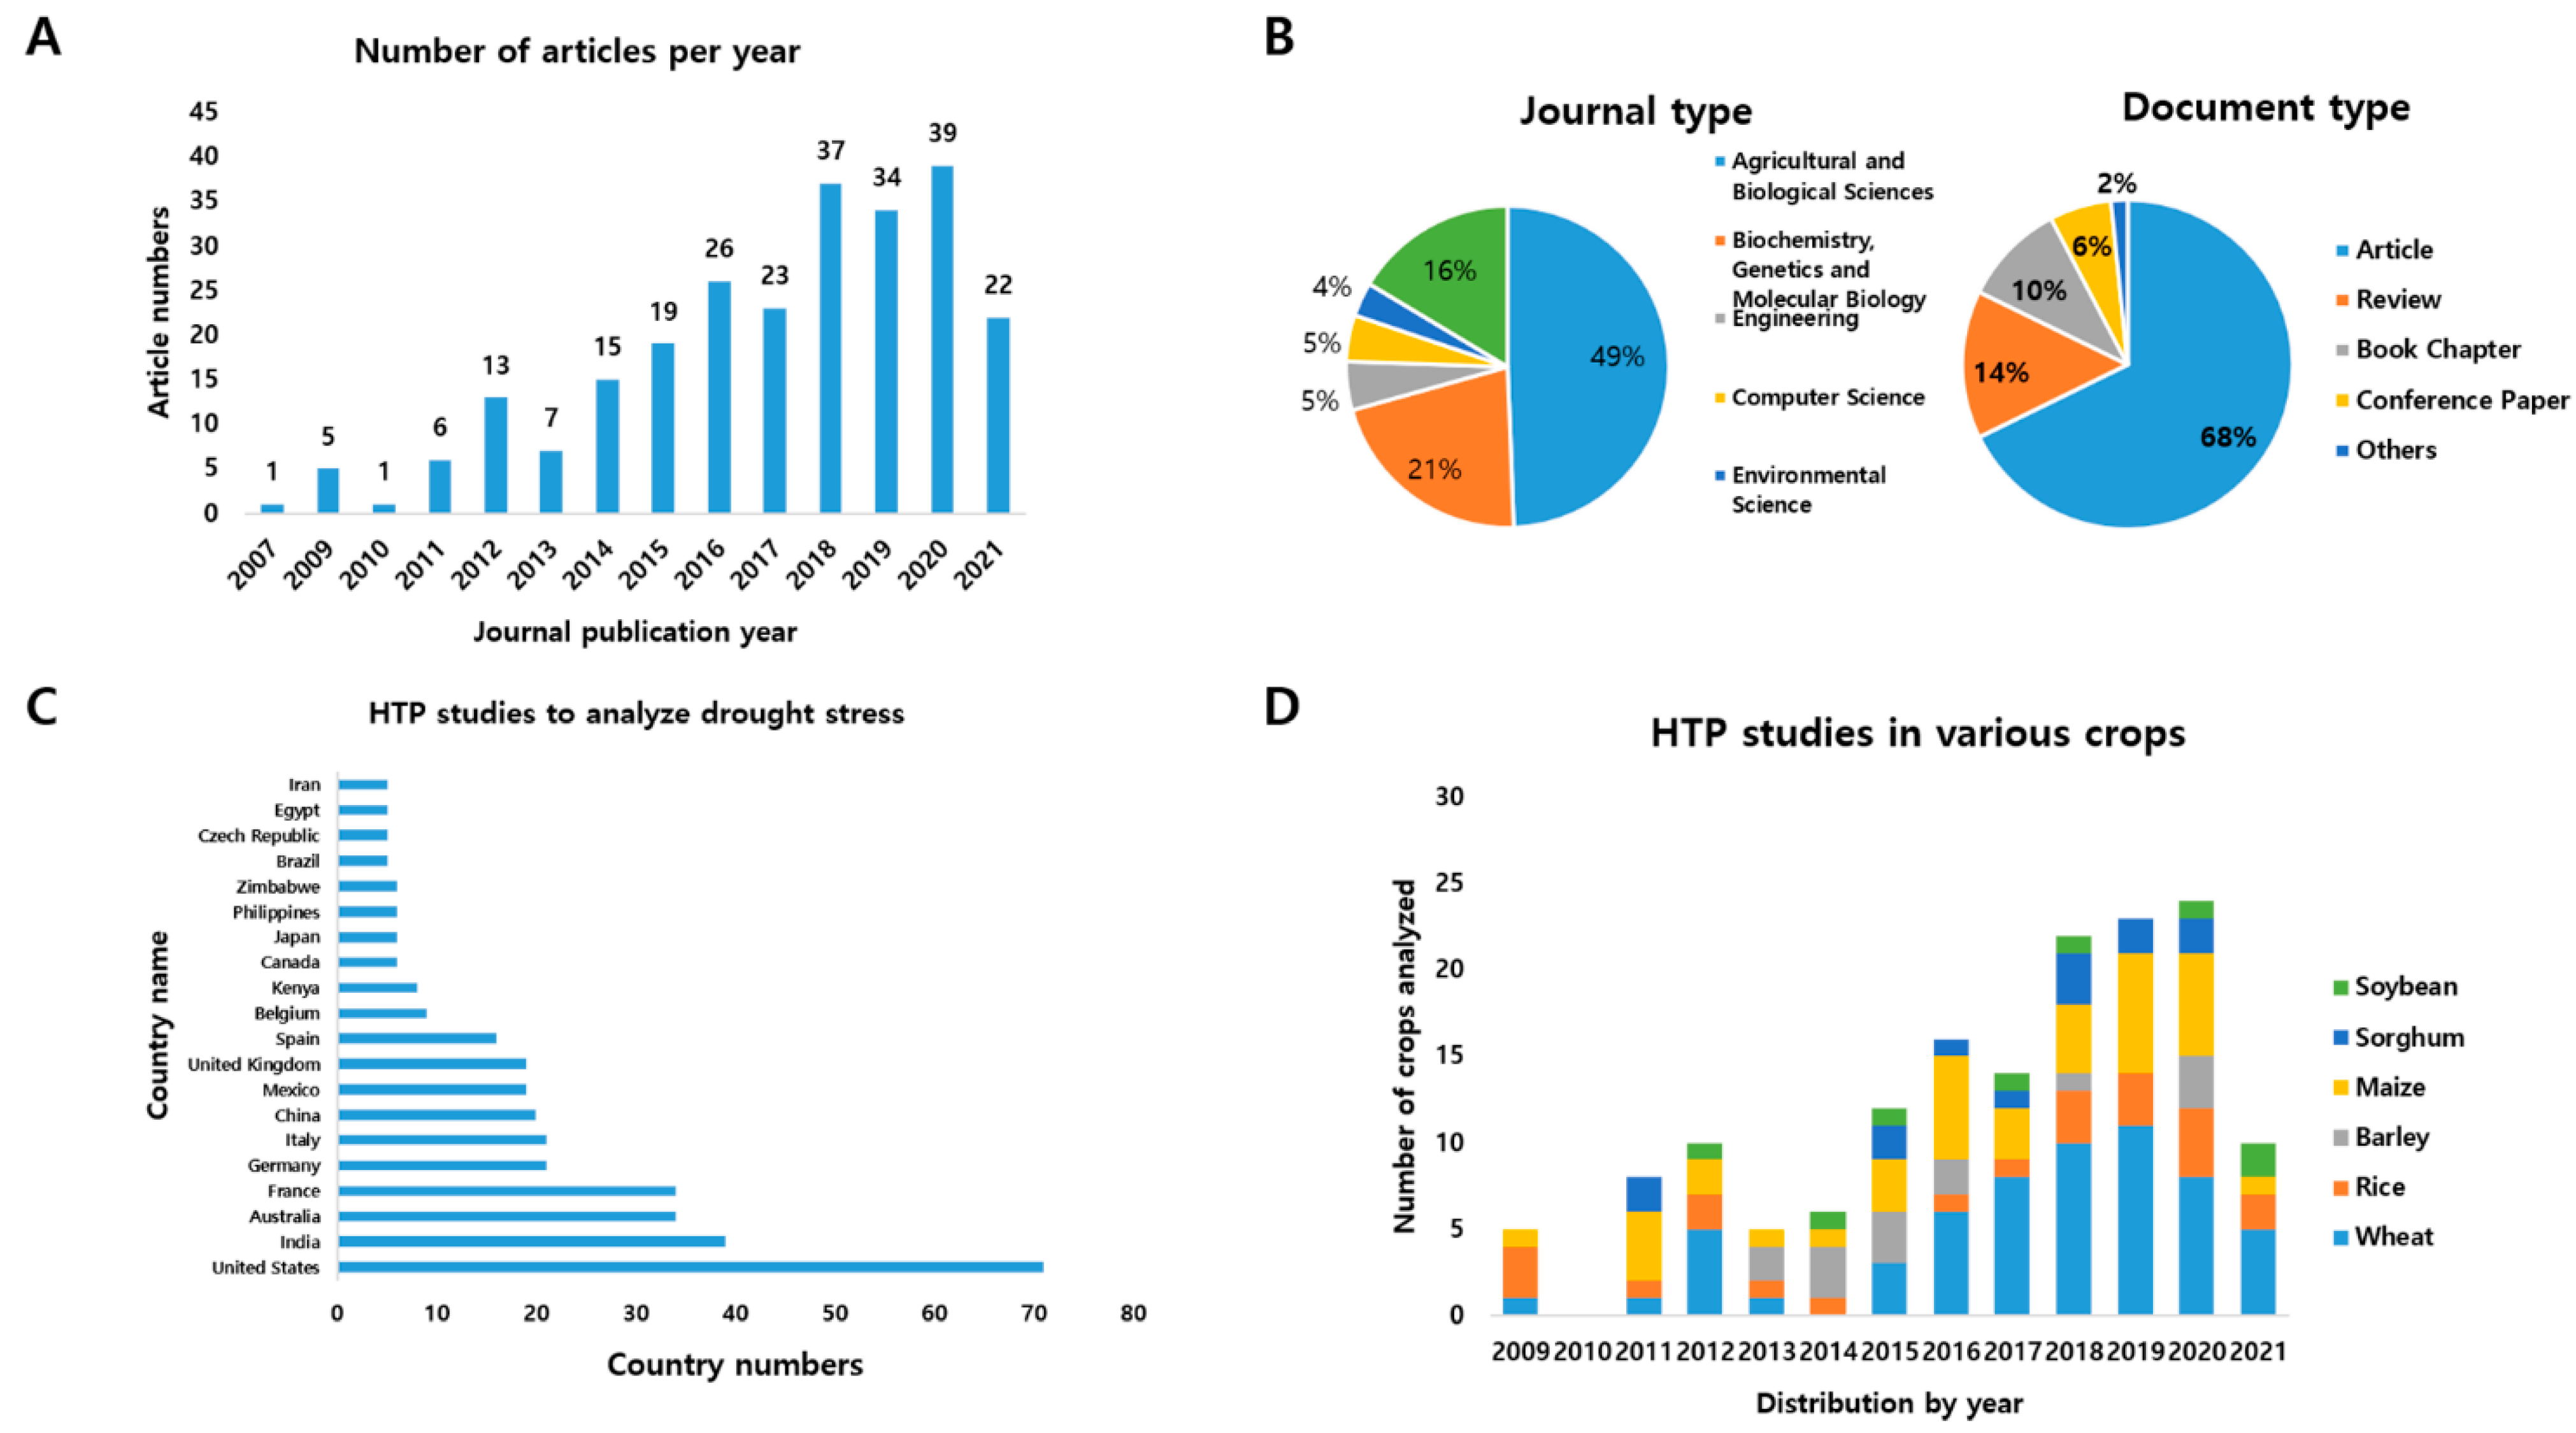
:1. Introduction
2. Plant Responses to Drought Stress
2.1. Changes in Water Content
2.2. Changes in Biomass
2.3. Physiological Changes (Stomatal Closure, Chlorophyll Deficiency, Photosynthetic Rate) in Response to Drought Stress
2.4. Yield Changes
3. Htp Methods
3.1. RGB Imaging
3.2. Near-Infrared Imaging
3.3. Hyperspectral Imaging
3.4. Fluorescence Imaging
3.5. Thermal Imaging
4. Future Perspective
5. Concluding Remarks
Author Contributions
Funding
Institutional Review Board Statement
Informed Consent Statement
Data Availability Statement
Acknowledgments
Conflicts of Interest
References
- Haberl, H.; Erb, K.-H.; Krausmann, F.; Bondeau, A.; Lauk, C.; Müller, C.; Plutzar, C.; Steinberger, J.K. Global bioenergy potentials from agricultural land in 2050: Sensitivity to climate change, diets and yields. Biomass Bioenergy 2011, 35, 4753–4769. [Google Scholar] [CrossRef] [Green Version]
- Ray, D.K.; Mueller, N.D.; West, P.C.; Foley, J.A. Yield trends are insufficient to double global crop production by 2050. PLoS ONE 2013, 8, e66428. [Google Scholar] [CrossRef] [PubMed] [Green Version]
- Suzuki, N.; Rivero, R.M.; Shulaev, V.; Blumwald, E.; Mittler, R. Abiotic and biotic stress combinations. New Phytol. 2014, 203, 32–43. [Google Scholar] [CrossRef] [PubMed]
- Wilhite, D.A.; Buchanan-Smith, M. Drought as hazard: Understanding the natural and social context. Drought Water Cris. Sci. Technol. Manag. Issues 2005, 2, 3–29. [Google Scholar]
- Nadeem, M.; Li, J.; Yahya, M.; Sher, A.; Ma, C.; Wang, X.; Qiu, L. Research progress and perspective on drought stress in legumes: A review. Int. J. Mol. Sci. 2019, 20, 2541. [Google Scholar] [CrossRef] [PubMed] [Green Version]
- Singh, D.; Singh, C.K.; Taunk, J.; Tomar, R.S.S.; Chaturvedi, A.K.; Gaikwad, K.; Pal, M. Transcriptome analysis of lentil (Lens culinaris Medikus) in response to seedling drought stress. BMC Genom. 2017, 18, 1–20. [Google Scholar] [CrossRef] [PubMed] [Green Version]
- Abou-Elwafa, S.F.; Shehzad, T. Genetic diversity, GWAS and prediction for drought and terminal heat stress tolerance in bread wheat (Triticum aestivum L.). Genet. Resour. Crop Evol. 2021, 68, 711–728. [Google Scholar] [CrossRef]
- Shakoor, N.; Lee, S.; Mockler, T.C. High throughput phenotyping to accelerate crop breeding and monitoring of diseases in the field. Curr. Opin. Plant Biol. 2017, 38, 184–192. [Google Scholar] [CrossRef]
- Keyvan, S. The effects of drought stress on yield, relative water content, proline, soluble carbohydrates and chlorophyll of bread wheat cultivars. J. Anim. Plant Sci. 2010, 8, 1051–1060. [Google Scholar]
- Schonfeld, M.A.; Johnson, R.C.; Carver, B.F.; Mornhinweg, D.W. Water relations in winter wheat as drought resistance indicators. Crop Sci. 1988, 28, 526–531. [Google Scholar] [CrossRef]
- Reddy, A.R.; Chaitanya, K.V.; Vivekanandan, M. Drought-induced responses of photosynthesis and antioxidant metabolism in higher plants. J. Plant Physiol. 2004, 161, 1189–1202. [Google Scholar] [CrossRef]
- Maghsoudi, K.; Emam, Y.; Pessarakli, M. Effect of silicon on photosynthetic gas exchange, photosynthetic pigments, cell membrane stability and relative water content of different wheat cultivars under drought stress conditions. J. Plant Nutr. 2016, 39, 1001–1015. [Google Scholar] [CrossRef]
- Ye, H.; Song, L.; Schapaugh, W.T.; Ali, M.L.; Sinclair, T.R.; Riar, M.K.; Mutava, R.N.; Li, Y.; Vuong, T.; Valliyodan, B. The importance of slow canopy wilting in drought tolerance in soybean. J. Exp. Bot. 2020, 71, 642–652. [Google Scholar] [CrossRef] [PubMed]
- Taiz, L.; Zeiger, E. Stress physiology (chapter 26). In Plant Physiology Book; Sinauer Associates: Sunderland, MA, USA, 2010; pp. 756–778. [Google Scholar]
- Zheng, M.; Tao, Y.; Hussain, S.; Jiang, Q.; Peng, S.; Huang, J.; Cui, K.; Nie, L. Seed priming in dry direct-seeded rice: Consequences for emergence, seedling growth and associated metabolic events under drought stress. Plant Growth Regul. 2016, 78, 167–178. [Google Scholar] [CrossRef]
- Jaleel, C.A.; Gopi, R.; Sankar, B.; Gomathinayagam, M.; Panneerselvam, R. Differential responses in water use efficiency in two varieties of Catharanthus roseus under drought stress. C. R. Biol. 2008, 331, 42–47. [Google Scholar] [CrossRef] [PubMed]
- Hu, Y.; Schmidhalter, U. Drought and salinity: A comparison of their effects on mineral nutrition of plants. J. Plant Nutr. Soil Sci. 2005, 168, 541–549. [Google Scholar] [CrossRef]
- Wu, Y.; Cosgrove, D.J. Adaptation of roots to low water potentials by changes in cell wall extensibility and cell wall proteins. J. Exp. Bot. 2000, 51, 1543–1553. [Google Scholar] [CrossRef] [PubMed] [Green Version]
- Karcher, D.E.; Richardson, M.D.; Hignight, K.; Rush, D. Drought tolerance of tall fescue populations selected for high root/shoot ratios and summer survival. Crop Sci. 2008, 48, 771–777. [Google Scholar] [CrossRef]
- Wang, W.-H.; Chen, J.; Liu, T.-W.; Chen, J.; Han, A.-D.; Simon, M.; Dong, X.-J.; He, J.-X.; Zheng, H.-L. Regulation of the calcium-sensing receptor in both stomatal movement and photosynthetic electron transport is crucial for water use efficiency and drought tolerance in Arabidopsis. J. Exp. Bot. 2014, 65, 223–234. [Google Scholar] [CrossRef] [PubMed] [Green Version]
- Guerfel, M.; Baccouri, O.; Boujnah, D.; Chaïbi, W.; Zarrouk, M. Impacts of water stress on gas exchange, water relations, chlorophyll content and leaf structure in the two main Tunisian olive (Olea europaea L.) cultivars. Sci. Hortic. 2009, 119, 257–263. [Google Scholar] [CrossRef]
- Manivannan, P.; Jaleel, C.A.; Sankar, B.; Kishorekumar, A.; Somasundaram, R.; Lakshmanan, G.A.; Panneerselvam, R. Growth, biochemical modifications and proline metabolism in Helianthus annuus L. as induced by drought stress. Colloids Surf. B Biointerfaces 2007, 59, 141–149. [Google Scholar] [CrossRef] [PubMed]
- Harris, D.; Tripathi, R.; Joshi, A. On-farm seed priming to improve crop establishment and yield in dry direct-seeded rice. Direct Seeding Res. Strateg. Oppor. Int. Res. Inst. Manila Philipp. 2002, 2, 231–240. [Google Scholar]
- Taiz, L.; Zeiger, E.; Møller, I.M.; Murphy, A. Plant Physiology and Development; Sinauer Associates Incorporated: Sunderland, MA, USA, 2015. [Google Scholar]
- Winterhalter, L.; Mistele, B.; Jampatong, S.; Schmidhalter, U. High throughput phenotyping of canopy water mass and canopy temperature in well-watered and drought stressed tropical maize hybrids in the vegetative stage. Eur. J. Agron. 2011, 35, 22–32. [Google Scholar] [CrossRef]
- Fukao, T.; Xiong, L. Genetic mechanisms conferring adaptation to submergence and drought in rice: Simple or complex? Curr. Opin. Plant Biol. 2013, 16, 196–204. [Google Scholar] [CrossRef] [PubMed]
- Ge, Y.; Bai, G.; Stoerger, V.; Schnable, J.C. Temporal dynamics of maize plant growth, water use, and leaf water content using automated high throughput RGB and hyperspectral imaging. Comput. Electron. Agric. 2016, 127, 625–632. [Google Scholar] [CrossRef] [Green Version]
- Neilson, E.H.; Edwards, A.M.; Blomstedt, C.; Berger, B.; Møller, B.L.; Gleadow, R.M. Utilization of a high-throughput shoot imaging system to examine the dynamic phenotypic responses of a C4 cereal crop plant to nitrogen and water deficiency over time. J. Exp. Bot. 2015, 66, 1817–1832. [Google Scholar] [CrossRef]
- Campbell, M.T.; Grondin, A.; Walia, H.; Morota, G. Leveraging genome-enabled growth models to study shoot growth responses to water deficit in rice. J. Exp. Bot. 2020, 71, 5669–5679. [Google Scholar] [CrossRef] [PubMed]
- Becker, E.; Schmidhalter, U. Evaluation of yield and drought using active and passive spectral sensing systems at the reproductive stage in wheat. Front. Plant Sci. 2017, 8, 379. [Google Scholar] [CrossRef] [Green Version]
- Bhandari, M.; Baker, S.; Rudd, J.C.; Ibrahim, A.M.; Chang, A.; Xue, Q.; Jung, J.; Landivar, J.; Auvermann, B. Assessing the Effect of Drought on Winter Wheat Growth Using Unmanned Aerial System (UAS)-Based Phenotyping. Remote Sens. 2021, 13, 1144. [Google Scholar] [CrossRef]
- Francesconi, S.; Harfouche, A.; Maesano, M.; Balestra, G.M. UAV-Based Thermal, RGB Imaging and Gene Expression Analysis Allowed Detection of Fusarium Head Blight and Gave New Insights Into the Physiological Responses to the Disease in Durum Wheat. Front. Plant Sci. 2021, 12, 551. [Google Scholar] [CrossRef]
- Bai, G.; Ge, Y.; Hussain, W.; Baenziger, P.S.; Graef, G. A multi-sensor system for high throughput field phenotyping in soybean and wheat breeding. Comput. Electron. Agric. 2016, 128, 181–192. [Google Scholar] [CrossRef] [Green Version]
- Nehe, A.; Foulkes, M.; Ozturk, I.; Rasheed, A.; York, L.; Kefauver, S.; Ozdemir, F.; Morgounov, A. Root and canopy traits and adaptability genes explain drought tolerance responses in winter wheat. PLoS ONE 2021, 16, e0242472. [Google Scholar] [CrossRef]
- Shabannejad, M.; Bihamta, M.-R.; Majidi-Hervan, E.; Alipour, H.; Ebrahimi, A. A simple, cost-effective high-throughput image. Plant Methods 2020, 16, 1–11. [Google Scholar] [CrossRef]
- Chen, D.; Neumann, K.; Friedel, S.; Kilian, B.; Chen, M.; Altmann, T.; Klukas, C. Dissecting the phenotypic components of crop plant growth and drought responses based on high-throughput image analysis. Plant Cell 2014, 26, 4636–4655. [Google Scholar] [CrossRef] [PubMed] [Green Version]
- Das, B.; Sahoo, R.N.; Pargal, S.; Krishna, G.; Verma, R.; Viswanathan, C.; Sehgal, V.K.; Gupta, V.K. Evaluation of different water absorption bands, indices and multivariate models for water-deficit stress monitoring in rice using visible-near infrared spectroscopy. Spectrochim. Acta Part A Mol. Biomol. Spectrosc. 2021, 247, 119104. [Google Scholar] [CrossRef]
- El-Hendawy, S.E.; Hassan, W.M.; Al-Suhaibani, N.A.; Schmidhalter, U. Spectral assessment of drought tolerance indices and grain yield in advanced spring wheat lines grown under full and limited water irrigation. Agric. Water Manag. 2017, 182, 1–12. [Google Scholar] [CrossRef]
- Rischbeck, P.; Elsayed, S.; Mistele, B.; Barmeier, G.; Heil, K.; Schmidhalter, U. Data fusion of spectral, thermal and canopy height parameters for improved yield prediction of drought stressed spring barley. Eur. J. Agron. 2016, 78, 44–59. [Google Scholar] [CrossRef]
- Sankaran, S.; Zhou, J.; Khot, L.R.; Trapp, J.J.; Mndolwa, E.; Miklas, P.N. High-throughput field phenotyping in dry bean using small unmanned aerial vehicle based multispectral imagery. Comput. Electron. Agric. 2018, 151, 84–92. [Google Scholar] [CrossRef]
- Tattaris, M.; Reynolds, M.P.; Chapman, S.C. A direct comparison of remote sensing approaches for high-throughput phenotyping in plant breeding. Front. Plant Sci. 2016, 7, 1131. [Google Scholar] [CrossRef]
- Romano, G.; Zia, S.; Spreer, W.; Sanchez, C.; Cairns, J.; Araus, J.L.; Müller, J. Use of thermography for high throughput phenotyping of tropical maize adaptation in water stress. Comput. Electron. Agric. 2011, 79, 67–74. [Google Scholar] [CrossRef]
- Trachsel, S.; Dhliwayo, T.; Gonzalez Perez, L.; Mendoza Lugo, J.A.; Trachsel, M. Estimation of physiological genomic estimated breeding values (PGEBV) combining full hyperspectral and marker data across environments for grain yield under combined heat and drought stress in tropical maize (Zea mays L.). PLoS ONE 2019, 14, e0212200. [Google Scholar] [CrossRef]
- Condorelli, G.E.; Maccaferri, M.; Newcomb, M.; Andrade-Sanchez, P.; White, J.W.; French, A.N.; Sciara, G.; Ward, R.; Tuberosa, R. Comparative aerial and ground based high throughput phenotyping for the genetic dissection of NDVI as a proxy for drought adaptive traits in durum wheat. Front. Plant Sci. 2018, 9, 893. [Google Scholar] [CrossRef]
- Elsayed, S.; Rischbeck, P.; Schmidhalter, U. Comparing the performance of active and passive reflectance sensors to assess the normalized relative canopy temperature and grain yield of drought-stressed barley cultivars. Field Crops Res. 2015, 177, 148–160. [Google Scholar] [CrossRef]
- Bürling, K.; Cerovic, Z.G.; Cornic, G.; Ducruet, J.-M.; Noga, G.; Hunsche, M. Fluorescence-based sensing of drought-induced stress in the vegetative phase of four contrasting wheat genotypes. Environ. Exp. Bot. 2013, 89, 51–59. [Google Scholar] [CrossRef]
- Daszkowska-Golec, A.; Collin, A.; Sitko, K.; Janiak, A.; Kalaji, H.M.; Szarejko, I. Genetic and physiological dissection of photosynthesis in barley exposed to drought stress. Int. J. Mol. Sci. 2019, 20, 6341. [Google Scholar] [CrossRef] [PubMed] [Green Version]
- Pshenichnikova, T.A.; Doroshkov, A.V.; Osipova, S.V.; Permyakov, A.V.; Permyakova, M.D.; Efimov, V.M.; Afonnikov, D.A. Quantitative characteristics of pubescence in wheat (Triticum aestivum L.) are associated with photosynthetic parameters under conditions of normal and limited water supply. Planta 2019, 249, 839–847. [Google Scholar] [CrossRef]
- Rane, J.; Sharma, D.; Ekatpure, S.; Aher, L.; Kumar, M.; Prasad, S.; Nankar, A.; Singh, N. Relative tolerance of photosystem II in spike, leaf, and stem of bread and durum wheat under desiccation. Photosynthetica 2019, 57, 1100–1108. [Google Scholar] [CrossRef] [Green Version]
- Mikołajczak, K.; Ogrodowicz, P.; Ćwiek-Kupczyńska, H.; Weigelt-Fischer, K.; Mothukuri, S.R.; Junker, A.; Altmann, T.; Krystkowiak, K.; Adamski, T.; Surma, M. Image Phenotyping of Spring Barley (Hordeum vulgare L.) RIL Population Under Drought: Selection of Traits and Biological Interpretation. Front. Plant Sci. 2020, 11, 743. [Google Scholar] [PubMed]
- Tschiersch, H.; Junker, A.; Meyer, R.C.; Altmann, T. Establishment of integrated protocols for automated high throughput kinetic chlorophyll fluorescence analyses. Plant Methods 2017, 13, 1–16. [Google Scholar] [CrossRef] [Green Version]
- McAusland, L.; Atkinson, J.A.; Lawson, T.; Murchie, E.H. High throughput procedure utilising chlorophyll fluorescence imaging to phenotype dynamic photosynthesis and photoprotection in leaves under controlled gaseous conditions. Plant Methods 2019, 15, 1–15. [Google Scholar] [CrossRef]
- Begovic, L.; Galic, V.; Abicic, I.; Loncaric, Z.; Mlinaric, S. Implications of intra-seasonal climate variations on chlorophyll a fluorescence and biomass in winter barley breeding program. Photosynthetica 2020, 58, 995–1008. [Google Scholar] [CrossRef]
- Fernández-Calleja, M.; Monteagudo, A.; Casas, A.M.; Boutin, C.; Pin, P.A.; Morales, F.; Igartua, E. Rapid on-site phenotyping via field fluorimeter detects differences in photosynthetic performance in a hybrid—parent barley germplasm set. Sensors 2020, 20, 1486. [Google Scholar] [CrossRef] [PubMed] [Green Version]
- Hao, D.; Chao, M.; Yin, Z.; Yu, D. Genome-wide association analysis detecting significant single nucleotide polymorphisms for chlorophyll and chlorophyll fluorescence parameters in soybean (Glycine max) landraces. Euphytica 2012, 186, 919–931. [Google Scholar] [CrossRef]
- Rosero, A.; Pérez, J.-L.; Rosero, D.; Burgos-Paz, W.; Martínez, R.; Morelo, J.; Pastrana, I.; Burbano, E.; Morales, A. Morphometric and colourimetric tools to dissect morphological diversity: An application in sweet potato [Ipomoea batatas (L.) Lam.]. Genet. Resour. Crop Evol. 2019, 66, 1257–1278. [Google Scholar] [CrossRef] [Green Version]
- Faragó, D.; Sass, L.; Valkai, I.; Andrási, N.; Szabados, L. PlantSize offers an affordable, non-destructive method to measure plant size and color in vitro. Front. Plant Sci. 2018, 9, 219. [Google Scholar] [CrossRef] [Green Version]
- Khan, Z.; Rahimi-Eichi, V.; Haefele, S.; Garnett, T.; Miklavcic, S.J. Estimation of vegetation indices for high-throughput phenotyping of wheat using aerial imaging. Plant Methods 2018, 14, 1–11. [Google Scholar] [CrossRef] [PubMed]
- Ge, Y.; Atefi, A.; Zhang, H.; Miao, C.; Ramamurthy, R.K.; Sigmon, B.; Yang, J.; Schnable, J.C. High-throughput analysis of leaf physiological and chemical traits with VIS–NIR–SWIR spectroscopy: A case study with a maize diversity panel. Plant Methods 2019, 15, 1–12. [Google Scholar] [CrossRef] [PubMed] [Green Version]
- Rutkoski, J.; Poland, J.; Mondal, S.; Autrique, E.; Pérez, L.G.; Crossa, J.; Reynolds, M.; Singh, R. Canopy temperature and vegetation indices from high-throughput phenotyping improve accuracy of pedigree and genomic selection for grain yield in wheat. G3 Genes Genomes Genet. 2016, 6, 2799–2808. [Google Scholar] [CrossRef] [Green Version]
- Rajendran, K.; Tester, M.; Roy, S.J. Quantifying the three main components of salinity tolerance in cereals. Plant Cell Environ. 2009, 32, 237–249. [Google Scholar] [CrossRef]
- Chaerle, L.; Van Der Straeten, D. Seeing is believing: Imaging techniques to monitor plant health. Biochim. Biophys. Acta BBA-Gene Struct. Expr. 2001, 1519, 153–166. [Google Scholar] [CrossRef]
- Buschmann, C.; Langsdorf, G.; Lichtenthaler, H.K. Fluorescence: The blue, green, rad and far-red fluorescence signatures of plant tissues their multicolour fluorescence imaging and application for agrofood assessment. Opt. Monit. Fresh Process. Agric. Crop. 2008, 32, 272–319. [Google Scholar]
- Kim, S.L.; Kim, N.; Lee, H.; Lee, E.; Cheon, K.-S.; Kim, M.; Baek, J.; Choi, I.; Ji, H.; Yoon, I.S. High-throughput phenotyping platform for analyzing drought tolerance in rice. Planta 2020, 252, 1–18. [Google Scholar] [CrossRef] [PubMed]
- Murchie, E.H.; Lawson, T. Chlorophyll fluorescence analysis: A guide to good practice and understanding some new applications. J. Exp. Bot. 2013, 64, 3983–3998. [Google Scholar] [CrossRef] [Green Version]
- Tietz, S.; Hall, C.C.; Cruz, J.A.; Kramer, D.M. NPQ (T): A Chlorophyll Fluorescence Parameter for Rapid Estimation and Imaging of Non-Photochemical Quenching of Excitons in Photosystem-II-Associated Antenna Complexes; 0140-7791; Wiley Online Library: Hoboken, NJ, USA, 2017. [Google Scholar]
- Ishimwe, R.; Abutaleb, K.; Ahmed, F. Applications of thermal imaging in agriculture—A review. Adv. Remote Sens. 2014, 3, 128. [Google Scholar] [CrossRef] [Green Version]
- Kaler, A.S.; Ray, J.D.; Schapaugh, W.T.; Asebedo, A.R.; King, C.A.; Gbur, E.; Purcell, L.C. Association mapping identifies loci for canopy temperature under drought in diverse soybean genotypes. Euphytica 2018, 214, 1–18. [Google Scholar] [CrossRef]
- Jones, H. Plants and Microclimate: A Quantitative Approach to Environmental Plant Physiology; Cambridge University Press: Cambridge, UK, 2013; pp. 1–407. [Google Scholar]
- Amal, T.C.; Thottathil, A.T.; Veerakumari, K.P.; Rakkiyappan, R.; Vasanth, K. Morphological traits of drought tolerant horse gram germplasm: Classification through machine learning. J. Sci. Food Agric. 2020, 100, 4959–4967. [Google Scholar] [CrossRef]
- Zhang, C.; Craine, W.A.; McGee, R.J.; Vandemark, G.J.; Davis, J.B.; Brown, J.; Hulbert, S.H.; Sankaran, S. Image-based phenotyping of flowering intensity in cool-season crops. Sensors 2020, 20, 1450. [Google Scholar] [CrossRef] [Green Version]
- Brichet, N.; Fournier, C.; Turc, O.; Strauss, O.; Artzet, S.; Pradal, C.; Welcker, C.; Tardieu, F.; Cabrera-Bosquet, L. A robot-assisted imaging pipeline for tracking the growths of maize ear and silks in a high-throughput phenotyping platform. Plant Methods 2017, 13, 1–12. [Google Scholar] [CrossRef] [Green Version]
- Zhao, J.; Sykacek, P.; Bodner, G.; Rewald, B. Root traits of European Vicia faba cultivars—Using machine learning to explore adaptations to agroclimatic conditions. Plant Cell Environ. 2018, 41, 1984–1996. [Google Scholar] [CrossRef] [PubMed] [Green Version]
- Khanna, R.; Schmid, L.; Walter, A.; Nieto, J.; Siegwart, R.; Liebisch, F. A spatio temporal spectral framework for plant stress phenotyping. Plant Methods 2019, 15, 1–18. [Google Scholar] [CrossRef] [PubMed] [Green Version]
- Zhou, J.; Zhou, J.; Ye, H.; Ali, M.L.; Nguyen, H.T.; Chen, P. Classification of soybean leaf wilting due to drought stress using UAV-based imagery. Comput. Electron. Agric. 2020, 175, 105576. [Google Scholar] [CrossRef]
- Kar, S.; Purbey, V.K.; Suradhaniwar, S.; Korbu, L.B.; Kholová, J.; Durbha, S.S.; Adinarayana, J.; Vadez, V. An ensemble machine learning approach for determination of the optimum sampling time for evapotranspiration assessment from high-throughput phenotyping data. Comput. Electron. Agric. 2021, 182, 105992. [Google Scholar] [CrossRef]
- Zhou, J.; Zhou, J.; Ye, H.; Ali, M.L.; Chen, P.; Nguyen, H.T. Yield estimation of soybean breeding lines under drought stress using unmanned aerial vehicle-based imagery and convolutional neural network. Biosyst. Eng. 2021, 204, 90–103. [Google Scholar] [CrossRef]
- Zhuang, S.; Wang, P.; Jiang, B.; Li, M. Learned features of leaf phenotype to monitor maize water status in the fields. Comput. Electron. Agric. 2020, 172, 105347. [Google Scholar] [CrossRef]
- Yasrab, R.; Atkinson, J.A.; Wells, D.M.; French, A.P.; Pridmore, T.P.; Pound, M.P. RootNav 2.0: Deep learning for automatic navigation of complex plant root architectures. GigaScience 2019, 8, giz123. [Google Scholar] [CrossRef] [Green Version]
- Rehman, T.U.; Ma, D.; Wang, L.; Zhang, L.; Jin, J. Predictive spectral analysis using an end-to-end deep model from hyperspectral images for high-throughput plant phenotyping. Comput. Electron. Agric. 2020, 177, 105713. [Google Scholar] [CrossRef]

| Sensor | Platform | Trait | Advantages | Limitations | References |
|---|---|---|---|---|---|
| RGB | Laboratory, fixed | Shoot biomass, leaf/shoot area, identify aging through color analysis, growth rate | Environmental control possible, relatively affordable | Only provides morphological information | [27,28,29] |
| Field, fixed | Distinguish ground cover and plants | Quickly obtain information on breeding rows for large populations | Image blur and area mismatch errors occur due to changes in light conditions | [30] | |
| Field, aerial | Leaf area index (LAI), canopy length, wilting characteristics, yield estimation | [31,32] | |||
| Field, vehicle | NDVI, yield estimation | [33] | |||
| Field, portable | Root biomass, canopy color, canopy length | [34,35] | |||
| NIR | Laboratory, fixed | Water content, canopy spectrum reflectance | Low water reflectance, simple use | Limited use with narrow reflectance range | [36,37] |
| Field, portable | Canopy reflectance | [38] | |||
| Thermal | Field, aerial, vehicle | Canopy temperature | Able to quickly analyze increases in plant temperature | Difficulty in distinguishing plants | [39,40,41,42] |
| Hyperspectral | Laboratory, fixed | Leaf water content, canopy spectrum | Precise data detection possible using multiple bands | Difficulty in selecting and calibrating specific bands | [27,39] |
| Field, aerial | Plant height, flowering date, yield estimation, NDVI, | [40,41,43,44,45] | |||
| Field, vehicle | Canopy reflectance, solar radiation | [39,45] | |||
| Fluorescence | Laboratory, fixed | Chlorophyll fluorescence, gas exchange, transpiration, stomatal conductance | Automatic and rapid measurement of photosynthetic rate | Difficult to use in the field, requires dark adaptation | [36,46,47,48,49,50,51,52] |
| Field, portable | Chlorophyll fluorescence | [53,54,55] |
| Model | Method | Sensor for Used Data | Crop | Trait | Performance | Reference |
|---|---|---|---|---|---|---|
| Machine learning | K-means clustering | RGB | Macrotyloma uniflorum | plant shoot length, height, flowering percentage, pod, pod length, number of seeds | clustering complete | [70] |
| RGB, NIR | Brassica napus, Camelina sativa, Fabaceae, Cicer arietinum | flowering detection UAV | >72% | [71] | ||
| RF 1 | RGB | Zea mays | identify location and growth rate of silk | >86% | [72] | |
| RF, k-nearest neighbor, univariate permutation test | scanner | Vicia faba | root architecture | RF produce the best performance | [73] | |
| SVM 2 | RGB, IR, HS | Beta vulgaris | water, nitrogen, and weed stress | >93, 76, and 83% | [74] | |
| RGB, IR | Glycine max | canopy wilting | >76% | [75] | ||
| SVM, RF, ANN 3 | 3D laser scanning | Cicer arietinum | evapotranspiration (ET) | SVM produced the best results | [76] | |
| Deep learning | CNN 4 | RGB, multispectral | Glycine max | yield estimation | >78% | [77] |
| RGB | Zea mays | water stress | >88% | [78] | ||
| RGB | Triticum | root architecture | r2 = 0.64–0.99 | [79] | ||
| HS | Zea mays | relative water content (RWC) | >87% | [80] |
Publisher’s Note: MDPI stays neutral with regard to jurisdictional claims in published maps and institutional affiliations. |
© 2021 by the authors. Licensee MDPI, Basel, Switzerland. This article is an open access article distributed under the terms and conditions of the Creative Commons Attribution (CC BY) license (https://creativecommons.org/licenses/by/4.0/).
Share and Cite
Kim, M.; Lee, C.; Hong, S.; Kim, S.L.; Baek, J.-H.; Kim, K.-H. High-Throughput Phenotyping Methods for Breeding Drought-Tolerant Crops. Int. J. Mol. Sci. 2021, 22, 8266. https://doi.org/10.3390/ijms22158266
Kim M, Lee C, Hong S, Kim SL, Baek J-H, Kim K-H. High-Throughput Phenotyping Methods for Breeding Drought-Tolerant Crops. International Journal of Molecular Sciences. 2021; 22(15):8266. https://doi.org/10.3390/ijms22158266
Chicago/Turabian StyleKim, Minsu, Chaewon Lee, Subin Hong, Song Lim Kim, Jeong-Ho Baek, and Kyung-Hwan Kim. 2021. "High-Throughput Phenotyping Methods for Breeding Drought-Tolerant Crops" International Journal of Molecular Sciences 22, no. 15: 8266. https://doi.org/10.3390/ijms22158266
APA StyleKim, M., Lee, C., Hong, S., Kim, S. L., Baek, J.-H., & Kim, K.-H. (2021). High-Throughput Phenotyping Methods for Breeding Drought-Tolerant Crops. International Journal of Molecular Sciences, 22(15), 8266. https://doi.org/10.3390/ijms22158266