Article

Determining the Resilience of Rural Households to Food Insecurity during Drought Conditions in Fars Province, Iran

by
Nosha Nahid
1,
Farhad Lashgarara
1,*,
Seyed Jamal Farajolah Hosseini
1,
Seyed Mehdi Mirdamadi
1 and
Kurosh Rezaei-Moghaddam
2
1
Department of Economic, Agricultural Extension and Education, Science and Research Branch, Islamic Azad University, Tehran 14778-93855, Iran
2
Department of Agricultural Extension and Education, School of Agriculture, Shiraz University, Shiraz 71441-13131, Iran
*
Author to whom correspondence should be addressed.
Sustainability 2021, 13(15), 8384; https://doi.org/10.3390/su13158384
Submission received: 4 May 2021 / Revised: 25 June 2021 / Accepted: 20 July 2021 / Published: 27 July 2021

Abstract

:
Climate change and drought have greatly affected the food security of rural families. Regarding to importance of the resilience approach in food security, this study aimed to examine the resiliency determinant factors based on six indicators included income and food access, access to basic services, assets, social safety net, adaptive capacity, and stability. The above-mentioned indicators were extracted from the food and agricultural organization’s resilience index. This research was of the survey type, and data were collected from a sample of population based on a stratified random sampling. The sample population was 270 respondents from the Fars province who faced food insecurity due to drought. Based on the factorial analysis, the model presented in this research had a high predictability of resilience among rural households. The validity and reliability of this model were tested and verified. The results showed that the stability variable was considered the most important resiliency determinant toward food insecurity. Cluster analysis suggested two groups: high- and low-resilience households. The results revealed that more than half of rural families had a lower resilience to food insecurity, while less than 45 percent of rural households in this study had higher resiliency, which was characterized by a series of features. The verified model in this study identified a standard framework for assessing the resiliency of households to cope with food insecurity and to recover from shocks related to drought.

1. Introduction

Drought, as one of the severe effects of climate change, has caused significant damage to agricultural and rural communities [1,2]. Its impact on economic, social, and environmental conditions cannot be ignored [3,4], and it has been one of the major concerns for governments in developing countries. It is estimated that nearly 40 percent of the world population is strongly exposed to effects of drought in their access to water, crop production, migration, livelihoods, and food security [5]. Drought affects the global food system [6,7,8] and its impact on dimensions of food security is undeniable [9]. According to the latest estimate of the World Food Organization in 2018, nearly 10% of the world’s population (770 million people), has been exposed to severe food insecurity [10].
In regard to climate changes and increasing threats to food security, especially in developing countries, as well as in the capabilities of these countries to cope with this crisis, a different investigation using a new approach is crucial.
According to FAO reports (2016) [11], the adaptation of smallholder farmers to climate change is critical to reducing global poverty and food insecurity. In other words, after many years, a new approach to food security has emerged that seeks to predict crises and cope with or adapt to a certain shock [12,13].
In recent years, there has been a shift from vulnerability to resilience through mitigating risks, increasing adaptability, diversifying livelihoods, enhancing communication, and making appropriate decisions [14]. Resilience is defined as the ability to prevent hazards and crises, as well as to anticipate, absorb, adapt and improve them in a timely, adequate, and sustainable manner, including maintaining, storing, and improving livelihoods against threats to agriculture, nutrition, and food safety [5].
The FAO (Food and Agricultural Organization), IFAD (International Fund for Agricultural Development) and the WFP (World Food Program) [15], have developed a common approach to building resilience to improve food security and nutrition. According to the three organizations, collectively called the Rome-based agencies (RBA), resilience is essentially about the inherent capacities (abilities) of individuals, groups, communities, and institutions to withstand, cope, recover, adapt, and transform in the face of shocks.
The dimension of resilience includes changing thresholds while maintaining their function and basic structure, as well as self-organizing, learning and adapting capacity through coping and recovery after hardships and crises [16]. It is important to point out that the inattention to the management and sustainability of food security and the food system [17] and the neglect of resiliency [12] against such dangers are recognized as the main reasons for vulnerability in rural households. The consequences of prolonged droughts in food insecurity to rural households implies farmers’ lack of readiness and resilience, as well as the inefficiency of crisis management systems, leading to a lack of capacity to cope with and face such changes.
Various studies focused on communities’ resiliency and emphasized the issues of social, economic, institutional, and environmental factors [18,19,20,21,22,23,24,25,26]. Ciani [27] showed that factors such as income and asset diversity, educational networks, strategic reserve of resources, and household livelihood strategies can significantly enhance the resiliency of rural households. Maleksaeedi and Karami [16], pointed out that resiliency can be understood through the system response during and after the crisis. They provide a framework for determining the resiliency of rural households to water scarcity based on three factors, which included “adaptations to water scarcity”, “retaining structure and function”, and “retaining individual capabilities.” Alinovi and others [12] designed an equation for assessing the resilience of rural households, including income and access to food, assets, public services, social safety nets, and adaptive capacity. Boukary and others [28] examined resiliency in seven regions of Nigeria based on the determinants of food insecurity resiliency, including assets, adaptive capacity, social safety nets, and climate change. Kebede and others [29], in order to analyze the ability of rural households to absorb the negative impacts of sudden shocks in Ethiopia, used a resilience analysis framework including agricultural and technology inputs, social safety networks, access to public services, access to income and food, assets, adaptive capacity, and stability.
Iran, with more than 1.5 million km2, is known as the eighteenth largest country in the world, and has a population of around 80 million [30]. In recent decades, Iran has faced drought and, according to the latest drought statistics based on the SPEI index, 97% of the country is prone toward drought. In the long-term scale, 8% of the country is under mild drought, 30% under moderate drought, 47% under severe drought, and 10% under total drought. [31].
Agriculture is inherently sensitive to weather and climate conditions, and it is among the most vulnerable sectors to the risks related to global climate change [32]. Prolonged drought in Iran led to loss of agricultural production and food shortages, with inadequate socio-economic entitlements and the exacerbated vulnerability of rural households [33] that could greatly affect their agricultural income. Therefore, building and improving resilience is essential for rural households whose livelihoods depend on agriculture directly.
Several studies have addressed rural household drought and its negative impacts, such as the food insecurity in Iran, but research about ongoing adaptation strategies and the resilience approach to increase food security in the context of drought is limited. Regarding the multidimensional and complex nature of resiliency, the dominating challenge is to measure the resiliency of rural households and recognize its main determinants to food insecurity under drought. To fill this gap, this paper proposes a method to estimate resilience index, analyzes the most important components of household resiliency, examines whether the household resilience index is a good predictor of future food security recovery after a shock, develops a typology of rural household resiliency using cluster analysis, and investigates the main characteristics of the households in each cluster.

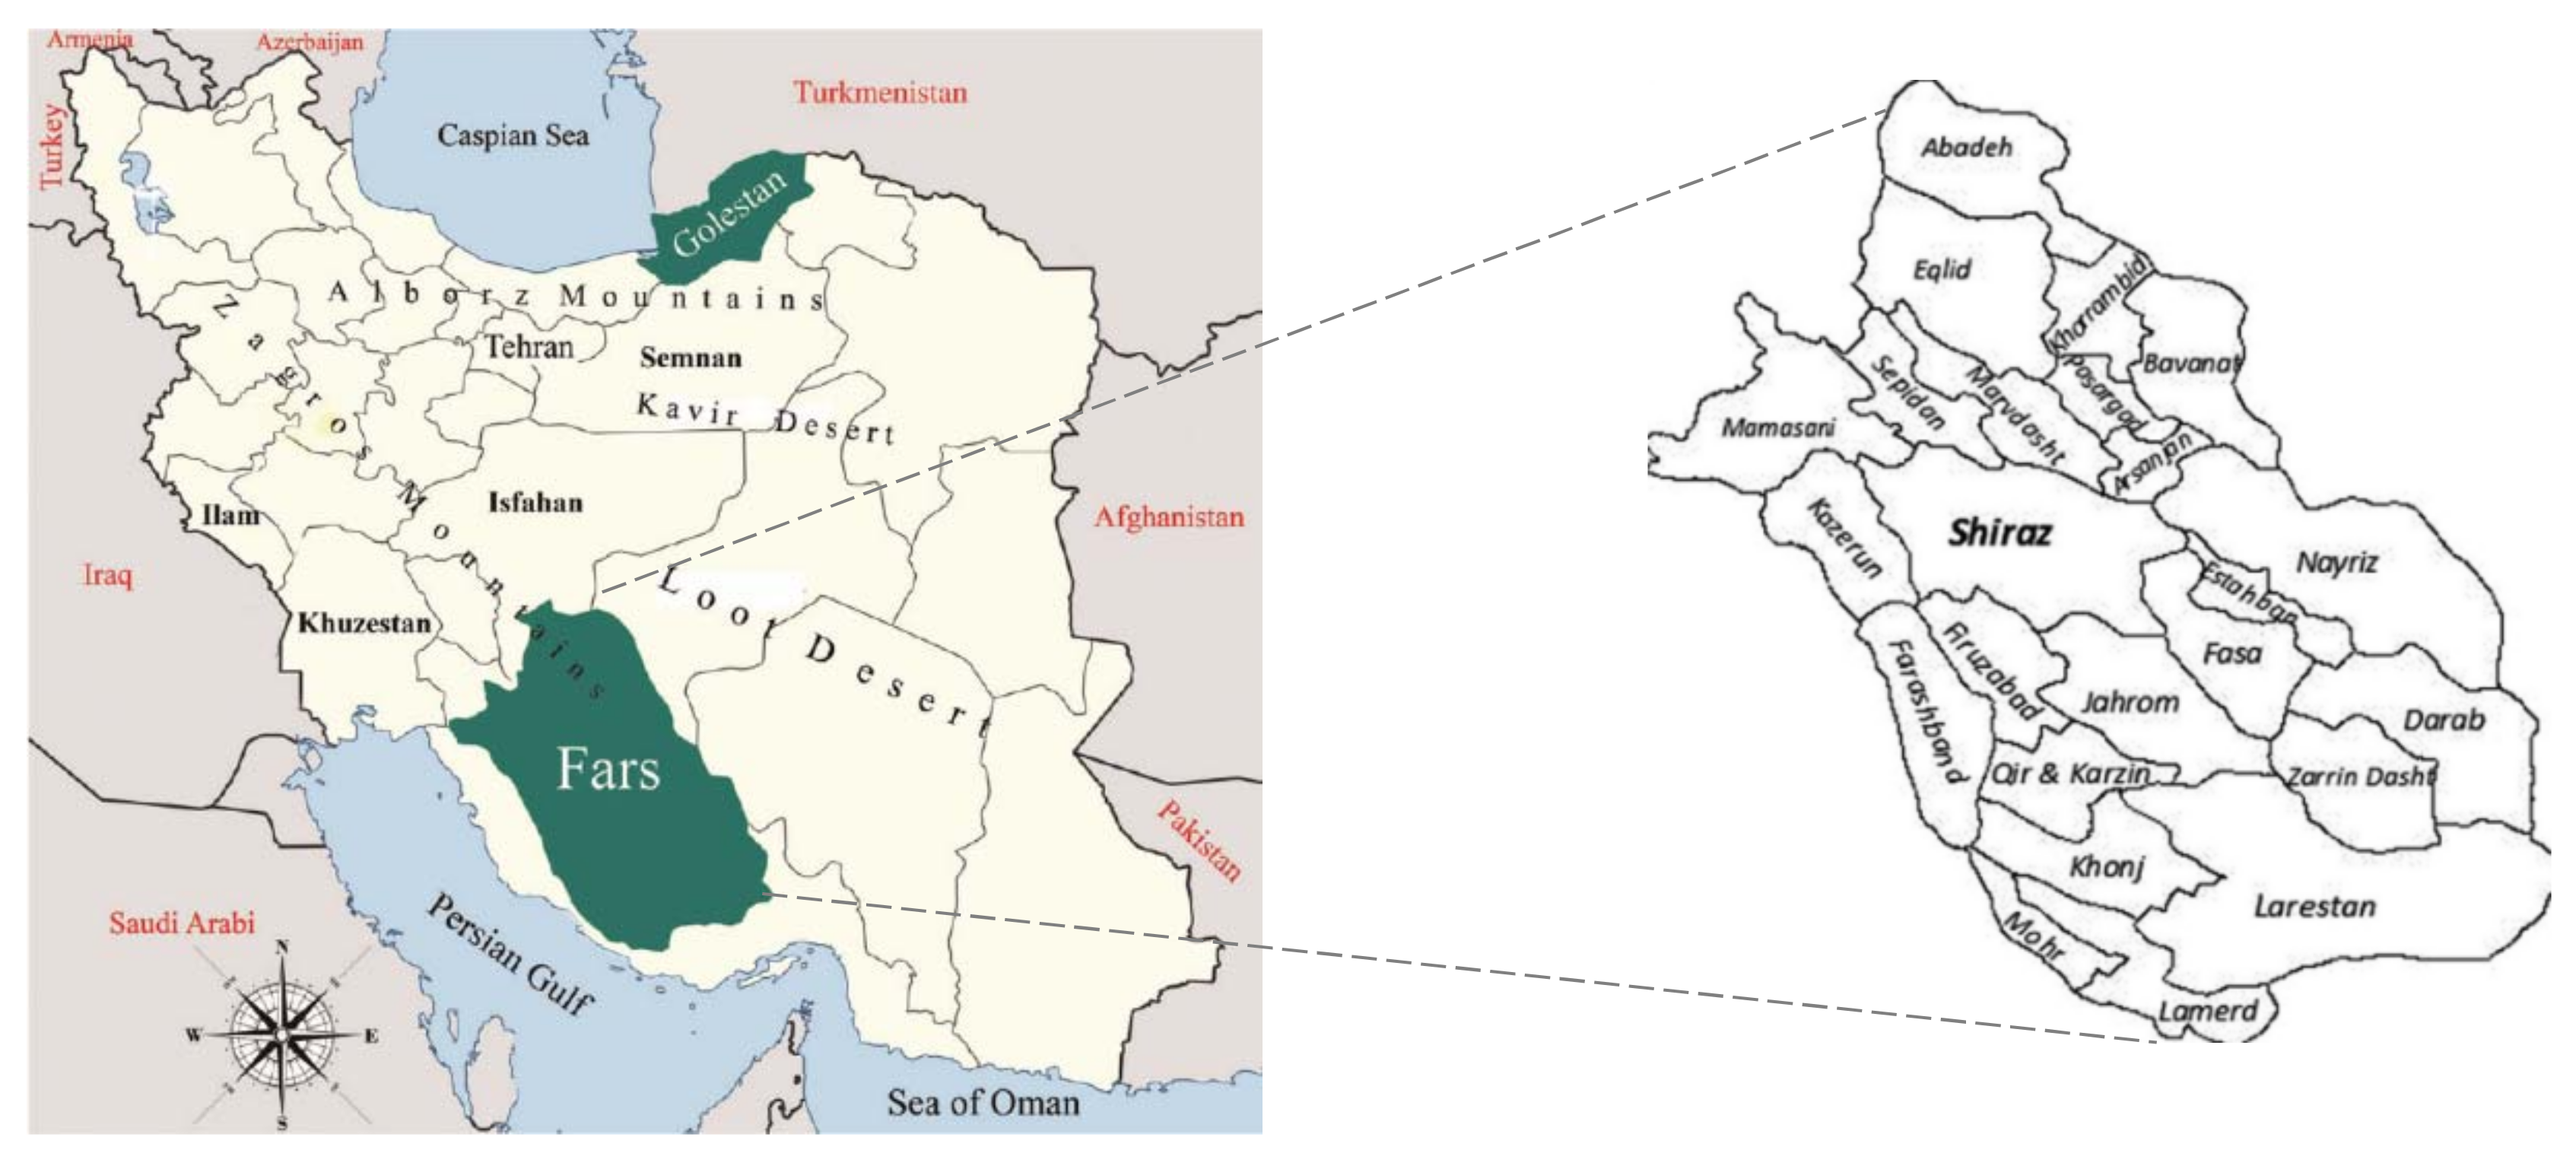
2. Materials and Methods

This study was conducted in Fars province, in southwest Iran (Figure 1). This province is distinguished as one of the country’s leading agricultural regions, ranked first in wheat production with over 300 thousand hectares. The climate in the Fars province has been getting warmer and drier. This province has experienced several severe droughts in recent decades, which led to groundwater degradation and crop reduction [34]. Average annual rainfall in Fars is approximately 294.7 mm (1971–2014), which is about 70% lower than the worldwide average (11). During the period 2009 to 2018, a large area of Fars province (85%) suffered from intense and very intense droughts [31]. Furthermore, according to the National Food and Nutrition Security System, Fars province is in a relatively food-insecure status, due to the low level of household resilience against it [35].
Rural households of Fars province were the target population. A multistage stratified random sampling technique was used, and sample size was determined based on the formula suggested by Schaeffer and others [36]. Initially, six counties with severe and total drought [31] were selected. In each selected county, a proportional number of sub-counties were randomly selected, and a proportional sample of villages was then randomly selected from each sub-county. In the final stage, a random sample of rural households was selected in each village, depending on the number of households in the village. In all, 6 counties and 25 villages were included in sample. The final sample consisted of 258 households in severe and total drought regions, out of 270 rural households under consideration. Household heads, who are the main decision-makers in the household, were considered as the respondents. Data was collected using a survey method consisting of a questionnaire. To examine the reliability of questionnaire, a pilot study was conducted on 30 rural households in a region outside of the study area, and Cronbach’s alpha coefficients for the items in Likert-type scales were computed at 0.87. The questionnaire was modified based on the pilot and respondents in the pre-test. A panel of experts confirmed the face validity of the questionnaire items. Data were analyzed using SPSS21 and AMOS23 software. Descriptive statistics, confirmatory factor analysis and an SEM (structural equation model) were used to analyze the data.

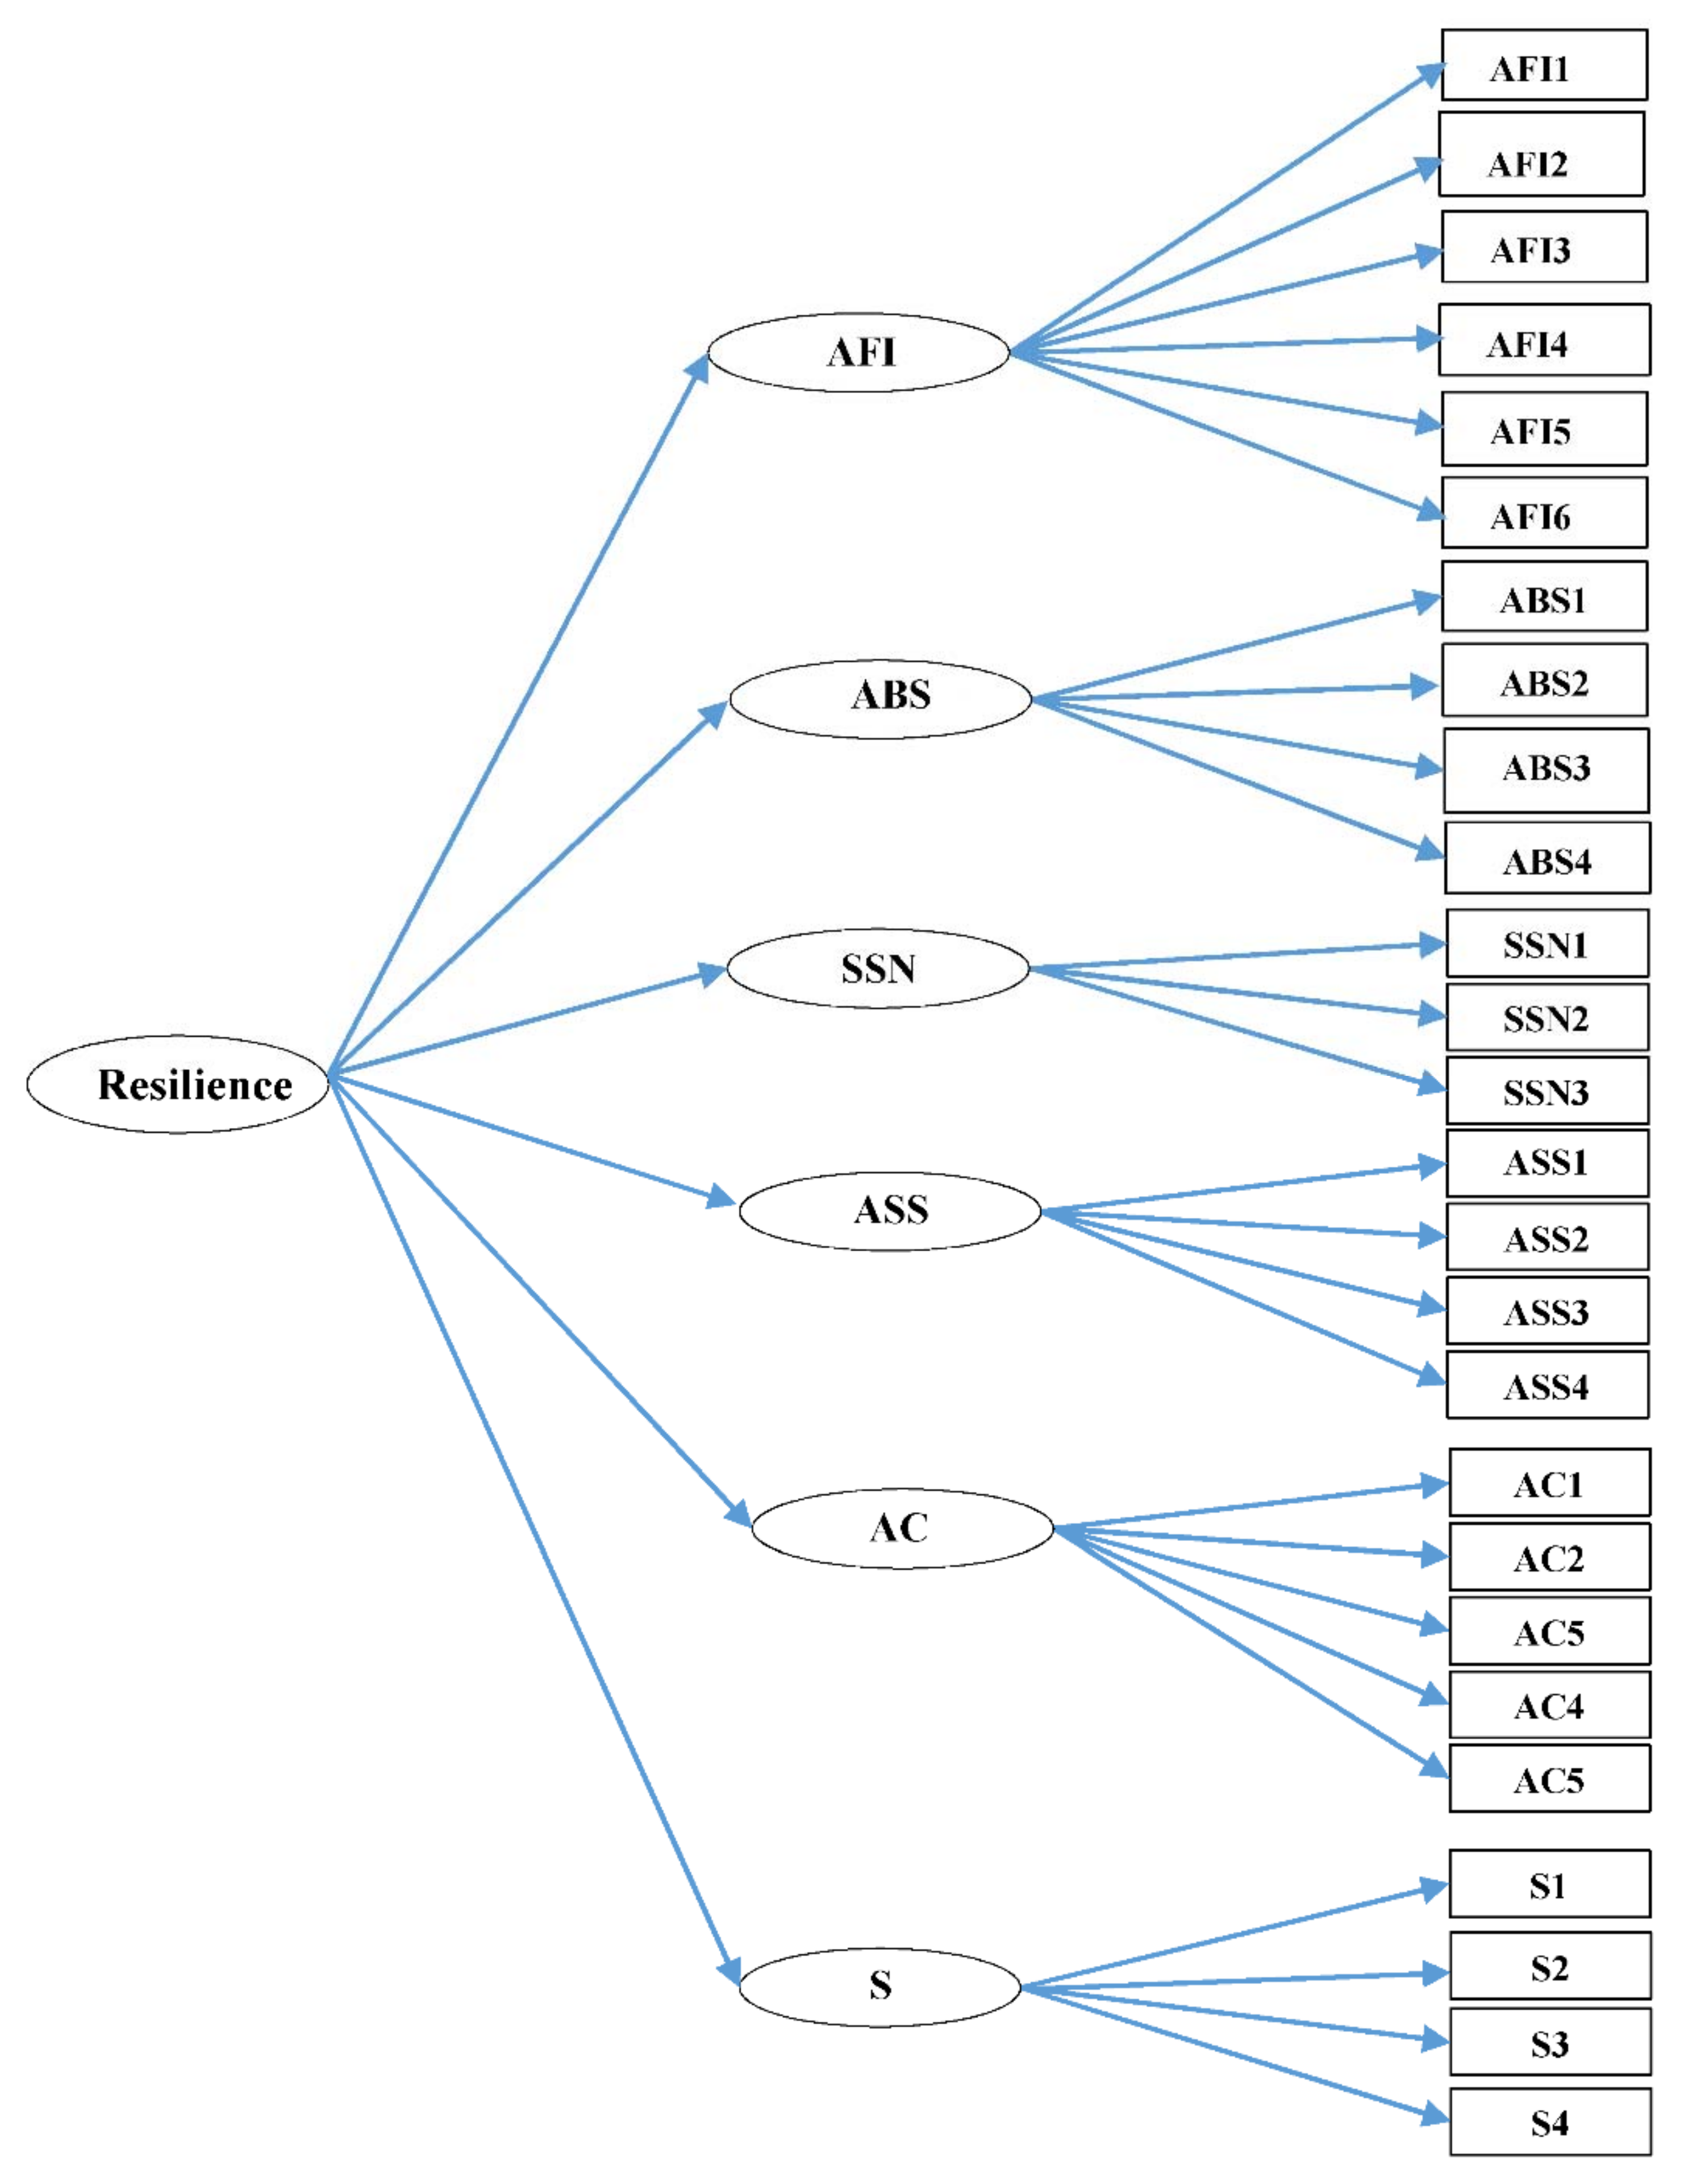
Resiliency Measurement

In order to measure the resiliency variable, the FAO Alleviation Index was used [12,37], which included six factors: income and food access, access to basic services, assets, social safety net, adaptive capacity, and stability. The equation for measuring this variable is as follows:
Ri = f (IFA, A, SSN, ABS AC, S)
where Ri is Resilience index, IFA is income and food access, A is assets, ABS is access to basic services, SSN is Social Safety Nets, AC is adaptive capacity and S is stability. Hence, the resilience index is the weighted sum of the factors generated, and specified as:
Ri = ∑WjFj
where Wj is the weight of variable j, and Fj is the factor under consideration of variable j. The weights are the proportions of variance explained for each factor.
Details of these indicators are given below (Table 1).
In this equation, “resilience” is estimated as a hidden variable based on 6 factors provided by the FAO. These six factors were measured through 51 questions that were selected through an extensive review of the literature and in-depth interviews with rural households living in the study area. Self-rating scale questions were designed that required the respondents to indicate the accuracy of each question based on a 5-point Likert- type scale (1 = very low, 5 = very high). Then, after localizing the questions and deleting some, with an item total correlation coefficient of 0.3 or less from the scale, 27 questions were finalized.

3. Results and Discussion

3.1. Descriptive Statistics

In order to give a profile of rural households, a brief description of the main variables measured in the study is presented in Table 2. The mean participant age was 53 years, while the highest frequency was reported between 42 and 58 years old (n = 130). The average years of education of the respondents were nearly 7 years and less than 15 percent were illiterate. Less than half of the heads of households (45%) were dependent on agricultural jobs, while 55% were engaged in other activities besides farming (i.e., livestock, horticulture, labor, etc.). While the average of rural household land ownership was 7.3 hectares, 23% of them had no farmland and the maximum land owned by respondents was 50 hectares.
A majority of rural households (92%) had access to both surface and underground water resources. However, recent droughts have limited the use of surface water resources. The mean score of rural households’ using agricultural extension services (mean = 12.6) was lower than average, which is a sign of low efficiency of agricultural extension systems for rural people. It was found that the mean score of using crop insurance by rural households was very low (X = 1.9, scale range = 1–5). In fact, most rural households had not used crop insurance as an effective strategy to cope with water scarcity. The results showed the mean score for household access to credit and loans was 2, which is lower than average. Lack of access to credit and loans can prevent farmers from getting access to resources that are required to improve their adaptation and resilience under crisis conditions.

3.2. Verifying the Resiliency Measuring Model

Second-order confirmatory factor analysis was used to verify the six index resilience model, which was comprised of seven latent variables including resilience and six factors (Figure 2). Model fit statistics for the examined model are presented in Table 3.
The goodness-of-fit index (GFI), as a measure of fitness between the hypothesized model and the observed covariance matrix, was higher than 0.9 (GFI = 0.91), showing acceptable model fitness. Also, the comparative fit index (CFI) was higher than 0.9 (CFI = 0.94) which suggested a good fit to the data. CFI analyzes the model fit by examining the discrepancy between the data and the hypothesized model. Also, the incremental fit index (IFI) was higher than 0.9 (IFI = 0.94). Moreover, the root mean square error of approximation (RMSEA), another fit index, showed a good fit (0.05). In fact, the smaller the RMSEA (e.g., <0.06), the better the fit. Additionally, the Chi-square value was significant (χ = 96.3, p < 0.001) (Table 3).
According to the resilience measurement model, it can be stated that the factors used to measure this structure are acceptable and are consistent with the data. The results of the measurement model in Table 4 reveal that all six factor indicators were statistically significant at 0.001. The results show that all indicators were accurate enough to measure the six factors. Their validity and reliability were also confirmed.
Based on structural equation modeling (SEM), the effects of each factor and their significance on the resilience variable were assessed.
The results show that stability, adaptive capacity, income and food access, assets, and access to basic services have positive and significant effects on rural household resilience to food insecurity. In addition, social safety nets negatively and significantly affected household resilience to food insecurity, even though it is assumed that a household with high access to social safety nets will have a remarkable level of resiliency (Table 5).
“Stability,” as the most important factor, and “access to basic services,” as the weakest, were reported to determine household resilience. In fact, due to the variability and instability of given shocks such as long-term drought, household stability through a series of interactions was a crucial factor to improve the resilience and survival of vulnerable people and keep them resilient during a long time. On the other hand, stability, including high education of household members, high employment rates (no unemployment during the crisis period), maintaining trust among household members, and willingness to continue farming, was the most important determinant of resilience. Meanwhile, because of the uneven and inappropriate distribution of basic services (i.e., access to appropriate medical centers, educational centers at different levels, road quality, and transportation systems), this factor had a poor determinative effect on the resilience model.

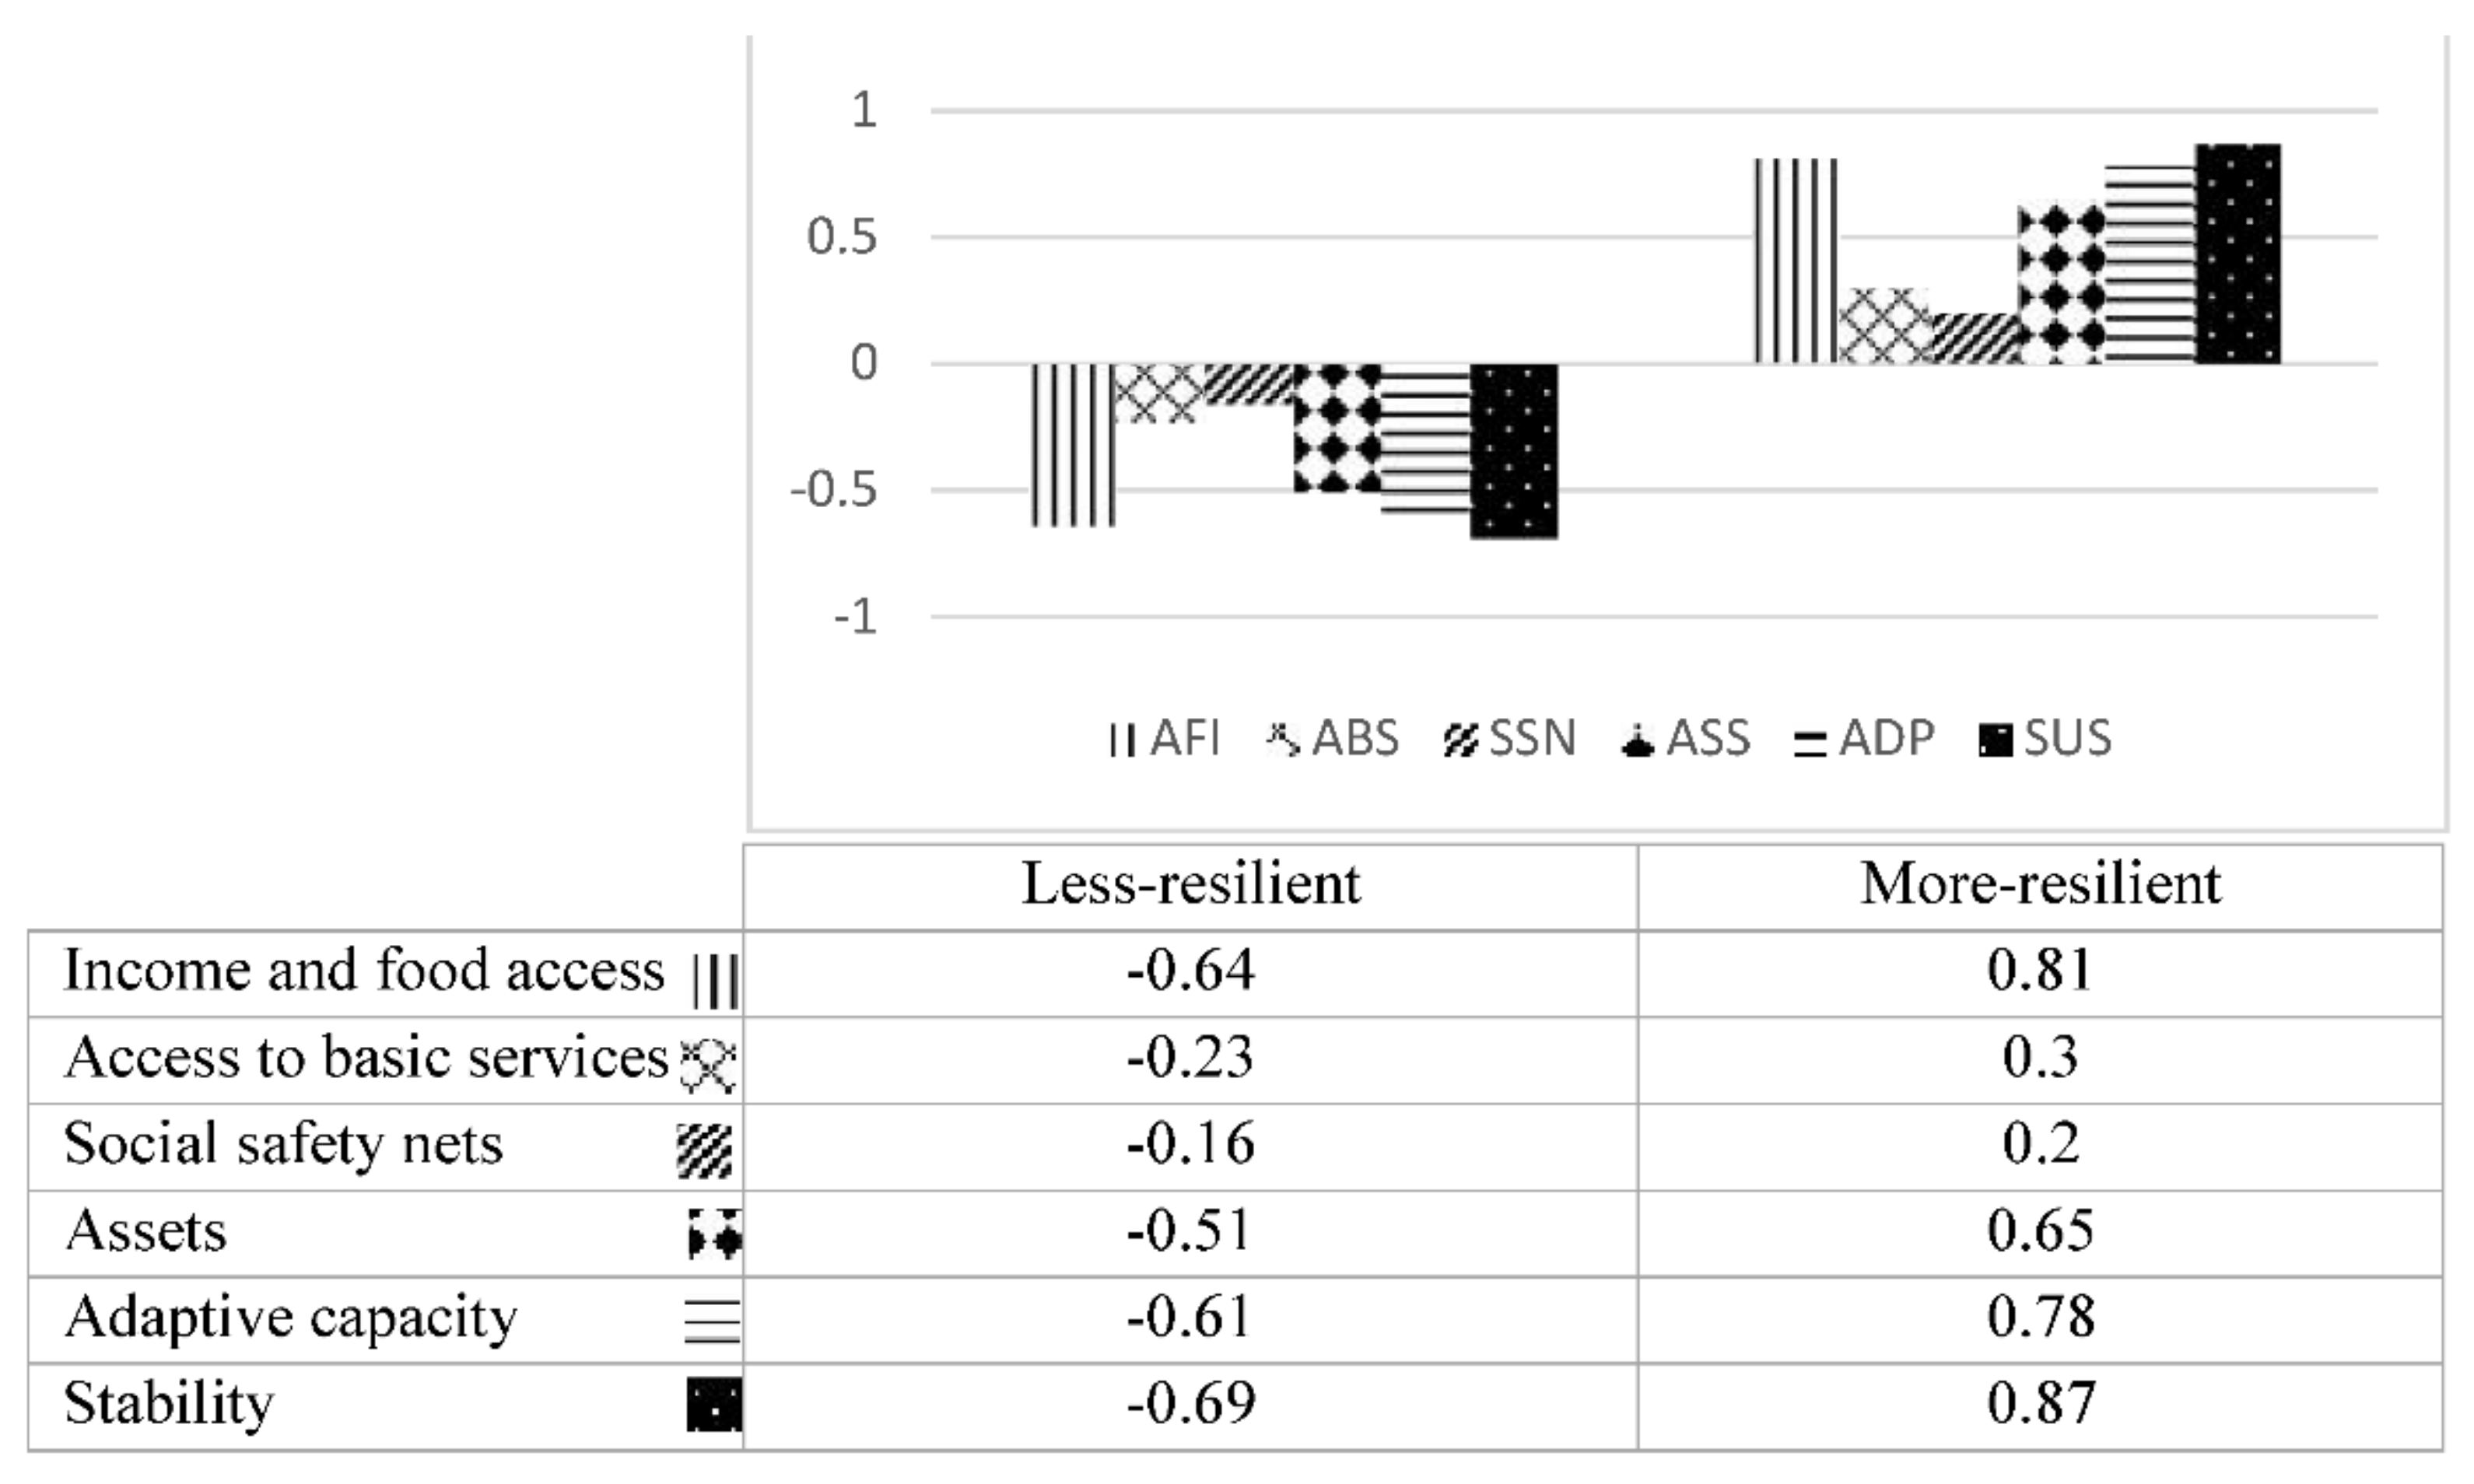
3.3. Resiliency Status of Rural Households

In order to determine the resiliency of rural households to food insecurity under drought, after calculating the resilience score by weighting summation of confirmed indices, it was converted to a standardized score (SS) in the 0–100 range to facilitate interpretation. The mean of the rural household resilience score in the study sample was 41 which, with attention to range of the scale for this variable (0–100) was lower than average. Then, rural households were grouped based on their resilience factors through two-step cluster analysis. As shown in the chart, cluster analysis provided two resilience groups in rural households. 55.9% of rural households were distinguished as the “less-resilient” group by having relatively low food and income access, access to basic services, social safety nets, assets, adaptive capacity and stability scores, as compared to the 44.1% of other households that were identified as the “more-resilient” group. (Figure 3).

3.4. Characteristics Comparison between Resilience Groups

The differential characteristics between two groups of rural households with respect to resilience is debatable. Table 6 shows the results of a comparison of mean analysis followed by independent samples (T test) to compare the two groups of rural households.
The results indicate there was a significant difference between rural households with regard to resilience score (t = 23.6, p = 0.000). While more resilient rural households had a resilience mean score of 87.3 (SD = 6.3, scale= 0–100), the less resilient rural households had a resilience score of 66.2 (SD= 7.9). According to the findings, there is a significant difference between household groups with regard to age (t = −3.6, p = 0.000). Indeed, in more resilient households, the head of the household was younger (x = 50.39, SD = 12.6) than the head of less resilient households (x = 55.67, SD = 11.5). This has to do with their greater physical strength, higher social relationships, and access to internet and new technologies. This finding verifies the results of a study by Unay-Gailhard and others [38]. In terms of education level, there was a significant difference between two groups (t = 6.2, p = 0.000). The heads of less resilient households had a lower level of formal education (X = 5.3, SD = 3.8) than the other group (X = 8.6, SD = 4.67). Tesso and others [39], also Frankenberg and others [40], have shown that heads of households with higher education level and better decision-making skills are able to change agricultural operation and methods, to adapt to recommendations, and ultimately to improve income.
In addition, the findings (Table 6) showed a significant mean difference between rural households with regard to diversified income sources (t = 7.1, p = 0.003). According to this finding, the more resilient rural households had more income sources (x = 3, SD = 1.1) while the less resilient rural households had a low mean score for diversified income sources (x = 2, SD = 0.9). Households where agriculture was the primary source in their direct and indirect employment and income had poor resiliency. Schirmer and Hanigan [41] verified this finding. It is important to point out in critical situations that were caused by drought, none of the farming-based sources of income, nor indeed farming itself, can increase the adaptive capacity of households. On the other hand, there was a significant difference between more- and less-resilient rural households with regard to household employment rate (t = 2.9, p = 0.000), such that the rural households with higher employment rates were more resilient (x = 0.2, SD = 2.4) than the other group (X = 0.1, SD = 0.16).
According to Table 6, there is a significant mean difference between two groups of rural households with regard to land ownership (t = 3, p = 0.01). That is, more resilient rural households have more farmland (x = 9.59, SD = 11.8), because they had utilized their land using conservational methods and diversified cropping. This finding is congruent with the results of Alinovi and others [13], Ciani [27] and Maleksaeedi and Karami [42]. In terms of access to water used in agriculture, there was a significant difference between two household groups (t = 7, p = 0.03). According to this finding, less resilient households had less access to agricultural water (x = 1.9, SD = 2.1) as compared to more resilient rural households (x = 3.2, SD = 0.87). Regarding to the relationship between access to water resources and crop diversity, it could be concluded that water has been the limiting factor in increasing the production and income of the farmers. Schirmer and Hanigan [41] and Boudreau [43] verified these findings.
As the findings in Table 6 show, there was a significant mean difference between rural households with regard to use of agricultural extension services (t = 5.9, p = 0.000). According to this finding, more resilient rural households had received more extension services (x = 14, SD = 4.4). They showed more willingness and interest in acquiring information and skills to manage risks associated with disasters such as drought. This finding refers to the critical role of extension services in developing the resilience of the agricultural sector. Folke and others [44] came up with the same conclusion in regard to the vital role of extension services in improving resiliency.
The difference between more and less resilient rural households regarding to ownership of livestock and permanent assets (i.e., housing, store, warehouse, automobile, tractor and agricultural machinery, etc.) was statistically significant. In fact, more resilient rural households had more ownership in livestock (x = 22.2, SD = 72) and more permanent assets (x = 7.4, SD = 18). This finding confirms the results of studies by Schirmer and Hanigan [41].
As the results of the t-test in Table 6 indicate, there was a significant difference between the two household groups with regard to using adaptation strategies (t = 6.6, p = 0.000). Generally, less resilient rural households had a lower mean score in using adaptive strategies (x = 76.7, SD = 8.7) than more resilient rural households. These strategies include use of modern irrigation systems, conservational agriculture, crop insurance, etc. Chambers [45] indicated that utilization of adaptation strategies, as long-term and continuous processes, need efficient resources. So small and low-income farmers had difficulty in utilizing adaptation strategies.
Also, according to Table 6, there was no significant difference between the two groups of rural households with regard to number of household members and access to loans and credit. The reason for the lack of access to credit between two groups can be considered as the lack of government support, unfair access to credit, and the number of banking facilities in the study area. In this way, for small farmers with poor financial and credit support, access to government support would be difficult and out of reach.

4. Conclusions

The purpose of this study was to examine the determinants of rural household resiliency toward food insecurity based on six indicators (income and food access, access to basic services, assets, social safety net, adaptive capacity, and stability), derived from the FAO resilience index by Alinovi [13].
The results showed that the model presented in this research had a high predictability of resilience among rural families. This model provides a standard framework for assessing the ability of rural households to cope with and recover from shocks related to drought. The findings also indicated that the most important factor in determining household resiliency was stability. In fact, due to changing nature of drought in long term, the stability of households is an important factor to improving their resiliency.
A classification of households revealed two groups: high- and low-resilience rural households. The findings show that these two groups of rural households had different characteristics. According to findings, high resilient rural households had better educational levels, income diversity, employment status, land ownership, crop variety, water access, livestock and asset ownership, access to extensions, and use of adaptation strategies.
One strategy that can strengthen the ability of rural households to be more resilient is to offer them more financial assistance such as low interest rates or credit. This will give them more opportunities to be involved in non-farm activities.
In general, although the topic of resiliency with respect to food insecurity is a new issue, the present study tried to address this limitation and the results of this study would provide an appropriate framework for other researchers to follow up this issue in the future.
Due to the gradual nature of the drought, there are also potential limitations in the generalization of findings from this study to other contexts in the future. The results of this research may be of relevance to other less developed rural areas where most of the income comes from agriculture.
Further studies are also needed to recognize the concept of resilience to food insecurity under drought condition across geographical, economic, and sociocultural contexts.

Author Contributions

Conceptualization, N.N. and F.L.; methodology, N.N. and F.L.; software, N.N.; validation, S.J.F.H., S.M.M. and K.R.-M.; formal analysis, N.N. and F.L.; investigation, N.N.; resources, K.R.-M.; data curation, F.L.; writing—original draft preparation, N.N. and F.L; writing—review and editing, S.J.F.H. and S.M.M. and K.R.-M.; visualization, N.N. and F.L.; supervision, S.J.F.H. and S.M.M. and K.R.-M.; project administration, N.N. and F.L.; funding acquisition, N.N. All authors have read and agreed to the published version of the manuscript.

Funding

This research received no external funding.

Institutional Review Board Statement

Not applicable.

Informed Consent Statement

Informed consent was obtained from all subjects involved in the study.

Data Availability Statement

The datasets used and analyzed during the current study are available from the corresponding author on reasonable request.

Conflicts of Interest

The authors declare that they have no competing interests.

Abbreviations

FAO: Food and Agriculture Organization of the United Nations; IFAD, International Fund for Agricultural Development; WFP, World Food Program; RBA, Rome-based Agencies; SEM, Structural Equation Model; Ri, Resilience; IFA, Income and Food Access; a, Assets; ABS, Access to Basic Services; SSN, Social Safety Nets; AC, Adaptive Capacity; S, Stability.

References

  1. Bazza, M.; Kay, M.; Knutson, C. Drought Characteristics and Management in North Africa and the Near East; Working Paper; FAO: Rome, Italy, 2018; Available online: www.fao.org/3/CA0034EN/ca0034en.pdf (accessed on 1 July 2018).
  2. Liu, X.; Zhu, X.; Pan, Y.; Li, S.; Liu, Y.; Ma, Y. Agricultural drought monitoring: Progress, challenges, and prospects. J. Geogr. Sci. 2016, 26, 750–767. [Google Scholar] [CrossRef] [Green Version]
  3. Prokurat, E. Drought and water shortages in Asia as a threat and economic problem. J. Mod. Sci. 2016, 3, 235–250. [Google Scholar]
  4. Steffen, W.; Hughes, L.; Dean, A.; Rice, M. Climate Change and Drought; Climate Council of Australia Limited: Surry Hills, Australia, 2018; Available online: https://www.climatecouncil.org.au/wp-content/uploads/2018/06/CC_MVSA0146-Fact-Sheet-Drought_V2-FA_High-Res_Single-Pages.pdf (accessed on 7 June 2018).
  5. Food and Agriculture Organization of United Nations. Drought and Agriculture; FAO: Rome, Italy, 2019; Available online: http://www.fao.org/land-water/water/drought/droughtandag/en/ (accessed on 1 May 2020).
  6. Godfray, H.C.J.; Beddington, J.R.; Crute, I.R.; Haddad, L.; Lawrence, D.; Muir, J.F.; Pretty, J.; Robinson, S.; Thomas, S.M.; Toulmin, C. Food security: The challenge of feeding 9 billion people. Science 2010, 327, 812–818. [Google Scholar] [CrossRef] [PubMed] [Green Version]
  7. Pretty, J.; Sutherland, W.J.; Ashby, J.; Auburn, J.; Baulcombe, D.; Bell, M.; Bentley, J.; Bickersteth, S.; Brown, K.; Burke, J.; et al. The top 100 questions of importance to the future of global agriculture. Int. J. Agric. Sustain. 2010, 8, 219–236. [Google Scholar] [CrossRef]
  8. Rockström, J.; Steffen, W.; Noone, K.; Persson, Å.; Chapin, F.S.; Lambin, E.F.; Lenton, T.M.; Scheffer, M.; Folke, C.; Schellnhuber, H.J.; et al. A safe operating space for humanity. Nature 2009, 461, 472–475. [Google Scholar] [CrossRef] [PubMed]
  9. Food and Agriculture Organization of United Nations. Nigeria General Information; FAO: Rome, Italy, 2011. [Google Scholar]
  10. Food and Agriculture Organization of United Nations. Building Climate Resilience for Food Security and Nutrition; FAO: Rome, Italy, 2018; Available online: www.fao.org/state-of-food-security-nutrition/en/ (accessed on 11 September 2018).
  11. Food and Agriculture Organization of United Nations. Climate Change, Agriculture and Food Security; FAO: Rome, Italy, 2016; Available online: www.fao.org/3/a-i6030e.pdf (accessed on 1 July 2016).
  12. Alinovi, L.; Mane, E.; Romano, D. Towards the Measurement of Household Resilience to Food Insecurity: Applying a Model to Palestinian Household Data. 2008, pp. 52–137. Available online: ftp://ftp.fao.org/docrep/fao/011/i0430e/i0430e.pdf (accessed on 1 January 2008).
  13. Alinovi, L.; D’Errico, M.; Mane, E.; Romano, D. Livelihoods strategies and household resilience to food insecurity: An empirical analysis to Kenya. In Proceedings of the Conference on Promoting Resilience through Social Protection in Sub-Saharan Africa, Dakar, Senegal, 27–30 June 2010; Organized by the European Report of Development. FAO: Rome, Italy, 2010; pp. 28–30. [Google Scholar]
  14. Pasteur, K. From Vulnerability to Resilience: A Framework for Analysis and Action to Build Community Resilience; Practical Action Publishing: Rugby, UK, 2011. [Google Scholar]
  15. FAO; IFAD; WFP. Strengthening Resilience for Food Security and Nutrition: A Conceptual Framework for Collaboration and Partnership among the Rome-Based Agencies; Food and Agriculture Organization of the United Nations (FAO); The International Fund for Agricultural Development (IFAD); The World Food Program (WFP): Rome, Italy, 2015. [Google Scholar]
  16. Maleksaeedi, H.; Karami, E. Social-ecological resilience and sustainable agriculture under water scarcity. Agroecol. Sustain. Food Syst. 2013, 37, 1–29. [Google Scholar] [CrossRef]
  17. Maxwell, D.G. Measuring food insecurity: The frequency and severity of “coping strategies”. Food Policy 1996, 21, 291–303. [Google Scholar] [CrossRef] [Green Version]
  18. Adger, W.N. Institutional adaption to environmental risk under the transition in Vietnam. Ann. Assoc. Am. Geogr. 2000, 90, 738–758. [Google Scholar] [CrossRef]
  19. ADRC. In Particular Asian Disaster Reduction and Response Network. 2007. Available online: https://www.unisdr.org/files/10572_adrrndirectory.pdf (accessed on 24 September 2007).
  20. Bruneau, M.; Chang, S.; Eguchi, R.; Lee, G.; O’Rourke, T.; Reinhorn, A.; Shinozuka, M.; Tierney, K.; Wallace, W.; Winterfelt, D. A framework to quantitatively assess and enhance the seismic resilience of communities. Earthq. Spectra 2003, 19, 733–752. [Google Scholar] [CrossRef] [Green Version]
  21. Cutter, S.L.; Barnes, L.; Berry, M.; Burton, C.H.; Evans, E.; Tate, E.; Webb, J. A place-based model for understanding community resilience to natural disasters. Glob. Environ. Chang. 2008, 18, 598–606. [Google Scholar] [CrossRef]
  22. Folke, C. Resilience: The emergence of a perspective for social-ecological systems analyses. Glob. Environ. Chang. 2006, 16, 253–267. [Google Scholar] [CrossRef]
  23. Mayanga, J.S. Understanding and Applying the Concept of Community Disaster Resilience: A Capital-Based Approach. Ph.D. Thesis, Department of Landscape Architecture and Urban Planning, Hazard Reduction and Recovery Center, A&M University, College Station, TX, USA, 2006. [Google Scholar]
  24. Norris, F.H.; Stevens, S.P.; Pfefferbaum, B.; Wyche, K.F.; Pfefferbaum, R.L. Community Resilience as a Metaphor, Theory, Set of Capacities, and Strategy for Disaster Readiness. Am. J. Community Psychol. 2008, 41, 127–150. [Google Scholar] [CrossRef] [PubMed]
  25. Pfefferbaum, B.J.; Reissman, D.B.; Pfefferbaum, R.L.; Klopm, R.W.; Gurwitch, R.H. Handbook of Injury and Violence Prevention (Chapter 19). Building Resilience to Mass Trauma Events; Springer: New York, NY, USA, 2007; pp. 347–358. [Google Scholar]
  26. Rose, A. Defining and measuring economic resilience to disasters. Disaster Prev. Manag. Int. J. 2004, 13, 307–314. [Google Scholar] [CrossRef]
  27. Ciani, F. A Resilience-Based Approach to Food Insecurity: The Impact of Mitch Hurricane on Rural Households in Nicaragua. Ph.D. Thesis, University of Florence, Gainesville, FL, USA, 2012. [Google Scholar]
  28. Boukary, A.G.; Diaw, A.; Wünscher, T. Factors Affecting rural households’ resilience to food insecurity in Niger. Sustainability 2016, 8, 181. [Google Scholar]
  29. Kebede, T.; Haji, J.; Legesse, B.; Mammo, G. Econometric Analysis of Rural Households’ Resilience to Food Insecurity in West Shoa. Ethiopia. Food Secur. 2016, 4, 58–67. [Google Scholar]
  30. Statistical Center of Iran. The Yearly Book of Iran’s Statistics; Markaze Amare Iran: Persian, Iran, 2020; Available online: http://Salnameh.sci.org.ir/AllUser/DirectoryTreeComplete.aspx (accessed on 1 June 2020).
  31. National Monitoring and Drought. Report of Provinces and Counties Drought; Meteorological Organization: Tehran, Iran, 2018.
  32. Smit, B.; Skinner, M.W. Adaptation options in agriculture to climate change: A typology. Mitig. Adapt. Strateg. Glob. Chang. 2002, 7, 85–114. [Google Scholar] [CrossRef]
  33. Keshavarz, M.; Karami, E.; Vanclay, F. The social experience of drought in rural Iran. Land Use Policy 2013, 30, 120–129. [Google Scholar] [CrossRef]
  34. Portal of Agricultural Organization of Fars Province. Status Report of Agricultural Sector. Iran. 2018. Available online: http://www.fars.agri-jahad.ir/portal/home/ (accessed on 20 October 2018).
  35. Kolahdooz, F.; Najafi, F. Report of a National Survey: Food Security Information and Mapping System in Iran; Ministry of Health, Treatment and Medical Education: Tehran, Iran, 2015. [Google Scholar]
  36. Schaeffer, R.L.; Mendenhall, W.; Ott, L. Elementary Survey Sampling; PWS-Kent Publishing Company: Boston, MA, USA, 1990. [Google Scholar]
  37. Food and Agriculture Organization of United Nations. Globalization of Food Systems in Developing Countries: Impact on Food Security and Nutrition; FAO: Rome, Italy, 2013; pp. 45–50. [Google Scholar]
  38. Unay-Gailhard, I.; Balmann, A.; Appel, F. Dimensions of SURE-Farm Farm Typology for Farm Resilience Assessments; Working Paper [727520]; Leibniz Institute of Agricultural Development in Transition Economies (IAMO): Madrid, Spain, 2018. [Google Scholar]
  39. Tesso, G.; Emana, B.; Ketema, M. Analysis of vulnerability and resilience to climate change induced shocks in North Shewa, Ethiopia. Agric. Sci. 2012, 3, 871–888. [Google Scholar] [CrossRef] [Green Version]
  40. Frankenberg, E.; Sikoki, B.; Sumantri, C.; Suriastini, W.; Thomas, D. Education, vulnerability, and resilience after a natural disaster. Ecol. Soc. 2013, 18, 16. [Google Scholar] [CrossRef] [PubMed] [Green Version]
  41. Schirmer, J.; Hanigan, I. Understanding the Resilience of NSW Farmers: Findings from the 2015 Regional Wellbeing Survey; Health Research Institute and Institute for Applied Ecology, University of Canberra: Bruce, Australia, 2015; Available online: http://www.canberra.edu.au/research/institutes/health-research-institute/regional-wellbeing-survey/survey-results/reports/2015-reports/Resilience-of-NSW-farmers_2015RWS.pdf (accessed on 1 July 2016).
  42. Maleksaeidi, H.; Karami, E.; Zamani, G.H. Farm households’ resilience scale under water scarcity. Mitig. Adapt. Strat. Glob. Chang. 2015, 20, 1305–1318. [Google Scholar] [CrossRef]
  43. Boudreau, T. Livelihoods at the Limit: Reducing the Risk of Disasters and Adapting to Climate Change. In Evidence from the Consolidated Household Economy Analysis Database; Working Paper; The Food Economy Group; Save the Children: London, UK, 2013; Available online: http://www.savethechildren.org.uk/sites/default/files/docs/Reducing_the_Risk_of_Disasters.pdf (accessed on 22 July 2013).
  44. Folke, C.; Colding, J.; Berkes, F. Synthesis: Building resilience and adaptive capacity in social–ecological systems. In Building Resilience for Complexity and Change; Berkes, F., Colding, J., Folke, C., Eds.; Cambridge University: New York, NY, USA, 2003; pp. 352–365. [Google Scholar]
  45. Chambers, R. Climate Vulnerability and Capacity Analysis; Institute of Development Studies University of Sussex: Brighton, UK, 2009. [Google Scholar]
Figure 1. Map of the study area.
Sustainability 13 08384 g001
Figure 2. Confirmatory factor analysis model for rural households’ resilience index to food insecurity (details of the six indicators AFI, ABS, SSN, ASS, AC, and S can be found in Table 1).
Sustainability 13 08384 g002
Figure 3. Comparison of the standard scores of six resilience indices.
Sustainability 13 08384 g003
Table 1. Study variables and selected indicators.
VariablesIndicators
Income and Food access (IFA)Amount of household income, limiting the amount of each meal, limiting the quality of each meal, reducing the number of meals per day, being without food in a whole day, and reduction in the amount of adult food in order to better children and employed members’ nutrition.
Access to basic services (ABS)Access to a well-equipped health center, access to school in all levels, easy access to mobility and transport constraints.
Social safety nets (SSN)Cash transfers from the Relief Committee, help and assistance of friends and relatives, participation and assistance from social groups.
Assets (ASS)Land ownership (hectares), permanent assets (car, house, warehouse, garden, tractor, and shop/workshop, garden), livestock ownership (numbers) and income.
Adaptive Capacity (ac)Diversified income, educational level of head of household, hope and effort to mitigate the consequences of crisis, belief in algebra and the availability of crises, self-confidence in abilities and compatibilities compared to others.
Stability (S)The number of unemployed household members, the health status of household members (in last year), the level of trust among household members, and willingness to continue agricultural activities in future.
Table 2. Summary statistics for the main variables of study.
VariablesMinimumMaximumMeanSD
Age (year)25885312.3
Education level (years of schooling)0186.84.6
The present of households with diversified job and income (in addition of farming) (%)010055.249.8
Land ownership (ha)0507.38.2
Agricultural water access (scale)152.61.2
Use of agricultural extension services(scale) 72512.64
Use of crop insurance (scale)151.90.96
Access to governmental credits and loans (scale)1520.86
Table 3. Model fit summary statistics of confirmatory factor analysis for the household resilience index.
Chi-Square Value/Degree of Freedom (x2/Df)Significant Level (p)Goodness of Fit Index (GFI)Comparative Fit Index (CFI)IFIRoot-Mean Square Error of Approximation (RMSEA)
1.660.0010.910.940.940.05
Table 4. Results of the measurement model for household resilience.
FactorIndicatorMeanSDBarESp-Valueα Cronbach (>0.6)Pc > 0.6AVE > 0.5
INFINF13.10.870.8 0.890.970.9
INF23.51.30.890.0960.001
INF33.21.20.870.090.001
INF44.21.10.740.0890.001
INF54.50.50.390.0430.001
INF83.71.20.790.0950.001
MSMS13.040.860.73 0.620.900.78
MS23.30.910.640.140.001
MS530.910.490.120.001
MS94.80.530.240.060.001
SSNSSN11.150.540.43 0.560.780.54
SSN71.240.530.530.230.001
SSN92.90.93−0.650.440.001
ASSASS12.530.70.560.060.0010.60.940.81
ASS51.70.790.60.0670.001
ASS61.61.130.270.0980.001
ASS72.40.90.47
ADPADP12.51.10.490.180.0010.730.920.68
ADP22.80.810.520.140.001
ADP52.851.030.49
ADP63.311.30.540.230.001
ADP83.10.890.820.190.001
ADP92.20.890.240.150.001
SUSSUS12.91.10.66 0.720.960.85
SUS33.91.10.750.10.001
SUS43.61.20.630.10.001
SUS83.50.770.480.070.001
Table 5. SEM estimation results.
RankingResilience FactorsStandardized Estimates (γ Coefficient)p-Value
6Basic services0.350.001 **
5Social safety nets−0.900.001 **
4Assets0.8950.001 **
3Access to income and food0.8990.001 **
2Adaptive capacity0.910.001 **
1stability0.970.001 **
p-value: ** p < 0.01.
Table 6. Results of mean comparison for two groups of rural households.
CharacteristicsClusters of Resilience to Food InsecurityTp
Less-ResilienceMore-Resilience
MeanSDMeanSD
Resilience87.36.366.27.923.60.000
Age (years)50.3912.655.6711.5−3.60.000
Education level8.64.675.33.86.20.000
Number of household members3.91.13.71.20.80.3
Income diversity31.120.97.10.003
Employed rate0.22.40.10.162.90.000
Land ownership9.5911.867.630.01
Crop variety2.751.21.950.960.000
Water access3.20.871.92.170.03
Livestock22.2727.4182.40.02
Assets ownership4.21.331.27.50.000
Access to extension 144.4113.25.90.000
Access to loan and credits2.10.81.80.930.3
Use of adaptation strategies84.19.876.78.76.60.000
Publisher’s Note: MDPI stays neutral with regard to jurisdictional claims in published maps and institutional affiliations.

