Article

Hydrogen Storage in Untreated/Ammonia-Treated and Transition Metal-Decorated (Pt, Pd, Ni, Rh, Ir and Ru) Activated Carbons

by
Mohamed F. Aly Aboud
1,2,*,
Zeid A. ALOthman
3 and
Abdulaziz A. Bagabas
4
1
Sustainable Energy Technologies Center, College of Engineering, King Saud University, P.O. Box 800, Riyadh 11421, Saudi Arabia
2
Mining, Metallurgical and Petroleum Engineering Department, Faculty of Engineering, Al-Azhar University, Nasr City, Cairo 11371, Egypt
3
Advanced Materials Research Chair Chemistry Department, College of Science, King Saud University, P.O. Box 2455, Riyadh 11451, Saudi Arabia
4
National Petrochemical Technology Center (NPTC), Materials Science Research Institute (MSRI), King Abdulaziz City for Science and Technology (KACST), P.O. Box 6086, Riyadh 11442, Saudi Arabia
*
Author to whom correspondence should be addressed.
Appl. Sci. 2021, 11(14), 6604; https://doi.org/10.3390/app11146604
Submission received: 24 May 2021 / Revised: 2 July 2021 / Accepted: 7 July 2021 / Published: 18 July 2021
(This article belongs to the Special Issue Recent Advances of Hydrogen Storage in Carbon-Based Materials)

Abstract

:
Hydrogen storage may be the bottle neck in hydrogen economy, where hydrogen spillover is in dispute as an effective mechanism. In this context, activated carbon (AC) was doped with nitrogen by using ammonia gas, and was further decorated with platinum, palladium, nickel, rhodium, iridium and ruthenium, via an ultrasound-assisted impregnation method, with average particle sizes of around 74, 60, 78, 61, 67 and 38 nm, respectively. The hydrogen storage was compared, before and after modification at both ambient and cryogenic temperatures, for exploring the spillover effect, induced by the decorating transition metals. Ammonia treatment improved hydrogen storage at both 298 K and 77 K, for the samples, where this enhancement was more remarkable at 298 K. Nevertheless, metal decoration reduced the hydrogen uptake of AC for all of the decorated samples other than palladium at cryogenic temperature, but improved it remarkably, especially for iridium and palladium, at room temperature. This observation suggested that metal decoration’s counter effect overcomes hydrogen spillover at cryogenic temperatures, while the opposite takes place at ambient temperature.

1. Introduction

Hydrogen possesses a gravimetric energy density of ~120 MJ kg−1, is abundant, and has an environmentally friendly nature, as it is derived from renewable resources, making it more economically convenient in comparison to many other fuels [1,2]. It can also replace conventional fuels in industrial and home applications, either to offer high temperatures upon burning and/or to catalyze hydro-cracking in petrochemical industry [3,4].
Using hydrogen as an energy source in automobiles releases no harmful emissions and greatly reduces carbon dioxide emissions [5]. The reported travel distance range for a fuel cell electric bus (FCEB) is between 100–225 miles for fueling events, depending on fulfilling of the set-point pressure of 350 bars of hydrogen storage tanks; these are still lower than the ultimate target of DOE of 300 miles [6]. Hydrogen has the drawback of a low density (0.08 g L−1) at STP, and thus a large volume for high-pressure tanks is required in the abovementioned application [7,8]. In addition, “some serious safety problems” are faced when it is stored under high pressure, in case of automobile accidents [9].
Liquefaction techniques can be used at ambient pressure to store hydrogen as a liquid at 21.2 K, but hydrogen boiling creates technical hitches in addition to the complexity and large charge of the cryogenic tanks [9,10,11]. An alternative storing method is to store hydrogen as hydrides, whose chemical bonds stabilize hydrogen thermodynamically, and hence a large amount of energy is needed for its release during desorption processes, creating serious technical issues regarding the heat exchange management and its complex coupling to the storage system [12]. As an example, a temperature of 561 K is needed to dissociate MgH2 to release hydrogen. Furthermore, its formation kinetics are very slow because of the difficult dissociation of hydrogen molecules over the surface of magnesium metal to form a MgH2 compound [13,14]. Moreover, stress can be accumulated within the storage reactors due to densification and pulverization of hydrides upon hydrogenation cycles [15]. Furthermore, safety and hazard has to be considered when dealing with some hydrides such as NaAlH4 [16], while cost has to be considered for the heat transfer management and safety requirements [14,17].
Physical adsorption, in porous materials, occurs when the pores generate weak interaction energy between the adsorbate gas molecules and their walls, offering several benefits to overcome shortcomings of the aforementioned methods [18].
Various porous adsorbents such as zeolites [19], metal-organic frameworks (MOFs) [20], and activated carbons (ACs) [21] are good candidates for physical adsorption due to their high surface area. ACs may be the most suitable porous materials due to their abundance, intoxication, stability, cheapness, low density and their high surface area [22,23,24,25,26,27]. In addition, they can be synthesized from waste materials and from natural products which would be beneficial for the environment [28,29].
During the last decades, several theoretical and experimental works were performed to evaluate H2 uptake in different carbon materials such as nanotubes, nanofibers, activated carbons, etc. for selecting the most adequate receptor for hydrogen storage applications. Starting with carbon nanotubes (CNTs), it was reported that hydrogen uptake was favored at the end sites of the CNTs and on their outer surface sites in comparison to the inner surface (endohedral) sites within the tubes [30,31]. The researchers were attracted toward the use of CNTs for hydrogen storage when Dillon et al. [32] reported a high storage percentage of hydrogen (~10 wt.%) on SWCNTs at room temperature. Later, Liu et al. [33] claimed a value of up to 5.0 wt.% with pretreated SWCNTs. For MWCNTs, the situation did not vary too much in comparison to the SWCNTs, where the highest value of 2.0, 3.7, 4.0, and 4.6 weight percentages were reported [34,35]. Many scientists tried to reproduce these claims, but unfortunately, they were not reproducible [36,37,38,39,40]. A pessimistic conclusion about the storage limit in CNTs was reported to be 1.0 wt.% or even lower, while any claims above this limit were a form of experimental error [41,42,43,44].
Although the activated microporous carbon was reported to meet the DOE’s target [45,46,47,48], and the hydrogen storage claim of 23.76 wt.% was reported by Zhan et al. [49], others disputed these claims [34,50,51].
The biggest excitement was caused by Chambers et al. [52], when he claimed a room-temperature hydrogen storage capacity of 67 wt.% on graphite nanofibers (GNF). Chamber’s results were not reproducible, but some others claimed some values up to 10 wt.% [53] and 6.5 wt.% [54]. Such discrepancies, which were found in these reports, could be attributed to the problems of assessing hydrogen uptake and non-standardization of the techniques used for the evaluation, besides the interpretation of the experimental data.
The main factors limiting the storage of hydrogen on the surface of carbonaceous materials are the low adsorption energy (~4–8 kJ mol−1) for the majority of the porous carbons and the weak interactions among hydrogen molecules, which decrease the possibility formation of more than one layer of hydrogen [55,56,57,58,59].
Decoration of the graphitic surface with metals may improve the hydrogen adsorption by creating strong interaction sites. Furthermore, these metal centers can facilitate the dissociation of the hydrogen molecules to atomic hydrogen, and, subsequently, making them diffuse onto the graphitic skeleton through the spillover mechanism [28,48,60,61,62,63,64,65,66]. However, the spillover effect was a dilemma for long time between theoretical and experimental studies due to hydrides formation [67,68,69,70], in addition to the inactivity of the metal surface due to clustering [71], hampering the spillover effect. Many carbonaceous systems were studied to explore the spillover effect in hydrogen storage and hydrogenation [72,73,74,75,76,77,78].
Modifying carbonaceous structures by hetero-atoms, such as boron or nitrogen, before metal decoration, was suggested to enhance their catalytic effect in comparison to the unmodified ones [71,79,80,81,82,83,84,85,86,87,88,89]. Previously, we tested platinum-decorated, ammonia-treated activated carbons for carbon dioxide and methane gas storage [90]. They showed high storage capacities for both of these, with slight improvement upon ammonia treatment and more preference towards carbon dioxide gas storage. The ammonia treatment was used as a doping source for nitrogen, and acted as an erosion agent for enhancing the surface area of the activated carbons in addition to its role in removing impurities and amorphous carbon before the platinum metal decoration step [88,90,91]. In this work, we further tested other transition metal-decorated (Pd, Ni, Rh, Ir and Ru) AC samples for hydrogen storage, at cryogenic and ambient temperatures, before and after modification. Furthermore, we aimed to investigate the hydrogen spillover phenomenon and its dependence on the identity of the metal at the studied two temperatures.

2. Experimental Section

Norit RX 1.5 Extra activated carbon, a product of CABOT, was used as carbonaceous support for transition metal decoration. The metal precursors were: hexachloroplatenic acid (H2PtCl6 H2O, 99%, WinLab, Pt 39.96% min.), palladium acetate [Pd(O2CCH3)2, 99%, Aldrich], nickel acetate tetrahydrate [Ni(O2CCH3)2 4H2O, 99% Merck], rhodium(III) 2,4-pentanedionate (C15H21O6Rh, 99.99%, Alfa Aesar, Rh 25.2% min.), iridium(III) 2,4-pentanedionate (C15H21IrO6, 99.99%, Alfa Aesar, Ir 37.5% min.), and ruthenium(III) 2,4-pentanedionate (C15H21O6Ru, 99.99%, Alfa Aesar, Ru 24% min.). The ultrasound-assisted impregnation method was adopted because of its simplicity and large-scale applicability [45,46,92,93,94], where the NH3-treated or untreated activated carbons were dispersed within the dissolved metal ions to form 5.0 wt.% decorated metal/AC. De-ionized water was used as the dissolving medium for Pt and Ni salts, while the precursors of Pd, Ru, Rh and Ir were dissolved by using ultra-high purity benzene as a solvent. The synthesis method, structure, morphology, textural, elemental analysis (CHNS), and experimental details were reported by Aboud et al. [90]. Additionally, JEOL (JSX-3202M) with built–in energy-dispersive fluorescence X-ray spectrometer (EDS) and high-resolution ultra-thin window (UTW) detector, for C-peak detection, was used for elemental analysis. The Debye–Scherrer formula, L (2θ) = (K × λ)/(β × cosθ) [95], was used to estimate the crystallite size of the decorating metals, where: L is the crystallite size, λ is the X-ray wavelength (Cu Kα radiation = 0.15405 nm), K is constant and equals to 0.94, θ is the angle of diffraction, and β is the full width at half maximum (FWHM) at 2θ multiplied by π/180 after considering the broadening contributions from instrument and other factors, which was around 29%. If we did not consider such a broadening effect, the uncorrected crystallite size, calculated from uncorrected β, would be smaller by a factor of 3.4. We used at least 5 diffraction peaks for calculating the average crystallite sizes, and we compared this average with the average particle sizes, obtained from scanning electron microscope (SEM) images.
The hydrogen storage measurements were conducted via the volumetric technique (Sievert’s method) by using a high-pressure volumetric analyzer (HPVA-II, Micromeritics), which could reach up to 200 bars. The hydrogen uptake was assessed by measuring the sorption isotherms (pressure–composition-isotherms (PCIs) at 77 K and 298 K, and within a pressure range from ambient to 100 bars. A 3-litre, well-insulated Dewar flask was used for performing the measurements at 77 K, where one filling of the flask was sufficient during the experiment. The mass of the adsorbent specimen was not less than 2.0 g for reducing the experimental errors as much as possible. Before any sorption measurement, the adsorbent specimens were degassed for 12 h, at 200 °C, under vacuum, where the resulting mass loss was determined, and the degassed mass was considered to investigate the hydrogen uptake. The adsorbent specimen volume was corrected on the basis of skeletal density measurements, corresponding to the excess values obtained by helium gas. The specimen holder was dipped in liquid nitrogen at 77 K and was kept for at least 45 min before performing the measurements at cryogenic temperature. Ultra-high-purity hydrogen gas grade (6N) was used in all adsorption experiments. The PCI curves were measured several times to verify the hysteresis and the repeatability. All of the adsorbent specimens exhibited good repeatability. All of the uptakes were evaluated as excess gas adsorption quantities, which were the change in the amounts of the hydrogen gas existing in the equal volume of adsorbate, and the appearance and nonappearance of adsorbent, while considering the surface (Gibbs) excess as the difference between the density of the compressed gas and the bulk gas [96,97]. At high pressure, the excess adsorbed hydrogen was the most common for reporting hydrogen storage [98].

3. Results and Discussion

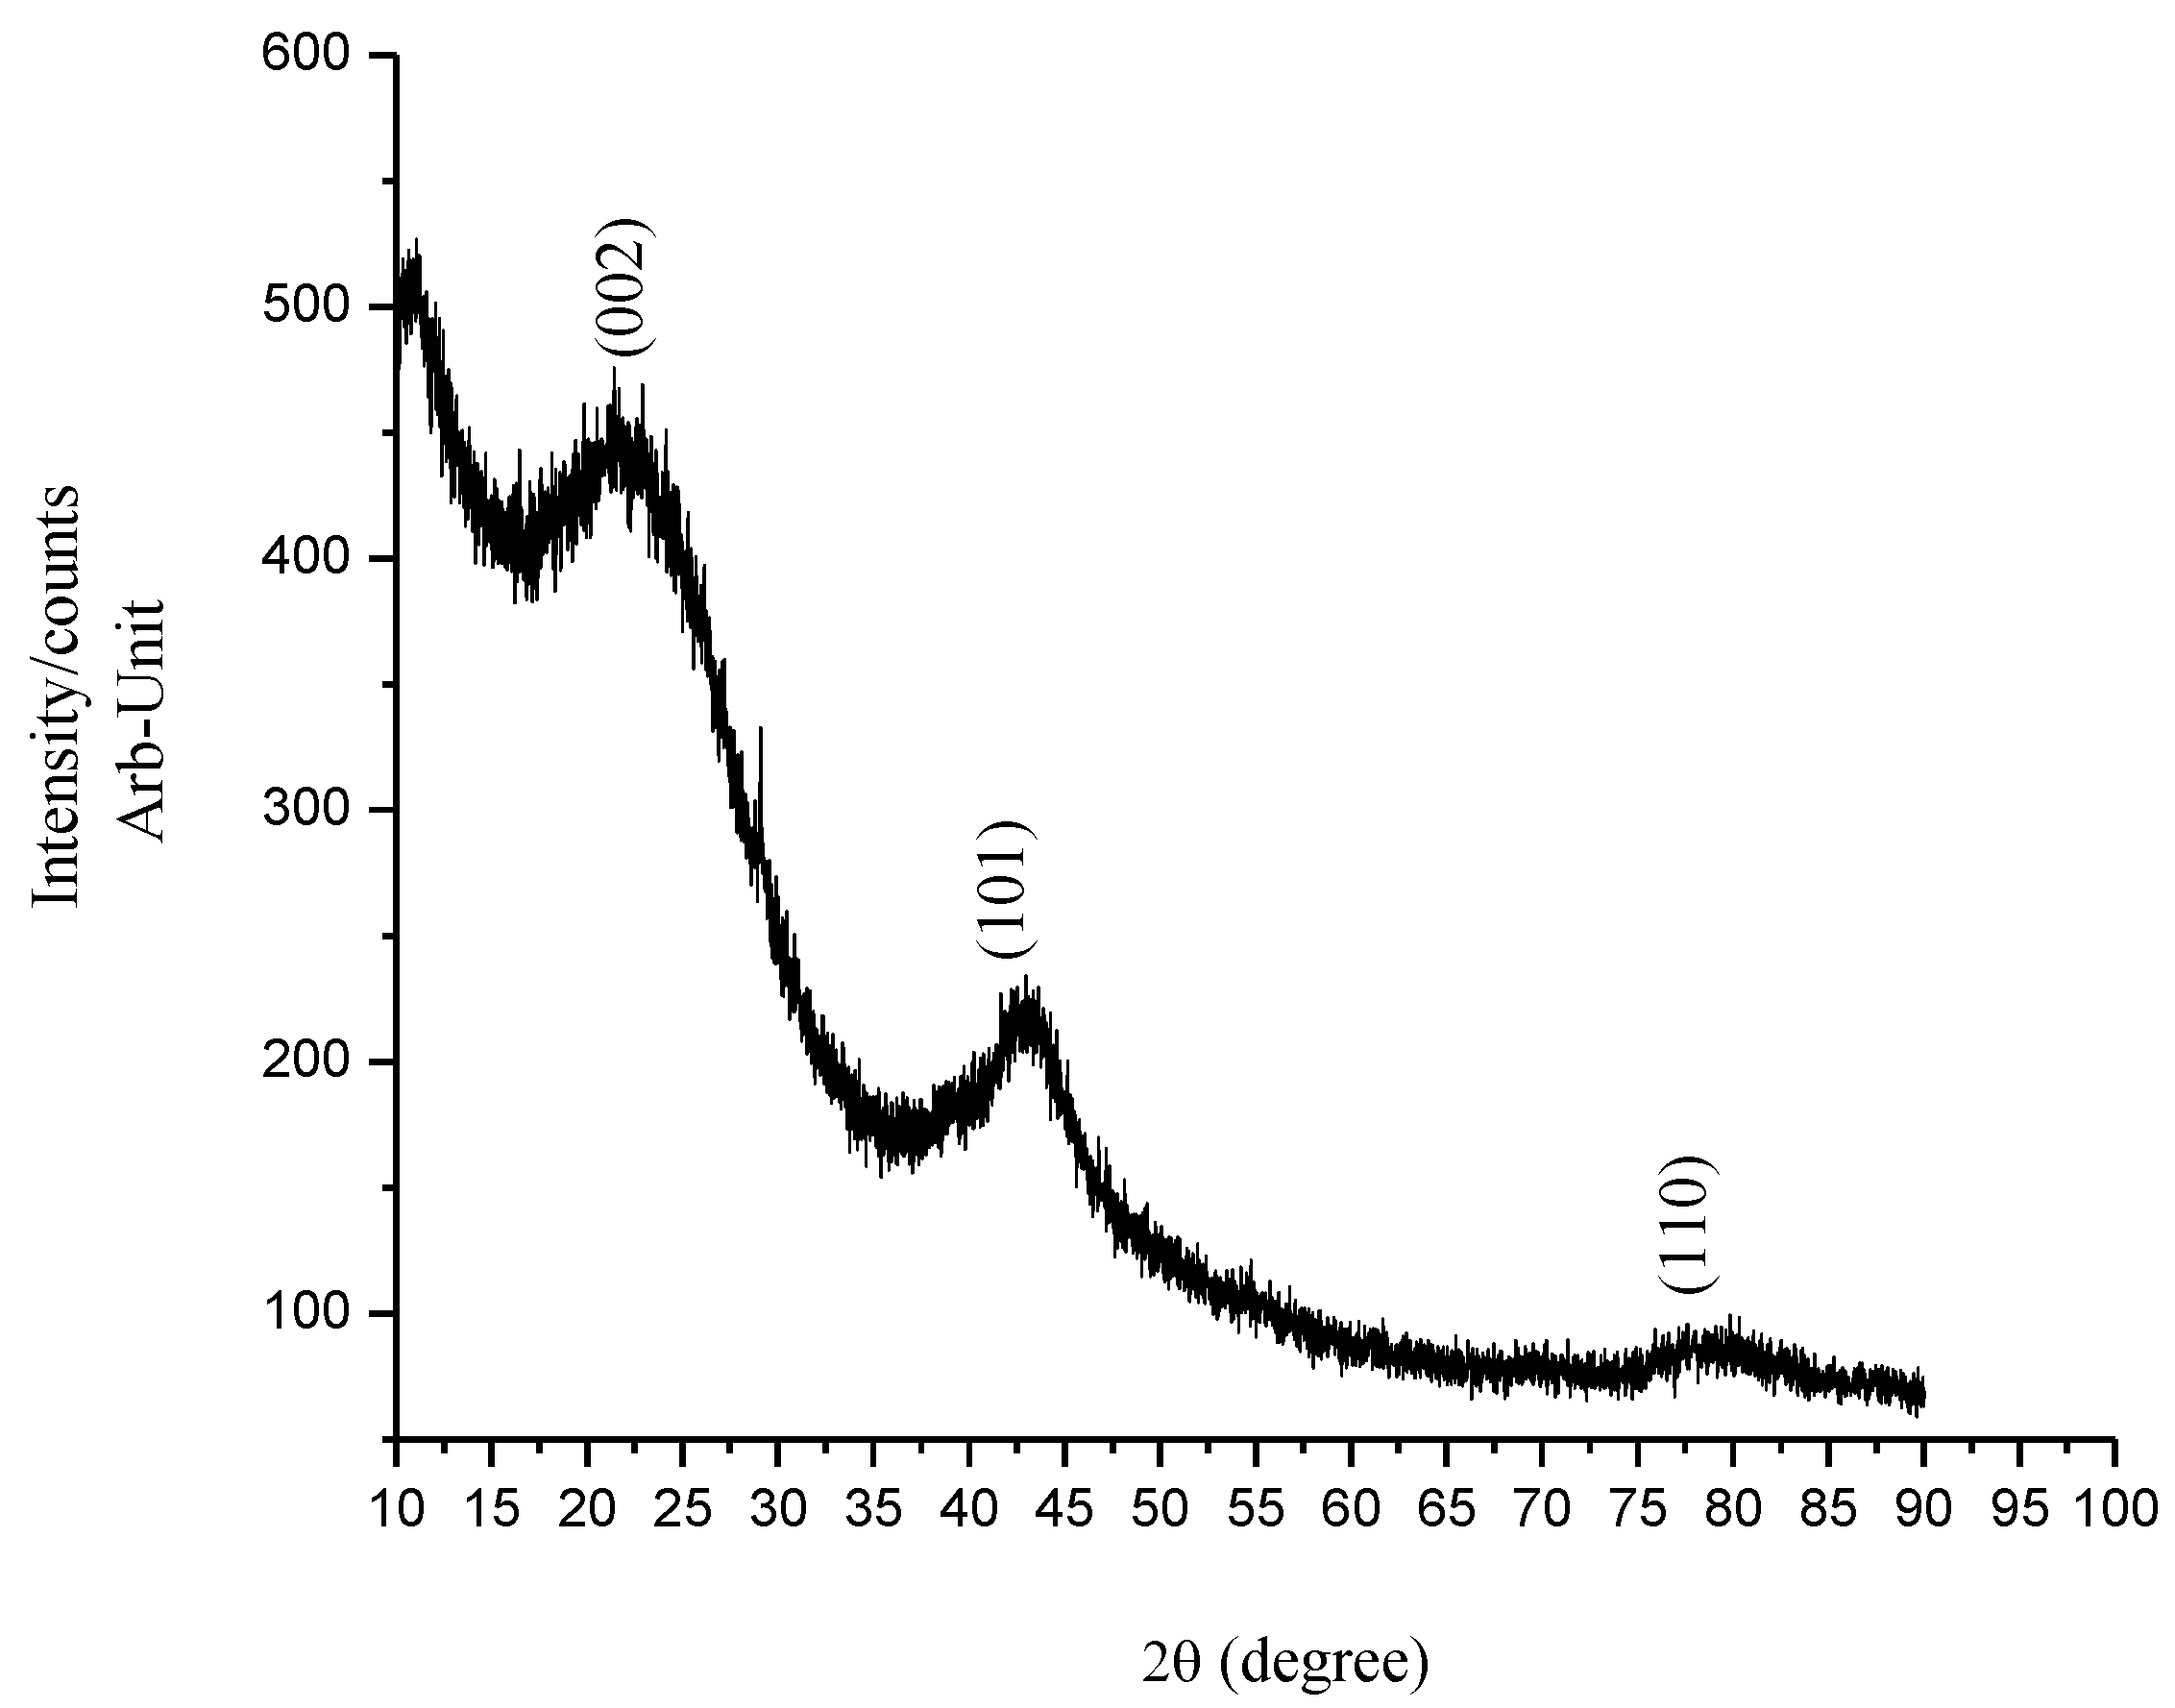
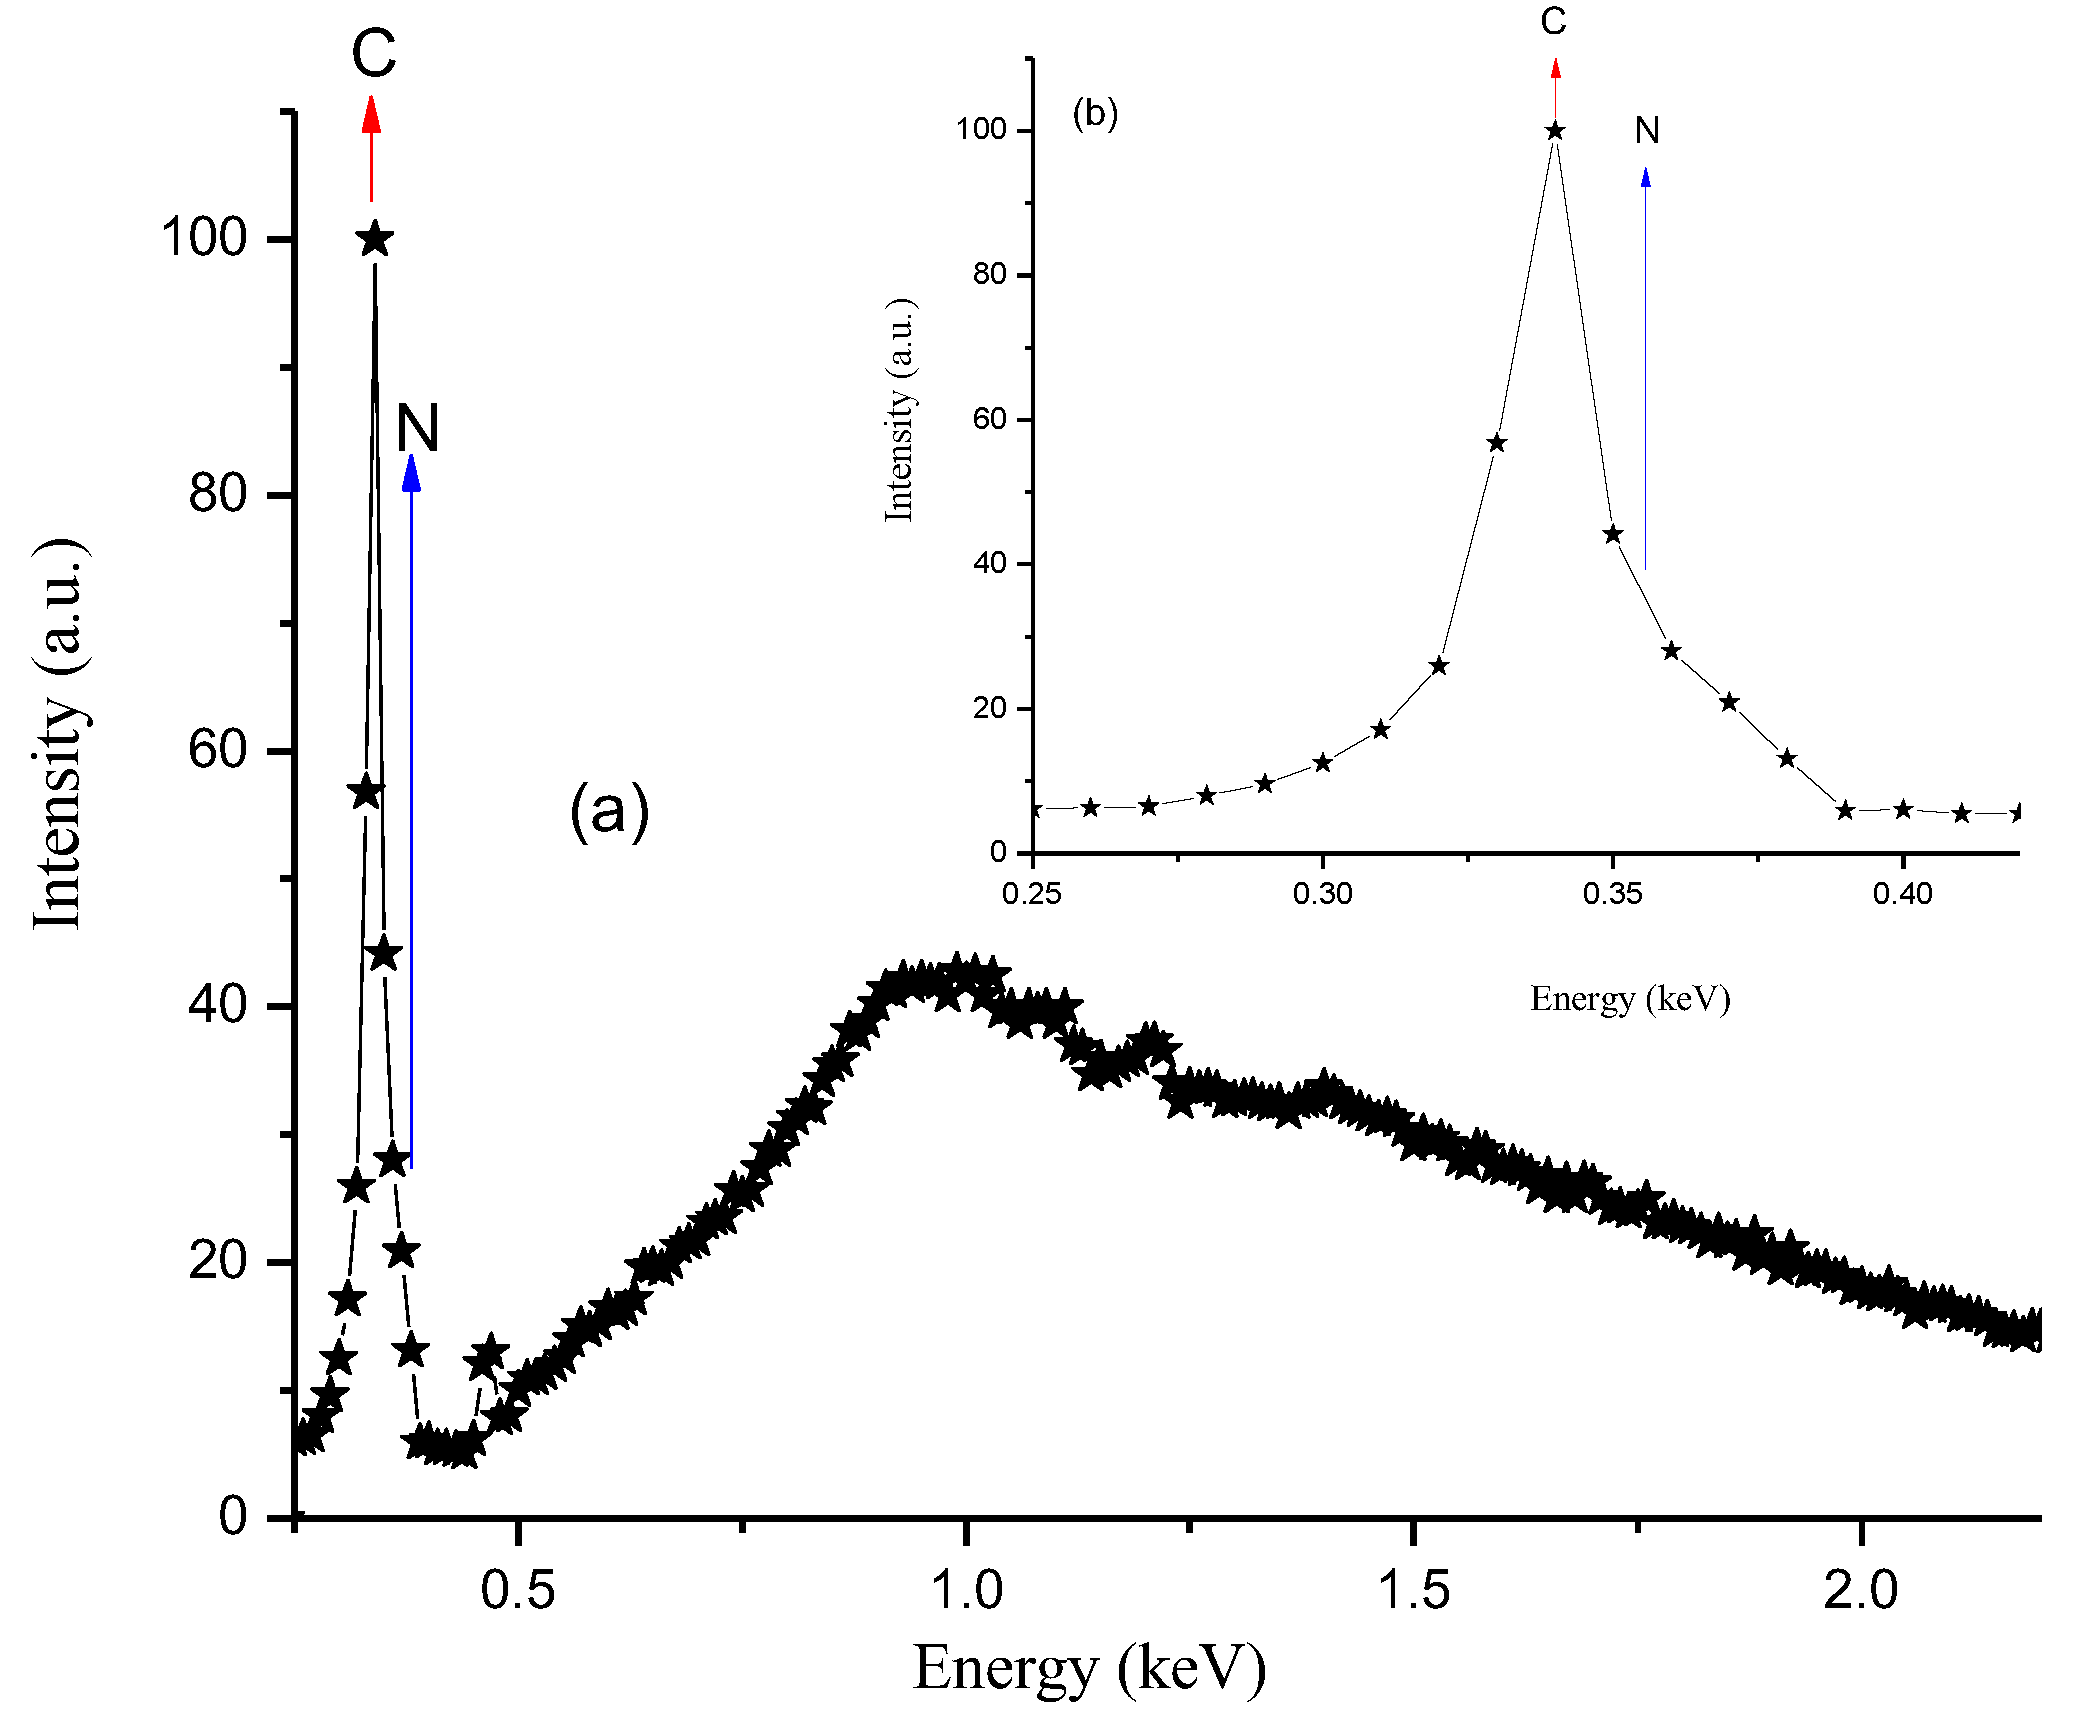
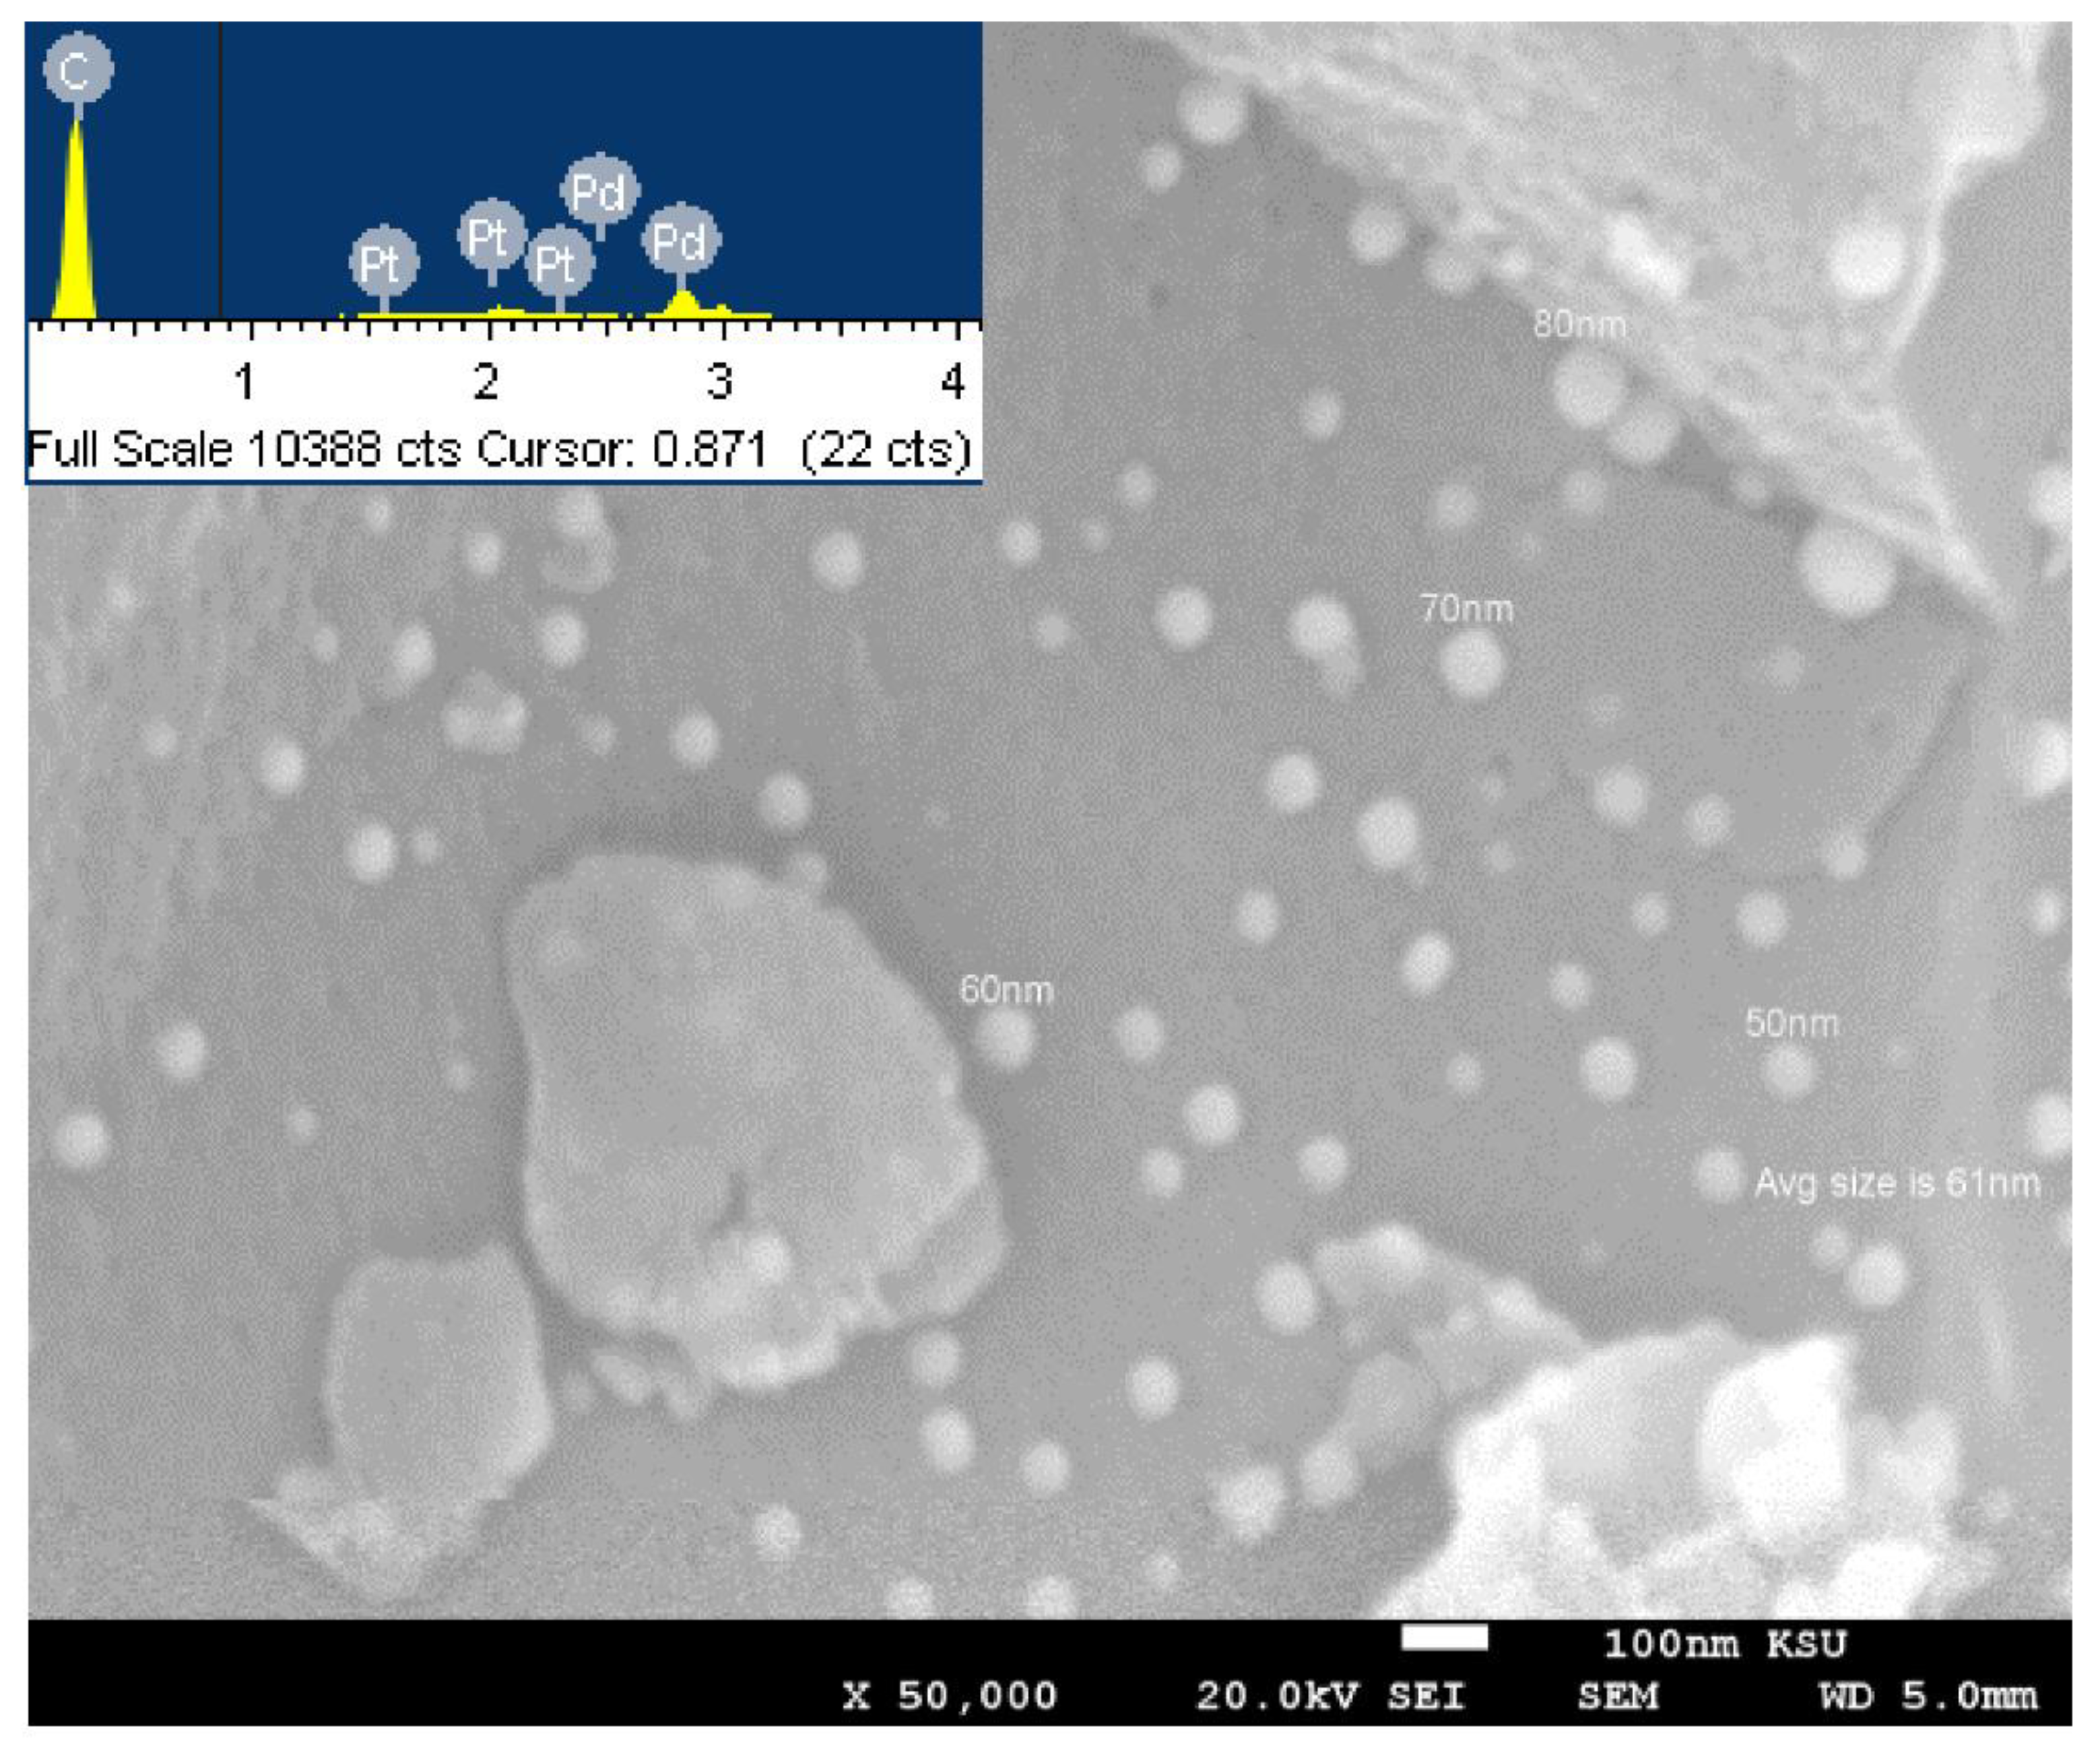
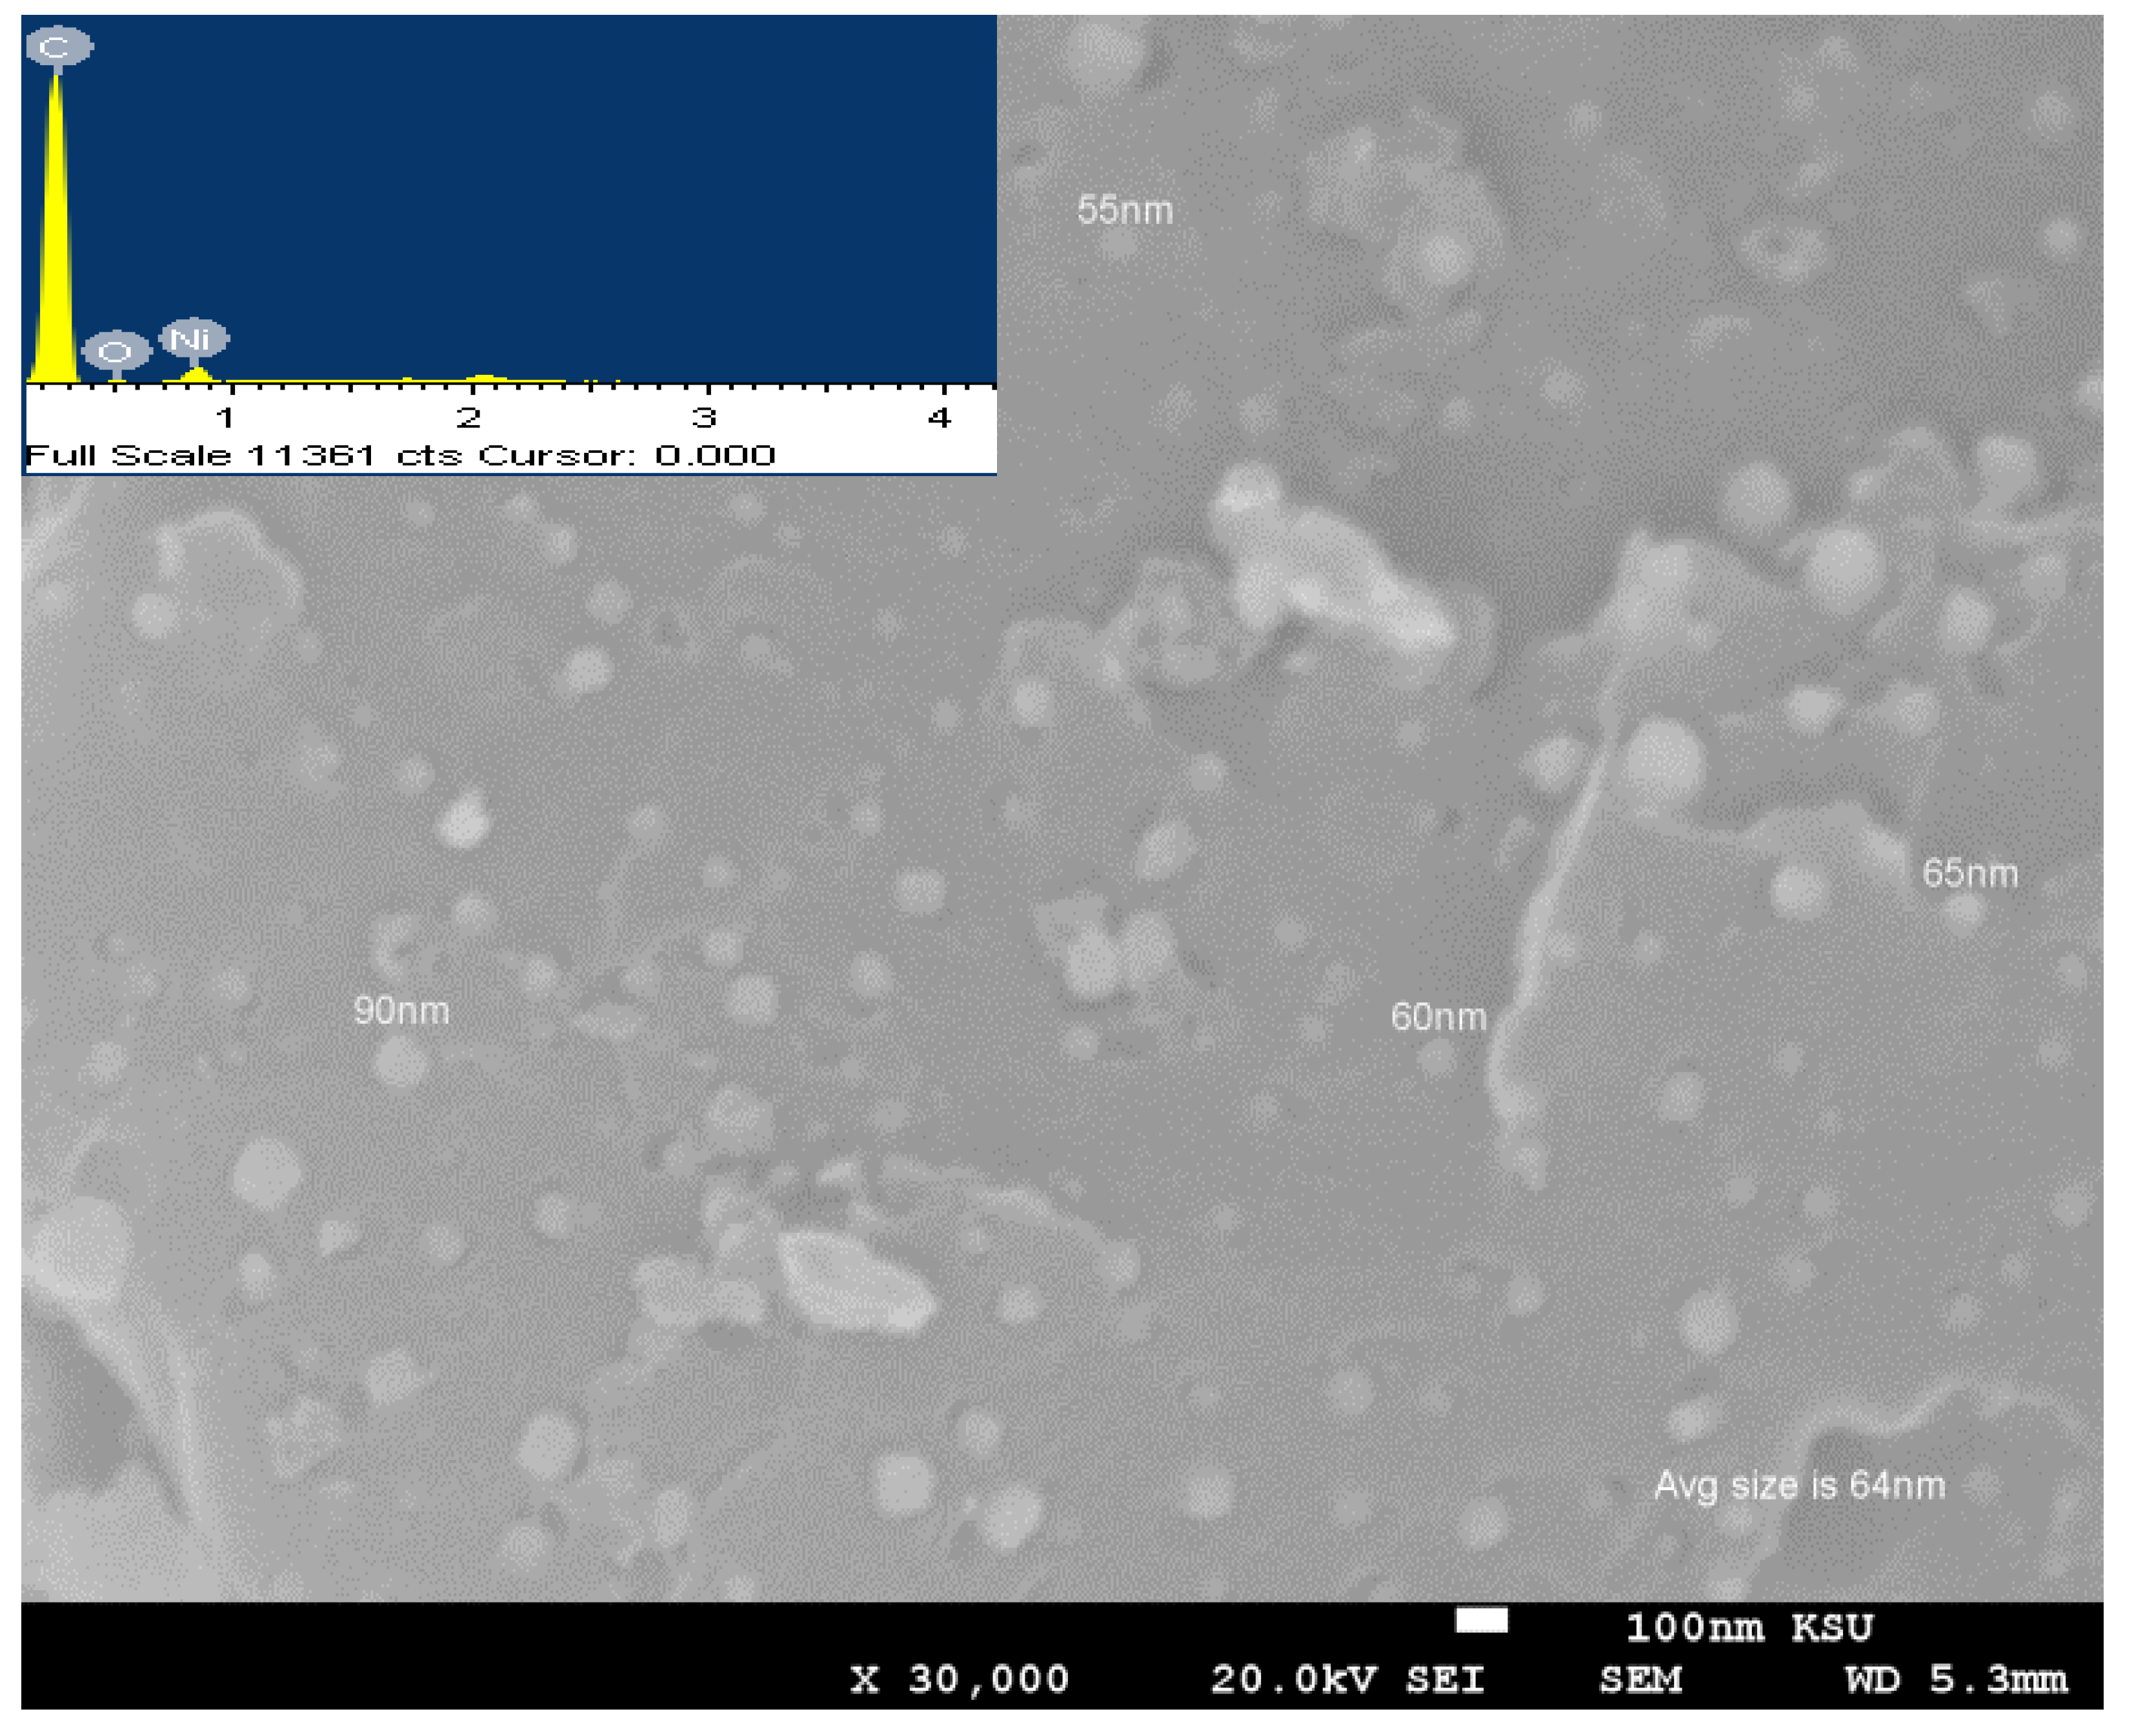
3.1. Crystallinity and Morphological Characterization

Figure 1 shows the XRD pattern of the ammonia-treated AC. No sharp diffraction peaks were detected for the AC due to its poor crystallinity. However, broad, low intensity peaks, at 2θ° around 21.9° (002), 43.2° (101), and 78.9° (110), might correspond to the planes of graphite, indicating some alignment of carbon layer planes [99,100].
Figure 2 shows the X-ray fluorescence (XRF) spectrum of the ammonia-treated AC, where carbon and nitrogen were detected with the convolution of the nitrogen signal under the carbon signal. As per the result of CHNS analysis, a value of 2.0 wt.% reflected the nitrogen content. The XRF and the micro-elemental analysis indicated the successfulness of our procedure for doping AC with nitrogen.
Figure 3 shows the XRD diffraction patterns for the transition metal-decorated (Pd, Ni, Rh, Ir and Ru), ammonia-treated AC samples. Their corresponding backscattered scanning electron micrographs and EDX analyses are shown in Figure 4, Figure 5, Figure 6, Figure 7 and Figure 8. The ACs were fibrous, layered structures, while the transition metal nanoparticles were spherical and homogenously distributed, as supported by the close match between the average crystallite size, calculated from XRD, and the particle size, estimated from the SEM, confirming no agglomeration of the decorated metal particles. The presence of the transition metals was also supported by the EDX analysis, where platinum signals were detected in all of the samples around 2.1 keV, as platinum plating was used for removing the surface charge accumulation. The results of platinum-decorated samples were reported earlier by Aboud et al. [90]. All of the decorated metals were found in their zero state, as a result of complete reduction. The data dragged from the XRD and their corresponding SEM is summarized in Table 1.

3.2. Textural Characterization

The textural properties were reported before and after ammonia treatment for the pristine and platinum-decorated samples [90]. These samples had a complex structure of mixed micropores and mesopores, with an average micropore volume of ~0.4 cm3 g−1, which was half of the total pore volume of ~0.8 cm3 g−1. Their nitrogen adsorption isotherms, at 77 K, showed that ammonia treatment improved the BET surface area, while not much alteration was observed for the micropore volume or diameter with an average micropore width of ~2 nm, as displayed in Figure 9a–d. The steadiness of the micropore attributes, while improving the BET surface area for the ammonia-treated specimens, supports the assumption of the erosion effect of ammonia acting on mesopores and macropores, while the micropores were not affected due to their inaccessibility by the ammonia gas molecules [90,91]. On the other hand, platinum decoration had an opposite effect, owing to its additional metal mass and nanoparticle metal filling, as reported for deterioration upon metal decorations of activated carbons [28,101]. In addition, the average size of the decorated metal particles were in the range of meso/macropore sizes [102], implying that pore blocking would not affect the micropores, but might block only the mesopores and/or macropores, which would decrease the overall porosity and the surface area, as was reported [90]. The same conclusions can be applied for all of the other decorated metal samples.

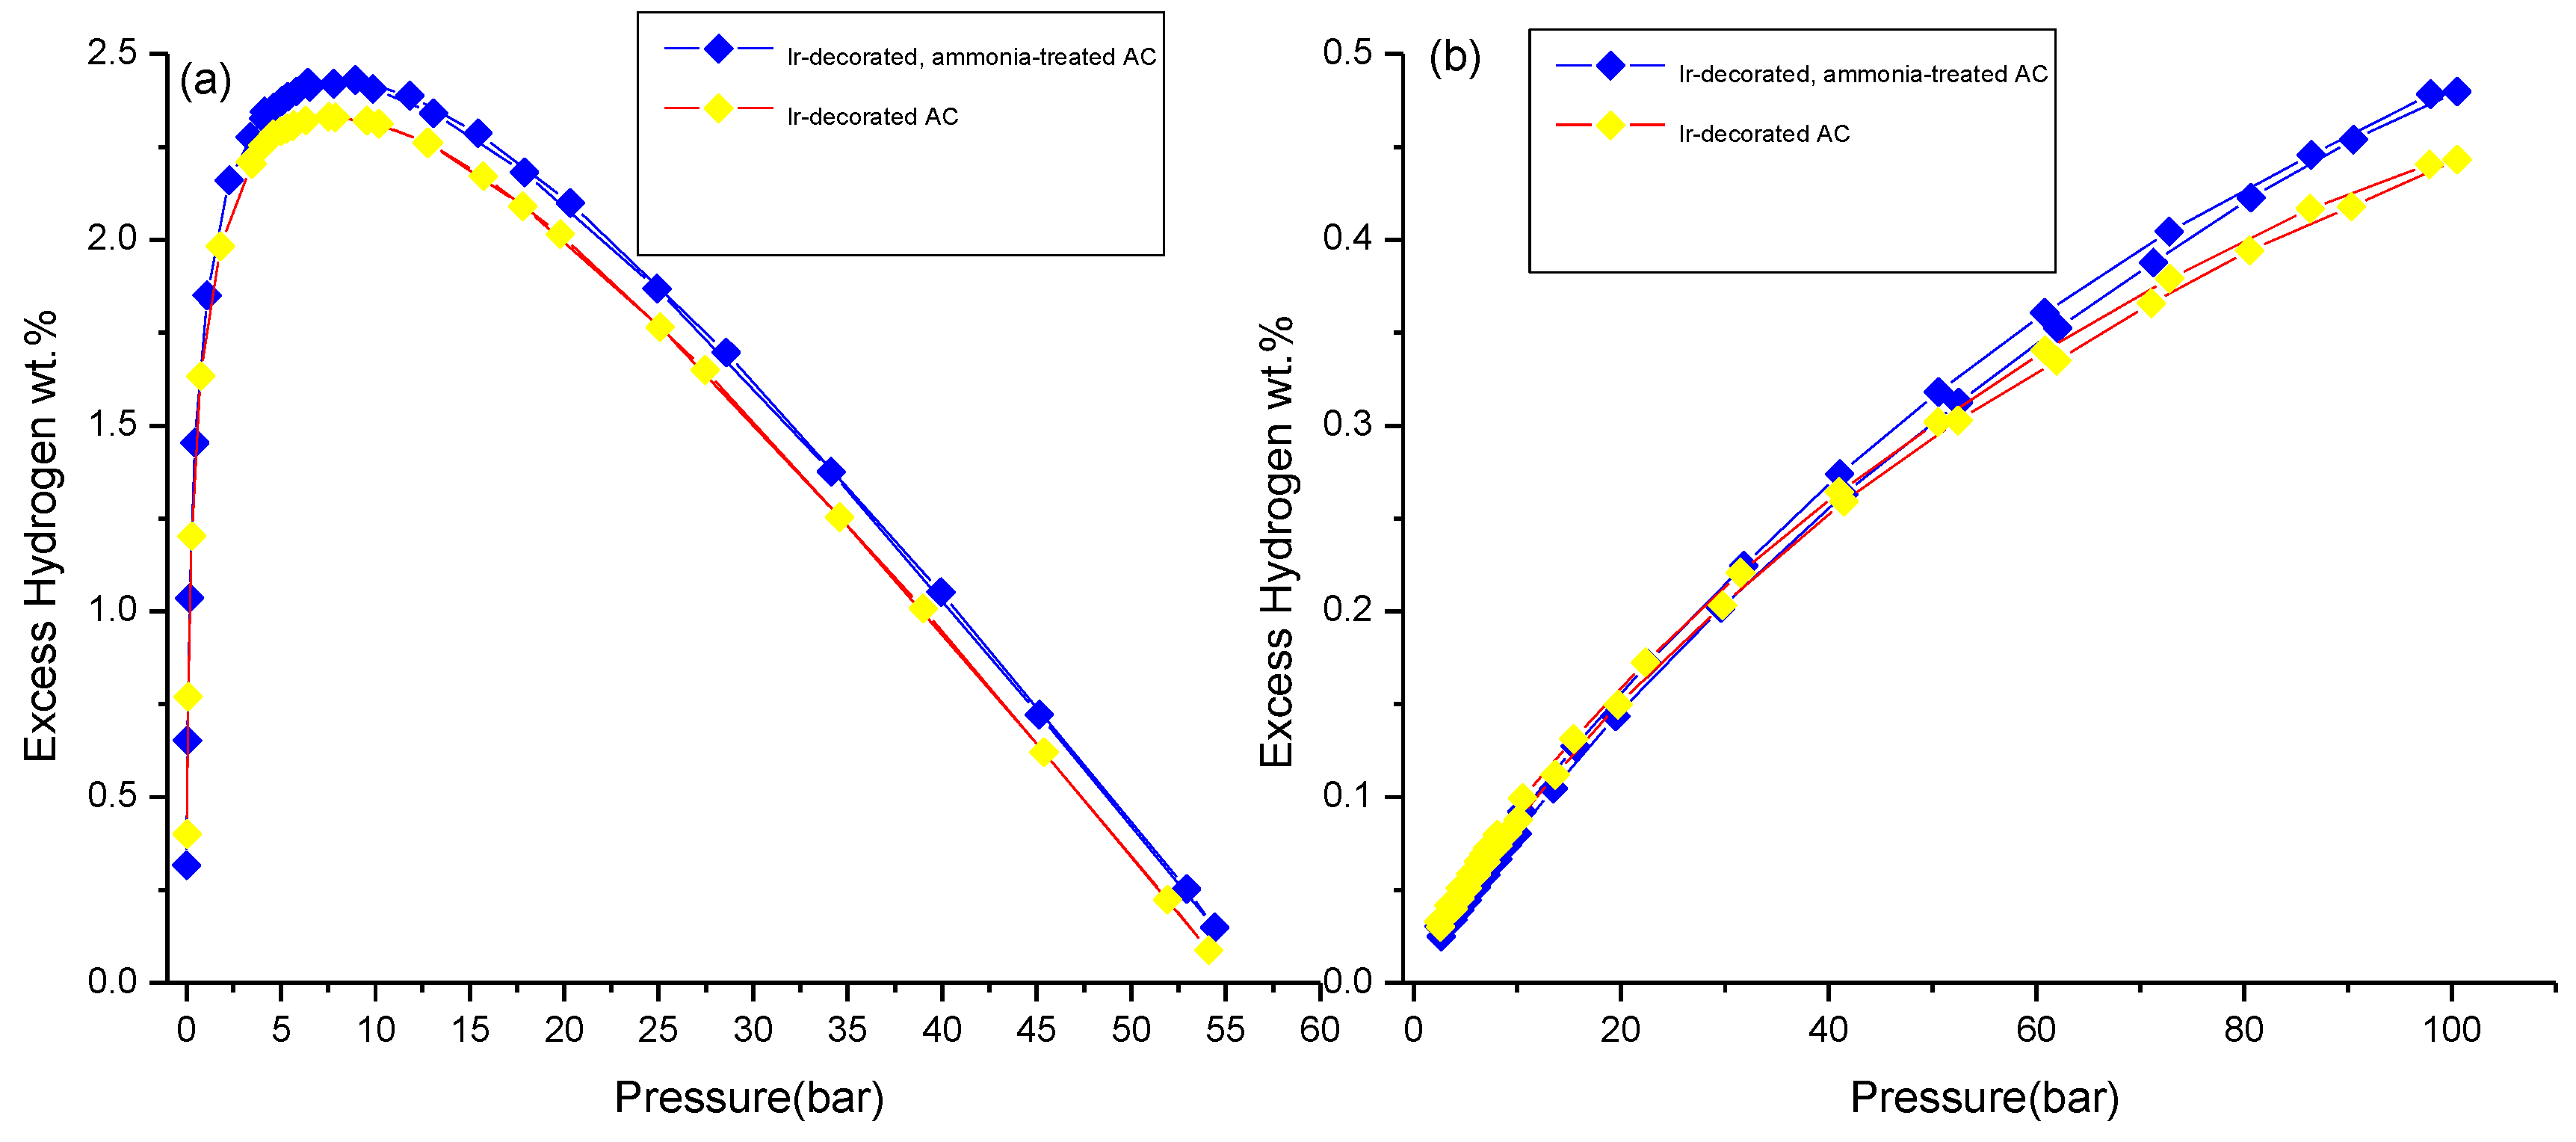
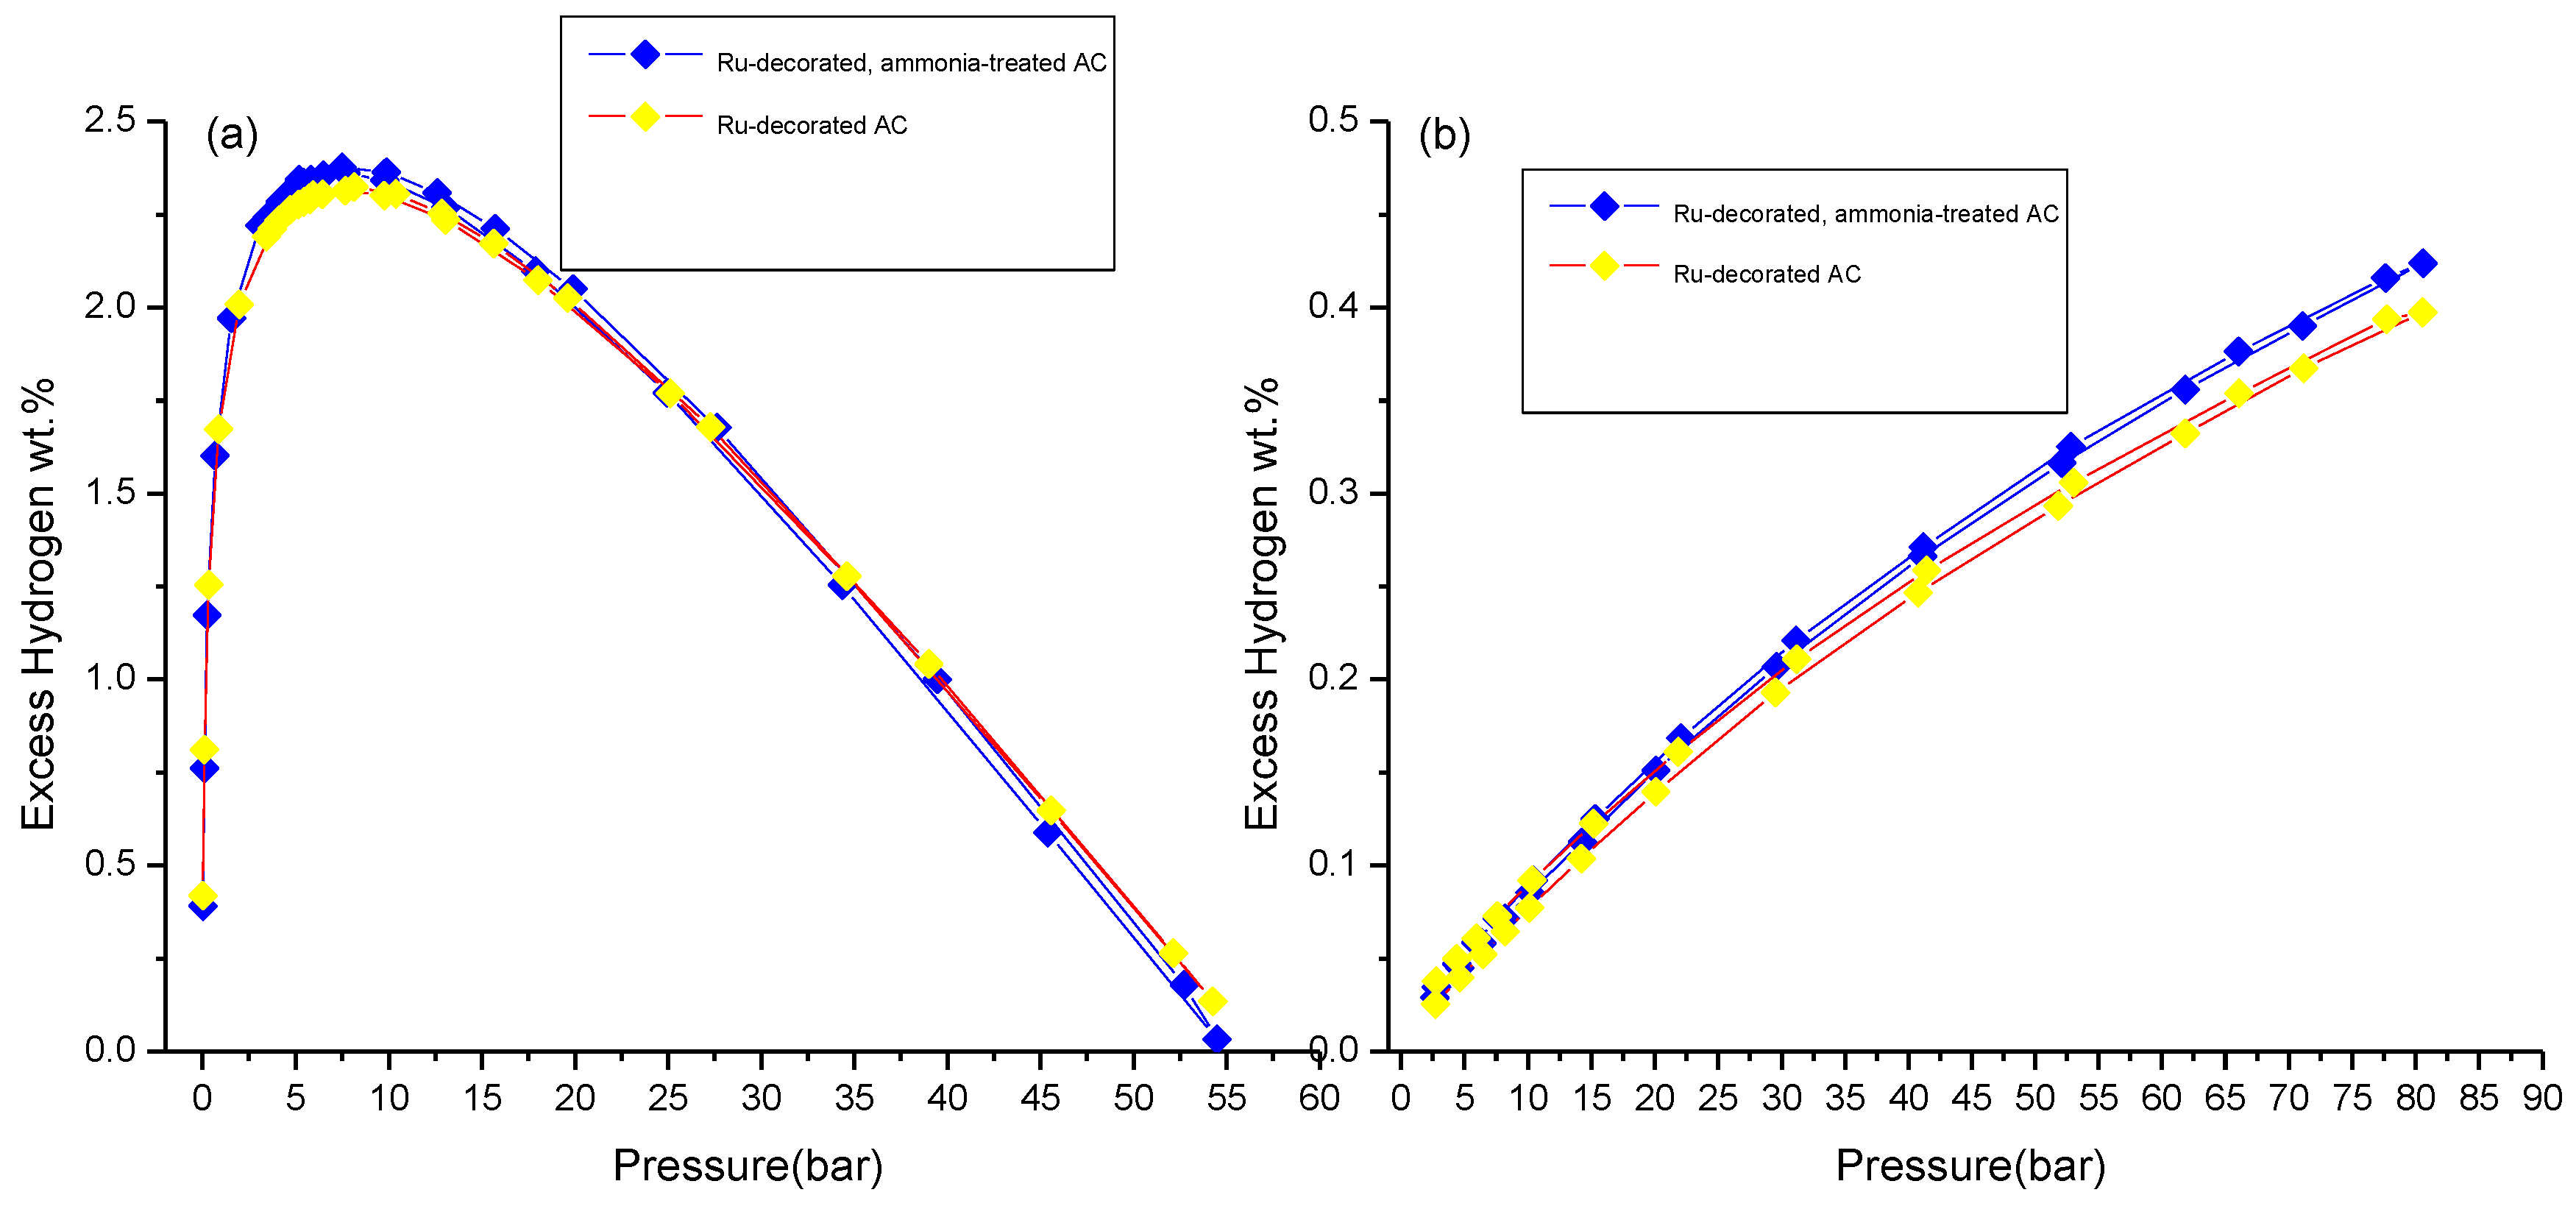
3.3. Hydrogen Storage Measurements

Figure 10, Figure 11, Figure 12, Figure 13, Figure 14 and Figure 15 show the hydrogen adsorption and desorption curves at both 77 K and 298 K for pristine and ammonia-treated activated carbon and their decoration with Pt, Pd, Ni, Rh, Ir and Ru, respectively. Their excess hydrogen storage capacities are summarized in Table 2.
At cryogenic temperatures, the isotherm shape may be a hybrid of a Type I isotherm, indicated by the steep uptake at low pressure, and a Type IV isotherm, indicated by gradual increase, beyond the steep region, to the saturation point [102]. At the low-pressure region around the ambient pressure, an initial sharp gas uptake occurred, owing to the strong interaction between hydrogen gas molecules and the narrow micropores, and this indicated their complete filling. The adsorption curves were overlapped for all of the samples at low pressure, indicating similar micropore fillings for all of the samples, which is consistent with the stability of the micropore volume with ammonia treatment and metal decoration.
As the micropores are just a portion of the total porosity, the filling of mesopores and macropores will begin after filling of the micropores and is indicated by the gradual increase in adsorption beyond the steep uptake. The fillings of the mesopores and macropores take place through overlapping between the monolayer/multilayer adsorption [102]. The hydrogen storage uptake at 77 K maximized around 7.0 bar, reached saturation, and then decreased with increasing hydrogen gas pressure. The descending behavior after reaching the maximum was experimentally reported [34] as a supercritical adsorption and a typical behavior for the excess isotherm model reported by Chilve et al. [103,104,105]. It also follows the same approach proposed by Do et al. [106], who described the decrease in the excess adsorbed gas, defined by Gibbs excess. At the maximum, a complete filling of the adsorbed gas was achieved, and then the excess adsorbed gas would decrease to zero, and a further increase in pressure would result in negative values [97,107].
At ambient temperature, the adsorption behavior was different in comparison to cryogenic temperature, as the porosity filling was increasing gradually for all samples over the studied pressure range, and the excess amount did not reach the maximum over the applied pressure range due to the very weak adsorption forces at this temperature [59].
These excess hydrogen storage capacities agree with the data reported for several carbonaceous materials with similar textural properties at these conditions [28,37,59,67,68,108,109], and are also reliable with the theoretical hydrogen storage capacity values, calculated by Ströbel et al. [110], for carbonaceous materials with similar textural properties.
The incremental wt.% in the hydrogen storage was calculated by the following mathematical equation: (Hydrogen storage after treatment or decoration—Hydrogen storage before treatment or decoration) × 100/(Hydrogen storage before treatment)
At cryogenic temperature, ammonia treatment improved the maximum hydrogen storage by an average of ~4.0 wt.% for all treated samples. At the same temperature, the decoration correspondingly decreased the hydrogen storage by ~8.0 wt.% for most of the decorated metals other than palladium. The lower hydrogen uptake of the transition metal-decorated samples suggested that the spillover effect at this temperature was negligible in comparison to the effect of blocking the pore by metal nanoparticles and their additional mass. Such result is reliable with the reported negative effect of metal decoration at cryogenic temperatures [28,67].
At room temperature, the small hydrogen storage capacities could be ascribed to the low enthalpy of the adsorption of hydrogen at this temperature [28,59]. At this temperature, ammonia treatment resulted in hydrogen storage enhancement of ~57 wt.% for the pristine AC, and between 8–42 wt.% for the metal-decorated ones. At the same temperature, metal decoration improved the hydrogen storage capacity of the pristine AC between 24–105 wt.% and between 12–48 wt.% for the ammonia-treated AC, suggesting that the spillover worked well at room temperature with the highest contribution belonging to iridium and palladium.
No hysteresis, especially at cryogenic temperature below the experimental error, was observed, confirming the total reversibility of the hydrogen storage when removing the applied pressure. This reversibility was free of any storage capacity loss after many cycles, and without performing any adsorbent treatment between the cycles. Minor hysteresis may be observed, with complete desorption, confirming no hydride formations of the initially adsorbed hydrogen at ambient pressure due to the adsorption metastability and/or network effects at ambient temperatures [102].

4. Conclusions

Ammonia treatment had no effect on the micropore properties of AC, but it improved the overall textural properties. It improved the hydrogen storage of AC at both ambient and cryogenic temperatures, where this enhancement was more obvious at room temperature with increments of around 57 wt.%. In addition, the hydrogen storage at cryogenic temperature was not clearly increased by transition metal decoration, but it rather was decreased for the metals other than palladium, due to the negligible effect of the spillover mechanism at such low temperatures in comparison to the counter effect by metal decoration. In contrast, the transition metal decoration had encouraged the hydrogen storage at ambient temperatures, especially for iridium and palladium, owing to the spillover mechanism working well at such a temperature.
None of the samples showed hysteresis, at both cryogenic and ambient temperature, which confirmed the total release of the hydrogen gas molecules once the applied pressure was released.
Therefore, the results of this study demonstrated that ammonia treatment enhanced the hydrogen storage in AC-based adsorbents due to its erosion effect that can alter the AC’s textures, especially at ambient temperature. Furthermore, transition metal decoration motivated hydrogen storage only at ambient temperatures via the spillover mechanism, while it was of minor effect at cryogenic temperatures.

Author Contributions

M.F.A.A. conceived and designed the experiments, performed all experiments and all data analysis; M.F.A.A. wrote the paper; Z.A.A. participated in the hydrogen storage measurements, data analysis, paper writing and corrections; A.A.B. participated in materials synthesis, the textural characterization, paper writing and corrections. All authors examined and approved the final manuscript. All authors read and agreed to the publisher version of the manuscript.

Funding

This research was funded by the National Plan for Science, Technology, and Innovation (MAARIFAH), King Abdul-Aziz City for Science and Technology, Kingdom of Saudi Arabia, grant Number (11-ENE1472-02).

Institutional Review Board Statement

Not applicable.

Informed Consent Statement

Not applicable.

Data Availability Statement

No supporting information for this study. Thus, this section is excluded.

Acknowledgments

We are grateful to the National Plan for Science, Technology, and Innovation (MAARIFAH), King Abdul-Aziz City for Science and Technology, Kingdom of Saudi Arabia, grant Number (11-ENE1472-02).

Conflicts of Interest

The authors declare no conflict of interest.

References

  1. Schlapbach, L.; Züttel, A. Hydrogen-Storage Materials for Mobile Applications. Nat. Cell Biol. 2001, 414, 353–358. [Google Scholar] [CrossRef] [PubMed]
  2. Rostrup-Nielsen, J.R.; Rostrup-Nielsen, T. Large-Scale Hydrogen Production. Cattech 2002, 6, 150–159. [Google Scholar] [CrossRef]
  3. Rosen, M.A.; Koohi-Fayegh, S. The Prospects for Hydrogen as an Energy Carrier: An Overview of Hydrogen Energy and Hydrogen Energy Systems. Energy Ecol. Environ. 2016, 1, 10–29. [Google Scholar] [CrossRef] [Green Version]
  4. Rivera, X.C.S.; Topriska, E.; Kolokotroni, M.; Azapagic, A. Environmental Sustainability of Renewable Hydrogen in Comparison with Conventional Cooking Fuels. J. Clean. Prod. 2018, 196, 863–879. [Google Scholar] [CrossRef]
  5. Logan, K.G.; Nelson, J.D.; Hastings, A. Electric and Hydrogen Buses: Shifting from Conventionally Fuelled Cars in the UK. Transp. Res. Part D Transp. Environ. 2020, 85, 102350. [Google Scholar] [CrossRef]
  6. Post, L.E.M. Fuel Cell Electric Buses in U.S. Transit Fleets: Current Status 2020. NREL/TP-5400-75583. 2021. Available online: https://www.nrel.gov/docs/fy21osti/75583.pdf (accessed on 1 May 2021).
  7. Kapelewski, M.T.; Runcevski, T.; Tarver, J.D.; Jiang, H.Z.H.; Hurst, K.E.; Parilla, P.A.; Ayala, A.; Gennett, T.; Fitzgerald, S.A.; Brown, C.M.; et al. Record High Hydrogen Storage Capacity in the Metal–Organic Framework Ni2 (m-dobdc) at Near-Ambient Temperatures. Chem. Mater. 2018, 30, 8179–8189. [Google Scholar] [CrossRef]
  8. The Engineering ToolBox. Hydrogen-Density and Specific Weight. Available online: https://www.engineeringtoolbox.com/hydrogen-H2-density-specific-weight-temperature-pressure-d_2044.html (accessed on 1 May 2021).
  9. Barthélémy, H. Effects of Pressure and Purity on the Hydrogen Embrittlement of Steels. Int. J. Hydrog. Energy 2011, 36, 2750–2758. [Google Scholar] [CrossRef]
  10. Krasae-In, S.; Stang, J.H.; Neksa, P. Simulation on a Proposed Large-Scale Liquid Hydrogen Plant Using a Multi-Component Refrigerant Refrigeration System. Int. J. Hydrog. Energy 2010, 35, 12531–12544. [Google Scholar] [CrossRef] [Green Version]
  11. David, A.C.; Bebon, L.; Thiebaud, F. Hydrogen Storage: The Different Technologies, the Challenges and the Stakes. In Proceedings of the International Symposiumon Sustainable Hydrogen, Alger, Algeria, 15 June 2020; pp. 1–9. [Google Scholar]
  12. von Colbe, J.B.; Ares, J.-R.; Barale, J.; Baricco, M.; Buckley, C.; Capurso, G.; Gallandat, N.; Grant, D.; Guzik, M.N.; Jacob, I.; et al. Application of Hydrides in Hydrogen Storage and Compression: Achievements, Outlook and Perspectives. Int. J. Hydrogen Energy 2019, 44, 7780–7808. [Google Scholar] [CrossRef]
  13. Somo, T.R.; Maponya, T.C.; Davids, M.W.; Hato, M.J.; Lototskyy, M.V.; Modibane, K.D. A Comprehensive Review on Hydrogen Absorption Behaviour of Metal Alloys Prepared through Mechanical Alloying. Metals 2020, 10, 562. [Google Scholar] [CrossRef]
  14. Andersson, J.; Grönkvist, S. Large-Scale Storage of Hydrogen. Int. J. Hydrog. Energy 2019, 44, 11901–11919. [Google Scholar] [CrossRef]
  15. Hu, X.; Qi, Z.; Qin, F.; Chen, J. Mechanism Analysis on Stress Accumulation in Cylindrical Vertical-Placed Metal Hydride Reactor. Energy Power Eng. 2011, 03, 490–498. [Google Scholar] [CrossRef] [Green Version]
  16. Lohstroh, W.; Fichtner, M.; Breitung, W. Complex Hydrides as Solid Storage Materials: First Safety Tests. Int. J. Hydrog. Energy 2009, 34, 5981–5985. [Google Scholar] [CrossRef]
  17. Ovshinsky, S.R.; Fetcenko, M.A.; Ross, J. A Nickel Metal Hydride Battery for Electric Vehicles. Science 1993, 260, 176–181. [Google Scholar] [CrossRef]
  18. MacDowell, N.; Florin, N.; Buchard, A.; Hallett, J.; Galindo, A.; Jackson, G.; Adjiman, C.; Williams, C.; Shah, N.; Fennell, P. An overview of CO2 capture technologies. Energy Environ. Sci. 2010, 3, 1645–1669. [Google Scholar] [CrossRef] [Green Version]
  19. Dong, J.; Wang, X.; Xu, H.; Zhao, Q.; Li, J. Hydrogen Storage in Several Microporous Zeolites. Int. J. Hydrog. Energy 2007, 32, 4998–5004. [Google Scholar] [CrossRef]
  20. Uzun, A.; Keskin, S. Site Characteristics in Metal Organic Frameworks for Gas Adsorption. Prog. Surf. Sci. 2014, 89, 56–79. [Google Scholar] [CrossRef]
  21. Mohan, M.; Sharma, V.K.; Kumar, E.A.; Gayathri, V. Hydrogen Storage in Carbon Materials—A Review. Energy Storage 2019, 1, e35. [Google Scholar] [CrossRef]
  22. Ebbesen, T.W.; Lezec, H.J.; Hiura, H.; Bennett, J.W.; Ghaemi, H.F.; Thio, T. Electrical Conductivity of Individual Carbon Nanotubes. Nature 1996, 382, 54–56. [Google Scholar] [CrossRef]
  23. Wong, E.W.; Sheehan, P.; Lieber, C.M. Nanobeam Mechanics: Elasticity, Strength, and Toughness of Nanorods and Nanotubes. Science 1997, 277, 1971–1975. [Google Scholar] [CrossRef]
  24. Collins, P.G.; Bradley, K.; Ishigami, M.; Zettl, A. Extreme Oxygen Sensitivity of Electronic Properties of Carbon Nanotubes. Science 2000, 287, 1801–1804. [Google Scholar] [CrossRef]
  25. Liang, W.; Yokojima, S.; Ng, M.-F.; Chen, G.; He, G. Optical Properties of Single-Walled 4 Å Carbon Nanotubes. J. Am. Chem. Soc. 2001, 123, 9830–9836. [Google Scholar] [CrossRef] [PubMed] [Green Version]
  26. Minot, E.D.; Yaish, Y.; Sazonova, V.; McEuen, P.L. Determination of Electron Orbital Magnetic Moments in Carbon Nanotubes. Nat. Cell Biol. 2004, 428, 536–539. [Google Scholar] [CrossRef] [Green Version]
  27. Motta, M.; Kinloch, I.; Windle, A.; Li, Y.-L. Mechanical Properties of Continuously Spun Fibers of Carbon Nanotubes. Nano Lett. 2005, 5, 1529–1533. [Google Scholar] [CrossRef] [PubMed]
  28. Aboud, M.F.A.; Alothman, Z.A.; Habila, M.A.; Zlotea, C.; Latroche, M.; Cuevas, F. Hydrogen Storage in Pristine and d10-Block Metal-Anchored Activated Carbon Made from Local Wastes. Energies 2015, 8, 3578–3590. [Google Scholar] [CrossRef] [Green Version]
  29. Mukherjee, B.; Kalita, G.; Sharon, M.; Sharon, M. Hydrogen Storage by Carbon Fibers from Cotton. QSci. Connect. 2013, 2013. [Google Scholar] [CrossRef]
  30. Dodziuk, H.; Dolgonos, G. Molecular Modeling Study of Hydrogen Storage in Carbon Nanotubes. Chem. Phys. Lett. 2002, 356, 79–83. [Google Scholar] [CrossRef]
  31. Lee, S.M.; An, K.H.; Lee, Y.H.; Seifert, G.; Frauenheim, T. A Hydrogen Storage Mechanism in Single-Walled Carbon Nanotubes. J. Am. Chem. Soc. 2001, 123, 5059–5063. [Google Scholar] [CrossRef]
  32. Dillon, A.C.; Jones, K.M.; Bekkedahl, T.A.; Kiang, C.H.; Bethune, D.S.; Heben, M.J. Storage of Hydrogen in Single-Walled Carbon Nanotubes. Nat. Cell Biol. 1997, 386, 377–379. [Google Scholar] [CrossRef]
  33. Liu, C.; Fan, Y.Y.; Liu, M.; Cong, H.T.; Cheng, H.-M.; Dresselhaus, M.S. Hydrogen Storage in Single-Walled Carbon Nanotubes at Room Temperature. Science 1999, 286, 1127–1129. [Google Scholar] [CrossRef] [Green Version]
  34. Zhou, L. Progress and Problems in Hydrogen Storage Methods. Renew. Sustain. Energy Rev. 2005, 9, 395–408. [Google Scholar] [CrossRef]
  35. Shaijumon, M.; Ramaprabhu, S. Studies of Yield and Nature of Carbon Nanostructures Synthesized by Pyrolysis of Ferrocene and Hydrogen Adsorption Studies of Carbon Nanotubes. Int. J. Hydrog. Energy 2005, 30, 311–317. [Google Scholar] [CrossRef]
  36. Lee, H.; Kang, Y.-S.; Kim, S.-H.; Lee, J.-Y. Hydrogen Desorption Properties of Multiwall Carbon Nanotubes with Closed and Open Structures. Appl. Phys. Lett. 2002, 80, 577–579. [Google Scholar] [CrossRef]
  37. Yürüm, Y.; Taralp, A.; Veziroglu, T.N. Storage of Hydrogen in Nanostructured Carbon Materials. Int. J. Hydrogen Energy 2009, 34, 3784–3798. [Google Scholar] [CrossRef] [Green Version]
  38. Hou, P.-X.; Yang, Q.-H.; Bai, S.; Xu, S.-T.; Liu, A.M.; Cheng, H.-M. Bulk Storage Capacity of Hydrogen in Purified Multiwalled Carbon Nanotubes. J. Phys. Chem. B 2002, 106, 963–966. [Google Scholar] [CrossRef]
  39. Shiraishi, M.; Takenobu, T.; Kataura, H.; Ata, M. Hydrogen Adsorption and Desorption in Carbon Nanotube Systems and Its Mechanisms. Appl. Phys. A 2004, 78, 947–953. [Google Scholar] [CrossRef]
  40. Ding, R.G.; Lu, G.Q.; Yan, Z.F.; Wilson, M.A. Recent Advances in the Preparation and Utilization of Carbon Nanotubes for Hydrogen Storage. J. Nanosci. Nanotechnol. 2001, 1, 7–29. [Google Scholar] [CrossRef]
  41. Tibbetts, G.G.; Meisner, G.P.; Olk, C.H. Hydrogen Storage Capacity of Some Carbon Nanotubes and Filaments; Canadian Hydrogen Association: Vancouver, BC, Canada, 2000. [Google Scholar]
  42. Frankland, S.; Brenner, D. Hydrogen Raman Shifts in Carbon Nanotubes from Molecular Dynamics Simulation. Chem. Phys. Lett. 2001, 334, 18–23. [Google Scholar] [CrossRef]
  43. Tibbetts, G.G.; Meisner, G.P.; Olk, C.H. Hydrogen Storage Capacity of Carbon Nanotubes, Filaments, and Vapor-Grown Fibers. Carbon 2001, 39, 2291–2301. [Google Scholar] [CrossRef]
  44. Shiraishi, M.; Takenobu, T.; Ata, M. Gas–Solid Interactions in the Hydrogen/Single-Walled Carbon Nanotube System. Chem. Phys. Lett. 2003, 367, 633–636. [Google Scholar] [CrossRef]
  45. Bénard, P.; Chahine, R. Storage of Hydrogen by Physisorption on Carbon and Nanostructured Materials. Scr. Mater. 2007, 56, 803–808. [Google Scholar] [CrossRef]
  46. Gadiou, R.; Saadallah, S.-E.; Piquero, T.; David, P.; Parmentier, J.; Vix-Guterl, C. The Influence of Textural Properties on the Adsorption of Hydrogen on Ordered Nanostructured Carbons. Microporous Mesoporous Mater. 2005, 79, 121–128. [Google Scholar] [CrossRef]
  47. Georgakis, M.; Stavropoulos, G.; Sakellaropoulos, G. Molecular Dynamics Study of Hydrogen Adsorption in Carbonaceous Microporous Materials and the Effect of Oxygen Functional Groups. Int. J. Hydrog. Energy 2007, 32, 1999–2004. [Google Scholar] [CrossRef]
  48. Yildirim, T.; Ciraci, S. Titanium-Decorated Carbon Nanotubes as a Potential High-Capacity Hydrogen Storage Medium. Phys. Rev. Lett. 2005, 94, 175501. [Google Scholar] [CrossRef] [Green Version]
  49. Zhan, L.; Li, K.; Zhu, X.; Lv, C.; Ling, L. Adsorption Limit of Supercritical Hydrogen on Super-Activated Carbon. Carbon 2002, 40, 455–457. [Google Scholar] [CrossRef]
  50. Wang, Q.; Johnson, J.K.; Broughton, J.Q. Path Integral Grand Canonical Monte Carlo. J. Chem. Phys. 1997, 107, 5108–5117. [Google Scholar] [CrossRef]
  51. Cheng, H.; Pez, G.; Kern, G.; Kresse, G.; Hafner, J. Hydrogen Adsorption in Potassium-Intercalated Graphite of Second Stage: An ab Initio Molecular Dynamics Study. J. Phys. Chem. B 2001, 105, 736–742. [Google Scholar] [CrossRef]
  52. Chambers, A.; Park, C.; Baker, A.R.T.K.; Rodriguez, N.M. Hydrogen Storage in Graphite Nanofibers. J. Phys. Chem. B 1998, 102, 4253–4256. [Google Scholar] [CrossRef]
  53. Gupta, B.K.; Tiwari, R.; Srivastava, O. Studies on Synthesis and Hydrogenation Behaviour of Graphitic Nanofibres Prepared Through Palladium Catalyst Assisted Thermal Cracking of Acetylene. J. Alloy. Compd. 2004, 381, 301–308. [Google Scholar] [CrossRef]
  54. Browning, D.J.; Gerrard, M.L.; Lakeman, J.B.; Mellor, I.; Mortimer, R.J.; Turpin, M.C. Studies into the Storage of Hydrogen in Carbon Nanofibers: Proposal of a Possible Reaction Mechanism. Nano Lett. 2002, 2, 201–205. [Google Scholar] [CrossRef]
  55. Bénard, P.; Chahine, R. Determination of the Adsorption Isotherms of Hydrogen on Activated Carbons above the Critical Temperature of the Adsorbate over Wide Temperature and Pressure Ranges. Langmuir 2001, 17, 1950–1955. [Google Scholar] [CrossRef]
  56. Nard, P.B.; Chahine, R. Modeling of Adsorption Storage of Hydrogen on Activated Carbons. Int. J. Hydrog. Energy 2001, 26, 849–855. [Google Scholar]
  57. Bhatia, S.K.; Myers, A.L. Optimum Conditions for Adsorptive Storage. Langmuir 2006, 22, 1688–1700. [Google Scholar] [CrossRef] [PubMed]
  58. Gigras, A.; Bhatia, S.K.; Kumar, A.A.; Myers, A.L. Feasibility of Tailoring for High Isosteric Heat to Improve Effectiveness of Hydrogen Storage in Carbons. Carbon 2007, 45, 1043–1050. [Google Scholar] [CrossRef]
  59. Thomas, K.M. Hydrogen Adsorption and Storage on Porous Materials. Catal. Today 2007, 120, 389–398. [Google Scholar] [CrossRef]
  60. Psofogiannakis, G.M.; Froudakis, G.E. DFT Study of the Hydrogen Spillover Mechanism on Pt-Doped Graphite. J. Phys. Chem. C 2009, 113, 14908–14915. [Google Scholar] [CrossRef]
  61. Wang, Z.; Yang, R.T. Enhanced Hydrogen Storage on Pt-Doped Carbon by Plasma Reduction. J. Phys. Chem. C 2010, 114, 5956–5963. [Google Scholar] [CrossRef]
  62. Prins, R. Hydrogen Spillover. Facts and Fiction. Chem. Rev. 2012, 112, 2714–2738. [Google Scholar] [CrossRef]
  63. Psofogiannakis, G.M.; Froudakis, G.E. Theoretical Explanation of Hydrogen Spillover in Metal−Organic Frameworks. J. Phys. Chem. C 2011, 115, 4047–4053. [Google Scholar] [CrossRef]
  64. Robell, A.J.; Ballou, E.V.; Boudart, M. Surface Diffusion of Hydrogen on Carbon. J. Phys. Chem. 1964, 68, 2748–2753. [Google Scholar] [CrossRef]
  65. Guo, J.-H.; Li, X.-D.; Liu, H.; Li, S.-J.; Chen, G. Combined Density Functional Theory and Kinetic Monte Carlo Study of Hydrogen Spillover on Fluorine-Decorating Covalent Organic Frameworks. J. Phys. Chem. C 2019, 123, 15935–15943. [Google Scholar] [CrossRef]
  66. Sabo, M.; Henschel, A.; Fröde, H.; Klemm, E.; Kaskel, S. Solution Infiltration of Palladium into MOF-5: Synthesis, Physisorption and Catalytic Properties. J. Mater. Chem. 2007, 17, 3827–3832. [Google Scholar] [CrossRef]
  67. Zhao, W.; Fierro, V.; Zlotea, C.; Izquierdo, M.T.; Chevalier-César, C.; Latroche, M.; Celzard, A. Activated Carbons Doped with Pd Nanoparticles for Hydrogen Storage. Int. J. Hydrog. Energy 2012, 37, 5072–5080. [Google Scholar] [CrossRef]
  68. Dibandjo, P.; Zlotea, C.; Gadiou, R.; Ghimbeu, C.M.; Cuevas, F.; Latroche, M.; Leroy, E.; Vix-Guterl, C. Hydrogen Storage in Hybrid Nanostructured Carbon/Palladium Materials: Influence of Particle Size and Surface Chemistry. Int. J. Hydrog. Energy 2013, 38, 952–965. [Google Scholar] [CrossRef]
  69. Nag, N.K. A Study on the Formation of Palladium Hydride in a Carbon-Supported Palladium Catalyst. J. Phys. Chem. B 2001, 105, 5945–5949. [Google Scholar] [CrossRef]
  70. Zlotea, C.; Cuevas, F.; Paul-Boncour, V.; Leroy, E.; Dibandjo, P.; Gadiou, R.; Vix-Guterl, C.; Latroche, M. Size-Dependent Hydrogen Sorption in Ultrasmall Pd Clusters Embedded in a Mesoporous Carbon Template. J. Am. Chem. Soc. 2010, 132, 7720–7729. [Google Scholar] [CrossRef]
  71. Stoyanov, S.R.; Titov, A.V.; Král, P. Transition Metal and Nitrogen Doped Carbon Nanostructures. Coord. Chem. Rev. 2009, 253, 2852–2871. [Google Scholar] [CrossRef]
  72. Wang, C.-Y.; Gray, J.L.; Gong, Q.; Zhao, Y.; Li, J.; Klontzas, E.; Psofogiannakis, G.; Froudakis, G.; Lueking, A. Hydrogen Storage with Spectroscopic Identification of Chemisorption Sites in Cu-TDPAT via Spillover from a Pt/Activated Carbon Catalyst. J. Phys. Chem. C 2014, 118, 26750–26763. [Google Scholar] [CrossRef]
  73. Nishihara, H.; Ittisanronnachai, S.; Itoi, H.; Li, L.-X.; Suzuki, K.; Nagashima, U.; Ogawa, H.; Kyotani, T.; Ito, M. Experimental and Theoretical Studies of Hydrogen/Deuterium Spillover on Pt-Loaded Zeolite-Templated Carbon. J. Phys. Chem. C 2014, 118, 9551–9559. [Google Scholar] [CrossRef]
  74. Stevens, D.; Zhang, S.; Chen, Z.; Dahn, J. On the Determination of Platinum Particle Size in Carbon-Supported Platinum Electrocatalysts for Fuel Cell Applications. Carbon 2003, 41, 2769–2777. [Google Scholar] [CrossRef]
  75. Chen, L.; Cooper, A.C.; Pez, G.P.; Cheng, H. Mechanistic Study on Hydrogen Spillover onto Graphitic Carbon Materials. J. Phys. Chem. C 2007, 111, 18995–19000. [Google Scholar] [CrossRef]
  76. Rey, M.B.; Juaristi, J.I.; Alducin, M.; López, M.J.; Alonso, J.A. Is Spillover Relevant for Hydrogen Adsorption and Storage in Porous Carbons Doped with Palladium Nanoparticles? J. Phys. Chem. C 2016, 120, 17357–17364. [Google Scholar] [CrossRef] [Green Version]
  77. Srinivas, S.; Rao, P. Direct Observation of Hydrogen Spillover on Carbon-Supported Platinum and Its Influence on the Hydrogenation of Benzene. J. Catal. 1994, 148, 470–477. [Google Scholar] [CrossRef]
  78. Psofogiannakis, G.M.; Froudakis, G.E. DFT Study of Hydrogen Storage by Spillover on Graphite with Oxygen Surface Groups. J. Am. Chem. Soc. 2009, 131, 15133–15135. [Google Scholar] [CrossRef]
  79. Ayala, P.; Arenal, R.; Rümmeli, M.H.; Rubio, A.; Pichler, T. The Doping of Carbon Nanotubes with Nitrogen and Their Potential Applications. Carbon 2010, 48, 575–586. [Google Scholar] [CrossRef]
  80. Park, H.-L.; Chung, Y.-C. Hydrogen Storage in Al and Ti Dispersed on Graphene with Boron Substitution: First-Principles Calculations. Comput. Mater. Sci. 2010, 49, S297–S301. [Google Scholar] [CrossRef]
  81. Park, H.-L.; Yi, S.-C.; Chung, Y.-C. Hydrogen Adsorption on Li Metal in Boron-Substituted Graphene: An ab Initio Approach. Int. J. Hydrogen Energy 2010, 35, 3583–3587. [Google Scholar] [CrossRef]
  82. Lv, Y.-A.; Cui, Y.-H.; Xiang, Y.-Z.; Wang, J.-G.; Li, X.-N. Modulation of Bonding between Noble Metal Monomers and CNTs by B-, N-doping. Comput. Mater. Sci. 2010, 48, 621–625. [Google Scholar] [CrossRef]
  83. Wang, K.; Shi, C.; Zhao, N.; Du, X.; Li, J. First-Principles Study of the B- or N-Doping Effects on Chemical Bonding Characteristics between Magnesium and Single-Walled Carbon Nanotubes. Chem. Phys. Lett. 2009, 469, 145–148. [Google Scholar] [CrossRef]
  84. Warczinski, L.; Hättig, C. How Nitrogen Doping Affects Hydrogen Spillover on Carbon-Supported Pd Nanoparticles: New Insights from DFT. J. Phys. Chem. C 2021, 125, 9020–9031. [Google Scholar] [CrossRef]
  85. Wu, H.-Y.; Fan, X.; Kuo, J.-L.; Deng, W.-Q. DFT Study of Hydrogen Storage by Spillover on Graphene with Boron Substitution. J. Phys. Chem. C 2011, 115, 9241–9249. [Google Scholar] [CrossRef]
  86. Nachimuthu, S.; He, L.; Cheng, H.-J.; Tiono, R.D.; Jiang, J.-C. A First-Principles Study on Double-Sided Decorated Boron–Nitrogen Codoped Graphene by Vanadium for Enhanced Low-Temperature Reversible Hydrogen Storage. Sustain. Energy Fuels 2021, 2159–2168. [Google Scholar] [CrossRef]
  87. Kim, G.; Jhi, S.-H.; Park, N.; Louie, S.G.; Cohen, M.L. Optimization of Metal Dispersion in Doped Graphitic Materials for Hydrogen Storage. Phys. Rev. B 2008, 78, 085408. [Google Scholar] [CrossRef] [Green Version]
  88. Kang, K.Y.; Lee, B.I.; Lee, J.S. Hydrogen Adsorption on Nitrogen-Doped Carbon Xerogels. Carbon 2009, 47, 1171–1180. [Google Scholar] [CrossRef]
  89. Chizari, K.; Janowska, I.; Houllé, M.; Florea, I.; Ersen, O.; Romero, T.; Bernhardt, P.; Ledoux, M.J.; Pham-Huu, C. Tuning of Nitrogen-Doped Carbon Nanotubes as Catalyst Support for Liquid-Phase Reaction. Appl. Catal. A Gen. 2010, 380, 72–80. [Google Scholar] [CrossRef]
  90. Aboud, M.F.A.; Alothman, Z.A.; Bagabas, A.A. Storage and Separation of Methane and Carbon Dioxide Using Platinum-Decorated Activated Carbons Treated with Ammonia. Mater. Res. Express 2021, 8, 025503. [Google Scholar] [CrossRef]
  91. Mangun, C.L.; Benak, K.R.; Economy, J.; Foster, K.L. Surface Chemistry, Pore Sizes and Adsorption Properties of Activated Carbon Fibers and Precursors Treated with Ammonia. Carbon 2001, 39, 1809–1820. [Google Scholar] [CrossRef]
  92. Chen, B.; Bao, S.; Zhang, Y.; Zheng, R. Ultrasound-Assisted Synthesis of N235-Impregnated Resins for Vanadium (V) Adsorption. R. Soc. Open Sci. 2018, 5, 171746. [Google Scholar] [CrossRef] [Green Version]
  93. Kong, J.; Sheng, X.; Zhou, Y.; Zhang, Y.; Zhou, S.; Zhang, Z. Ultrasound-Assisted Synthesis of Nanosized Hierarchical ZSM-5 and Its Catalytic Performance as the Support for Heteropolyacid. J. Porous Mater. 2014, 21, 241–249. [Google Scholar] [CrossRef]
  94. Klein, J.; Kumacheva, E. Confinement-Induced Phase Transitions in Simple Liquids. Science 1995, 269, 816–819. [Google Scholar] [CrossRef] [PubMed]
  95. Langford, J.I.; Wilson, A.J.C. Scherrer After Sixty Years: A Survey and Some New Results in the Determination of Crystallite Size. J. Appl. Crystallogr. 1978, 11, 102–113. [Google Scholar] [CrossRef]
  96. Salem, M.M.K.; Braeuer, P.; Szombathely, M.V.; Heuchel, M.; Harting, A.P.; Quitzsch, K.; Jaroniec, M. Thermodynamics of High-Pressure Adsorption of Argon, Nitrogen, and Methane on Microporous Adsorbents. Langmuir 1998, 14, 3376–3389. [Google Scholar] [CrossRef]
  97. Brandani, S.; Mangano, E.; Sarkisov, L. Net, Excess and Absolute Adsorption and Adsorption of Helium. Adsorption 2016, 22, 261–276. [Google Scholar] [CrossRef] [Green Version]
  98. Pini, R. Interpretation of Net and Excess Adsorption Isotherms in Microporous Adsorbents. Microporous Mesoporous Mater. 2014, 187, 40–52. [Google Scholar] [CrossRef]
  99. Wang, J.-T.; Chen, C.; Wang, E.; Kawazoe, Y. A New Carbon Allotrope with Six-Fold Helical Chains in all-sp2 Bonding Networks. Sci. Rep. 2015, 4, 4339. [Google Scholar] [CrossRef] [Green Version]
  100. Li, Z.; Lu, C.; Xia, Z.; Zhou, Y.; Luo, Z. X-ray Diffraction Patterns of Graphite and Turbostratic Carbon. Carbon 2007, 45, 1686–1695. [Google Scholar] [CrossRef]
  101. Stadie, N.; Purewal, J.J.; Ahn, C.C.; Fultz, B. Measurements of Hydrogen Spillover in Platinum Doped Superactivated Carbon. Langmuir 2010, 26, 15481–15485. [Google Scholar] [CrossRef] [Green Version]
  102. Thommes, M.; Kaneko, K.; Neimark, A.V.; Olivier, J.P.; Rodriguez-Reinoso, F.; Rouquerol, J.; Sing, K.S. Physisorption of gases, with Special Reference to the Evaluation of Surface Area and Pore Size Distribution (IUPAC Technical Report). Pure Appl. Chem. 2015, 87, 1051–1069. [Google Scholar] [CrossRef] [Green Version]
  103. Chilev, C.; Lamari, F.D. Hydrogen Storage at Low Temperature and High Pressure for Application in Automobile Manufacturing. Int. J. Hydrog. Energy 2016, 41, 1744–1758. [Google Scholar] [CrossRef]
  104. Chilev, C.; Lamari, F.; Kirilova, E.; Pentchev, I. Comparison of Gas Excess Adsorption Models and High Pressure Experimental Validation. Chem. Eng. Res. Des. 2012, 90, 2002–2012. [Google Scholar] [CrossRef]
  105. Chilev, C.; Weinberger, B.; Passarello, J.P.; Lamari, F.; Pentchev, I. A New Approach to Describe High-Pressure Adsorption Isotherms in Subcritical and Supercritical Conditions. AIChE J. 2009, 55, 1793–1802. [Google Scholar] [CrossRef]
  106. Do, D.; Do, H. Adsorption of Supercritical Fluids in Non-Porous and Porous Carbons: Analysis of Adsorbed Phase Volume and Density. Carbon 2003, 41, 1777–1791. [Google Scholar] [CrossRef]
  107. Broom, D.P. Hydrogen Sorption Properties of Materials. In Smart and Sustainable Planning for Cities and Regions; Springer Science and Business Media LLC: Berlín, Alemania, 2011; pp. 61–115. [Google Scholar]
  108. Zubizarreta, L.; Gomez, E.I.; Arenillas, A.; Ania, C.O.; Parra, J.B.; Pis, J.J. H2 Storage in Carbon Materials. Adsorption 2008, 14, 557–566. [Google Scholar] [CrossRef]
  109. Blanco, A.A.G.; Vallone, A.; Gil, A.; Sapag, K. A Comparative Study of Various Microporous Materials to Store Hydrogen by Physical Adsorption. Int. J. Hydrog. Energy 2012, 37, 14870–14880. [Google Scholar] [CrossRef]
  110. Ströbel, R.; Garche, J.; Moseley, P.; Jörissen, L.; Wolf, G. Hydrogen Storage by Carbon Materials. J. Power Sour. 2006, 159, 781–801. [Google Scholar] [CrossRef]
Figure 1. X-ray diffraction (XRD) pattern of the ammonia-treated AC.
Applsci 11 06604 g001
Figure 2. X-ray fluorescence spectroscopy of the ammonia-treated AC. (a) X-ray fluoresence spectroscopy of the ammonia-treated AC and (b) deconvoluted XRF spectrum.
Applsci 11 06604 g002
Figure 3. XRD patterns of (A) Pd-, (B) Ni-, (C) Rh-, (D) Ir-, and (E) Ru- decorated, ammonia-treated AC.
Applsci 11 06604 g003
Figure 4. Scanning electron micrograph of Pd-decorated, ammonia-treated AC and its corresponding EDX spectrum.
Applsci 11 06604 g004
Figure 5. Scanning electron micrograph of Ni-decorated, ammonia-treated AC and its corresponding EDX spectrum.
Applsci 11 06604 g005
Figure 6. Scanning electron micrograph of Rh-decorated, ammonia-treated AC and its corresponding EDX spectrum.
Applsci 11 06604 g006
Figure 7. Scanning electron micrograph of Ir-decorated, ammonia-treated AC and its corresponding EDX spectrum.
Applsci 11 06604 g007
Figure 8. Scanning electron micrograph of Ru-decorated, ammonia-treated AC its corresponding EDX spectrum.
Applsci 11 06604 g008
Figure 9. Adsorption average pore widths using the BET for pristine activated carbon (a) and ammonia-treated activated carbon (b), and both were decorated with Pt (c,d).
Applsci 11 06604 g009
Figure 10. Pressure–composition isotherms for AC samples before and after ammonia treatment and decorated with Pt at (a) 77 K and (b) 298 K.
Applsci 11 06604 g010
Figure 11. Pressure–composition isotherms for AC samples before and after ammonia treatment and decorated with Pd at (a) 77 K and (b) 298 K.
Applsci 11 06604 g011
Figure 12. Pressure–composition isotherms for AC samples before and after ammonia treatment and decorated with Ni at (a) 77 K and (b) 298 K.
Applsci 11 06604 g012
Figure 13. Pressure–composition isotherms for AC samples before and after ammonia treatment and decorated with Rh at (a) 77 K and (b) 298 K.
Applsci 11 06604 g013
Figure 14. Pressure–composition isotherms for AC samples before and after ammonia treatment and decorated with Ir at (a) 77 K and (b) 298 K.
Applsci 11 06604 g014
Figure 15. Pressure–composition isotherms for AC samples before and after ammonia treatment and decorated with Ru at (a) 77 K and (b) 298 K.
Applsci 11 06604 g015
Table 1. XRD crystallite size and SEM particle size.
SamplePeak Position (2θ°), and Its
Miller Index (hkl)
JCPDS Card No.Corresponding Crystallite Size, nmAve. Crystallite Size from XRD, nmAve Particle Size from SEM, nm
Pd-decorated, NH3-treated AC40.6° (111), 47.2° (200), 68.6° (220), 82.5° (311), and 86.9° (222)03-065-286759.37, 54.36, 62.57, 59.72, and 63.3759.8761
Ni-decorated, NH3-treated AC44.7° (111), 52.1° (200), 76.5° (220), 93.1° (311), and 98.5° (222)00-004-085065.96, 65.37, 74.18, 93.87, and 91.3278.1464
Rh-decorated, NH3-treated AC41.1° (111), 47.8° (200), 69.9° (220), 84.4° (311), and 89.1° (222)00-005-068568.51, 62.59, 70.07, 73.14, and 72.9969.4659
Ir-decorated, NH3-treated AC40.8° (111), 47.4° (200), 69.2° (220), 83.5° (311), and 88.2° (222)03-065-168658.16, 58.52, 70.94, 81.60, and 67.5267.3563
Ru-decorated, NH3-treated AC38.5° (100), 42.2° (002), 44.1° (101), 58.3° (101), 69.4° (110), 78.4° (103), 84.5° (112), 85.99° (201), 91.98° (004), and 96.94° (202)01-089-394237.87, 33.33, 38.24, 45.51, 51.16, 43.43, 22.33, and 33.3038.1435
Table 2. The excess hydrogen storage capacities values at both ~7 bar & 77 K and ~100 bar & 298 K.
SampleHydrogen (H2) Excess Capacity (wt.%)
~7 bar & 77 KIncremental wt.% after Ammonia Treatment at
77 k
Incremental wt.% after Metal Decoration at 298 K~100 bar & 298 KIncremental wt.% after Ammonia Treatment at 298 K
AC2.5 ± 0.1~4 0.21 ± 0.01~57
Ammonia-treated AC2.6 ± 0.10.33 ± 0.01
Pt-decorated AC2.3 ± 0.1~4~240.26 ± 0.01~42
Pt-decorated, ammonia-treated AC2.4 ± 0.1~120.37 ± 0.01
Pd-decorated AC2.5 ± 0.1~4~950.41 ± 0.01~20
Pd-decorated, ammonia-treated AC2.6 ± 0.1~480.49 ± 0.01
Ni-decorated AC2.4 ± 0.1~4~860.39 ± 0.01~10
Ni-decorated, ammonia-treated AC2.5 ± 0.1~300.43 ± 0.01
Rh-decorated AC2.3 ± 0.1~4~710.36 ± 0.01~11
Rh-decorated, ammonia-treated AC2.4 ± 0.1~210.40 ± 0.01
Ir-decorated AC2.3 ± 0.1~4~1050.43 ± 0.01~12
Ir-decorated, ammonia-treated AC2.4 ± 0.1~450.48 ± 0.01
Ru-decorated AC2.3 ± 0.1~4~860.39 ± 0.01~8
Ru-decorated, ammonia-treated AC2.4 ± 0.1~270.42 ± 0.01
Publisher’s Note: MDPI stays neutral with regard to jurisdictional claims in published maps and institutional affiliations.

