
Impacts of Space Restriction on the Microstructure of Calcium Silicate Hydrate
by
 , ,
, ,
Yue Zhou
1,2 ,
,
Zhongping Wang
1,2,
Zheyu Zhu
1,2,
Yuting Chen
1,2,
Linglin Xu
1,2,* and
Kai Wu
1,2 1
School of Materials Science and Engineering, Tongji University, 4800 Cao’an Road, Shanghai 201804, China
2
Key Laboratory of Advanced Civil Engineering Materials, Tongji University, Ministry of Education, 4800 Cao’an Road, Shanghai 201804, China
*
Author to whom correspondence should be addressed.
Materials 2021, 14(13), 3645; https://doi.org/10.3390/ma14133645
Submission received: 24 May 2021
/
Revised: 26 June 2021
/
Accepted: 27 June 2021
/
Published: 30 June 2021
(This article belongs to the Special Issue Corrosion, Properties and Characterization in Concrete)
Abstract
:The effect of hydration space on cement hydration is essential. After a few days, space restriction affects the hydration kinetics which dominate the expansion, shrinkage and creep of cement materials. The influence of space restriction on the hydration products of tricalcium silicate was studied in this paper. The microstructure, morphology and composition of calcium silicate hydrate (C-S-H) were explored from the perspective of a specific single micropore. A combination of Raman spectra, Fourier transform infrared spectra, scanning electron microscopy and energy dispersive X-ray spectroscopy were employed. The results show that space restriction affects the structure of the hydration products. The C-S-H formed in the micropores was mainly composed of Q3 silicate tetrahedra with a high degree of polymerization. The C-S-H formed under standard conditions with a water to cement ratio of 0.5 mostly existed as Q2 units. Space restriction during hydration is conducive to the formation of C-S-H with silica tetrahedra of a high polymerization degree, while the amount of water filling the micropore plays no obvious role on the polymeric structure of C-S-H during hydration.
1. Introduction
As the dominating hydration product of Portland cement, calcium silicate hydrate (C-S-H) plays a key role in the performance of cementitious materials. C-S-H grows when the cement is mixed with water [1], and this hydration continues until the water is exhausted [2]. Its structure varies with factors during hydration, especially the water to binder ratio [3,4], temperature [5,6,7,8] and curing age [6,9]. The growth of C-S-H involves the competition between water and hydration space, which are also essential to the microstructure evolution. The importance of water to the structure of C-S-H is prominent, and the role of space on the structure of C-S-H has been paid more and more attention, especially for those studies on the kinetics and mechanisms of cement hydration.
As the main constituent of Portland cement, the hydration of alite (C3S) is essential and it can be divided into three periods [2,10]. Initially, C3S massively dissolves and amorphous nanoglobular C-S-H mainly forms in this period (Period I) [11]. There is sufficient space at this stage. Then the hydration switches to the main hydration period (Period II). The C-S-H explosively grows and the hydration rate experiences a stage of acceleration to deceleration [2]. The initial space is continuously filled with hydration products. Initially, C-S-H grows rapidly to a certain length on the cement grains as needle morphology [12]. When it has covered most of the grain surface, this stage is related to the deceleration stage [12]. Then the hydration comes to period III, the later stages [13]. The C-S-H around the grain surface forms a shell which controls the inner space and available water outside. The growth of inner C-S-H is accompanied by a lack of space and water. Meanwhile, the outer C-S-H further fill the space at this stage [14]. The space filling hypothesis is suggested to dominate the later hydration mechanism [2]. The C-S-H which forms in the later stage grows in a diminishing, restricted space. In general, those unhydrated phases undergo a state transition from sufficiency to a restriction of space.
The growth of C-S-H and available space are inseparable. Recent research has proposed that the initial space occupied by water is the space where the C-S-H can grow [2]. The 1H nuclear magnetic resonance is used to divide the “water space” in the cement paste into three types: interlayer water between C-S-H layers, gel pores and capillary pores [15,16]. The growth of hydrates in the capillary space is related to the expansion of the hardened cement matrix, due to crystallization pressure [10,17]. The crystals grown in the pores and also the pore walls generate stress to prevent crystal growth. Eventually, the crystals exert pressure on the surrounding solid phase [17]. The pore space affects the shrinkage and creep of the cement paste at the late hydration stage [18,19]. Thus space is considered a key factor for the construction of the C-S-H microstructure model. The classical C-S-H model proposed by Jennings describes two types of C-S-H: low-density C-S-H (LD C-S-H) and high-density C-S-H (HD C-S-H) [20,21]. LD C-S-H forms in the early hydration stage when there is enough capillary space to accommodate C-S-H [22]. With the proceeding of hydration, the continuous filling by hydration products leads to more restriction in the space, which drives LD C-S-H to HD C-S-H [22,23]. This finding indicates that the space limitation is firmly related to the diversity of C-S-H. Nanoindentation results show that HD C-S-H exhibits higher stiffness [24]. The difference in performance actually reflects the change in the microstructure of C-S-H.
The microstructure of C-S-H is commonly expressed by the polymerization degree of silicate tetrahedra. The Qn classification is used to represent the Si-environments in silicate tetrahedra with different polymerization degrees, where n stands for the number of oxygen atoms shared between the tetrahedra and its adjacent tetrahedra [25,26]. Studies show that the silicate tetrahedra of C-S-H in cement are mainly dimers (Q1 Si sites), with few trimer (Q2 Si sites) [27,28,29]. The silicate tetrahedra in tobermorite and jennite, which are used as reference when constructing the C-S-H model, with repeating structure of “dreierkette” and the ratio of Q2 and Q3 units are much higher than those of Q1 units [27,28]. Studies indicate that the polymerization degree of C-S-H increases with curing age [6,30,31], while the available space decreases over time, simultaneously. There are many mysteries between the formation of highly polymerized units and space restriction.
During the entire hydration, the “water space” is gradually filled by the growing hydrates and undergoes a process from micrometer to nanometer scale. Therefore, the influence of the space restriction on the structure of C-S-H is explored from the perspective of a single micropore in this paper.
2. Materials and Methods
2.1. Sample Preparation
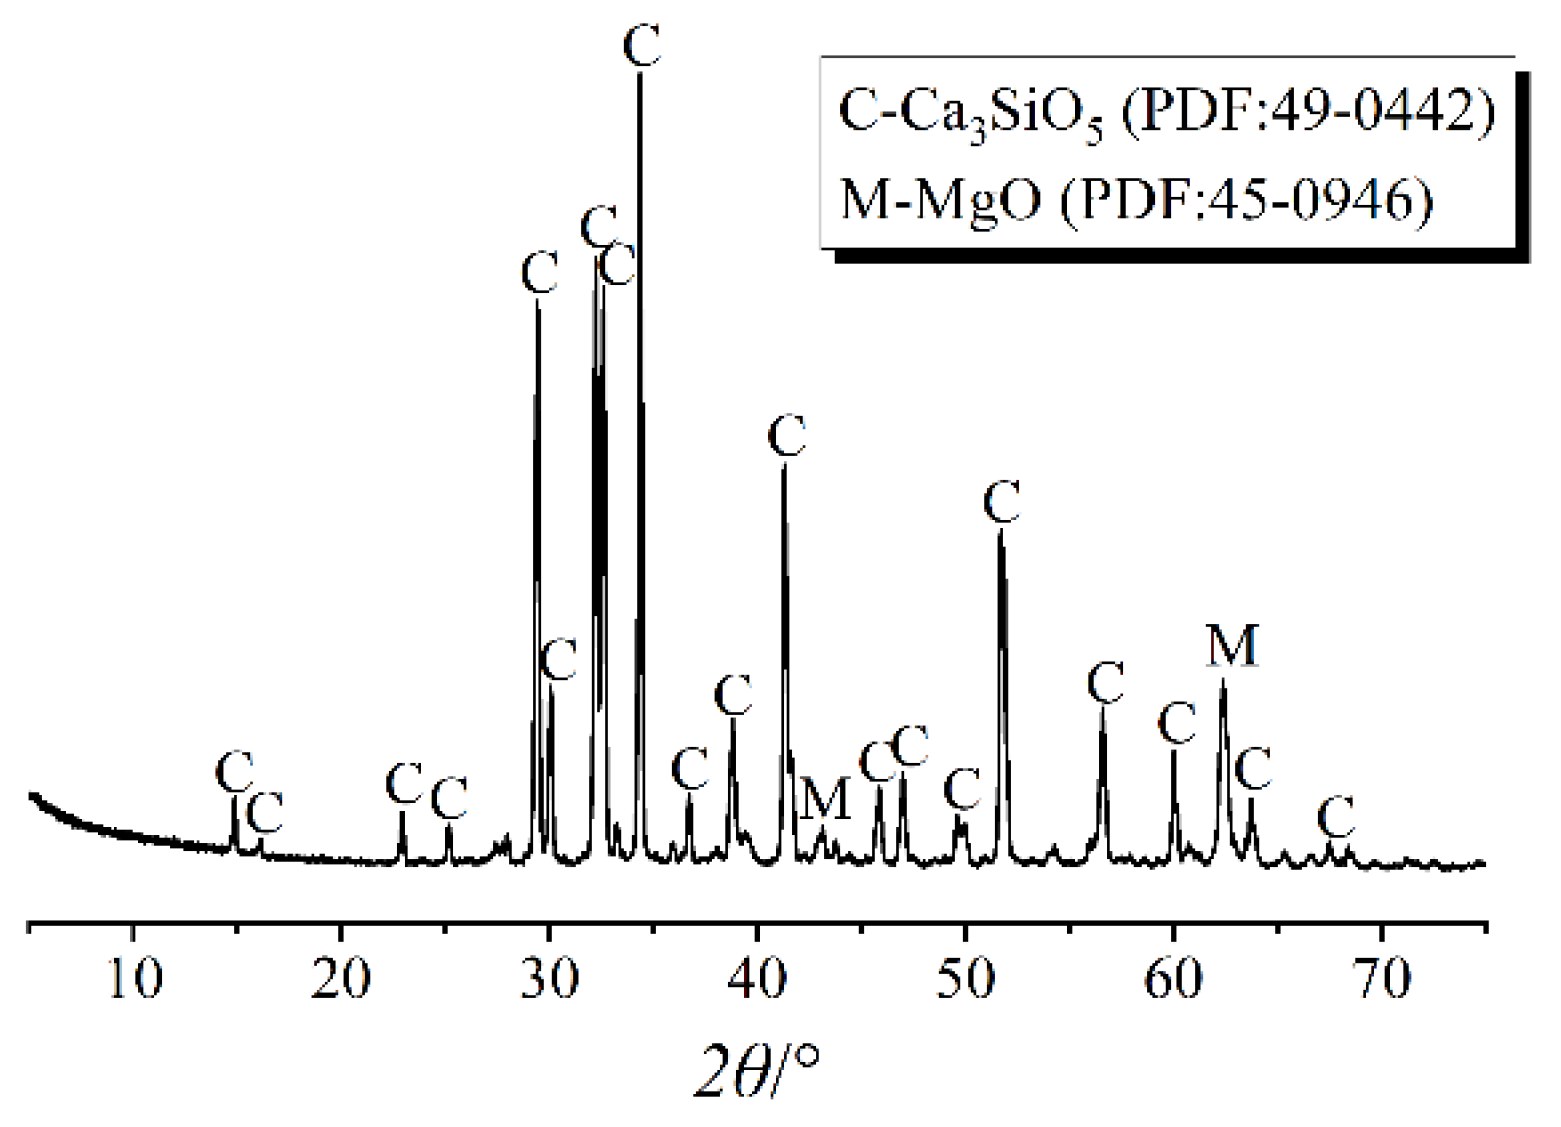
The pure M3 tricalcium silicate (C3S) was prepared by calcination. Magnesium was used to stabilize C3S with polymorph M3. The amount of chemically pure calcium oxide (CaO) and silicon dioxide (SiO2) with a molar ratio of 3.0 was accurately weighed, and MgO was added in an amount of 2% of the total mass. The raw materials were uniformly mixed and put into a platinum crucible. Then the crucible was put into the furnace and calcinated at 1400 °C for 4 h. After that, the sample was cooled to room temperature and ground into powder. To obtain the pure M3 polymorph C3S, this treatment was repeated 3 times. The phase composition was analyzed by XRD (Rigaku International Corporation, Akishima, Tokyo, Japan) and the pattern is shown in Figure 1.
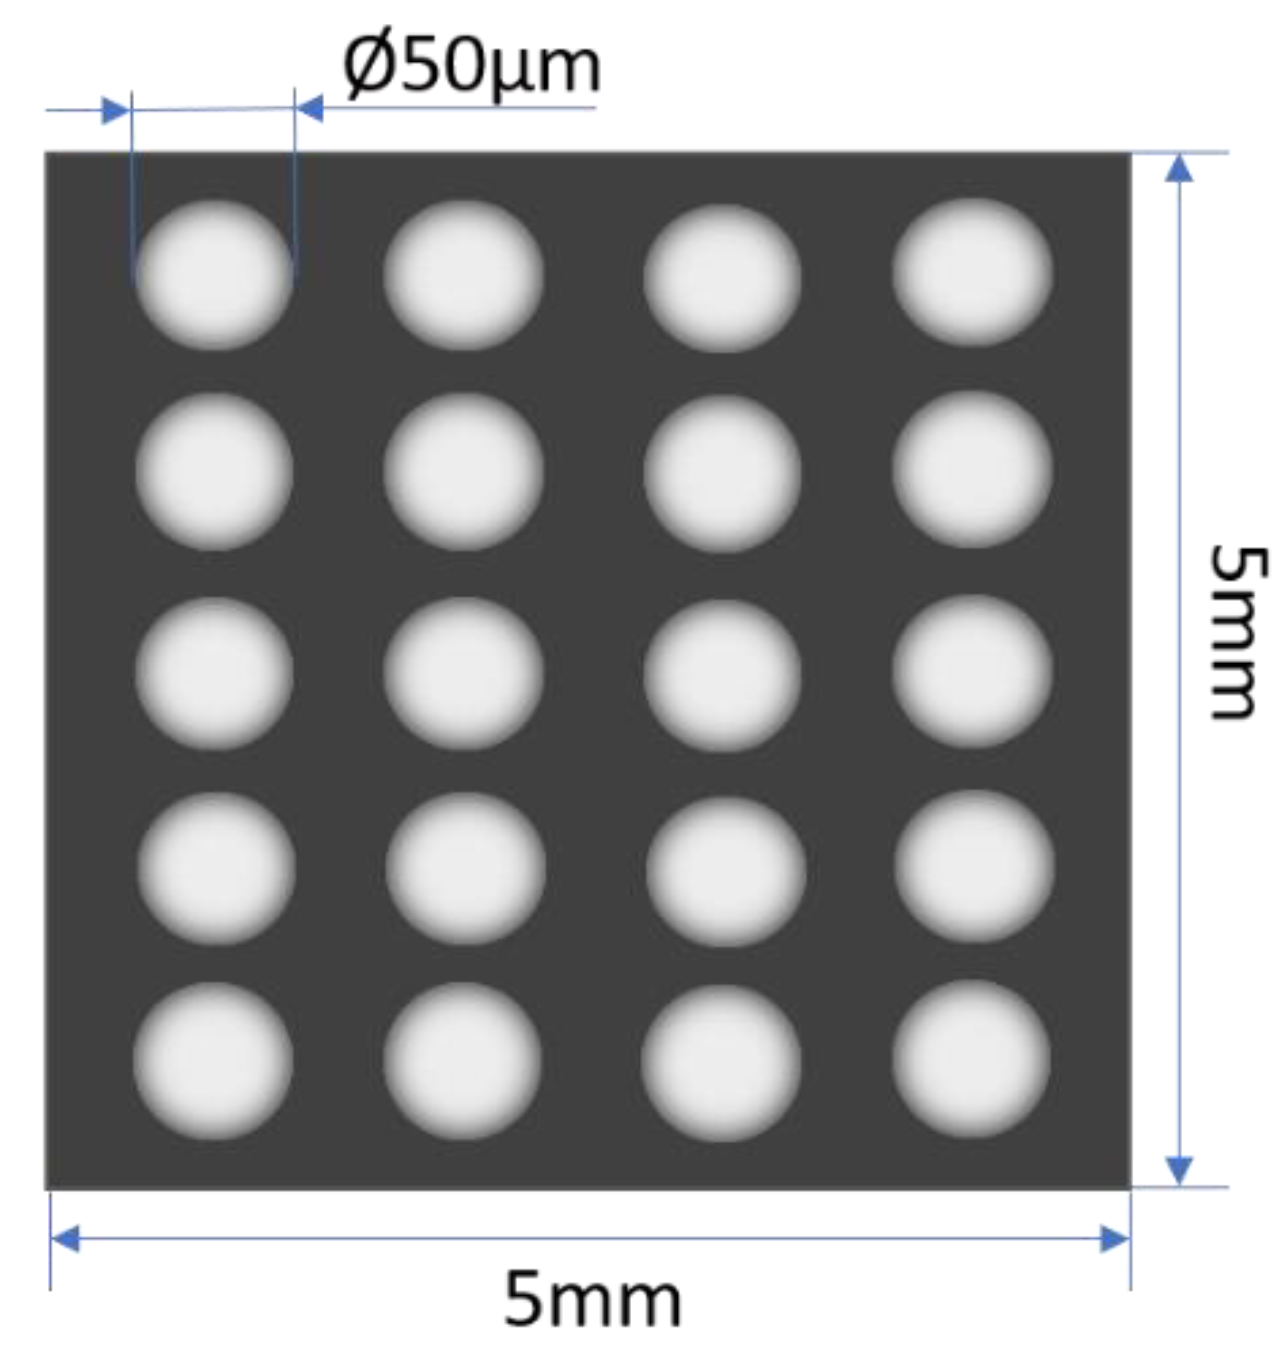
The experiment was based on a stainless steel sheet customized by Shanghai Guangyan Laser Technology Co. (Room 896, No.235 Changyang Road, Hongkou District, Shanghai, China), Ltd. (the size was 5 mm × 5 mm, and the thickness was 100 μm). A 4 × 5 pore array was made on the sheet by a 50 w optical fiber marking machine, as shown in Figure 2. The diameter of the pores was 10 ± 5 μm, and these pores did not penetrate the sheet.
C3S particles were placed in micropores (Shanghai Guangyan Laser Technology Co, Shanghai, China) of the sheet with a tweezer under a microscope. These samples were treated by two methods. On the one hand, the sheet was covered by a drop of deionized water and was placed at 20 °C and 65% relative humidity (RH) for 24 h (hereafter called water condition). On the other hand, the sheet was placed in the curing room at 20 °C and 65% RH for 24 h without further addition of water (hereafter called 65% RH condition). Meanwhile, C3S was mixed with deionized water at a water to cement ratio of 0.5 and hydrated for 24 h under the same curing conditions, as the control. The hydration was terminated via the freeze-vacuum drying for 48 h.
2.2. Analytical Methods
Raman spectra were collected by the LabRAM HR Evolution Raman Spectrometer (HORIBA Jobin Yvon, Paris, France) from HORIBA Jobin Yvon, France. A solid-state laser with a wavelength of 532 nm was used as the light source and the acquisition time was 10 s. The spectra were obtained with a 100× magnification. A micro area in a single pore of the sheet was selected for testing. Five pores were randomly selected for testing.
Fourier transform infrared spectra (FT-IR) were recorded using the EQUINOX 55 Fourier transform infrared spectrometer (Bruker, Karlsruhe, Baden-Württemberg, Germany) from Bruker and the MIRacle ATR measurement accessory (PIKE Technologies, Madison, WI, USA) from PIKE Technologies, USA. The ATR sample cell was made of ZnSe crystal. The sheet was placed in the sample cell and all pores were tested simultaneously. Each spectrum was acquired with 128 scans and at a resolution of 4 cm−1.
The morphology of samples was obtained by the Gemini Sigma 300/VP scanning electron microscope (SEM) (Carl Zeiss, Oberkochen, Baden-Württemberg, Germany) from Carl Zeiss, Germany. The images were acquired employing an acceleration voltage of 30 kV under high vacuum conditions. The elemental analysis was collected by the X-MaxN spectrometer (Oxford Instruments, Abingdon, Oxfordshire, UK) of Oxford Instruments (EDS) and combined with Aztec software (Version 3.2, Oxford Instruments, Abingdon, Oxfordshire, UK).
3. Results
3.1. Raman
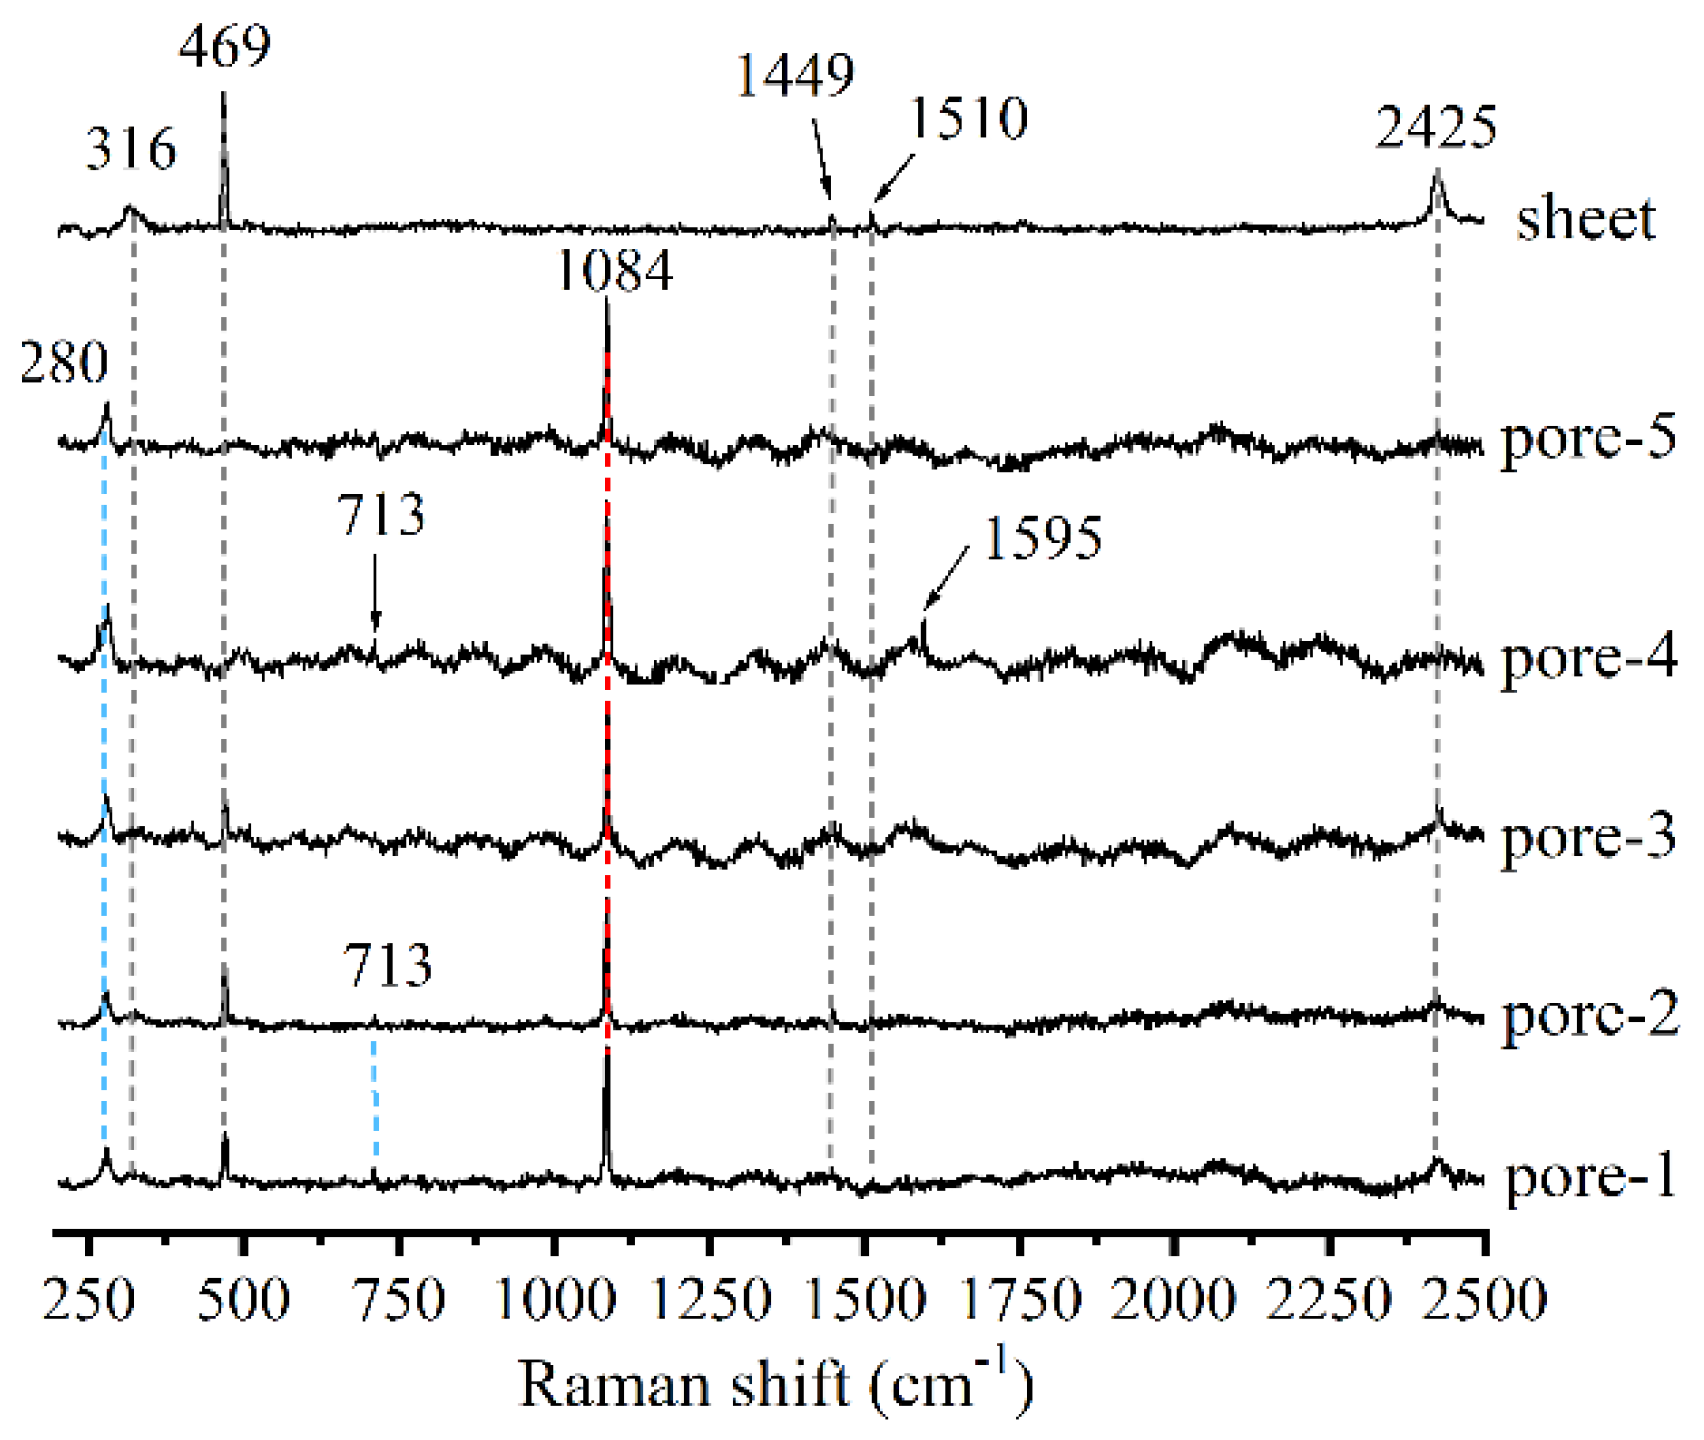
Figure 3 shows the Raman spectra of the hydration products in different pores which were treated by the water conditions. Besides those shifts at 316, 469, 1449, 1510 and 2425 cm−1 from the sheet, there was a strong and sharp peak at 1084 cm−1 in all pores. This peak may be assigned to the symmetrical stretching of Q3 silicate tetrahedra, or the symmetric stretching of the C-O group in CaCO3 [27,32]. The shift at 280 cm−1 corresponded to the lattice vibration of the CaCO3 [33]. The ν4 in-plane bending mode of CaCO3 was observed at 712 cm−1 in some pores [34]. The shift at 1595 cm−1 was also attributed to CaCO3 [35].
By contrast, with 65% RH (Figure 4), the 828 and 894 cm−1 peaks were the characteristic of Raman shifts of C3S [36,37]. Apart from the signals of unhydrated C3S and the sheet, the 1084 cm−1 peak was prominent which was consistent with the results of Figure 3. The broad band at 551 cm−1 was due to Si-O-Si stretching modes in Q3 silicate tetrahedra [32]. The peak at 519 cm−1 resulted from the O-Si-O bending mode in the C-S-H [27,36].
Figure 5 is the Raman spectra of the control. Except for the peaks of unhydrated C3S (829 and 890 cm−1), the broad shoulder signal near 513 and 558 cm−1 were speculated to belong to the antisymmetric bending vibration of O-Si-O in unhydrated C3S [37,38]. The peak at 668 cm−1 was characteristic of Si-O-Si symmetrical bending vibration in Q2 silicate chains of C-S-H. The broad and strong peak at 1114 cm−1 was assigned to the hydroxylated species (Si-OH), which was due to the decrease in the proton numbers which bridged on Si-O of Q2 silicate tetrahedra [32,38]. The shift at 355 cm−1 was the characteristic band of Ca(OH)2 [37,38]. The signals around 1504 and 2234 cm−1 also belonged to Ca(OH)2 [39].
3.2. FT-IR
Figure 6 presents the FT-IR spectra of hydration products in the pores of the sheets. There were some characteristic peaks of unhydrated C3S in the hydrates of the 65% RH condition and the control. For instance, the 873 cm−1 band with shoulder bands at 921 and 835 cm−1 were related to the asymmetric stretching vibrations of Si-O bonds in unhydrated C3S [40,41]. Besides some peaks at 821, 873 and 920 cm−1, the absorption at 522 cm−1 was also attributed to unhydrated C3S [40]. In addition, the proximity signal at 804 cm−1 in the curve of water condition was due to Si-O-Si symmetric stretching of SiO2 [42,43].
The hydration results of water condition were similar with those of 65% RH condition. The absorption bands centered at 624 and 628 cm−1 of the two sheets were attributed to Si-O-Si bending vibration in depolymerized structure [44,45]. The broad absorption bands at 1107 cm−1 and 1103 cm−1 were both Si-O stretching vibrations in Q3 silicate tetrahedra [40,41,46]. However, the 968 cm−1 band observed in the control was the characteristic of Si-O stretching vibrations in Q2 units of C-S-H gel [40,46].
The peaks related to Ca(OH)2 and its carbonized products were found in all curves. The absorption at 871 cm−1 was the characteristic vibration mode of carbonate [41,46]. The bands at 1411, 1417 and 1483 cm−1 observed were characteristic of O-C=O symmetric stretching vibrations [47]. The peak at 1730 cm−1 was assigned to the C=O stretching vibrations which were related to the carbonation of Ca(OH)2 [45,48] In addition, The O-H bending vibration signals of water molecules were observed at 1643 cm−1 [46,49].
3.3. SEM/EDS
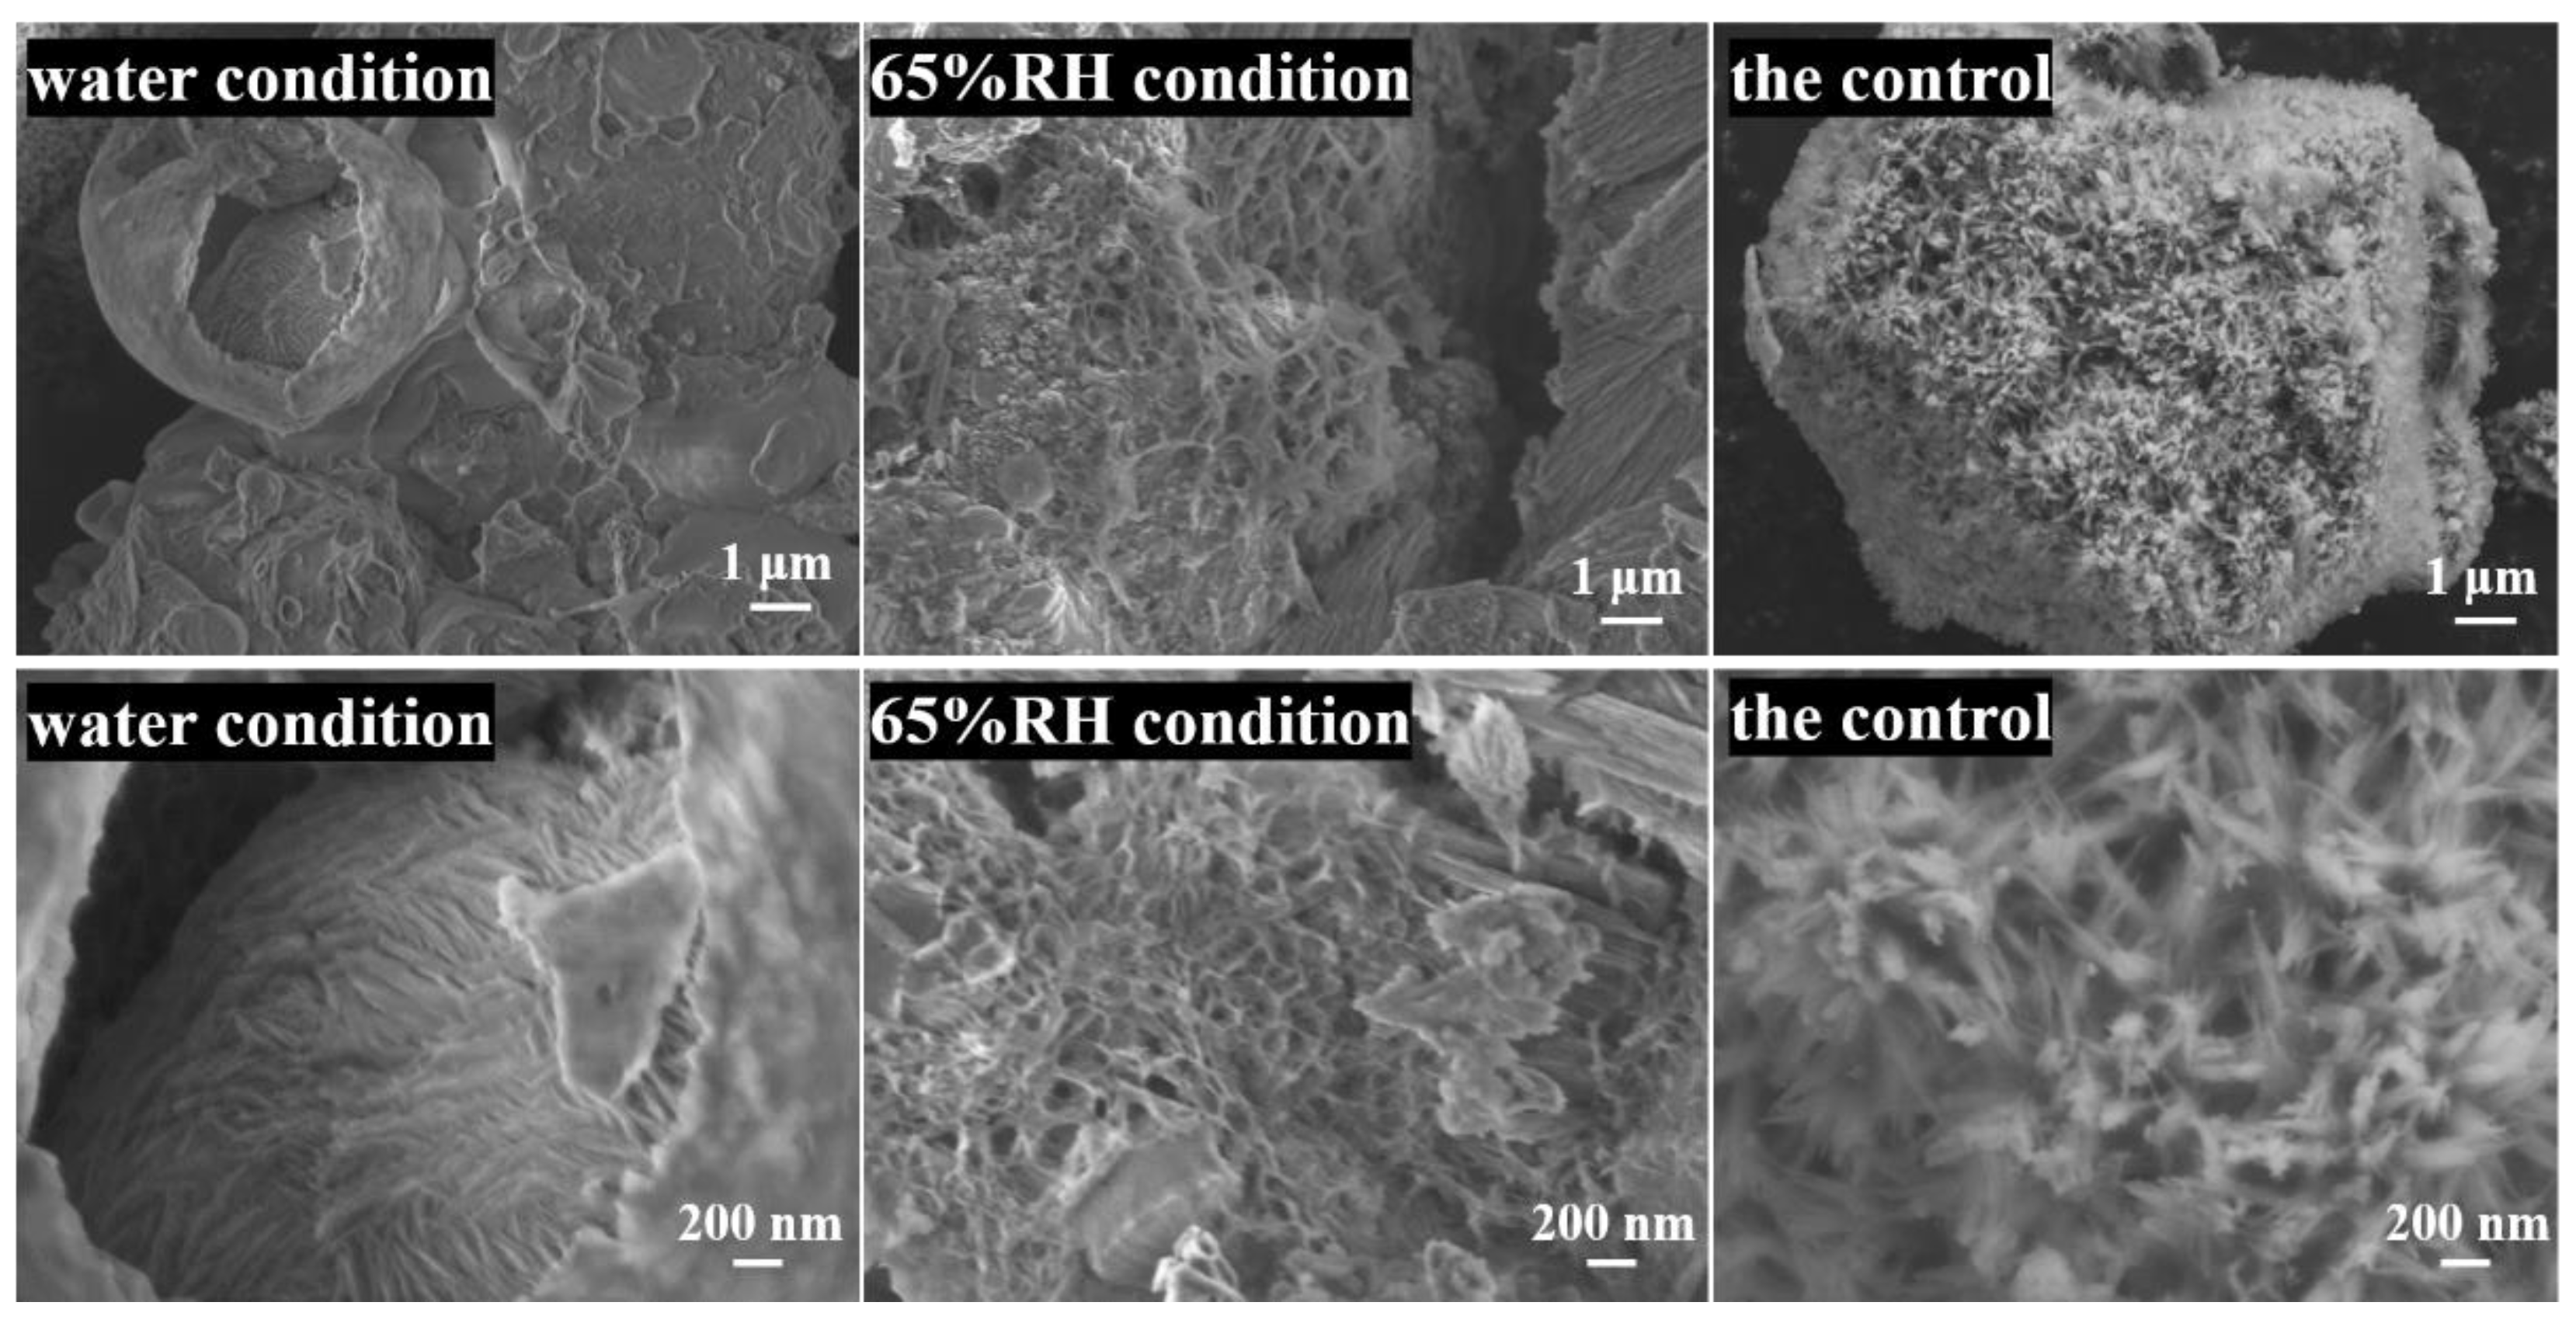
Figure 7 exhibits the SEM images of hydration products under different conditions. It can be seen that the hydration conditions played a prominent role on the morphology of the hydrates. The hydration products in the pore which was treated by the water condition were flake-like, while those treated by the 65% RH condition were honeycomb-like. The morphology of hydration products of the control exhibited interlaced fibers.
The elements in the representative areas in Figure 7 were scanned by EDS and shown in Table 1. Besides the Ti contained in the sheet, the composition of different samples was similar, with calcium and oxygen in the majority. The calcium to silicon ratio (Ca/Si) of the hydration products hydrated by water condition was the highest, followed by that under normal conditions and treated by 65% RH condition.
4. Discussion
The Raman shifts, FT-IR bands and their distributions observed in the hydration products are summarized in Table 2 and Table 3, respectively.
Combining the results of Raman and FT-IR spectra, it was clear that the hydration products exhibited a high degree of polymerization dominated by Q3 silicates for the hydration products in pores. By comparing the hydrates under the water condition and 65% RH condition, the amount of water filling the micropore played no obvious role on the polymeric structure. The difference was that there was still unhydrated C3S in the sample which was placed at the 65% RH condition.
SEM and EDS showed the morphology and their Ca/Si ratio of the hydration products in pores. A lower Ca/Si ratio was observed in the sample of the 65% RH condition than in that of the control. This is consistent with previous studies [50,51], which propose that the higher the polymerization degree, the lower the Ca/Si ratio. However, the hydrates under the water condition showed an unexpectedly higher Ca/Si ratio above 2. It lay in the fact that the C-S-H in this region was surrounded by Ca(OH)2 [52]. It can be confirmed that the oxygen content of products with water condition was higher than those at the 65% RH condition in those testing areas. The flake-like hydration products in this region were similar to Ca(OH)2 [53]. Although the results about the Ca/Si ratio of the products were inconsistent, it is certain that C-S-H gel formed in these micropores. The combinations of the Raman spectra, FT-IR spectra and SEM-EDS results demonstrated that the C-S-H grown in micropores had a high degree of polymerization.
The results of Raman and FT-IR spectra indicated that the C-S-H structure in control obviously grew as Q2 silicate tetrahedra. This finding has been confirmed by many scholars [38,40,54,55]. However, the hydration products in the pores showed a higher degree of polymerization (Q3), and there was almost no characteristic peak of Q2 unit. This finding indicates that space restriction affects the structure of the hydration products and the cement which hydrated in the space restriction of micropores tended to form C-S-H with silica tetrahedra of high polymerization degree.
Recently, the space filling hypothesis was opposed by Zajac et al. [56]. They proposed that the slow hydration in the later stage was not due to the effect of restricted space on the further growth of C-S-H, but caused by the slow transport of dissolved ions through the hydrates layer from the dissolution point to the precipitation point [56], and the slow diffusion had an impact on the evolution of the microstructures, such as the fine structure of the inner C-S-H [56]. In this paper, the characterization of the surface hydrates by means of Raman, FT-IR spectra and SEM-EDS indicated that space restriction actually changed the structure of the external hydrates. The influence of space restriction on the growth of C-S-H cannot be ignored, but the relationship between the structure change and the slow diffusion of dissolved ions needs to be further explored. At present, no theory can exclusively dominate the later hydration mechanism. The later stage kinetics is considered to be a combination of multiple mechanisms, such as diffusion mechanism, C-S-H densification and space filling hypothesis [2,13], which requires more research in the future.
5. Conclusions
This paper studied the microstructure of C3S hydrates in the restricted space of micropores in a sheet, by means of Raman, FT-IR spectra and SEM-EDS. Results indicate that space restriction affected the structure of the hydration products, and that the microstructure of the C-S-H which formed in the micropores was mainly composed of Q3 silicate tetrahedra with a high degree of polymerization. The amount of water filled in the micropore only affected the hydration degree, rather than the polymeric structure. The C-S-H which formed under conventional conditions mostly existed as a Q2 unit. The space restriction of cement hydration is conducive to the formation of C-S-H with silicate tetrahedra of a high polymerization degree.
Author Contributions
Conceptualization, Y.Z., Z.W., L.X. and K.W.; methodology, Y.Z., Z.Z. and L.X.; investigation, Y.Z., Z.Z. and Y.C.; writing—original draft preparation, Y.Z.; writing—review and editing, Y.Z., Z.Z., Y.C. and L.X. All authors have read and agreed to the published version of the manuscript.
Funding
This research was funded by the fund of National Natural Science Fund of China (No. 51772212), the fund of National Natural Science Fund of China (No. 51978505) and Shanghai Rising Star Program (No. 20QC1400600).
Institutional Review Board Statement
Not applicable.
Informed Consent Statement
Not applicable.
Data Availability Statement
The data presented in this study are available on request from the corresponding author.
Acknowledgments
The authors acknowledge greatly the financial support from the fund of National Natural Science Fund of China (51772212), the fund of National Natural Science Fund of China (51978505) and Shanghai Rising Star Program (20QC1400600). Additionally, thanks are extended to the anonymous reviewers whose suggestions improved this manuscript.
Conflicts of Interest
The authors declare no conflict of interest.
References
- Allen, A.J.; Thomas, J.J.; Jennings, H.M. Composition and density of nanoscale calcium-silicate-hydrate in cement. Nat. Mater. 2007, 6, 311–316. [Google Scholar] [CrossRef] [PubMed]
- Scrivener, K.; Ouzia, A.; Juilland, P.; Mohamed, A.K. Advances in understanding cement hydration mechanisms. Cem. Concr. Res. 2019, 124, 105823. [Google Scholar] [CrossRef]
- Sato, M.; Umemura, Y.; Koizumi, K. Effect of water-binder ratio on silicate structure and hydration of silicafume cement. Cem. Sci. Concr. Technol. 2011, 65, 456–463. [Google Scholar] [CrossRef] [Green Version]
- Tanaka, Y.; Saeki, T.; Sasaki, K.; Suda, Y. Fundamental study on density of C-S-H. Cem. Sci. Concr. Technol. 2009, 63, 70–76. [Google Scholar] [CrossRef] [Green Version]
- Gallucci, E.; Zhang, X.; Scrivener, K.L. Effect of temperature on the microstructure of calcium silicate hydrate (C-S-H). Cem. Concr. Res. 2013, 53, 185–195. [Google Scholar] [CrossRef]
- Okada, Y.; Ishida, H.; Sasaki, K.; Young, J.; Mitsuda, T. Characterization of C-S-H from highly reactive β-dicalcium silicate prepared from hillebrandite. J. Am. Ceram. Soc. 1994, 77, 1313–1318. [Google Scholar] [CrossRef]
- Martínez-Ramírez, S.; Frías, M. The effect of curing temperature on white cement hydration. Constr. Build. Mater. 2009, 23, 1344–1348. [Google Scholar] [CrossRef] [Green Version]
- Xu, L.; Tang, C.; Li, H.; Wu, K.; Zhang, Y.; Yang, Z. Hydration characteristics assessment of a binary calcium sulfoaluminate-anhydrite cement related with environment temperature. J. Therm. Anal. Calorim. 2021. [Google Scholar] [CrossRef]
- Narattha, C.; Chaipanich, A. Effect of curing time on the hydration and material properties of cold-bonded high-calcium fly ash–Portland cement lightweight aggregate. J. Therm. Anal. Calorim. 2020. [Google Scholar] [CrossRef]
- Wu, K.; Han, H.; Xu, L.; Gao, Y.; Yang, Z.; Jiang, Z.; De Schutter, G. The improvement of freezing–thawing resistance of concrete by cellulose/polyvinyl alcohol hydrogel. Constr. Build. Mater. 2021, 291, 123274. [Google Scholar] [CrossRef]
- Schönlein, M.; Plank, J. A TEM study on the very early crystallization of C-S-H in the presence of polycarboxylate superplasticizers: Transformation from initial C-S-H globules to nanofoils. Cem. Concr. Res. 2018, 106, 33–39. [Google Scholar] [CrossRef]
- Bazzoni, A. Study of Early Hydration Mechanisms of Cement by Means of Electron Microscopy. Ph.D. Thesis, École Polytechnique Fédérale de Lausanne, Lausanne, Switzerland, 2014. [Google Scholar]
- Ouzia, A.R.C.W.C. Modeling the Kinetics of the Main Peak and Later Age of Alite Hydration. Ph.D. Thesis, École Polytechnique Fédérale de Lausanne, Lausanne, Switzerland, 2019. [Google Scholar]
- Bullard, J.W.; Jennings, H.M.; Livingston, R.A.; Nonat, A.; Scherer, G.W.; Schweitzer, J.S.; Scrivener, K.L.; Thomas, J.J. Mechanisms of cement hydration. Cem. Concr. Res. 2011, 41, 1208–1223. [Google Scholar] [CrossRef]
- Berodier, E.; Scrivener, K. Evolution of pore structure in blended systems. Cem. Concr. Res. 2015, 73, 25–35. [Google Scholar] [CrossRef] [Green Version]
- Xu, L.; Ou, Y.; Hecker, A.; Rößler, C.; Ludwig, H.M.; Yang, Z.; Wu, K. State of water in calcium sulfoaluminate cement paste modified by hydroxyethyl methyl cellulose ether. J. Build. Eng. 2021, 102894. [Google Scholar] [CrossRef]
- Scherer, G.W. Stress from crystallization of salt. Cem. Concr. Res. 2004, 34, 1613–1624. [Google Scholar] [CrossRef]
- Wenzel, O.; Schwotzer, M.; Müller, E.; Chakravadhanula, V.S.K.; Scherer, T.; Gerdes, A. Investigating the pore structure of the calcium silicate hydrate phase. Mater. Charact. 2017, 133, 133–137. [Google Scholar] [CrossRef]
- Li, H.; Xue, Z.; Liang, G.; Wu, K.; Dong, B.; Wang, W. Effect of C-S-Hs-PCE and sodium sulfate on the hydration kinetics and mechanical properties of cement paste. Constr. Build. Mater. 2021, 266, 121096. [Google Scholar] [CrossRef]
- Jennings, H.M. A model for the microstructure of calcium silicate hydrate in cement paste. Cem. Concr. Res. 2000, 30, 101–116. [Google Scholar] [CrossRef]
- Jennings, H.M. Refinements to colloid model of C-S-H in cement: CM-II. Cem. Concr. Res. 2008, 38, 275–289. [Google Scholar] [CrossRef]
- S˘milauer, V.; Bittnar, Z.k. Microstructure-based micromechanical prediction of elastic properties in hydrating cement paste. Cem. Concr. Res. 2006, 36, 1708–1718. [Google Scholar] [CrossRef]
- Königsberger, M.; Hellmich, C.; Pichler, B. Densification of C-S-H is mainly driven by available precipitation space, as quantified through an analytical cement hydration model based on NMR data. Cem. Concr. Res. 2016, 88, 170–183. [Google Scholar] [CrossRef]
- Constantinides, G.; Ulm, F.-J. The effect of two types of C-S-H on the elasticity of cement-based materials: Results from nanoindentation and micromechanical modeling. Cem. Concr. Res. 2004, 34, 67–80. [Google Scholar] [CrossRef]
- Farhadi, N.; Peyvandi, A.; Holmes, D.; Soroushian, P.; Balachandra, A.M. Effects of Graphite Nanoplatelets on the Structure of Cementitious Materials. Iran. J. Sci. Technol. Trans. Civ. Eng. 2019, 43, 403–411. [Google Scholar] [CrossRef]
- Richardson, I.G. The nature of the hydration products in hardened cement pastes. Cem. Concr. Compos. 2000, 22, 97–113. [Google Scholar] [CrossRef]
- Kirkpatrick, R.J.; Yarger, J.L.; McMillan, P.F.; Ping, Y.; Cong, X. Raman spectroscopy of C-S-H, tobermorite, and jennite. Adv. Cem. Based Mater. 1997, 5, 93–99. [Google Scholar] [CrossRef]
- Cong, X.; Kirkpatrick, R.J. 29Si MAS NMR study of the structure of calcium silicate hydrate. Adv. Cem. Based Mater. 1996, 3, 144–156. [Google Scholar] [CrossRef]
- Rodriguez, E.T.; Richardson, I.G.; Black, L.; Boehm-Courjault, E.; Nonat, A.; Skibsted, J. Composition, silicate anion structure and morphology of calcium silicate hydrates (C-S-H) synthesised by silica-lime reaction and by controlled hydration of tricalcium silicate (C3S). Adv. Appl. Ceram. 2015, 114, 362–371. [Google Scholar] [CrossRef] [Green Version]
- Thomas, J.J.; Jennings, H.M. A colloidal interpretation of chemical aging of the C-S-H gel and its effects on the properties of cement paste. Cem. Concr. Res. 2006, 36, 30–38. [Google Scholar] [CrossRef]
- Jennings, H.M. Colloid model of C−S−H and implications to the problem of creep and shrinkage. Mater. Struct. 2004, 37, 59–70. [Google Scholar] [CrossRef]
- Ortaboy, S.; Li, J.; Geng, G.; Myers, R.J.; Monteiro, P.J.M.; Maboudian, R.; Carraro, C. Effects of CO2 and temperature on the structure and chemistry of C–(A–)S–H investigated by Raman spectroscopy. RSC Adv. 2017, 7, 48925–48933. [Google Scholar] [CrossRef] [Green Version]
- Potgieter-Vermaak, S.S.; Potgieter, J.H.; Belleil, M.; Deweerdt, F.; Grieken, R.V. The application of Raman spectrometry to the investigation of cement: Part II: A micro-Raman study of OPC, slag and fly ash. Cem. Concr. Res. 2006, 36, 663–670. [Google Scholar] [CrossRef]
- Bai, Y.; Guo, X.-j.; Li, Y.-z.; Huang, T. Experimental and visual research on the microbial induced carbonate precipitation by Pseudomonas aeruginosa. Amb Express 2017, 7, 57. [Google Scholar] [CrossRef] [Green Version]
- Podborodnikov, I.; Shatskiy, A.; Arefiev, A.; Rashchenko, S.; Chanyshev, A.; Litasov, K. The system Na2CO3–CaCO3 at 3 GPa. Phys. Chem. Miner. 2018, 45, 773–787. [Google Scholar] [CrossRef]
- Liu, F.; Sun, Z.; Qi, C. Raman spectroscopy study on the hydration behaviors of Portland cement pastes during setting. J. Mater. Civ. Eng. 2014, 27, 04014233. [Google Scholar] [CrossRef]
- Tarrida, M.; Madon, M.; Le Rolland, B.; Colombet, P. An in-situ Raman spectroscopy study of the hydration of tricalcium silicate. Adv. Cem. Based Mater. 1995, 2, 15–20. [Google Scholar] [CrossRef]
- Garbev, K.; Stemmermann, P.; Black, L.; Breen, C.; Yarwood, J.; Gasharova, B. Structural features of C-S-H(I) and its carbonation in air—A Raman spectroscopic study. Part I: Fresh phases. J. Am. Ceram. Soc. 2007, 90, 900–907. [Google Scholar] [CrossRef]
- Liu, F.J.; Sun, Z.H. Chemical mapping of cement pastes by using confocal Raman spectroscopy. Front. Struct. Civ. Eng. 2016, 10, 168–173. [Google Scholar] [CrossRef]
- del Bosque, I.F.S.; Martinez-Ramirez, S.; Blanco-Varela, M.T. FTIR study of the effect of temperature and nanosilica on the nanostructure of C-S-H gel formed by hydrating tricalcium silicate. Constr. Build. Mater. 2014, 52, 314–323. [Google Scholar] [CrossRef] [Green Version]
- Choudhary, H.K.; Anupama, A.V.; Kumar, R.; Panzi, M.E.; Matteppanavar, S.; Sherikar, B.N.; Sahoo, B. Observation of phase transformations in cement during hydration. Constr. Build. Mater. 2015, 101, 122–129. [Google Scholar] [CrossRef]
- Al-Maliki, F. Detection of Random Laser Action from Silica Xerogel Matrices Containing Rhodamine 610 Dye and Titanium Dioxide Nanoparticles. Adv. Mater. Phys. Chem. 2012, 2, 110–115. [Google Scholar] [CrossRef] [Green Version]
- Ramalla, I.; Gupta, R.; Bansal, K. Effect on superhydrophobic surfaces on electrical porcelain insulator, improved technique at polluted areas for longer life and reliability. Int. J. Eng. Technol. 2015, 4, 509–519. [Google Scholar] [CrossRef] [Green Version]
- Darmakkolla, S.R.; Tran, H.; Gupta, A.; Rananavare, S.B. A method to derivatize surface silanol groups to Si-alkyl groups in carbon-doped silicon oxides. RSC Adv. 2016, 6, 93219–93230. [Google Scholar] [CrossRef]
- Grill, A.; Neumayer, D.A. Structure of low dielectric constant to extreme low dielectric constant SiCOH films: Fourier transform infrared spectroscopy characterization. J. Appl. Phys. 2003, 94, 6697–6707. [Google Scholar] [CrossRef]
- Fernandez, L.; Alonso, C.; Hidalgo, A.; Andrade, C. The role of magnesium during the hydration of C3S and C-S-H formation. Scanning electron microscopy and mid-infrared studies. Adv. Cem. Res. 2005, 17, 9–21. [Google Scholar] [CrossRef]
- Bonnier, F.; Blasco, H.; Wasselet, C.; Brachet, G.; Respaud, R.; Carvalho, L.F.C.S.; Bertrand, D.; Baker, M.J.; Byrne, H.J.; Chourpa, I. Ultra-filtration of human serum for improved quantitative analysis of low molecular weight biomarkers using ATR-IR spectroscopy. Analyst 2017, 142, 1285–1298. [Google Scholar] [CrossRef] [Green Version]
- Das, I.; Mishra, M.K.; Medda, S.K.; De, G. Durable superhydrophobic ZnO-SiO2 films: A new approach to enhance the abrasion resistant property of trimethylsilyl functionalized SiO2 nanoparticles on glass. RSC Adv. 2014, 4, 54989–54997. [Google Scholar] [CrossRef]
- Kalkan, E.; Nadaroglu, H.; Celebi, N.; Tozsin, G. Removal of textile dye Reactive Black 5 from aqueous solution by adsorption on laccase-modified silica fume. Desalin. Water Treat. 2014, 52, 6122–6134. [Google Scholar] [CrossRef]
- He, Y.; Zhao, X.; Lu, L.; Struble, L.J.; Hu, S. Effect of C/S ratio on morphology and structure of hydrothermally synthesized calcium silicate hydrate. J. Wuhan Univ. Technol. Mater. Sci. Ed. 2011, 26, 770–773. [Google Scholar] [CrossRef]
- He, Y.; Lu, L.; Struble, L.J.; Rapp, J.L.; Mondal, P.; Hu, S. Effect of calcium–silicon ratio on microstructure and nanostructure of calcium silicate hydrate synthesized by reaction of fumed silica and calcium oxide at room temperature. Mater. Struct. 2014, 47, 311–322. [Google Scholar] [CrossRef]
- Hu, Q.N.; Aboustait, M.; Kim, T.; Ley, M.T.; Hanan, J.C.; Bullard, J.; Winarski, R.; Rose, V. Direct three-dimensional observation of the microstructure and chemistry of C3S hydration. Cem. Concr. Res 2016, 88, 157–169. [Google Scholar] [CrossRef] [Green Version]
- García Carmona, J.; Gómez Morales, J.; Rodríguez Clemente, R. Rhombohedral–scalenohedral calcite transition produced by adjusting the solution electrical conductivity in the system Ca(OH)2–CO2–H2O. J. Colloid Interface Sci. 2003, 261, 434–440. [Google Scholar] [CrossRef]
- Masmoudi, R.; Kupwade-Patil, K.; Bumajdad, A.; Buyukozturk, O. In situ Raman studies on cement paste prepared with natural pozzolanic volcanic ash and Ordinary Portland Cement. Constr. Build. Mater. 2017, 148, 444–454. [Google Scholar] [CrossRef]
- Dariz, P.; Schmid, T. Ferruginous phases in 19th century lime and cement mortars: A Raman microspectroscopic study. Mater. Charact. 2017, 129, 9–17. [Google Scholar] [CrossRef]
- Zajac, M.; Skocek, J.; Lothenbach, B.; Mohsen, B.H. Late hydration kinetics: Indications from thermodynamic analysis of pore solution data. Cem. Concr. Res. 2020, 129, 105975. [Google Scholar] [CrossRef]
Figure 1.
XRD patterns of C3S.

Figure 2.
Schematic diagram of stainless steel sheet with pore array.

Figure 3.
Raman spectra of hydration products in different pores (treated by water condition).

Figure 4.
Raman spectra of hydration products in different pores (treated by 65% RH condition).
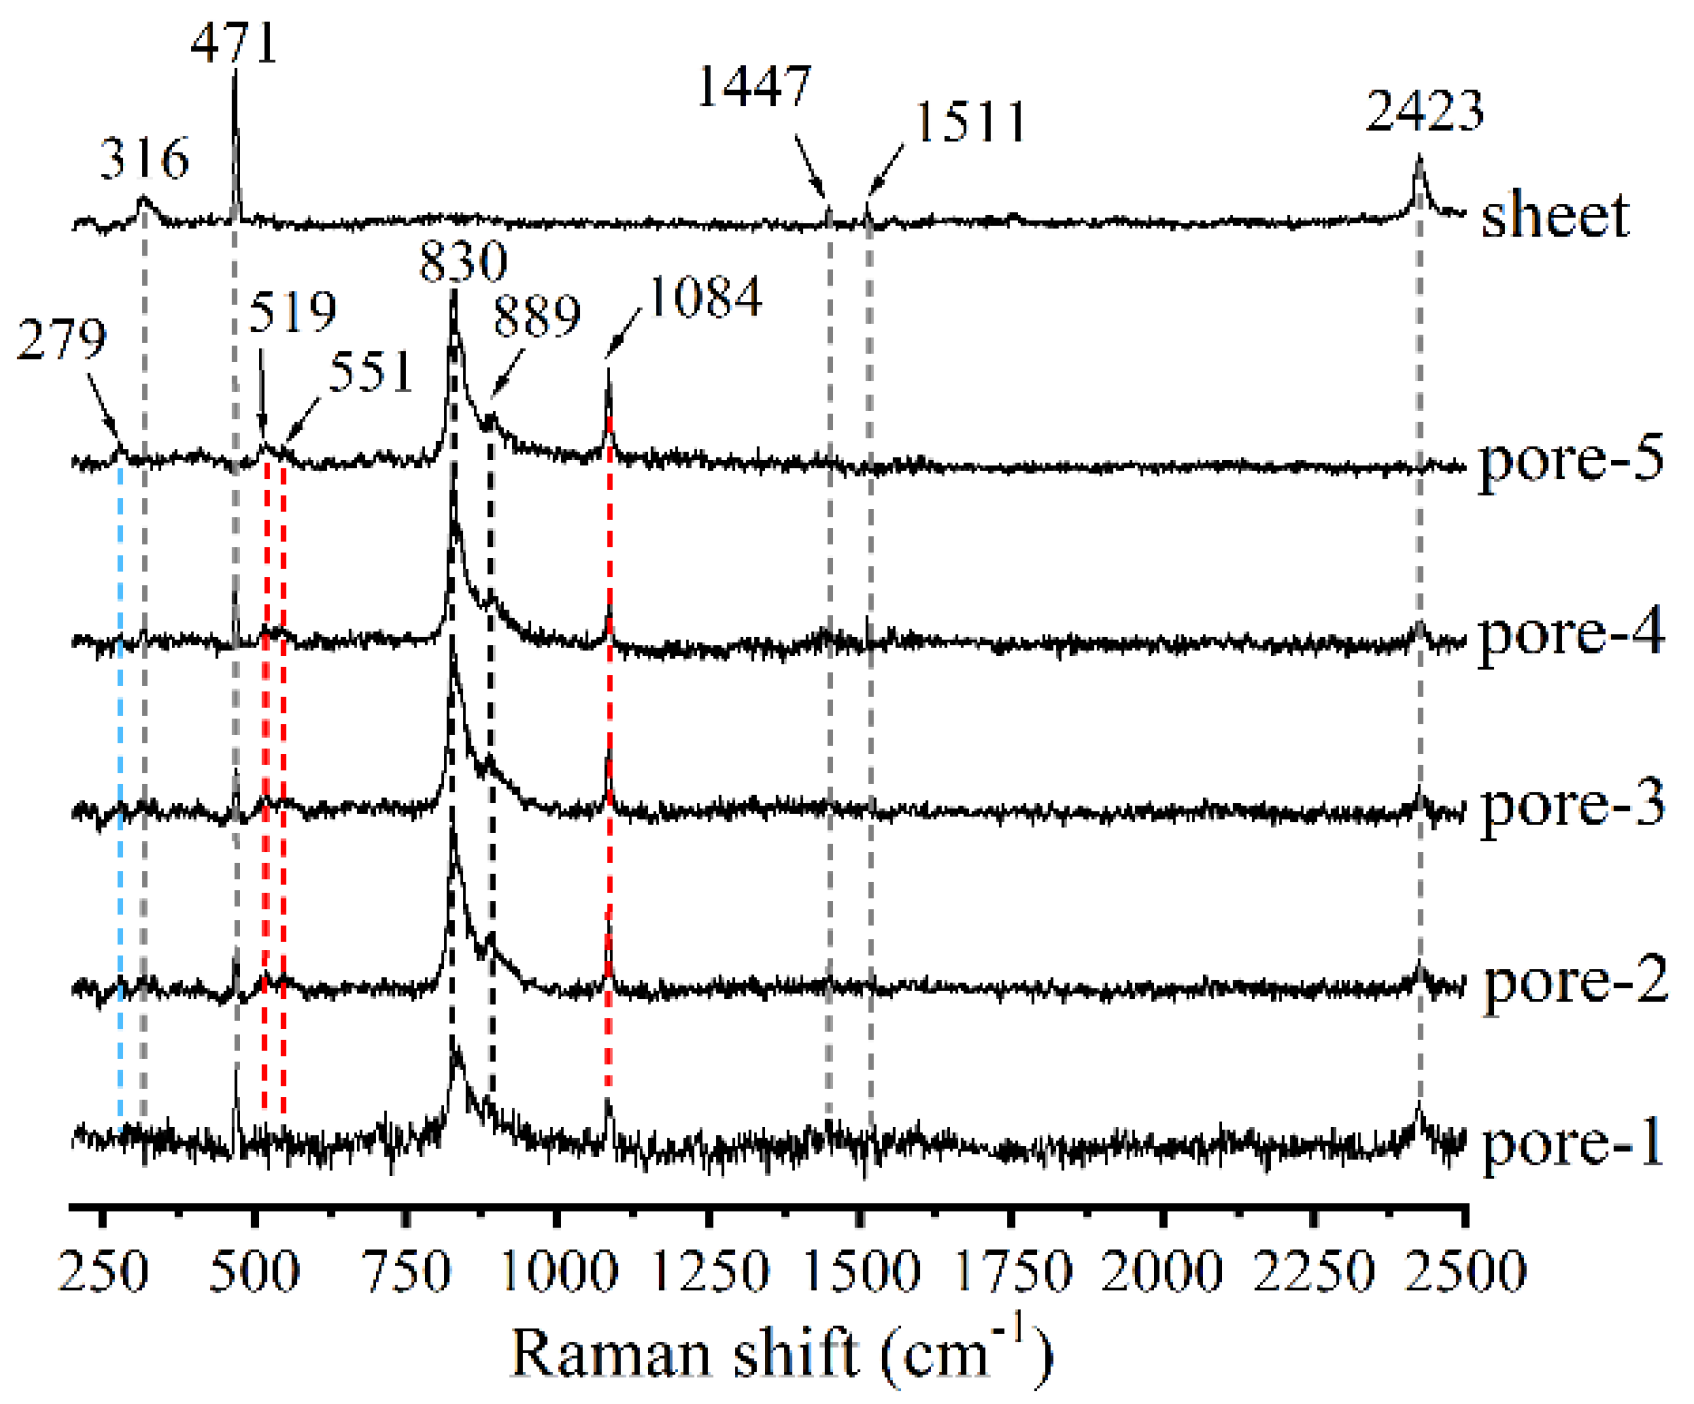
Figure 5.
Raman spectra of hydration products (the control).
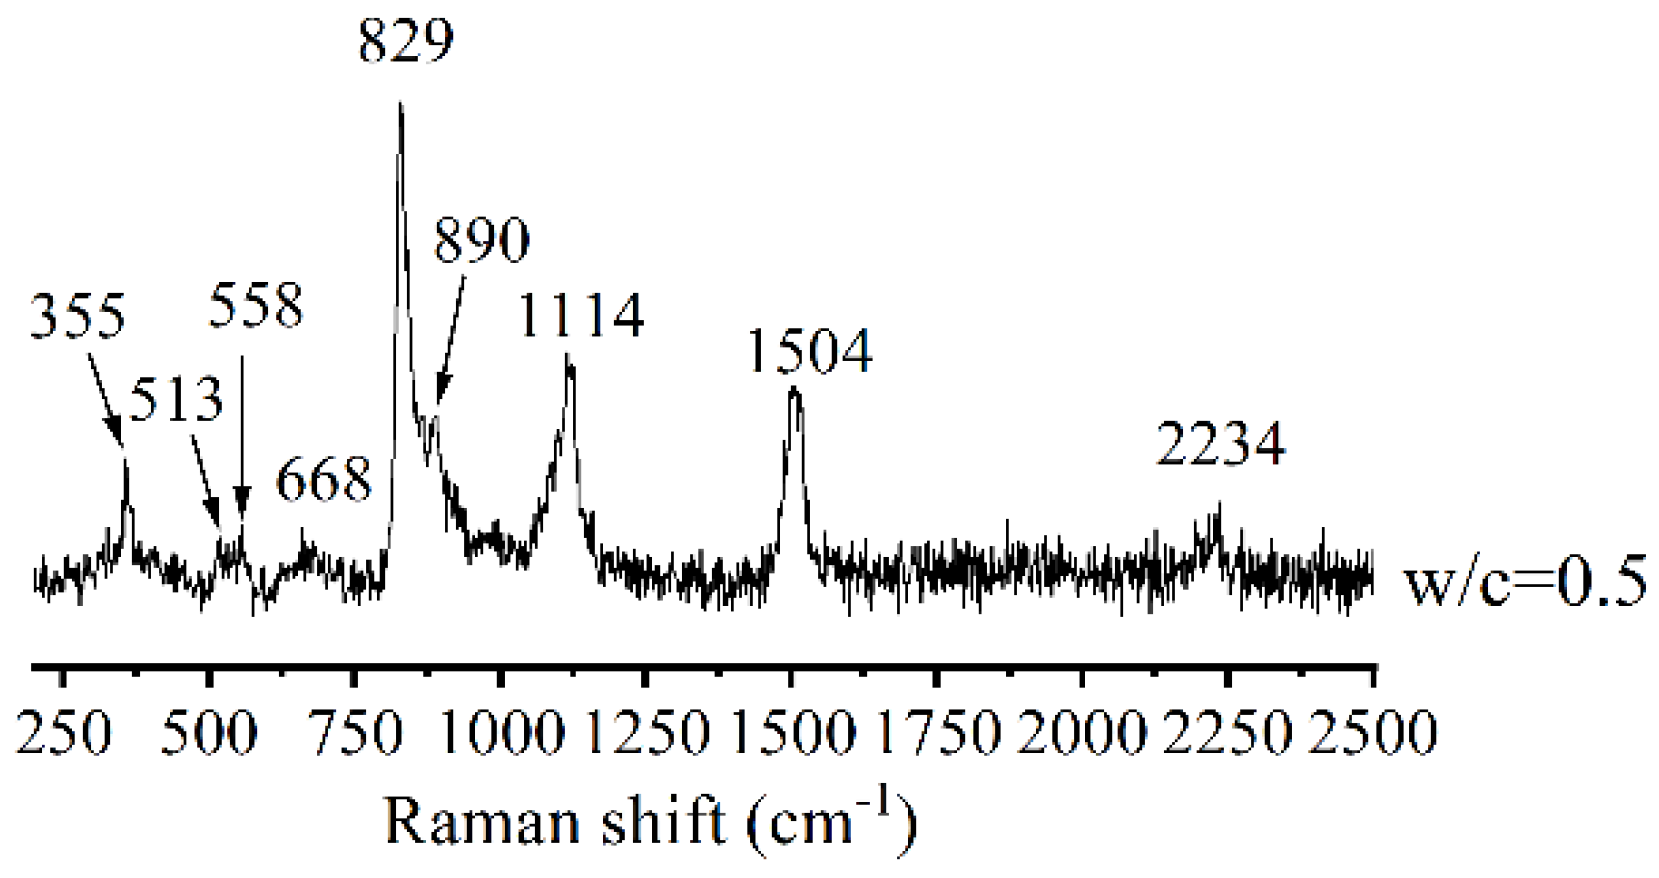
Figure 6.
FT-IR spectra of hydration products under different hydration conditions.
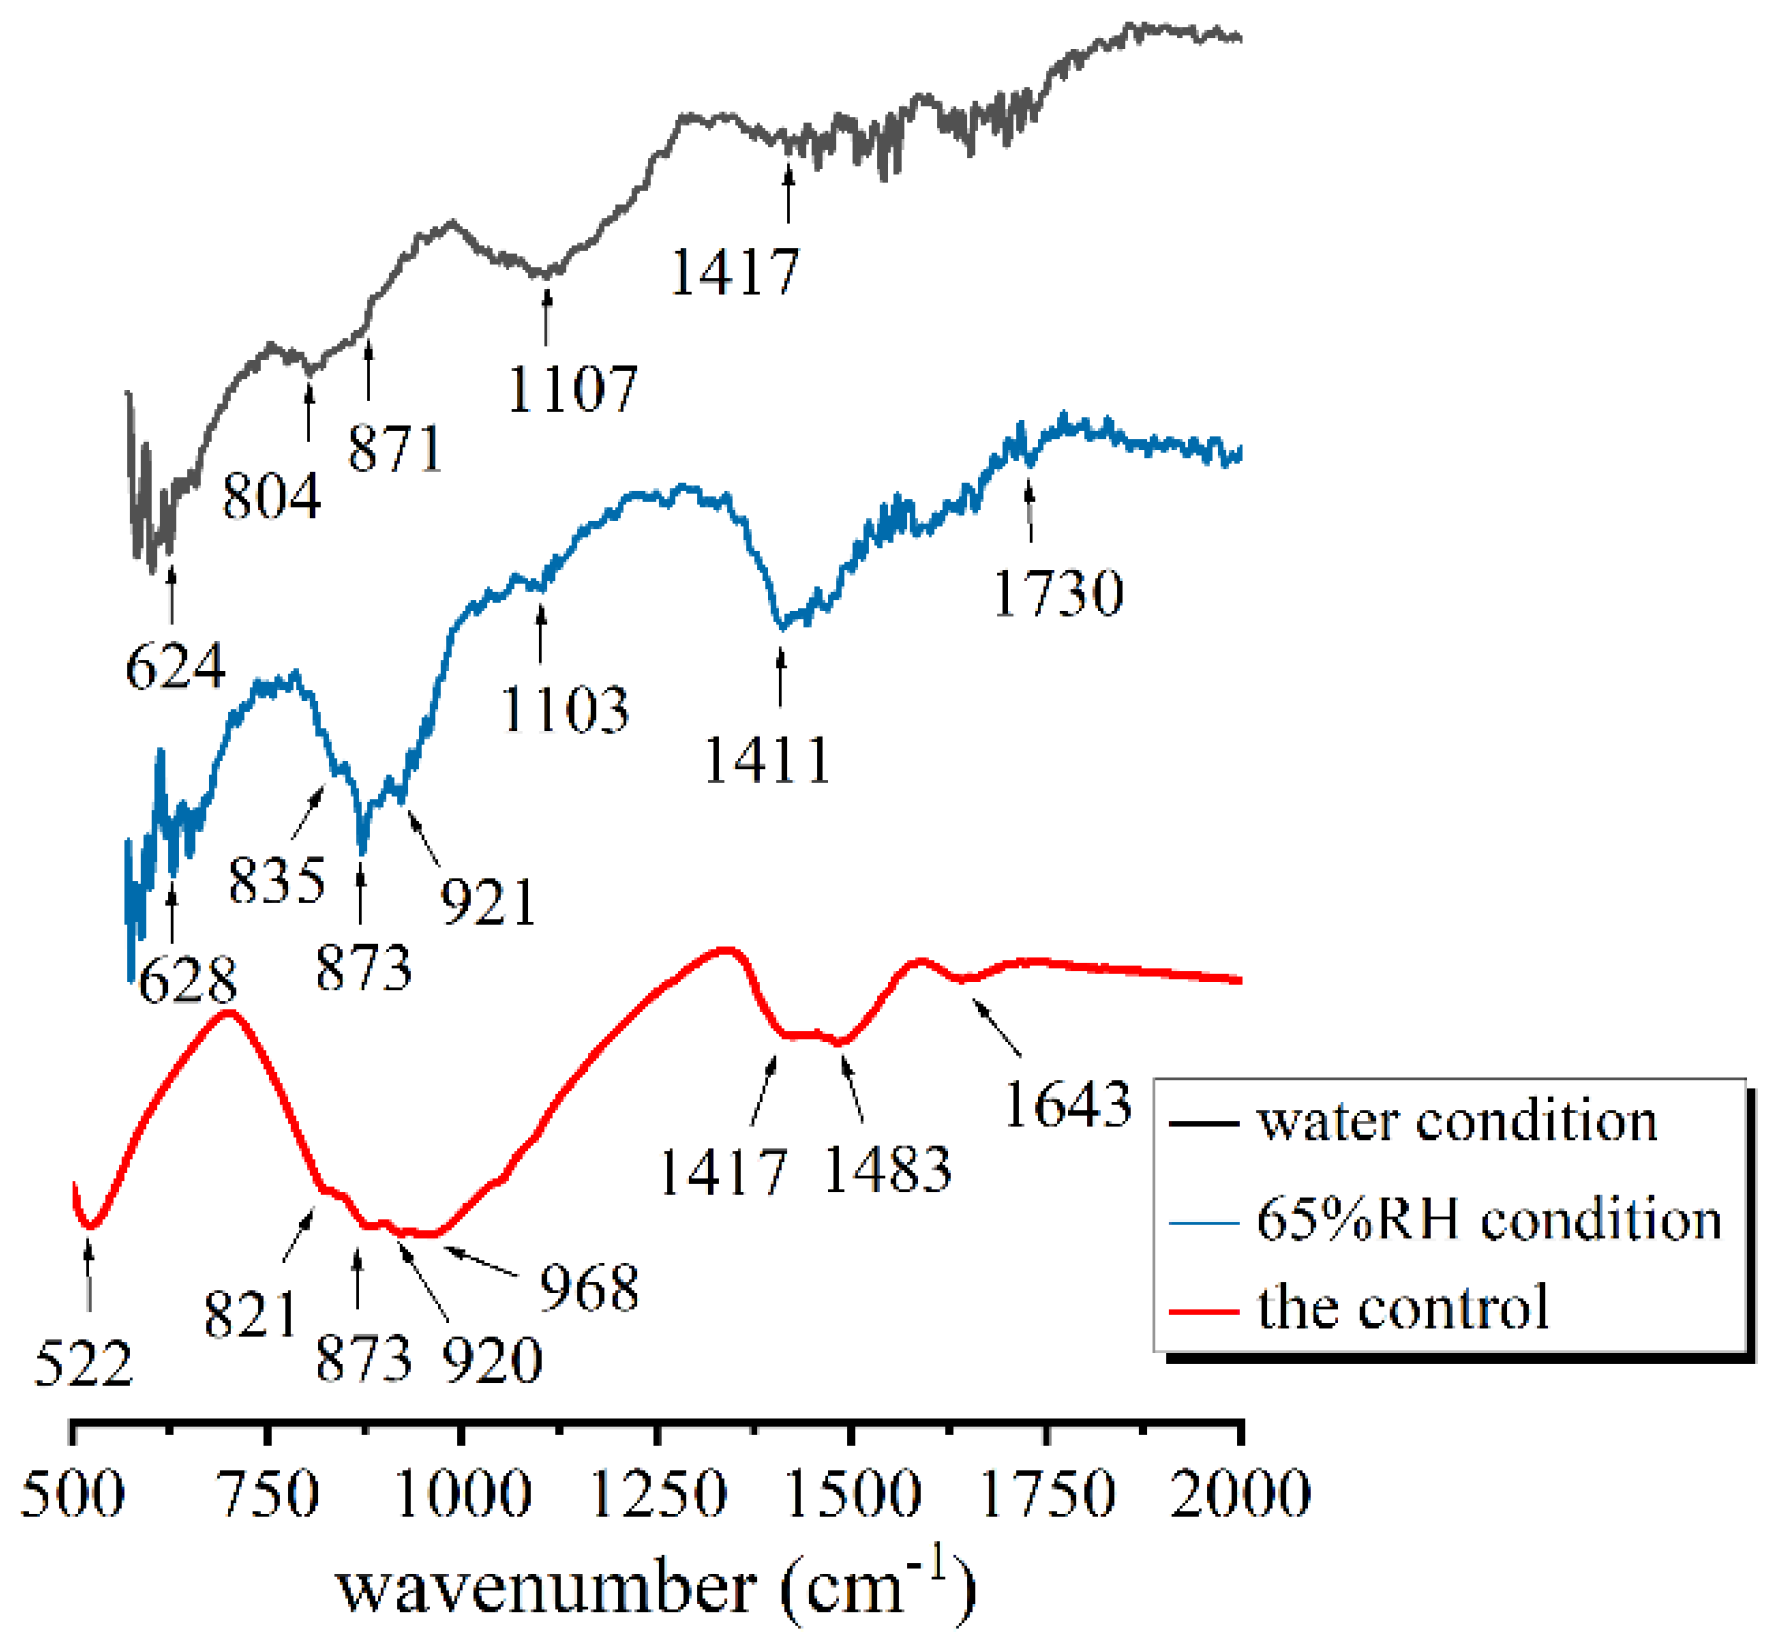
Figure 7.
SEM images of hydration products under different conditions after 24 h.

Table 1.
EDX analysis of hydration products under different conditions after 24 h (at.%).
| Elements | Ca | Si | O | C | Mg | Al | Ti | Ca/Si |
|---|---|---|---|---|---|---|---|---|
| water | 22.8 | 8.6 | 60.9 | 5.9 | 0.9 | 0.3 | 0.6 | 2.65 |
| 65% RH | 33.6 | 21.2 | 25.3 | 8.1 | 1.1 | 0.3 | 9.0 | 1.58 |
| w/c = 0.5 | 20.1 | 10.6 | 58.8 | 9.7 | 0.7 | 0 | 0 | 1.89 |
Table 2.
Raman shifts and distribution of hydration products.
| Conditions | Raman Shift (cm−1) | ||||
|---|---|---|---|---|---|
| C3S | C-S-H | CaCO3 | Ca(OH)2 | Stainless Steel Sheet | |
| water condition (pores) | —— | 1084 (Q3) | 280, 713, 1595, 1581 and 1084 | —— | 316, 469, 1449, 1510 and 2425 |
| 65% RH condition (pores) | 830 and 889 | 519; 551 and 1084 (Q3) | 279 and 1084 | —— | 316, 471, 1417, 1511 and 2423 |
| the control (w/c = 0.5) | 513, 558, 829 and 890 | 668 (Q2); and 1114 | —— | 355, 1504 and 2234 | —— |
Table 3.
FT-IR bands and distribution of hydration products.
| Conditions | FT-IR Spectra (cm−1) | |||
|---|---|---|---|---|
| C3S | C-S-H | CaCO3 | Water | |
| water condition (pores) | 804 | 624; 1107 (Q3) | 871 and 1417 | —— |
| 65% RH condition (pores) | 873, 921 and 835 | 628; 1103 (Q3) | 1411 and 1730 | —— |
| the control (w/c = 0.5) | 522, 821, 873 and 920 | 968 (Q2) | 1417 and 1483 | 1643 |
Publisher’s Note: MDPI stays neutral with regard to jurisdictional claims in published maps and institutional affiliations. |
© 2021 by the authors. Licensee MDPI, Basel, Switzerland. This article is an open access article distributed under the terms and conditions of the Creative Commons Attribution (CC BY) license (https://creativecommons.org/licenses/by/4.0/).
Share and Cite
MDPI and ACS Style
Zhou, Y.; Wang, Z.; Zhu, Z.; Chen, Y.; Xu, L.; Wu, K. Impacts of Space Restriction on the Microstructure of Calcium Silicate Hydrate. Materials 2021, 14, 3645. https://doi.org/10.3390/ma14133645
AMA Style
Zhou Y, Wang Z, Zhu Z, Chen Y, Xu L, Wu K. Impacts of Space Restriction on the Microstructure of Calcium Silicate Hydrate. Materials. 2021; 14(13):3645. https://doi.org/10.3390/ma14133645
Chicago/Turabian StyleZhou, Yue, Zhongping Wang, Zheyu Zhu, Yuting Chen, Linglin Xu, and Kai Wu. 2021. "Impacts of Space Restriction on the Microstructure of Calcium Silicate Hydrate" Materials 14, no. 13: 3645. https://doi.org/10.3390/ma14133645
Note that from the first issue of 2016, this journal uses article numbers instead of page numbers. See further details here.