1. Introduction
Meteorological information services (MIS) play an important role in the operational planning and management of fisheries and aquaculture, which can increase profits or reduce losses and will affect fishery production management [
1,
2]. However, the provision of meteorological information services requires a large amount of infrastructure investment, and is mostly financed by the public sector. In order to improve the efficient usage of public funds, it is necessary to correctly measure the economic value of the meteorological information services for industry applications [
3,
4,
5].
According to statistics compiled by reference [
6], the top three types of fisheries in Taiwan based on their output value are far sea fisheries (about 35.7 billion New Taiwan Dollars (NTD)), inland culture fisheries (about 31.8 billion NTD), and offshore fisheries (about 12.7 billion NTD), accounting for 40.01%, 35.62%, and 14.20% of the total output value of all fisheries, respectively. Far sea fisheries are fishing operations using powered fishing boats in the areas outside the exclusive economic zone; inland culture fisheries are fishing operations that breed or stock aquatic animals and plants within the high water line; while offshore fisheries are fishing operations using powered fishing boats in the exclusive economic zone (12 nautical miles–200 nautical miles). Among the above three types of fisheries, the inland culture fisheries not only have a high proportion of output value, but the related meteorological information services are mainly provided by the Central Weather Bureau (CWB). Furthermore, the top four inland culture fisheries based on their output value are Groupers (about 4.7 billion NTD), Milkfishes (about 4.2 billion NTD), Clams (about 4.1 billion NTD) and Tilapias (Taiwan bream, about 3.2 billion NTD).
This research, therefore, focuses on inland culture fisheries as the main research objective and attempts to reveal the aquaculture farmers’ willingness-to-pay (WTP) for the meteorological information services currently provided by the CWB. Based on the individual-level WTP, the total value at the national level can be estimated, indicating the value of the existing meteorological information services applied to fishery production.
In terms of the evaluation methodology, this research uses the conditional valuation method (CVM) and conducts a survey for aquaculture farmers to collect data, which are used as the basis for measuring the economic value of meteorological information services (see, e.g., [
3,
4,
5,
7,
8,
9,
10,
11,
12,
13,
14,
15,
16]). The survey was conducted with help from the Directorate-General of Budget, Accounting and Statistics, Executive Yuan, using data from the Fishery Census. The stratified random sampling method was used and 600 observations were drawn from the top-ten farmed fish species according to the proportion of the number of aquaculture households. A face-to-face survey was conducted and 399 questionnaires were completed. After dealing with the problems of missing data, outliers, and protest samples, the final sample used in our empirical analysis contained 280 observations, which were located in Tainan, Yilan, Pingtung, Kaohsiung, Yunlin, Chiayi, and Changhua. The details of the survey design and the survey conducting process will be presented in the survey design section of this paper. In order to understand the effect of various factors on WTP bidding, this research has also established a bid function for WTP and uses an unconditional quantile regression model (UQR) for the empirical analysis [
17]. Decision makers are often interested in the relationship between the major treatment variable and the outcome distribution, which is unconditional on additional covariates that can only be measured by the unconditional quantile regression method [
18].
The remainder of this paper is organized as follows.
Section 2 provides a literature review.
Section 3 and
Section 4 describe the methodology and the survey design.
Section 5 presents the empirical results and
Section 6 calculates and discusses the economic value of the meteorological information services for aquaculture in Taiwan. The final section is the conclusion.
2. Literature Review
In most countries, including Taiwan, meteorological information services are mainly provided by the public sector and are regarded as public goods. Therefore, meteorological information services are not commodities and cannot be obtained through market transactions. A non-market good evaluation approach must be used to assess the economic value of such meteorological information services. The conditional valuation method (CVM) originated in 1947 when Ciriacy-Wantrup proposed using an “in-person survey” to estimate the value of public goods [
19]. In past research on meteorological information services, the CVM was also used to analyze their economic value [
20,
21]. For example, reference [
7] used the CVM to measure the economic value to American households of current weather forecasting services and improved weather forecasting services. The results of this research indicated that the value of the current weather forecasting service was 109 USD per year and the value of the improved weather forecasting was 16 USD per year. The United States Bureau of Census estimates that there were 105 million households in the United States in 2000 and, therefore, the national total value of weather forecasting services was 11.4 billion USD per year, while the national total value of improved weather forecasting was estimated to be 1.73 billion USD per year.
Reference [
8] used the CVM to measure the economic value of setting up automatic telephone weather forecasting equipment in Canada. The empirical results showed that the average value of each call was 1.20 USD, of which that for the agricultural sector was 2.17 USD and that for the public sector was 0.60 USD. Based on the calculation of approximately 13,750,000 business calls per year, the weather forecasting equipment service generated about 16.5 million USD in revenue each year.
Reference [
12] used the CVM to discuss the economic value of the meteorological services provided by the Korea Meteorological Administration (KMA) to Korean households. The empirical results indicated that Korean households are willing to pay 1.26 USD per month per household for meteorological services, and by extending the economic value to households throughout Korea in 2013, the economic value of meteorological services to the nation was found to be 444.9 million USD per year.
Reference [
13] used the CVM to measure the economic value of the Ghana Meteorological Bureau (GMet) for its provision of meteorological information services to Accra Formal Services Sector users. The empirical results showed that the average willingness to pay for meteorological information services was 51.96 USD per person per year. Based on there being 249,144 meteorological information service users, the economic value of the meteorological information services was 12.9 million USD per year, which was four times the size of the Ghana government’s annual budget allocated to GMet.
Agricultural production activities are very sensitive to changes in climate or meteorology, and so the application of meteorological information services is also more important for agricultural decision-making than for other sectors. There has also been some research in the past to explore the economic value of meteorological information services to agriculture [
3,
4,
5]. Reference [
3] used CVM analysis to improve the economic value of Italian agrometeorological information services. The empirical results showed that the willingness to pay to improve meteorological information services in specific agricultural sectors was between 44 USD per year and 447 USD per year. Reference [
4] also used the CVM to analyze the economic value to farmers of weather forecasting information in the northern area of the Savelugu-Nanton Municipality in Ghana. The empirical results showed that farmers were willing to pay an average of 7.56 USD per year.
Reference [
11] used the CVM to measure the economic value of climate forecasting information to farmers who planted cowpea and sesame in climate-smart villages in Burkina Faso. The empirical results showed that farmers were willing to pay to obtain the climate forecasting information. The WTP for seasonal climate forecasting information was 12.51 USD, while that for daily climate forecasting information was 5.82 USD. In addition, reference [
14] measured the economic value of climate forecasting information to farmers growing cowpea and sesame in Burkina Faso. The empirical results showed that the farmers’ willingness to pay for seasonal climate forecasting information was 5.91 USD, while that for ten-day climate information was 1.80 USD, that for daily climate information was 3.36 USD, and that for agricultural consultation was 2.75 USD.
Reference [
16] used the CVM to measure the economic benefits of the meteorological information service provided by the CWB for Taiwan’s livestock industry. The empirical results showed that the value of each livestock farmer’s willingness to pay for meteorological information services was between 15.13 USD and 17.17 USD per year. It was estimated that the economic value generated by the application of meteorological information to the livestock industry in Taiwan ranged from 399 million USD per year to 449 million USD per year. The same measurement method was applied to the agricultural meteorological information services in Taiwan. Reference [
5] explored the economic value of the meteorological information services to Taiwan’s agricultural and food crop producers. The paid value ranged from 56.06 USD to 90.92 USD, and it was further estimated that the economic value generated by the application of meteorological information to food crops in Taiwan ranged from 2.806 billion USD per year to 4.551 billion USD per year.
In addition, in order to measure the economic value of the special weather information service, reference [
9] used the CVM to measure the economic value of the WSL Institute for Snow and Avalanche Research (SLF) in terms of improving the avalanche forecasting and warning service in Switzerland. It shows that the respondents’ willingness to pay to improve the avalanche forecasting and warning service ranged from 42.70 USD per person to 46.77 USD per person, and the implicit economic value of the average statistical life (VSL) was 178 million USD.
Reference [
10] used CVM analysis to improve the willingness-to-pay of American households for hurricane forecasting services. The empirical results showed that American households were willing to pay 13.19 USD per year to improve the hurricane forecasting services, such as in relation to landing time and location, wind speed and storm surge.
Reference [
15] used the CVM to analyze the economic value of smog management and prevention in Jiangsu Province, China. The empirical results showed that the average person was willing to pay 13.62 USD for smog management and prevention. Based on the Jiangsu population (79.1998 million), the total economic value was 1.08 billion USD.
As the above research shows, the CVM, when applied to meteorological information service-related issues, has mainly focused on the willingness of different objects (sector/industry/household/individual) to pay for meteorological information services and the value created by the meteorological information services to the overall economy. It is found that the sector/industry/household/individuals are willing to pay for meteorological information services.
Table 1 classifies the research according to the different types of meteorological information service. This research focuses on the issue of the aquaculture farmers’ willingness to pay for the meteorological information services currently provided by the CWB. The CVM approach is briefly introduced in the following section.
3. Methodology
There are many methods used to measure the economic benefits of non-market goods. The CVM is the most widely applied analytical tool and can be used to measure non-use value in addition to its use value. In this research, we will use the CVM to explore the economic value of Taiwan’s meteorological information services to aquaculture production.
In the CVM, investigators need to construct a hypothetical market for the goods and to ask the valuation question to estimate the respondents’ WTP. However, since the respondents have no market trading experience for these kinds of goods in real life, it is necessary to create a “contingent or hypothetical market” for the non-market goods to be studied and to ask the respondents about their willingness to purchase or consume goods. The inquiry strategy adopted in this research first allows respondents to subjectively rate the existing “meteorological information accuracy” and “the effect of meteorological information on operational activities.” To measure the subjective accuracy, the questionnaire asks respondents to score the accuracy of the MIS forecast subjectively (0–100 points). The higher the score, the more accurate the respondent considers the forecast service provided by the CWB to be, and vice versa. Based on the accuracy level, the investigators then ask the respondents about how they value the existing meteorological information services. We believe that the more highly the respondents rate the accuracy of the MIS, the more they are willing to pay for the MIS. The WTP of the respondents for the meteorological information services can be obtained from the survey, and thus the total economic value of the application of the meteorological information services can be estimated.
The double-bounded dichotomous choice with an open-ended follow-up question format has been employed in this research. This elicitation format has been proven to reduce the presence of protest responses and no-answer responses, and the efficiency of the WTP results obtained from this format has generally been improved compared to that for conventional ones [
22,
23,
24].
However, there are two characteristics of this model that need to be taken into account when estimating the bid function. First, after going through the bidding process of the first and second bounds, the respondents will have a clearer outline of the WTP in their subjective rating. If, in the third bound, the respondents are asked to respond by stating the highest amount that they are willing to pay, then that amount is the final result after a complete decision-making process. The amount can directly be used in a bid function analysis. Under the assumption that the respondents will not display a negative WTP, the respondents’ lowest WTP can only be recorded with a value of zero. However, for those who were observed to have zero WTP, their value for the MIS may truly be zero (the respondents believe that the subject to be evaluated does not have any value (is worthless)), or it may be negative. The probability that the WTP is lower than zero has to be taken into account, so that the correct estimates of the bid function can be obtained without giving rise to a biased result. This is defined in the literature as the characteristic of “censored data”.
Second, when using the double-bounded dichotomous choice model, the two-stage bidding process will provide the “bid price” to the respondents as a reference for bidding. In terms of the original intention of this design, the purpose of providing this “bid price” is to induce the respondent to indicate the true WTP in his mind. However, in practice, the respondents can easily use this amount as the “market price” of the goods to be evaluated, so that the true WTP in the respondent’s mind is affected. However, if the respondent believes that the bid price provided in the questionnaire is the average market price of the goods, he/she may use this reference amount and the true WTP to produce a weighted adjustment before replying. As such, the final estimated average WTP may be overestimated or underestimated, and this bias effect is the “starting point bias” defined in the CVM research literature [
24,
25,
26]. Once this bias exists, the amount obtained from the respondent in the last open-ended elicitation format that is used to directly estimate the bidding function will lead to biased estimates.
Therefore, in order to obtain an appropriate WTP estimation result and avoid the possible effects of bias, the above two characteristics of the CVM have to be taken into consideration, and appropriate corrections should be made based on the estimated results.
As for correcting the “starting point bias”, the current research is mostly based on the correction model proposed by [
25]. According to their research, in the bidding model of the double-bounded dichotomous choice model, when the respondents face the amount of the first bid/initial bid given by the interviewer, the willingness to pay
in the second stage is actually a combination of the actual amount of the willingness-to-pay (
and the first bid (
with a certain weight
. The weight
is the “anchoring effect coefficient” defined in the literature, and
. If
is closer to 1, it means that the
presented in the respondent’s mind in the second stage is closer to the amount of the first bid provided by the interviewer in the first stage (
. That is, the anchoring effect coefficient of the starting point bias has a greater impact on the estimated result. On the contrary, if
is closer to 0, the respondent’s willingness to pay value,
, is closer to the true amount of the willingness to pay
, meaning that the effect of the starting price on the average WTP estimation result is not obvious. The conceptual function is as shown in Equation (1):
By establishing an empirical model of the bidding function based on Equation (1) and estimating the empirical model with the survey data, the value of the anchoring effect coefficient
can be estimated. In addition, Equation (2) can be utilized to correct
and then obtain the true
:
On the other hand, when we want to control the possible impact of “restricted data characteristics”, the Tobit model is a model commonly used to estimate the bidding function. However, the Tobit model assumes that the data must be normally distributed before it can produce an effective estimate. In practice, however, not all empirical data can meet this condition, especially survey data. To deal with this limitation, this study adopts the quantile regression method that can be effectively implemented without the assumption that the data are normally distributed.
The quantile regression model is a semi-parametric method in which the estimation of the coefficient corresponding to the specific conditional quantile is obtained but does not require the assumption that the data are normally distributed. Therefore, it is more flexible in applications of empirical analysis. As a result, quantile regression has become a popular empirical analysis tool in recent years [
27,
28].
The estimation results from the conventional quantile regression are mainly interpreted as the effect of major treatment variables on a quantile of the dependent variable that is conditional upon the specific values of other covariates. If we simulate the effects of more than one independent variable on the dependent variable as our target, the conventional quantile regression model is not feasible. Thus, this research applies the generalized quantile regression estimator (GQR) developed by [
17], combined with the Markov chain Monte Carlo (MCMC) method to obtain the estimates of the bid function. This is the unconditional quantile regression model (UQR) defined in the literature [
29], which is more flexible than the conventional model.
4. Survey Design
The purpose of this research is to reveal the average annual willingness to pay for the meteorological information services currently provided by the CWB to the aquaculture farmers. Based on the estimation results, the total WTP amount at the national level can be calculated and treated as an approximation of the economic value of the existing meteorological information services applied to fisheries production.
Therefore, this research uses data compiled by the Directorate-General of Budget, Accounting and Statistics, Executive Yuan, based on the Fishery Census, and adopts the stratified random sampling method to draw a sample consisting of 600 observations according to the proportion of the top-ten farmed fish species (eel, perch, grouper, milkfish, tilapia, fourfinger threadfin, giant river shrimp (Thai shrimp), white shrimp, oysters, and clams) based on the number of aquaculture households. A face-to-face survey for the aquaculture farmers was conducted from 22 July to 30 August 2019 and 399 questionnaires were completed. After excluding the protest samples, extreme outliers, and observations with missing data, the total valid sample size used in the empirical estimation was 280 and the observations were distributed over Chiayi (65 observations), Tainan (56), Kaohsiung (48), Pingtung (47), Yunlin (33), Changhua (19), and Yilan (12). In this study, the extreme outliers referred to those aquaculture farmers whose household income lies either below the first quartile or above the third quartile.
The questionnaire used in this research was designed according to the guidelines suggested by reference [
30]. The questionnaire contained four parts. The first part consisted of questions associated with “cognition and experience of weather forecasting information”. The second part contained questions regarding “the evaluation of weather forecasting information”. The third part of the questionnaire was about the “disaster damage experience” of the aquaculture farmers, while the fourth part was about the “respondent’s personal information.” In order to examine the respondents’ understanding and acceptance of the questionnaire’s content, and to select the distribution of the willingness to pay, a pre-survey was conducted before proceeding with the formal questionnaire survey. During the pre-survey, an open-ended question was adopted, allowing respondents to freely respond by stating the amount of their willingness to pay. In June 2019, the pre-survey was conducted in-person, with a total of 30 valid observations.
According to reference [
31], the method used to select the optimal amount for the survey questionnaire is designed as follows. Firstly, the amounts obtained from the pre-survey should be sorted from low to high, and extreme values deleted at both ends to reduce the observation bias. Secondly, the 15th, 23rd, 31st, 38th, 46th, 54th, 62nd, 69th, 77th, and 85th percentiles should be selected as the first bidding price at the first-stage in the formal questionnaire. If the respondent replied that he/she was “willing to pay the bidding price” in the first stage, then the bidding price in the second stage will be double the amount in the first stage. If the respondent replied that he/she was “reluctant to pay the bidding price” in the first stage, then the bidding price in the second stage will be half the amount in the first stage. In this research we have divided the questionnaire into ten groups according to the initial bidding price (see
Table 2). These 10 groups of questionnaires are then selected randomly when conducting the face-to-face survey.
5. Empirical Results
There are five types of independent variable considered in the bid function, which are the “Subjective Cognition of Meteorological Information Services”, “Socioeconomic Characteristics”, “Location”, “Types of Farmed Fish Species”, and “First Bid Value”, where the “First Bid Value” is used to check whether there is starting point bias. The empirical results enable us to estimate the willingness to pay of the aquaculture farmers for meteorological information services. Through the trial-and-error process of different variable combinations (in both linear and nonlinear settings) and considering the results of the goodness-of-fit index, the empirical model with the best explanatory power is finally selected, as shown in Equation (3):
where
is the willingness-to-pay of respondent
, and
are the estimated coefficients of each independent variable.
is the subjective accuracy rating of the respondent for the current meteorological information (0–100), and
is the respondent’s subjective cognition of the impact of meteorological information on the aquaculture output (1–10). The variable
is a dummy variable indicating whether the aquaculture farmer makes investments associated with natural disasters and
refers to whether the aquaculture farmer buys fishery insurance. There is also a group of variables indicating the respondents’ socioeconomic characteristics, including gender (
sex), age (
age), education level (
edu), working years (
exp), whether the respondent has joined the fishermen’s group (
group), and the logarithm of the respondent’s annual income from aquaculture (
lnincome). The location variables indicate the aquaculture farmer’s location, where
is Tainan City,
is Yilan County,
is Pingtung County,
is Kaohsiung City,
is Yunlin County, and
is Chiayi County. Fish species variables indicate the major fish species farmed by the aquaculture farmers;
is eel,
is perch,
is grouper,
is milkfish,
is tilapia,
is fourfinger threadfin,
is Thai shrimp,
is white shrimp,
is oysters, and
is clams. Finally,
is the first bid value. Variable definitions and descriptive statistics are summarized in
Table 3 and the average values of WTP for different aquaculture species are presented in
Table 4.
In this research, UQR is used for the empirical estimation of the formula (3) bidding function. The correlation coefficients of the independent variables (except dummy variables for locations and fish species) are calculated before the estimation and none of them reflects a high degree of correlation. The coefficient estimation results of each independent variable are summarized in
Table 5.
In
Table 5, it is found that the coefficient of the first bid value (
Bid) is statistically significant, indicating that there is indeed starting point bias in the survey data. The corresponding coefficient, i.e., the “anchor effect coefficient” is 0.74, indicating that, on average, the WTP provided by the respondent at the last open-ended elicitation is actually a weighted combination of the actual WTP in his/her mind and the first bid value with the ratio 0.26:0.74. Therefore, the estimated coefficient of each variable must also be corrected to eliminate the anchoring effect. In
Table 5, the estimation results have been corrected. Most of the independent variables have a linear relationship with
WTP, so the coefficient estimation results can be interpreted as the effect of each unit change in the variable on the median value of
WTP. For example, the coefficient of the subjective accuracy rating variable “
degree” is estimated to be 9.88, indicating that if the respondent’s subjective accuracy level increases by one point, the monthly WTP will increase by 9.88 NTD, and the annual economic value will increase by 118.56 NTD. The logarithm of the respondent’s income level (
lnincome) also has a significant effect on the WTP value, and has a linear relationship with it. According to the estimation results, if the annual income is increased by 1% (approximately 23,000 NTD per year) from the sample average (2321 thousand NTD), the monthly WTP will increase by 28.36 NTD, and the annual economic value will increase by 340.32 NTD.
The coefficient of “effect” has a significant positive value meaning that those who consider that meteorological information services have higher effects on fishery activities have higher WTP values. If the effect rating increases by one unit, the monthly WTP rises by 11.16 NTD, and the annual economic value is expected to increase by 133.92 NTD. As for those respondents who already have insurance, the average WTP is also higher than for those who do not. This implies that the respondents who buy insurance are those who care more about the impact of weather on fisheries operations, so that their WTP values are higher. In addition, the average WTP is also higher for those who have already dealt with disaster prevention.
Table 5 also indicates that some factors have negative and significant effects on WTP values. For example, for those who participate in fishermen’s groups, the average WTP is significantly less than for those who do not. A possible reason is that the members in fishermen’s groups may share weather information with each other and the information spillover effect may lower the member’s intention to pay for meteorological information. Some location and fish species variables also have negative estimates. If we take location variables as examples, the variable “
location7” (Changhua) is the reference category for locations and the coefficients of the location variables in
Table 5 denote the average WTP values of those locations compared to Changhua. We can see that the average WTP value of the aquaculture farmers in almost every other location is significantly less than that in Changhua. The coefficient for
location2 (Yilan) is also negative but not significant. Similarly, we use “
fish11” (other fish species) as the reference category for fish species. The results in
Table 5 show that the respondents who farmed
fish1 (eels),
fish2 (perch),
fish4 (milkfish),
fish5 (tilapia), or
fish10 (clams) are willing to pay less money for meteorological information than those who farmed
fish11 (other fish species). On the contrary, the respondents who farmed
fish3 (groupers),
fish7 (Thai shrimps), or
fish9 (oysters) are willing to pay more.
6. Discussion
The empirical results for the aquaculture farmers’ bidding function reveals the factors that have impacts on the aquaculture farmers’ WTP value. Based on the empirical results, we can further calculate the total economic value (TEV) brought about by the application of meteorological information in aquaculture in Taiwan. According to equation (3), the estimated value of WTP and the initial bid exhibit a mixed price relationship, so the conceptual equation of the true WTP median should be modified as shown in Equation (4), and Equation (5) can be used to perform the calibration calculations:
By using the estimation results in
Table 5 and following Equation (5), we can obtain
= 295.33 NTD/month/person, and the annual WTP = 3544 NTD/year/person. In the original sample, the monthly median WTP for meteorological information services was 300 NTD per month, which was a little bit higher than the adjusted bid, with an overestimation of up to 1.67%. This result shows that there is an “upward starting point bias” in this research. If this bias is not corrected, the aquaculture farmers’ value of meteorological information will be overestimated.
Based on the estimation results of the bidding function, combined with the value of the independent variables, we can calculate the corrected value of the median WTP for each sample. According to the classification of the samples for different fish species, the median WTP for each aquaculture fish species can be obtained. Then the total economic value (TEV) brought about by the application of meteorological information in aquaculture in Taiwan can be calculated using Equation (6).
where
i = different fish species;
is the number of aquaculture farmers for the
ith fish species; and
is the median value of the annual WTP per aquaculture farmer for the meteorological information services for the
ith fish species.
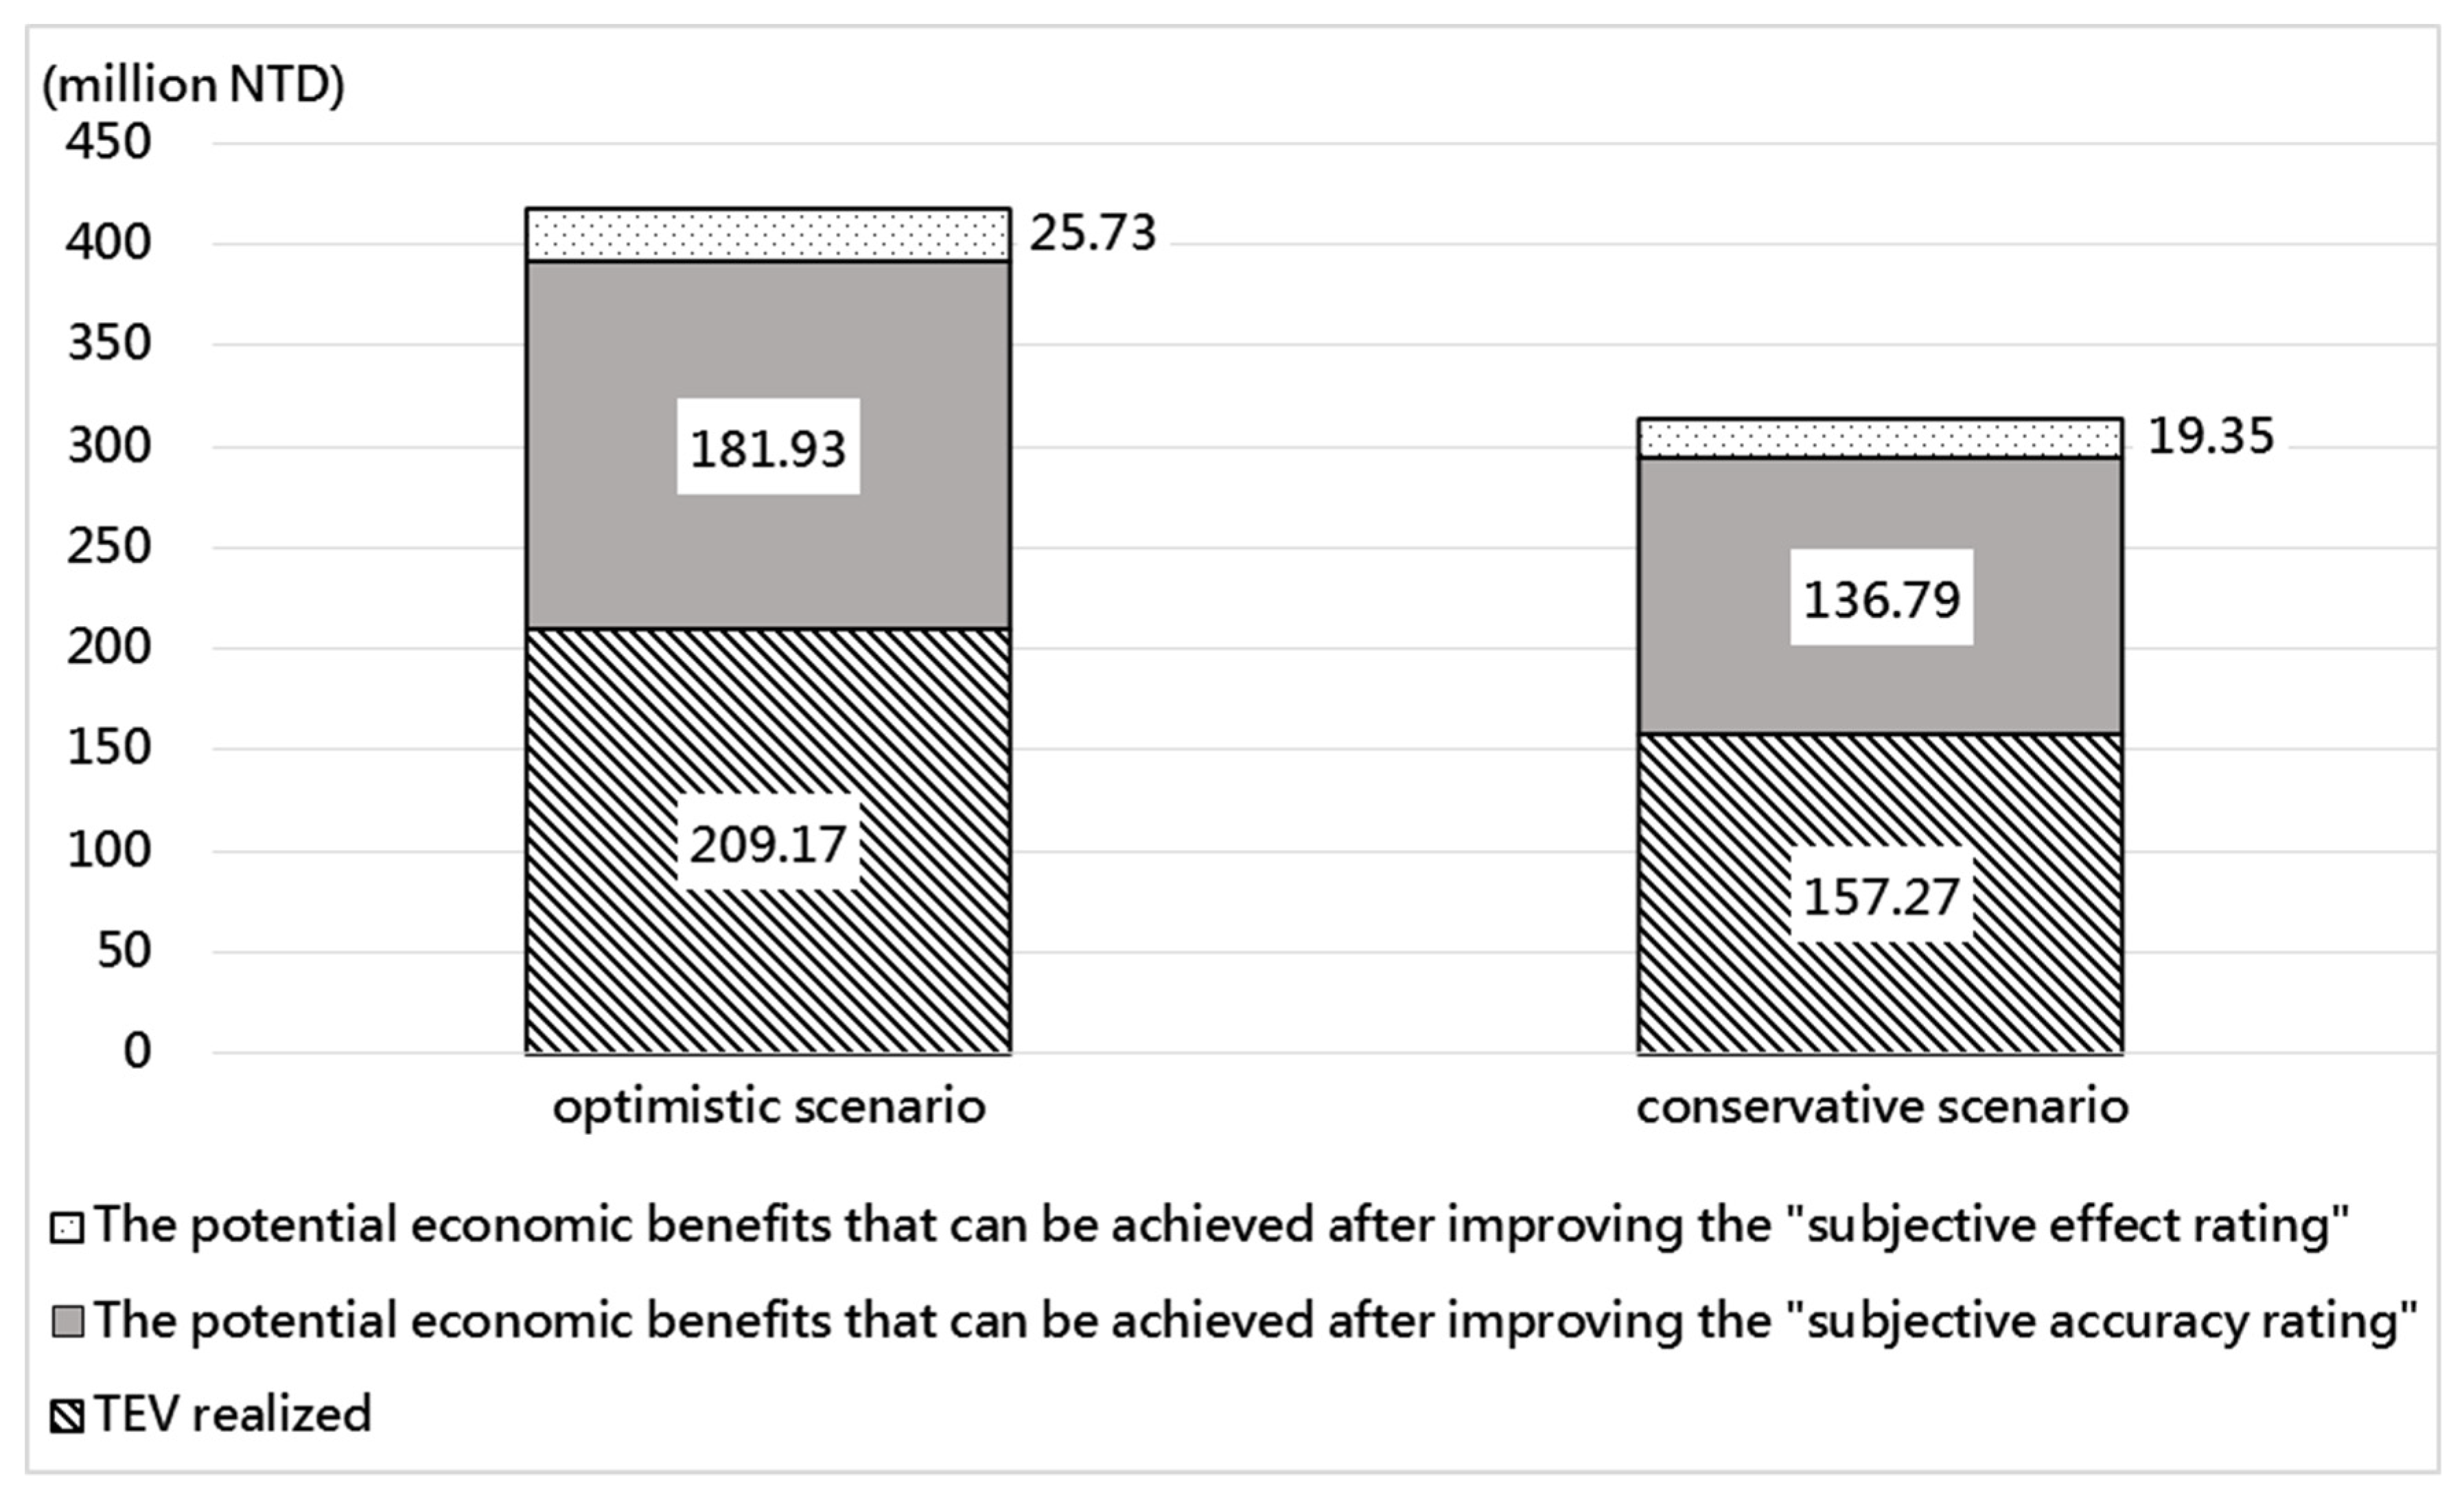
When using Equation (6) to calculate the total economic value (TEV) of the meteorological information services for aquaculture in Taiwan, we set two different scenarios (an optimistic scenario versus a conservative scenario) to estimate the economic value. Under the optimistic scenario, it is assumed that the “protest sample” (a sample that is not willing to pay for the meteorological information services for some reason, but does not necessarily think that the meteorological information services have no value) is the same as the non-protesting sample. Under this scenario, the total economic value (TEV) is 209 million NTD.
Under the conservative scenario, the “protest sample” is deleted according to the distribution ratio because we assume that none of the aquaculture farmers in the protest sample is going to bid (in fact, we believe that the weather information has value for the aquaculture farmers in this sample, but here we conservatively assume that these aquaculture farmers will not bid). In this scenario, the total economic value (TEV) is 157 million NTD.
From the perspective of policy promotion, designing and implementing management measures based on the significant factors in the bidding function is an effective application of the empirical results of this research. It is a feasible and common practice to improve the user’s proficiency in the use of meteorological information through information promotion activities or education and training, and thus to increase the level of the “subjective accuracy” and “subjective effect” of meteorological information services. From the empirical results of this research, we are able to reveal the importance of two policy variables, “the respondents’ subjective accuracy rating of the current weather information (degree)” and “the subjective cognition of the weather effect rating for production activities (effect)”. Since these two variables are associated with the promotional activities, understanding how these two variables affect WTP will help us understand the economic benefits that promotional activities can bring.
According to the survey data, the average value of the “subjective accuracy rating (
degree)” is 75.24 points, and there is still a growth potential of nearly 25 points. The average value of the “subjective effect rating of meteorological information on production activities (
effect)” is 6.88 points, so there is an improvement of nearly 3.1 points. The gap between the current cognitive level and the “ideal” cognitive level (perfect score) can be regarded as the potential economic benefits that can be achieved in various ways (such as the educational and promotional activities for meteorological application services) to improve satisfaction and influence cognition. As such, the sum of these potential economic benefits in the aforementioned “Scenario 1: optimistic scenario” and “Scenario 2: conservative scenario” can be calculated and summarized. According to
Figure 1, the potential economic value for improving the “subjective accuracy rating” ranges from 137 million (for the conservative scenario) to 182 million (for the optimistic scenario) NTD while the potential economic value for improving the “effect rating” ranges from 19 million (for the conservative scenario) to 26 million (for the optimistic scenario) NTD. To sum up, the total economic value can reach between 313.41 million NTD and 416.83 million NTD if the “subjective accuracy rating” and “subjective effect rating” can be fully improved through promotional or educational activities.
7. Conclusions
This research has conducted a survey to reveal the aquaculture farmers’ willingness to pay (WTP) for the meteorological information services (MIS) provided by the Central Weather Bureau (CWB). Based on the survey results, an econometric model has been used to evaluate and analyze the economic value of the MIS for aquaculture in Taiwan.
Our empirical results show that the aquaculture farmers who invested in disaster prevention or purchased fishery insurance are willing to pay more for the MIS. This indicates that the WTP value is related to the degree to which the aquaculture farmers care about the impact of the disaster. It is also interesting to see that the information spillover effects may decrease the average WTP for the MIS because for the aquaculture farmers who joined a fishermen’s group, their average WTP is less than for those who do not. In addition, the positive and significant effect of the “subjective accuracy rating” is obtained from the empirical results as expected, showing that the more highly the aquaculture farmers rate the accuracy of the MIS, the more they are willing to pay for the information service. This also provides a policy insight for improving the value of the MIS. Considering that the MIS service users often lack sufficient knowledge or ability to interpret the weather forecasts, it is important to enhance the capabilities of service users regarding the usage of forecasting services through promotion and training programs, as a result of which the value of the MIS can be improved.
One of the limitations of this study is that the questionnaire designed by this study did not clearly define the detailed technical specifications of the meteorological information services while asking about the respondent’s WTP. As a result, the WTP obtained from the questionnaire only represents the respondent’s evaluation of the overall MIS provided by the CWB, rather than a specific meteorological product.
Another thing to note is that increasing objective accuracy through improvements in forecasting technology and improving the subjective accuracy of service users through means of better education and extension service are two different management aspects, both of which can enhance the economic value of the MIS. These two aspects are currently the management focus of the CWB, but this research places an emphasis on investigating the relationship between subjective accuracy and the value enhancement of the MIS. Therefore, a feasible issue for follow-up research is to explore and analyze the relationship between the objective accuracy of forecasting services and the value enhancement of the MIS. The results can serve as valuable reference for subsequent investment decisions as the CWB seeks to improve forecasting technology.


 ,
, 
