Abstract
The tourism comprehensive climate comfort index (TCCI) was used to evaluate the tourism climate comfort in Henan Province in the last 61 years, and its future development trend is predicted. The results showed that the temporal variation of the TCCI had a “double peak” type (monthly variation), and an overall comfort improvement trend (interannual variation). The change of tourism climate comfort days was similar to the change of the index, especially in the months with a low comfort level. In space, the distribution of the TCCI gradually increased from northeast to southwest, and the area with a high comfort level also increased over time. Meanwhile, it also showed the spatial distribution of months with a low comfort level, which provides reliable information for tourists to use when choosing tourist destinations across all periods of the year. The TCCI was classified by hierarchical classification, and principal components were extracted to explore the main climate factors controlling different types of TCCIs and the relationship between them, and large-scale atmospheric–oceanic variability. According to the temporal change trend and correlation, the long-term change trend of tourism climate comfort was predicted, which will provide a scientific basis for tourism planners to choose tourist destinations.
1. Introduction
In the past several decades, tourism has become one of the most important economic activities in many countries and has been under continuous expansion, playing an extremely important role in promoting the development of national economies [1]. According to the long-term forecast in the “Tourism Report 2030”, the number of international tourists globally will increase to 1.8 billion in 2030, and tourism-related economic activities will become more frequent in that time [2]. Climate is a major factor in tourism development [3,4,5], while also influencing other tourism-related factors [6,7,8]. It is mainly reflected in people’s perception of climate comfort in tourism by changing climate factors, such as the mean temperature, humidity, precipitation, wind speed, and sunshine duration [9]. However, the global climate is changing at an unprecedented speed at present, with significant warming events occurring in recent decades [10,11]. This could significantly change the temporal and spatial patterns of tourism [12,13].
Comfortable climatic conditions are one of the most important factors for tourists when choosing tourist destinations, and this is also a necessary prerequisite for development in tourist destinations [14]. Therefore, it is very important to evaluate the climate comfort of tourist destinations. The study of climate comfort is also of great significance to architectural design [15], public health [16], and tourism behavior [17]. The research on climate comfort evaluation has produced more than 160 evaluation indices in the past 50 years, including the physiological equivalent temperature (PET) [18,19], Universal Thermal Climate Index (UTCI) [20,21], Climate–Tourism/Transfer-Information Scheme (CTIS) [22,23], and Tourism Climate Index [24,25]. These indexes have their own limitations; they do not all take into account the adaptation of the human body to the environment [26,27,28], include an incomplete consideration of meteorological factors [29,30], or the clothing problem for tourists is not considered [31,32,33]. These problems have a significant impact on the authenticity of the evaluation results. However, the TCCI involves a temperature and humidity index (THI), wind efficiency index (WEI), and an index of clothing (ICL), meaning it can more truly reflect the current climate comfort situation of tourist destinations [34]. At the same time, relevant studies have also proven that although this evaluation index was developed earlier than many others, it can still effectively evaluate the climate comfort of tourist destinations [35].
In China, the research on climate comfort has developed rapidly, including the evaluation and analysis of the whole country [36], provinces [30], and at the city scale [9], as well as research on scenic spots [37]. For the research on climate comfort, a few studies have used the THI, WEI, and ICL, but never all three in the same study. For example, in the evaluation of climate comfort in different living environments based on age in the Beijing–Tianjin–Hebei region of China, only the THI and WEI [38] were utilized, and only the first two indices [30] were used in a comprehensive space–time travel analysis of climate comfort on the Sino-Russian border. These studies only show the time and space of climate comfort results, and seldom explore the main controlling climate factors and their driving factors that affect their evolution. Even less research has considered their future development trends. Henan Province is the main birthplace of ancient Chinese civilization; it has numerous cultural relics, classical gardens, and natural landscapes, such as the Longmen Grottoes in Luoyang and Yin Ruins in Anyang, which are world-class cultural heritage sites, as well as four world geological parks. These rich tourism resources are very attractive to domestic and foreign tourists. However, tourists have higher requirements for a comfortable external environment, which will often be considered when choosing a tourism destination and time to visit [39,40,41]. Therefore, it is very important to evaluate the climate comfort of tourist destinations. At present, few studies exist on climate comfort in Henan Province. Xu Peng et al. evaluated the tourism climate comfort in Henan Province through a fuzzy comprehensive evaluation. The research results only assessed the climate comfort from April to September [42], which limited tourists’ choice of other months. They also did not predict the future development trends, and could not provide a scientific basis for future tourism planning [36,43].
Therefore, this study has the following objectives: (1): to explore the temporal and spatial evolution of TCCI in the study area; (2): to identify the main climate factors affecting TCCI change and explore its internal driving factors; (3): to forecast future development trends based on past TCCI changes. These can provide tourists and tourism planners with scientific tourism climate information and promote the development of local tourism.
2. Materials and Methods
2.1. Study Area
Henan Province is located in the middle of the Chinese mainland, in the transition zone between the second step and the third step in China, so it presents a distribution pattern of high in the west and low in the east (Figure 1). The plain area of the whole province accounts for more than half (55.7%) of the total area, so the average altitude is low. The northern part of Henan Province is located in the warm temperate zone (accounting for 70% of the province’s area), and the southern part is across the subtropical zone (accounting for 30% of the province’s area). It has a continental monsoon climate that transits from the northern subtropical zone to the warm temperate zone. In addition, significant differences in terms of latitude and terrain forms are noticed in the region. It has complex and diverse characteristics due to the frequent occurrence of extreme climate events caused by global warming. The province’s average temperature is 10.5–16.7 °C, the average annual precipitation is 407.7–1295.8 mm, and the average annual sunshine duration is 1285.7–2292.9 h. Henan Province is rich in water resources and animal and plant resources; the natural scenery is integrated with historical and cultural heritage forestry and other resources, coupled with a rich historical and cultural heritage and relics, so it has great potential for tourism development. As of September 2019, the province had 495 national A-level scenic spots, including 135 A-level scenic spots, ranking fourth among 31 provinces and cities, with 164 4A-level scenic spots, 225 3A-level scenic spots, 91 2A-level scenic spots, and 2 1A-level scenic spots. Since 2008, Henan Province has been established as a province for tourism, and the number of tourists and tourism income have shown a rapid growth trend.
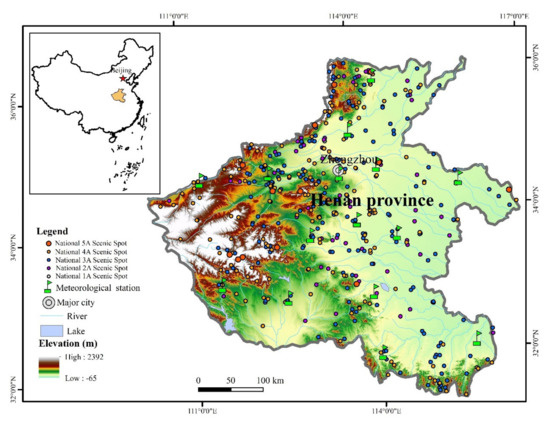
Figure 1.
Overview of the study area.
2.2. Data Collection
The climate data involved in the TCCI mainly come from “China Meteorological Data Service Center” (http://data.cma.cn accessed on 29 January 2021); the daily and monthly data of the mean temperature, total precipitation, mean relative humidity, mean sunshine duration, and mean wind speed from 1960 to 2020 taken from 15 meteorological stations in Anyang, Baofeng, Gushi, Kaifeng, Mengjin, Nanyang, Sanmenxia, Shangqiu, Xihua, Xixia, Xinxiang, Xinyang, Xuchang, Zhengzhou, and Zhumadian in Henan Province were used for the statistical analysis.
The meteorological data of future scenarios were derived from the forecast scenarios provided by CMIP5, which mainly included three climate scenarios: RCP 2.6 (low emission scenario), RCP 4.5 (intermediate emission scenario), and RCP 8.5 (high emission scenario), representing greenhouse gas emissions from 2020 to 2100 (https://esgf-node.llnl.gov/projects/cmip5/ accessed on 5 April 2021). The data set was processed from the raw data of 28 General Cycle Models (GCM), using the bias-corrected spatial decomposition method [44] (Brekke et al. 2013). In order to give consideration to high and low emission scenarios, we used RCP 4.5 simulation data under this data set as the basic data of this study. The digital elevation model (DEM) data were from the geospatial data cloud (http://www.gscloud.cn accessed on 15 July 2019), with a spatial resolution of 90 m × 90 m, which was downloaded and spliced.
The list of A-level tourist attractions in Henan Province was taken from the data, as of September 2019, published by the Henan Provincial Department of Culture and Tourism on 6 November 2019 (https://hct.henan.gov.cn/2019/11-06/992871.html accessed on 10 May 2021). The tourism statistics of Henan Province were from the Henan Provincial Bureau of Statistics (http://www.ha.stats.gov.cn/tjfw/tjgb/qstjgb/ accessed on 10 May 2021). Other tourism-related data were from the China Tourism Statistics Yearbook.
2.3. Evaluation Method of the TCCI
Climate comfort refers to climatic conditions in which people experience normal physiological processes and feel comfortable without taking any heat- or cold-dispelling measures [45]. In this study, the TCCI, which is composed of the THI, WEI and ICL, was used to scientifically evaluate the temporal and spatial evolution of tourism climate comfort in Henan Province [46].
The THI reflects the heat exchange between the human body and the surrounding environment as a comprehensive effect of temperature and humidity. Considering the influence of humidity on temperature, this model can consider tourists’ somatosensory experiences more accurately. The equation for the model is as follows [47]:
In Equation (1), T is the temperature (°C), and RH is the relative humidity (%).
The WEI considers the influence of wind speed on the heat dissipation of the human body surface. Compared with the wind-chill index [48], this model considers the influence of sunshine duration on the somatosensory experience, which has a higher degree of restoration for tourists’ somatosensory system. This index indicates the heat dissipation per unit area of body surface when the skin temperature is 33 °C. The equation of the model is as follows:
In Equation (2), T is the temperature (°C); V is the wind speed (m/s); and S is the sunshine duration (h/d).
The ICL is a model that reflects how tourists change their clothes according to the external environment. The model considers the latitude of the tourist destination, the change of the sun height with the seasons, the metabolism of the human body, and clothing materials, which makes the assessment of how the human body reflects the surrounding environment more authentic and scientific. The equation for the model is as follows [49]:
In Equation (3), T is the ambient temperature (°C); and H represents 75% of the metabolic rate of the human body. The metabolic rate under light activity is taken as H = 87 W/m2, indicating the absorption of solar radiation by the human body. For black clothing, 0.06 is taken as the maximum value in most cases, and 0.06 was taken in this paper. R represents solar radiation (W/m2) received per unit area of land of vertical sunlight; α is the solar altitude angle change with the latitude. We set the latitude of a certain place by β: in summer α = 90 − β + 23°26′, in winter α = 90 − β − 23°26′, and in spring and autumn α = 90 − β. V is the wind speed (m/s).
The TCCI determined the weight of each index (THI, WEI and ICL) by an expert scoring and analytic hierarchy process, and established a comprehensive comfort index of tourism climate suitable for the study area. Henan Province is mainly located in the North China Plain, with a low altitude, high temperature, low wind speed, and long hot season, so the THI accounted for a larger proportion in the TCCI in this case. The equation for this model is as follows:
In Equation (4): NTHI, NWEI, and NICL represent the assignment values of the THI, WEI, and ICL, respectively (Table 1). According to the assignment of the THI, WEI and ICL, the comfort scope of the TCCI was determined, and the standards were as follows: −1 ≤ TCCI ≤ 0, comfortable; −3 ≤ TCCI ≤ −2, uncomfortable; −4 ≤ TCCI ≤ −3, extremely uncomfortable.

Table 1.
Grading standard and assignment of the THI, WEI and ICL.
2.4. Statistical Analysis Method
The convergence and divergence of climate comfort in different regions of the study area were explored using the hierarchical clustering method. Hierarchical clustering is an analysis method based on the principle of minimizing the distance between samples within groups and maximizing the distance between groups, and grouping sample data according to the similarity between data. Pearson correlation analysis was used to identify the relationship between the TCCI and the main climate factors. The hierarchical clustering analysis and Pearson correlation analysis, using the coagulation method, were completed in SPSS 22.0.
Kriging spatial interpolation analysis is a method for linear unbiased, optimal estimation and estimation of unknown sample points based on the relevant variable data of known points in the research area, and the use of a variogram and structural analysis based on the structural characteristics of the variogram [50]. According to the spatial distribution of meteorological stations in the study area, taking the TCCI as the attribute, the spatial distribution of the TCCI in the study area was simulated by the Kriging spatial interpolation analysis method using Arc GIS 10.2 software.
Principal Component Analysis (PCA) is a multivariate statistical method that uses the idea of dimension reduction to transform multiple indicators into a few factors for analysis. Firstly, through the KMO and Bartlett sphericity test, the companion probability of the Bartlett sphericity test was p < 0.05, the eigenvalues and eigenvectors of the principal components of the selected TCCI and climate factors were determined, and the key principal components were selected according to the eigenvalues > 1.
Rescaled range (R/S) analysis is a time series analysis method based on the affine fractal, which is usually used to analyze the fractal features and long-term memory process of time series [51]. Different Hurst coefficients (0 < H < 1) correspond to different situations. When H = 0.5, there is no dependence between them, and future changes are uncertain. When 0.5 < H < 1, it indicates that the future trend is consistent with the past; that is, the process has persistence or a long-term correlation, and the H value is close to 1, which indicates that the persistence of the past climate change trend is stronger. When 0 < H < 0.5, it indicates that the overall trend in the future is opposite to the past; that is, a mean recovery process occurs, and the fractal Brownian motion can be used to describe the time series.
3. Results
3.1. Temporal and Spatial Variation of the TCCI in Henan Province
Judging from the monthly changes of the TCCI (Figure 2), the months when Henan Province reaches the best comfort level are mainly April and October, and May and September are also relatively close to the top comfort level, especially May. From a seasonal point of view, the comfortable seasons are mainly the last two months of spring (April and May) and the first two months of autumn (September and October); the comfort level is low in summer and winter, especially in the hottest month (July) and the coldest month (January). The interannual variation of the TCCI in Henan Province generally shows an upward trend (Figure 3). The most obvious upward trend is in the Xixia area (p < 0.01), and the least significant is in the Xihua area (p = 0.188). From the average comprehensive comfort level over many years, the Xixia area is still the highest (TCCI = −1.608), and the Shangqiu area is the lowest (TCCI = −1.816). In order to explore the change of the TCCI in daily resolution, we obtained statistical information on the number of days when the TCCI in each region of the study area reached the comfort level in monthly and annual changes (Figure 4). The results showed that, except for the two main tourist window periods of spring and autumn, there are different numbers of comfortable days in other months; there was an obvious “double peak” change on the whole. In terms of interannual changes, the number of days when the TCCI reached the comfort level from 1960 to 2020 showed an increasing trend, which showed that the TCCI in Henan Province is constantly improving.
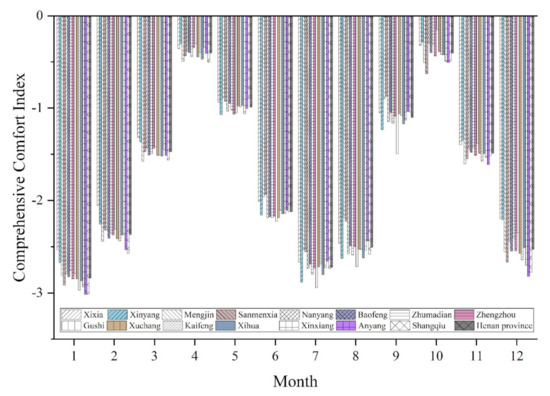
Figure 2.
Monthly variation of the TCCI of each meteorological station and the whole province (average of all stations) in Henan Province.
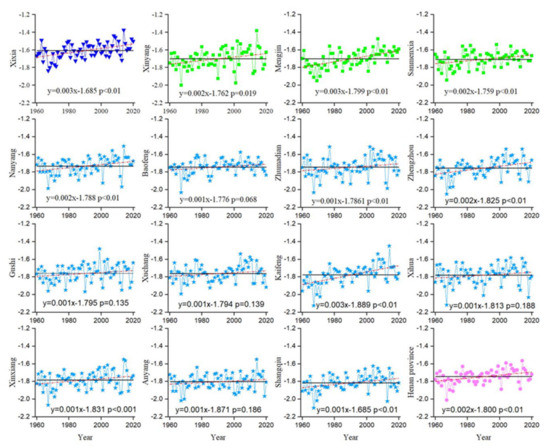
Figure 3.
Interannual variation of the TCCI of meteorological stations in Henan Province and the whole province (average of all stations).
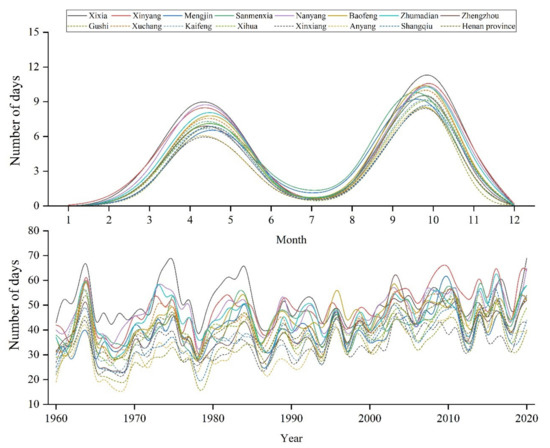
Figure 4.
Statistics related to the monthly and annual days when the TCCI reaches the comfort level at various meteorological stations in Henan Province and in the whole province (average of all stations).
In order to observe the change of the TCCI in the study area more intuitively, the method of spatial interpolation was used to show the spatial distribution change of its temporal change (Figure 5). From the perspective of monthly changes, each month has its own comfort areas, and the size of the comfort areas is different. Overall, the comfort areas in cold months are mainly distributed in the south of the study area, and the comfort areas in hot months are mainly distributed in the high-altitude areas in the west and north of the study area. It is worth noting that there is no comparability between months, because their respective classification intervals were different according to their respective value scopes. From the perspective of interannual changes, we divided 1960–2020 into six eras, in which the last era, 2020, was included (Figure 6). According to the annual average value of each era, the grade of the TCCI was divided into eight, from high to low. The results showed that the grade of the TCCI in the study area is constantly improving as a whole, and the area occupied by a high grade is becoming larger with the passage of time. The spatial distribution showed that the grade gradually increases from northeast to southwest.

Figure 5.
The monthly spatial variation of the TCCI in Henan Province is based on the observation data of meteorological stations from 1960 to 2020. (Note: TCCI of each month is divided into ten grades, and the value range of each month is different. Therefore, comparisons between months cannot be made according to the colors in the picture.).
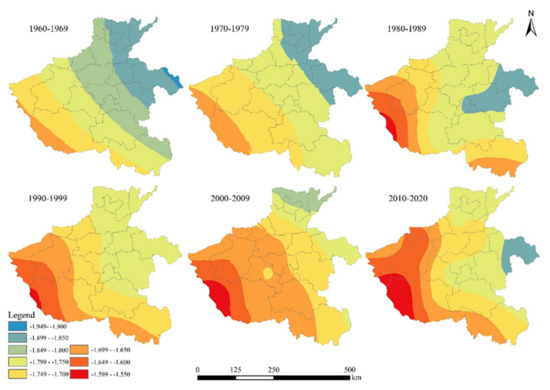
Figure 6.
Spatial variation of the TCCI in Henan Province on 10-year scale.
3.2. The Relationship between Different Types of TCCI Changes and Climate Factors Based on Hierarchical Classification
The TCCI of 15 meteorological stations involved in the study area was divided into three levels: high comfort level, medium comfort level, and low comfort level (Figure 7). Through the exploration of the classification results, it was found that the results of hierarchical classification were very similar to those of classification according to equal interval altitudes (Table 2), but their corresponding grades did not match. With the increase in altitude grades, the TCCI presented a low–high–low distribution, which may indicate that the TCCI has a certain threshold for the change of altitude.
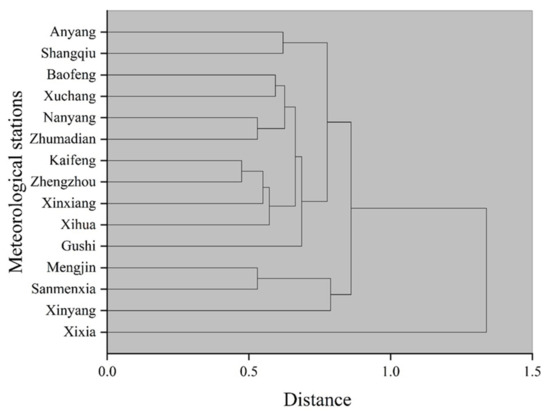
Figure 7.
Hierarchical clustering of the TCCI at various meteorological stations in Henan Province.

Table 2.
Hierarchical clustering and altitude equal interval classification results of the TCCI of meteorological stations in Henan Province.
In order to clarify the main climate factors affecting these three TCCI changes in the study area, we calculated the Pearson correlation coefficient between them (Figure 8). The results showed that the mean temperature, relative humidity, and sunshine duration involved had different degrees of influence on the changes of the TCCI at different levels, while the mean wind speed had no regular or significant correlation with the TCCI. The relationship between the mean temperature and the TCCI showed a positive correlation to negative correlation and then a positive correlation during the year, and the relationship between the mean sunshine duration and TCCI was similar to that of the mean temperature. However, the mean relative humidity showed the opposite change (negative correlation to positive correlation and then to negative correlation). This indicates that the change of the TCCI in the study area is affected by the trade-off between the mean temperature and mean relative humidity.
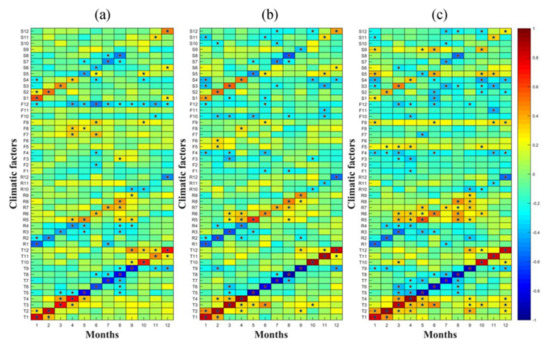
Figure 8.
The correlation analysis between the TCCI (a–c denote TCCI–high, TCCI–middle, TCCI–low, respectively) and climate factors. The pentagram indicates that the correlation results reached a 95% significance level. T, R, F and S represent the mean temperature, mean relative humidity, mean wind speed and mean sunshine duration, respectively.
3.3. Future Development Trends of the TCCI and Climate Factors in Henan Province
In order to explore the future development trend of monthly changes of different grades of the TCCI in the study area, we predicted the slope (K) of the annual change time series of the TCCI in each month, and the Hurst index (H) of their future changes (Table 3). The results showed that the monthly variation of the TCCI of different grades showed an upward trend, except for May, July, and September with TCCI–high, and May, June, and September with TCCI–middle and TCCI–low. The mean temperature of different grades showed an upward trend in monthly variation, while the mean relative humidity showed a downward trend. Except for January and June with TCCI–high and TCCI–low, and January, June, and August with TCCI–middle, it showed an upward trend. The R/S analysis of time series of different levels of the TCCI and climate factors showed that the Hurst index (H) of October and November of R-high, January of R-middle, November of TCCI–low, and November of R-low were less than 0.5; this shows that their development in the future presents an opposite trend, and other series will last for different times, according to the size of H, in the future.

Table 3.
Development trend of the monthly variation of different grades of the TCCI in Henan Province in the future.
4. Discussion
4.1. Comparison of Evaluation Results with Other Results in the Study Area
This study evaluated the tourism climatic conditions in Henan Province, central China. The results showed that the climate comfort level in the study area is the highest in the last two months of spring and the first two months of autumn, especially in April and October. Our results are basically consistent with the comfort window period of the impact of climate change on the Beijing plant tourism season [9], which has a “double peak” change, with the highest comfort level in spring and autumn and a lower comfort level in summer and winter. However, there are differences between the comfort level in summer and the most suitable time points in the two comfort window periods. Compared with our research results, the most suitable time points of the window period in this study are later in spring and earlier in autumn, and the comfort level in summer is also higher. This may be caused by the large latitude difference between the two study areas. At the same time, our results and the seasonal changes of China’s tourism comfort index (TCI) from 1981 to 2010, and the tourism climate comfort period (TCCP) in Henan Province, showed a similar pattern of a high comfort level in spring and autumn and low comfort level in summer and winter [36,52].
Our research results were quite different from those based on the fuzzy comprehensive evaluation model [42]. In this study, the climate comfort in June and August is the highest, and the comfort in summer is significantly higher than that in spring and autumn. This result may be due to the fact that the evaluation method used does not take into account the human body, and the active adjustment made by human beings to environmental changes [53,54,55].
Unlike many other studies, our research involved the changes of eras, years, months, and days, which can more comprehensively show the changes of the TCCI in the study area within various time resolutions. The spatial distribution of climate comfort in chronology and each month of the year was displayed, which is helpful for tourists and tourism planners engaging in tourism and planning, providing a scientific basis for decision making. Unfortunately, neither our index nor other indicators of climate comfort take into account air pollution, which has a greater impact on tourist travel. The frequency and duration of sudden weather events can also have a significant impact on actual travel. However, the TCCI does not reflect the impact of such events on climate comfort. With today’s fast-paced lifestyle, few people can freely choose their travel time; holidays are often closely related to the times stipulated by the state and schools [43,56]. For Chinese tourists, winter and summer vacation are the two longest travel periods. At the same time, we assessed the number of inbound tourists in China from 1992 to 2018 (Figure 9). The results showed that, besides April and October, which have the highest level of climate comfort, the number of inbound tourists is also relatively high, and December (8.66%) and August (8.72%), which represent the winter and summer vacation, also account for relatively high percentages. Therefore, it is necessary to present the climate comfort in all months in space, to serve as a reference for tourists to choose their destinations. However, many studies only show the most suitable months or season, which is not conducive to supporting tourists’ choice of travel place and time [29,57,58].
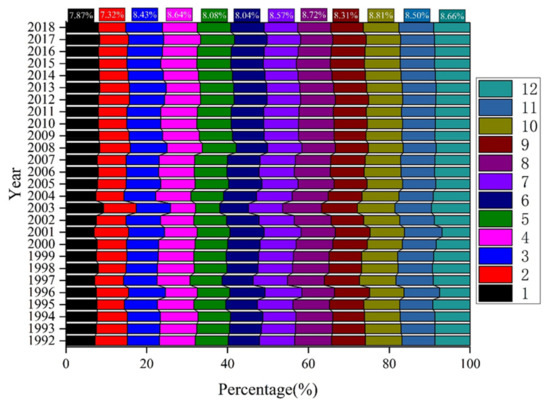
Figure 9.
Monthly percentage of inbound tourists in China from 1992 to 2018.
4.2. Analysis of Driving Forces of the TCCI in the Study Area
The change of the TCCI in tourist destinations is influenced by many factors, including the mean temperature, precipitation, relative humidity, wind speed, etc., which in addition to the climate parameters used to quantify the index, are also affected by factors such as the location of tourist destinations, altitude, vegetation, cloud cover, etc. Therefore, studies have increasingly also considered these factors in the process of evaluating climate comfort [12,30,59,60]. In our study, the hierarchical classification method was used to classify the climate comfort of all stations in the study area, and the classification results were very similar to those based on different altitude gradients (Figure 7; Table 2). It is worth noting that Xinyang meteorological station should be considered low altitude according to the division of equal altitude intervals, but its TCCI changes were of the same type as high altitude, which may have been caused by local habitats. This shows that the change of the TCCI in the study area is affected by altitude factors. After statistical analysis of the multi-year average of the TCCI at various meteorological stations, we found that the TCCI does not increase with the increase in altitude but has the altitude distribution pattern of the highest comfort at middle altitude, the lowest at low altitude, and the middle at high altitude (Table 2). In the past, similar studies only classified the meteorological stations involved, but did not explain the relationship between the classification results and the TCCI, instead only describing the spatial distribution of the classification results [37]. However, it was found that the thermal comfort level decreases with the increase in altitude in the classification of thermal comfort changes in the Qinghai–Tibet Plateau [61]. These results illustrate the influence of altitude on the research results. It is worth noting that the difference between the two may also be caused by the different indicators studied. However, there is no obvious difference in the response of different types of the TCCI to climate factors, mainly showing different significant relationships with temperature, relative humidity, and sunshine duration in time (Figure 8). This may be due to the THI accounting for the largest weight in the evaluation model. In order to further explore the internal driving factors of different TCCI types changing with time, we found the spatial correlation between different types of climate comfort indices and sea surface temperature (SST) (Figure 10). The results suggested that these three types of TCCI changes are all affected by the sea surface temperatures of the Pacific, Indian, and Atlantic Ocean, especially the high and medium levels of TCCI types. The study found that most of the Indian Ocean and the western Pacific region is the key region affecting the climate of China and East Asia [62]. At the same time, many studies have also found that the thermal state of the North Atlantic and the convective activity over it play a very important role in modulating climate change in the surrounding areas, and even in East Asia, through the Atlantic Interdecadal Oscillation and the North Atlantic Oscillation [58,63]. This means that the change of the TCCI in the study area are affected by the large-scale atmospheric–oceanic variability.
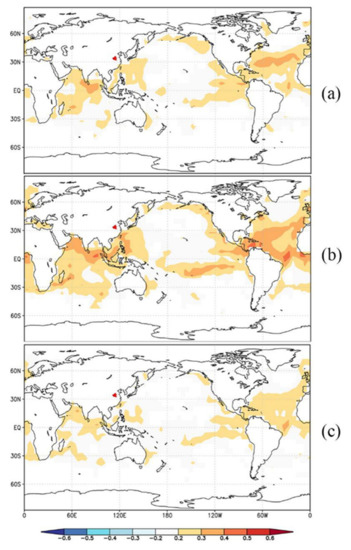
Figure 10.
Spatial correlation between the TCCI (a–c denote TCCI–high, TCCI–middle, TCCI–low, respectively) and SST.
4.3. Future Development of the TCCI in the Study Area
Tourism is closely related to the climatic conditions of tourist destinations, especially outdoor tourism based on nature, which is more affected by climatic factors [64]. Different people pay different amounts of attention to the time scale of climate change. Tourists pay more attention to short-term changes (daily weather changes), while for those who wish to choose a livable environment and tourism developers and planners, long-term climate changes are often more interest (climate changes on the scale of years and centuries), because the latter’s activities involve greater economic costs and manpower. Climate change characterized by global warming at this stage has become an indisputable fact [10], and the sustainability of this warming trend in the future has attracted the attention of many scholars actively seeking possible adaptation measures [43,65,66]. It will be very important to pay attention to the change of the TCCI in the study area in the future, under the conditions of global warming.
In order to explore the future development trend of monthly changes of different grades of the TCCI in the study area, their correlations should be combined in addition to looking at their slope changes, so as to understand the future change trend of inconsistent changes with time. This would make the predicted results more accurate (Table 4). If the slope, correlation coefficient, and H between them are consistent, the future development of the TCCI in that month would show a definite trend (rising or falling). If any one aspect is not satisfied, the future development of the TCCI in the current month can be considered uncertain. After statistical analysis, we found that the TCCI–high will show an increasing trend in five months (February–April, June and December), a decreasing trend in three months (May, July, and September), and have four uncertain months (January, August, and October–November). TCCI–middle will show an increasing trend in seven months (February–April, August, and October–December), a downward trend in two months (May and September), and have three uncertain months (January, June, and July). TCCI–low will show an increasing trend in three months (February, March, and April), a decreasing trend in three months (May, July, and September), and have six uncertain months (January, June, August, and October–December) in the future. This indicates that there are great differences in the monthly variation trends of the TCCI of different grades in the future.

Table 4.
Forecast of monthly variation of the TCCI of different grades in Henan Province in the future.
In order to verify the accuracy of our prediction results, we used the change trend of climate data (mean temperature and relative humidity) from 2021 to 2100 to verify our prediction results (Table 4). The results showed that our prediction results have high accuracy, especially in the prediction of declining months; the trends are consistent with our prediction results. In the prediction of rising months, March and June in TCCI–high still showed an increasing trend, February and April in TCCI–middle were inconsistent with the prediction results, and only March in TCCI–low was consistent with the prediction results. The reason the temporal change trend of future climate simulation data was inconsistent with our prediction results may be that the spatial resolution of the scenario simulation data was low, ignoring the influence of small terrain niches. In addition, relative humidity itself is an index with low stability, which is affected by many factors. Therefore, our prediction of future climate comfort cannot be quantified, but can only be predicted in the direction of its evolution.
5. Conclusions
In order to provide a reliable scientific basis for tourists and planners, this paper used the TCCI to evaluate the level of tourism climate comfort in the study area, analyze its temporal and spatial dynamic changes, identify the main controlling climate factors, and predict the future development trends. The analysis results showed the following: (1) the monthly variation of the TCCI showed that the comfort level was the highest in the last two months of spring (April and May) and the first two months of autumn (September and October), and the monthly distribution of comfort was lower in other months. This distribution is highly consistent with the monthly distribution of the number of inbound tourists in China for many years. In terms of interannual changes, the overall comfort level showed a trend of improvement, among which Xixia Meteorological Station had the most obvious upward trend, and also the highest average comfort level and the smallest fluctuation scope, Xihua Meteorological Station had the slowest upward speed, and Shangqiu Meteorological Station had the lowest average comfort level. The distribution of the TCCI days also presented a “double peak” pattern, which indicates that there is a suitable time for traveling even in months with a low comfort level. This result was rarely found in previous studies. (2) The TCCI level changed with time in space, the comfort level of each region increased, and the area with a high comfort level also increased, and the overall comfort level gradually increased from northeast to southwest. As the available travel time becomes more and more fragmented, the spatial change of the TCCI every month is very important. (3) The hierarchical classification of the TCCI and climate factors was carried out, and the principal component series was extracted to identify the change law between them. The results showed that the mean temperature and relative humidity were the main climate factors controlling the change of climate comfort, and the relationship between the mean temperature and the TCCI was from a positive correlation to negative correlation, and then to a positive correlation with time, while the relationship between the TCCI and relative humidity was opposite to that of the mean temperature. This showed that the trade-off between the mean temperature and relative humidity affects the comfort level of this study area. At the same time, we found that this variation law is dominated by large-scale atmospheric–oceanic variability. (4) Compared with precedent studies, the results of our study are closer to the actual changes of climate comfort in the study area, and have been verified in the national related research. (5) According to the temporal change trend of the TCCI and climate factors, their Hurst index, and their correlation, the future TCCI change trend of the study area was predicted, and the future scenario simulation climate data were used for verification. The results showed that our prediction results have high accuracy. Meanwhile, it also provides a reliable forecasting method for the future research.
Author Contributions
Conceptualization, methodology, writing, and editing: J.Z.; the analysis of the data and the revision of the manuscript: J.Z. and S.W. All authors have read and agreed to the published version of the manuscript.
Funding
This research was supported by the Henan Soft Science Research Project (No. 192400410292); Henan Higher Education Key Research Project of the Education Department of Henan Province (No. 20A630031); Xinyang Soft Science Research Project (No. 20190039).
Institutional Review Board Statement
Not applicable.
Informed Consent Statement
Not applicable.
Data Availability Statement
Data is contained within this article.
Acknowledgments
Thanks to the anonymous reviewers for helpful suggestions and comments.
Conflicts of Interest
The authors declare no conflict of interest.
References
- Scott, D.J.; Lemieux, C.J.; Malone, L. Climate services to support sustainable tourism and adaptation to climate change. Clim. Res. 2011, 47, 111–122. [Google Scholar] [CrossRef] [Green Version]
- United Nations World Tourism Organization. Tourism Towards 2030; United Nations World Tourism Organization: Madrid, Spain, 2011. [Google Scholar]
- Martin, B.G. Weather, climate and tourism-A geographical perspective. Ann. Tour. Res. 2005, 32, 571–591. [Google Scholar] [CrossRef]
- Rutty, M.; Scott, D. Comparison of Climate Preferences for Domestic and International Beach Holidays: A Case Study of Canadian Travelers. Atmosphere 2016, 7, 30. [Google Scholar] [CrossRef] [Green Version]
- Sobhani, B.; Zengir, V.S. Evaluation and zoning of environmental climatic parameters for tourism feasibility in northwestern Iran, located on the western border of Turkey. Model. Earth Syst. Environ. 2020, 6, 853–864. [Google Scholar] [CrossRef]
- Becker, S. Bioclimatological rating of cities and resorts in South Africa according to the climate index. Int. J. Climatol. 2000, 20, 1403–1414. [Google Scholar] [CrossRef]
- Hernández-Lobato, L.; Solis-Radilla, M.M.; Moliner-Tena, M.A.; Sanchez-Garcia, J. Tourism destination image, satisfaction and loyalty: A study in Ixtapa-Zihuatanejo, Mexico. Tour. Geogr. 2006, 8, 343–358. [Google Scholar] [CrossRef]
- Olya, H.G.T.; Alipour, H. Risk assessment of precipitation and the tourism climate index. Tour. Manag. 2015, 50, 73–80. [Google Scholar] [CrossRef]
- Zang, Y.; Dai, J.; Tao, Z.; Wang, H.; Ge, Q. Effects of Climate Change on the Season of Botanical Tourism: A Case Study in Beijing. Adv. Meteorol. 2020, 2020, 1–11. [Google Scholar] [CrossRef]
- IPCC. Climate Change 2013: The Physical Science Basis: Summary for Policymakers. Working Group I Contribution to the IPCC Fifth Assessment Report; Cambridge University Press: Cambridge, UK, 2013. [Google Scholar]
- Cetin, M. Climate comfort depending on different altitudes and land use in the urban areas in Kahramanmaras City. Air Qual. Atmos. Health 2020, 13, 991–999. [Google Scholar] [CrossRef]
- Rossello-Nadal, J. How to evaluate the effects of climate change on tourism. Tour. Manag. 2014, 42, 334–340. [Google Scholar] [CrossRef]
- Scott, D.; Hall, C.M.; Gossling, S. Global tourism vulnerability to climate change. Ann. Tourism Res. 2019, 77, 49–61. [Google Scholar] [CrossRef]
- Hewer, M.J.; Gough, W.A. Thirty years of assessing the impacts of climate change on outdoor recreation and tourism in Canada. Tour. Manag. Perspect. 2018, 26, 179–192. [Google Scholar] [CrossRef]
- Beccali, M.; Strazzeri, V.; Germana, M.L.; Melluso, V.; Galatioto, A. Vernacular and bioclimatic architecture and indoor thermal comfort implications in hot-humid climates: An overview. Renew. Sustain. Energ. Rev. 2018, 82, 1726–1736. [Google Scholar] [CrossRef]
- Vanos, J.K.; Kosaka, E.; Iida, A.; Yokohari, M.; Middel, A.; Scott-Fleming, J.; Brown, R.D. Planning for spectator thermal comfort and health in the face of extreme heat: The Tokyo 2020 Olympic marathons. Sci. Total Environ. 2019, 657, 904–917. [Google Scholar] [CrossRef]
- Fletcher, J.; Higham, J.; Longnecker, N. Climate change risk perception in the USA and alignment with sustainable travel behaviours. PLoS ONE 2021, 16, e0244545. [Google Scholar] [CrossRef]
- Hoppe, P. The physiological equivalent temperature-a universal index for the biometeorological assessment of the thermal environment. Int. J. Climatol. 1999, 43, 71–75. [Google Scholar] [CrossRef]
- Wu, Y.; Graw, K.; Matzarakis, A. Comparison of Thermal Comfort between Sapporo and Tokyo-The Case of the Olympics 2020. Atmosphere 2020, 11, 444. [Google Scholar] [CrossRef]
- Blazejczyk, K.; Epstein, Y.; Jendritzky, G.; Staiger, H.; Tinz, B. Comparison of UTCI to selected thermal indices. Int. J. Climatol. 2012, 56, 515–535. [Google Scholar] [CrossRef] [PubMed] [Green Version]
- Zeng, D.; Wu, J.; Mu, Y.; Deng, M.; Wei, Y.; Sun, W. Spatial-Temporal Pattern Changes of UTCI in the China-Pakistan Economic Corridor in Recent 40 Years. Atmosphere 2020, 11, 858. [Google Scholar] [CrossRef]
- Lin, T.P.; Matzarakis, A. Tourism climate and thermal comfort in Sun Moon Lake, Taiwan. Int. J. Biometeorol. 2008, 52, 281–290. [Google Scholar] [CrossRef]
- Matzarakis, A.; Froehlich, D.; Bermon, S.; Adami, P.E. Visualization of Climate Factors for Sports Events and Activities-The Tokyo 2020 Olympic Games. Atmosphere 2019, 10, 572. [Google Scholar] [CrossRef] [Green Version]
- Mieczkowski, Z. The tourism climatic index-a method of evaluating world climates for tourism. Can. Geogr.-Geogr. Can. 1985, 29, 220–233. [Google Scholar] [CrossRef]
- Masoudi, M. Estimation of the spatial climate comfort distribution using tourism climate index (TCI) and inverse distance weighting (IDW) (case study: Fars Province, Iran). Arab. J. Geosci. 2021, 14, 5. [Google Scholar] [CrossRef]
- Humphreys, M.A.; Nicol, J.F. Understanding the adaptive approach to thermal comfort. Ashrae Trans. 1998, 104, 991–1004. [Google Scholar]
- Lin, T.P. Thermal perception, adaptation and attendance in a public square in hot and humid regions. Build. Environ. 2009, 44, 2017–2026. [Google Scholar] [CrossRef]
- Rutty, M.; Scott, D. Thermal range of coastal tourism resort microclimates. Tour. Geogr. 2014, 16, 346–363. [Google Scholar] [CrossRef]
- Salata, F.; Golasi, I.; Proietti, R.; Vollaro, A.D.L. Implications of climate and outdoor thermal comfort on tourism: The case of Italy. Int. J. Biometeorol. 2017, 61, 2229–2244. [Google Scholar] [CrossRef]
- Zhou, Y.; Wang, J.; Grigorieva, E.; Egidarev, E.; Zhang, W. Comprehensive Spatio-Temporal Analysis of Travel Climate Comfort Degree and Rainstorm-Flood Disaster Risk in the China-Russia Border Region. Sustainability 2020, 12, 3254. [Google Scholar] [CrossRef] [Green Version]
- Xi, T.; Wang, Q.; Qin, H.; Jin, H. Influence of outdoor thermal environment on clothing and activity of tourists and local people in a severely cold climate city. Build. Environ. 2020, 173, 106757. [Google Scholar] [CrossRef]
- Salata, F.; Golasi, I.; Ciancio, V.; Rosso, F. Dressed for the season: Clothing and outdoor thermal comfort in the Mediterranean population. Build. Environ. 2018, 146, 50–63. [Google Scholar] [CrossRef]
- Lai, D.; Chen, Q. A two-dimensional model for calculating heat transfer in the human body in a transient and non-uniform thermal environment. Energy Build. 2016, 118, 114–122. [Google Scholar] [CrossRef]
- Yu, Z.K.; Sun, G.N.; Luo, Z.W.; Feng, Q. An analysis of climate comfort degree and tourism potential power of cities in Northern China in summer to the north of 40° N. Nat. Resour. J. 2015, 30, 327–339. (In Chinese) [Google Scholar]
- Zare, S.; Hasheminejad, N.; Shirvan, H.E.; Hemmatjo, R.; Sarebanzadeh, K.; Ahmadi, S. Comparing Universal Thermal Climate Index (UTCI) with selected thermal indices/environmental parameters during 12 months of the year. Weather Clim. Extreme 2018, 19, 49–57. [Google Scholar] [CrossRef]
- Yu, D.D.; Li, S.; Guo, Z.Y. Evaluating the Tourist Climate Comfortable Period of China in a Changing Climate. Adv. Meteorol. 2020, 2020, 8886316. [Google Scholar] [CrossRef]
- Cheng, Q.Q.; Zhong, F.L. Evaluation of tourism climate comfort in the Grand Shangri-La region. J. Mt. Sci.-Engl. 2019, 16, 1452–1469. [Google Scholar] [CrossRef]
- Liu, S.; Long, B.; Pan, Z.; Lun, F.; Song, Y.; Yuan, W.; Huang, N.; Zhang, Z.; Ma, S. Evaluation of Climatic Comfort of Living Environment based on Age Differentials in Beijing-Tianjin-Hebei Area. Ecosyst. Health Sustain. 2020, 6, 1–12. [Google Scholar] [CrossRef]
- Yu, G.; Schwartz, Z.; Walsh, J.E. Effects of Climate Change on the Seasonality of Weather for Tourism in Alaska. Arctic 2009, 62, 443–457. [Google Scholar] [CrossRef]
- Eugenio-Martin, J.L.; Campos-Soria, J.A. Climate in the region of origin and destination choice in outbound tourism demand. Tour. Manag. 2010, 31, 744–753. [Google Scholar] [CrossRef]
- Wilkins, E.; de Urioste-Stone, S.; Weiskittel, A.; Gabe, T. Effects of Weather Conditions on Tourism Spending: Implications for Future Trends under Climate Change. J. Travel. Res. 2018, 57, 1042–1053. [Google Scholar] [CrossRef]
- Xu, P.; Du, M.Z.; Zhang, W. Fuzzy Comprehensive Evaluation for the Tourism Climate Comfort Degree in Henan Province. Hennan. Sci. 2020, 38, 1800–1805. (In Chinese) [Google Scholar]
- Kong, Q.; Zheng, J.; Fowler, H.J.; Ge, Q.; Xi, J. Climate change and summer thermal comfort in China. Theor. Appl. Climatol. 2019, 137, 1077–1088. [Google Scholar] [CrossRef] [Green Version]
- Brekke, L.; Thrasher, B.; Maurer, E.; Pruitt, T. Downscaled CMIP3 and CMIP5 Climate and Hydrology Projections: Release of Downscaled CMIP5 Climate Projections, Comparison with Preceding Information, and Summary of User Needs; US Department of the Interior, Bureau of Reclamation, Technical Services Center: Denver, CO, USA, 2013. [Google Scholar]
- Ma, L.J.; Sun, G.N. Evaluation of climate comfort index for tourism hot-nbspot cities in West China. Arid Land Geogr. 2009, 32, 791–797. (In Chinese) [Google Scholar]
- Cao, W.H.; He, Y.Q.; Li, Z.X.; Wang, S.X.; Wang, C.F.; Chang, L.A. Correlation Analysis Between Climate Comfort Degree and Monthly Variation of Tourists in Lijiang. Sci. Geogr. Sin. 2012, 32, 1459–1464. (In Chinese) [Google Scholar]
- Hu, Y.; Li, P.; Yang, J.G. Applied Meteorology; China Meteorological Press: Beijing, China, 2005. [Google Scholar]
- Siple, P.A.; Passel, C.F. Measurements of dry atmospheric cooling in sub-freezing temperatures. Proc. Am. Philos. Soc. 1945, 89, 177–199. [Google Scholar]
- Defreitas, C.R. Human climates of northern China. Atmos. Environ. 1979, 13, 71–77. [Google Scholar] [CrossRef]
- Haining, R.; Wise, S.; Ma, J. Designing and Implementing Software for Spatial Statistical Analysis in a GIS Environment. J. Geogr. Syst. 2000, 2, 257–286. [Google Scholar] [CrossRef]
- Hsieh, D.A. Chaos and nonlinear dynamics-application to financial-markets. J. Finance 1991, 46, 1839–1877. [Google Scholar] [CrossRef]
- Fang, Y.; Yin, J. National Assessment of Climate Resources for Tourism Seasonality in China Using the Tourism Climate Index. Atmosphere 2015, 6, 183–194. [Google Scholar] [CrossRef] [Green Version]
- Ge, Q.; Kong, Q.; Xi, J.; Zheng, J. Application of UTCI in China from tourism perspective. Theor. Appl. Climatol. 2017, 128, 551–561. [Google Scholar] [CrossRef]
- Kicovic, D.; Vuckovic, D.; Markovic, D.; Jovic, S. Assessment of visitors’ thermal comfort based on physiologically equivalent temperature in open urban areas. Urban Clim. 2019, 28, 100466. [Google Scholar] [CrossRef]
- Rodriguez-Algeciras, J.; Rodriguez-Algeciras, A.; Chaos-Yeras, M.; Matzarakis, A. Tourism-related climate information for adjusted and responsible planning in the tourism industry in Barcelona, Spain. Theor. Appl. Climatol. 2020, 142, 1003–1014. [Google Scholar] [CrossRef]
- Ryan, C.; Sun, M.; Zhang, X.; Li, F.; Li, P.; Gao, J.; Jin, Y.; Lin, H. Illustrations of Chinese tourism research. Tour. Manag. 2017, 58, 229–234. [Google Scholar] [CrossRef]
- Sharmin, T.; Steemers, K. Effects of microclimate and human parameters on outdoor thermal sensation in the high-density tropical context of Dhaka. Int. J. Biometeorol. 2020, 64, 187–203. [Google Scholar] [CrossRef] [Green Version]
- Liu, Y.; Ren, M.; Li, Q.; Song, H.; Liu, R. Tree-ring delta O-18-based July-August relative humidity reconstruction on Mt. Shimen, China, for the last 400 years. Atmos. Res. 2020, 243, 105024. [Google Scholar] [CrossRef]
- Grillakis, M.G.; Koutroulis, A.G.; Tsanis, I.K. The 2 °C global warming effect on summer European tourism through different indices. Int. J. Climatol. 2016, 60, 1205–1215. [Google Scholar] [CrossRef] [PubMed]
- Rutty, M.; Scott, D.; Matthews, L.; Burrowes, R.; Trotman, A.; Mahon, R.; Charles, A. An Inter-Comparison of the Holiday Climate Index (HCI:Beach) and the Tourism Climate Index (TCI) to Explain Canadian Tourism Arrivals to the Caribbean. Atmosphere 2020, 11, 412. [Google Scholar] [CrossRef] [Green Version]
- Li, R.; Chi, X. Thermal comfort and tourism climate changes in the Qinghai-Tibet Plateau in the last 50 years. Theor. Appl. Climatol. 2014, 117, 613–624. [Google Scholar] [CrossRef]
- Cai, Q.; Liu, Y.; Wang, Y.; Ma, Y.; Liu, H. Recent warming evidence inferred from a tree-ring-based winter-half year minimum temperature reconstruction in northwestern Yichang, South Central China, and its relation to the large-scale circulation anomalies. Int. J. Climatol. 2016, 60, 1885–1896. [Google Scholar] [CrossRef]
- Zhu, L.; Cooper, D.J.; Han, S.; Yang, J.; Zhang, Y.; Li, Z.; Zhao, H.; Wang, X. Influence of the Atlantic Multidecadal Oscillation on drought in northern Daxing’an Mountains, Northeast China. Catena 2021, 198, 105017. [Google Scholar] [CrossRef]
- Valizadeh, M.; Khoorani, A. An evaluation of climatic conditions pertaining to outdoor tourism in Bandar Abbas, Iran. Int. J. Biometeorol. 2020, 64, 29–37. [Google Scholar] [CrossRef] [PubMed]
- Zhang, Y.; Xu, Y.; Dong, W.; Cao, L.; Sparrow, M. A future climate scenario of regional changes in extreme climate events over China using the PRECIS climate model. Geophys. Res. Lett. 2006, 33, L24702. [Google Scholar] [CrossRef]
- Leng, G.; Tang, Q.; Huang, S.; Zhang, X. Extreme hot summers in China in the CMIP5 climate models. Clim. Chang. 2016, 135, 669–681. [Google Scholar] [CrossRef]
Publisher’s Note: MDPI stays neutral with regard to jurisdictional claims in published maps and institutional affiliations. |
© 2021 by the authors. Licensee MDPI, Basel, Switzerland. This article is an open access article distributed under the terms and conditions of the Creative Commons Attribution (CC BY) license (https://creativecommons.org/licenses/by/4.0/).