Abstract
Soybean is one of the major crops that is widely cultivated in Northwest China due to its high nutritional and economic value. However, drought has recently become an important factor restricting the growth of soybeans in the arid region of Northwest China and the selection of drought-resistant soybean is of importance for cooperating with drought and improving yield. In this study, three-year soybean field experiments were conducted to test the effects of different water treatments on the soil moisture status and the yield of two varieties of soybeans (Longhuang1 (LH1), Longahuang3 (LH3)). Based on the field data, the soil water content, biomass, LAI, and yield were calibrated and evaluated using the soil-crop system model WHCNS (soil Water Heat Carbon Nitrogen Simulator). The results showed that the nRMSE, NSE, IA, and R2 of the soil water content from two types of soybean, i.e., LH1 (LH3) were 10.98% (9.79%), 0.86 (0.90), 0.96 (0.97), 0.87 (0.90), respectively. The nRMSE, NSE, IA and R2 of the yield of LH1 (LH3) were 19.12% (4.41%), 0.87 (0.99), 0.97 (1.00), 0.98 (0.99), respectively. Scenario simulations of yield and other indicators in two soybean varieties under different irrigation schedules in different hydrological years showed that the maximum yield and II of LH3 are lower than those of LH1, but the higher yield and II of LH1 comes from a larger irrigation amount. Appropriately reducing the number of irrigations in the branching period will not reduce crop yield and may oppositely lead to a small increase in yield and income; reducing the number of irrigations at the end of grouting has no significant impact on yield and income.
1. Introduction
Soybean is an important crop with high nutritional value and economic benefits. Maintaining the stability of soybean production and market supply has become an important aspect to maintain food security [1]. Improving domestic production capacity will be more required under the increasing import risk. Northwest China not only has vast land but also has a long sunshine duration and a large temperature difference between day and night. These factors are conducive to the synthesis of soybean protein. However, the agriculture in arid areas of Northwest China is greatly limited by the shortage of water resources. Therefore, it is very important to formulate a reasonable irrigation schedule and to obtain the highest output through the least water input for the sustainable development of agriculture and economy [2,3,4,5], and it is very meaningful to study the response of soybean with different water management.
In order to improve grain yield and water use efficiency (WUE), a lot of research has been conducted on the optimization of irrigation schedule in arid regions, and it has been found that deficit irrigation is an effective way to increase WUE without reducing yield. Thelen et al. [6] set up five irrigation schedules based on soybean growth stage and soil moisture deficiency to study the impact of irrigation schedules on soybean growth and yield. Based on three years of data, it appears that maximizing soybean yield is dependent on maintaining adequate soil moisture beginning at full boom or beginning pod, provided that the soil water deficit does not exceed 75% prior to that growth stage. Lia et al. [7] compared the effects of different irrigation schedules (rain-fed, complete irrigation and supplementary irrigation) on soybean yield in the semi-arid area of western Jilin Province, China. Compared with rain-fed control, full irrigation and average supplemental irrigation treatments increased soybean yield by 41.0% and 34.7%, respectively. Wood et al. [8] used sensors to study whether soybean irrigation schedules can reduce water consumption while increasing yield and profits. The data showed that the irrigation threshold for maintaining a season was −85 cbar to optimize the yield, with returns above irrigation costs, and irrigation water use efficiency (IWUE) efficiency while reducing withdrawal for soybean irrigation up to 49% relative to the −50 cbar producer standard.
Previous studies on soybean irrigation schedules were mainly based on experiments and observations. These methods are time-consuming and expensive, which is not suitable to guide the production practice of local agricultural producers [9]. Soil-crop system models can be used to quantify the impact of crop water requirements and deficit irrigation on yield, and calculate water productivity. Based on these calculations, an economic analysis of water input and crop yield can be made [10]. However, previous studies on crop models mainly focus on the comparison between models [11,12], the evaluation of model simulation [9,13,14,15,16,17,18], model construction and improvement [10] and applications on regional scales [19,20]. Previous studies on irrigation schedules with soil-crop system models were mostly concentrated in North America. What is more, different varieties of soybeans were rarely used as the main research objects. More research on irrigation schedules suitable for different varieties of soybeans in Northwest China is required.
The objectives of this study were to: (1) validate the capability of the WHCNS (soil Water Heat Carbon Nitrogen Simulator) model to simulate soil moisture, dry matter accumulation, leaf area index (LAI) and yield of two soybean varieties under different irrigation schedules; (2) perform regression analysis between irrigation (as an independent variable) and various drought indicators, e.g., evapotranspiration (ET), evaporation (E), transpiration (T), , , yield and WUE of two soybean varieties; (3) study the effects of less frequent irrigation on the agronomic and economic consequences on these two soybean varieties, in order to provide management guidance for farmers in the arid regions in Northwest China.
2. Materials and Methods
2.1. Experimental Site
In 2017, 2018 and 2020, a three-year field experiment was conducted at Shiyang River Experimental Station for Water-saving in Agriculture and Ecology of China Agricultural University located in Wuwei City, Gansu Province of northwest China (37°520′ N, 102°50′ E, altitude 1581 m). The study area has a continental temperate arid climate, with an average annual temperature of 8 °C, and annual precipitation of 164 mm. The mean annual pan evaporation in this area is approximately 2000 mm. The groundwater depth ranges from 40 to 50 m. The soil parent material comes from the depression of the Shiyang River alluvial fan, and soil properties show a high degree of spatial heterogeneity. The physical and chemical properties of the soil are available in the literature [21,22,23,24].
2.2. Experimental Design
The object of our research is soybeans, the varieties are Longhuang1 (LH1) and Longhuang3 (LH3). The two soybean varieties were introduced by the Dry Land Agriculture Research Institute of Gansu Academy of Agricultural Sciences. The male parents of the two varieties were hefendou 56 and Jindou 42, and the female parents were Fendou 62 and Ludou 4. After years of breeding, the new conventional soybean varieties are suitable for planting in the Gansu Province of China. Two varieties of soybeans were planted on 2 May 2017; 2 May 2018 and 5 May 2020, respectively, with a density of 130,000 plants ha−1, row spacing of 50 cm and plant spacing of 15 cm. They were harvested on 27 September, 26 September and 25 September, respectively. In the three-year field experiment, we adopted the irrigation method of film-mulching drip irrigation. The irrigation system uses a 50 mm PVC pipe to connect with the water outlet, the main pipe is 32 mm PVC pipe, the branch pipe is 32 mm PE pipe, the capillary is drip tape, the diameter of drip tape is 16mm, the flow rate of the dripper is 1.38 L/h, the distance between drippers is 300 mm, drip irrigation The belt spacing is 1 m. There is a drip irrigation belt and two rows of soybeans under each film, and the two rows of soybeans are distributed on both sides of the drip irrigation belt. After soybean sowing, all treatments were irrigated to make the soybean sprout and ensure a consistent emergence rate. After soybean emerging, four water treatments were set up, including one rain-fed treatment and three irrigation treatments (2017: 350 mm, 260 mm, 170 mm; 2018: 305 mm, 155 mm, 75 mm; 2020: 250 mm, 125 mm, 100 mm), as shown in Table 1. Each treatment had three replicates randomly arranged, and the plot was 24 m2.

Table 1.
Irrigation schedules of different treatments in 2017, 2018 and 2020.
In 2017, the irrigation frequency and irrigation amount of I350-9 were in line with the local standards, while the irrigation amounts of other treatments were reduced in proportion under the same irrigation frequency. In 2018, the irrigation times in the late stage of grouting were reduced. In 2020, I250-6 reduced the irrigation times at the branching stage; I125-6 reduced irrigation amount in equal proportion to I250-6, I100-5 continued to reduce irrigation times at the branching stage on the basis of I125-6. It is worth noting that serious lodging occurred in the three plots of I350-9 and I305-8 for LH1, while no serious lodging occurred in other irrigation treatments of LH1 and all irrigation treatments of LH3.
Before sowing, 225 kg·ha−1 of diammonium phosphate (46% P, 18% N) and 225 kg·ha−1 of compound fertilizer (N:P:K = 1:1:1) were applied as base fertilizer. Plant samples were taken to measure leaf area index (LAI), the plant dry matter accumulation at key development stages and yield was measured at harvest. Soil samples were taken to measure soil water content. Meteorological data were obtained from a weather station located at the experimental site, including daily rainfall, temperature, relative humidity, solar radiation and average daily wind speed.
2.3. WHCNS Model
WHCNS (water heat carbon and nitrogen simulator) is a systematic model combining soil moisture, soil heat, soil C, soil N and crop growth. The model runs in daily time step, driven by meteorological and biological variables as well as agricultural management. The Penman–Monteith method from the FAO is used to calculate the reference crop evapotranspiration [25]. Soil water infiltration and redistribution processes are described by Green-Ampt [26] and Richard’s equations, respectively [27]. The improved version of the PS123 model [28] is applied to simulate the crop development stage, dry matter accumulation and crop yield. A detailed model description is available in the literature [29]. The model can quantitatively describe soil water dynamics, carbon and nitrogen cycle process and crop growth law in farmland ecosystem, which is of great significance for efficient utilization of water and nitrogen resources, decision-making in crop production and environmental protection.
2.4. Model Evaluation Statistics
Four statistical indices including normalized root mean square error (nRMSE), index of agreement (IA), coefficient of determination (R2) and Nash–Sutcliffe efficiency (NSE) were used to evaluate model performance, please refer to the relevant literature for the calculation method of each statistical parameter [5,30].
Previous studies believe that nRMSE < 10%, denotes the simulation is very good, 10% < nRMSE < 20% denotes the simulation is good, 20% < nRMSE < 30% denotes the simulation is qualified, and nRMSE > 30% denotes the simulation is unqualified [31]. The range of NSE is −∞ to 1, the closer NSE is to 1, the closer the simulated value is to the measured value, and the better the simulation effect is. The model has a good simulation effect on soil water content when IA ≥ 0.75 [32]; IA ≥ 0.9 means that there is a good consistency between the measured and simulated values for dry matter and physiological indexes of various parts of crops; and 0.8 < IA < 0.9 mean the simulation effect of dry matter and physical indexes is qualified [33]. The closer R2 is to 1, the better the fit between the simulated value and the measured value is.
2.5. Integrated Index Method
The integrated index was used to quantitatively analyze the model outputs, including yield and WUE. In this study, the agronomy factor (AF) and economy factor (the value to cost ratio, VCR) were computed to evaluate each management strategy, and their weights were both 0.5. AF was calculated with normalized yield and WUE weighted by coefficients of +0.6 and +0.4, respectively. The AF, VCR were calculated using Equations (1) and (2):
where Y is the grain yield (kg·ha−1), YP is the grain price (¥·kg−1). W is the irrigation amount (mm) and WP is the water price (¥·m−3). F is the N fertilizer rate (kg), and FP is the fertilizer price (¥·kg−1). E is the electricity consumption (KW·h−1), EP is the electricity price (¥·h·KW−1). The prices of water, fertilizer, electric and soybean were assumed to be 0.35 ¥·m−3, 5 ¥·kg−1 and 2 ¥·kg−1, 0.45 ¥·m−3, respectively. For the description of the unit, please refer to the literature [34,35].
I = 0.5 × AF + 0.5 × VCR
Finally, the integrated index (II) in Equation (3) was calculated by the values of the two factors and their corresponding weights. The higher the integrated index, the better the management practice.
2.6. Simulation Scenarios
In order to explore the relationship between agronomic factors (AF), economic factors (VCR) and irrigation schedules of two soybean varieties, we introduced integrated index (II). We set up four schemes: the S1 and S2 schemes with the irrigation frequencies in 2017 and 2018, and I250-6 and I100-5 will be set as S3 and S4 in 2020. In each scheme, the amount of irrigation ranged from 25 to 600 mm.
To consider the weather conditions in different years, the WHCNS model was run in 2017, 2018 and 2020 to obtain the simulated crop yield, WUE and II for each scenario. A total of 576 water scenarios were simulated.
3. Results and Discussion
3.1. Model Calibration and Validation
The measured data of soil water content, dry matter weight, LAI and yield from the I250-6 in 2020 were used to calibrate the model and the measurements in other treatments in 2020 were used to evaluate the model. Finally, the model was calibrated using soil moisture and yield data for all treatment groups in 2017 and 2018. Model input parameters were adjusted by trial-and-error until the simulated values agreed well with the measured data [35].
Figure 1 illustrates the measured and simulated soil water storage of all treatments in 2020. The comparisons of measured and simulated LAI and dry matter weight of LH1 and LH3 soybean varieties are shown in Figure 2 and Figure 3, respectively. The results in Table 2 and Table 3 show the evaluation indexes of the simulation effect of soil moisture and crop growth.
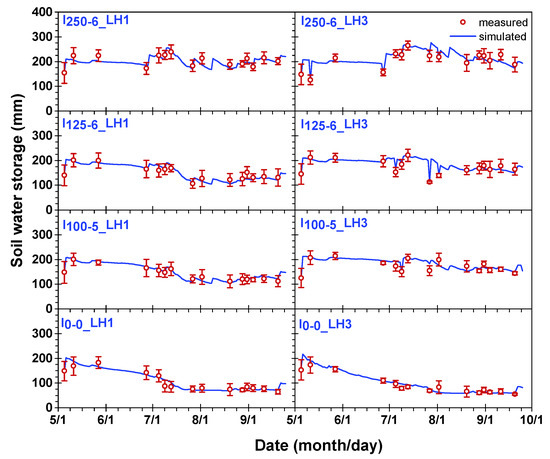
Figure 1.
Comparison of the measured and simulated soil water storage in 0–100 cm soil profile under different irrigation schedules for LH1 and LH3 in 2020.
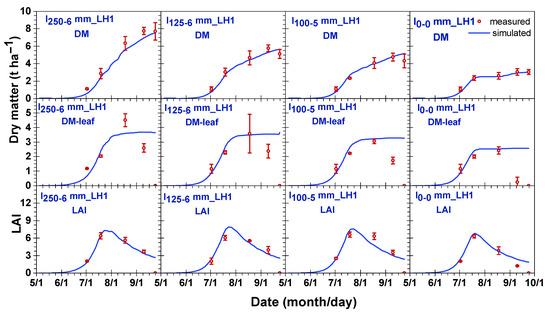
Figure 2.
Comparison of measured and simulated values of LAI, DM (the dry matter weight of root, stem and grain) and DM-leaf (the dry matter weight of leaf) under different irrigation schedules of LH1 in 2020.
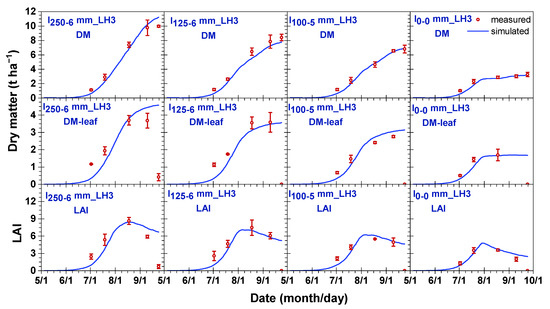
Figure 3.
Comparison of measured and simulated values of LAI, DM (the dry matter weight of root, stem and grain) and DM-leaf (the dry matter weight of leaf) under different irrigation schedules of LH3 in 2020.

Table 2.
Statistical criteria for simulation of soil water storage LH1 and LH3 in 2020.

Table 3.
Statistical criteria for simulation of LAI, DM (the dry matter weight of root, stem and grain) and DM-leaf (the dry matter weight of leaf) under different irrigation schedules of LH1 and LH3 in 2020.
As is shown in Table 2, the R2 between the measured and simulated soil water storage of the two varieties under four irrigation treatments ranges from 0.73 to 0.96. The nRMSE, NSE and IA of simulated soil water storage were 4.70–10.71%, 0.67–0.93 and 0.91–0.99, respectively. For crop growth simulation, the nRMSE of DM were 6.66–12.99%, NSE > 0.65 and IA > 0.9.
It should be observed that the simulation effect of DM-leaf and LAI is significantly worse than that of other indicators in Table 3, and most of them are unqualified. There may be two reasons for the result. First, the soybean leaves rot and fall off in the mature period, which brings about the sampling error. If we consider this factor and delete the sampling error segment, the result is shown in Table 4. Secondly, in the late growth stage of soybean, the nutrients produced by photosynthesis of leaves are lower than the total nutrients consumed from leaves to fruits and by leaf respiration due to the aging and yellowing of leaves, which leads to the decline of dry matter quality of leaves. Since the WHCNS model does not consider these influential factors, the simulation error is caused. Concluding from the four evaluation indices of the simulation effect, the simulation value is basically consistent with the measured value, which indicates that the model can well simulate the growth and development of LH1 and LH3 soybean crops and the dynamics of soil moisture.

Table 4.
Statistical criteria for simulation of LAI and DM-leaf (the dry matter weight of leaf) considering sampling error caused by defoliation.
Figure 4 shows the comparison between the simulated values and the measured values of soil water content and yield in three years. The IA of soil water content and yield of LH1 and LH3 are more than 0.9, which indicates that the simulated values are in good agreement with the measured values. The nRMSE of soil water content and yield of LH3 under all water treatments were 9.79% and 4.41%, respectively. The nRMSE of LH1 soil water content was 10.98%. For the simulation of LH1 yield, if the I350-9 in 2017 and I305-8 in 2018 are not considered, the nRMSE of yield is 9.96%. Otherwise, the nRMSE of the yield increases to 19.12% due to the overestimation of I350-9 and I305-8 in Figure 4. In the field experiment, I350-9 and I305-8 treatments generate higher soil moisture conditions at the flowering and pod stage of LH1, leading to serious lodging [36], which causes a large reduction in yield. The result is similar to previous studies [37,38].
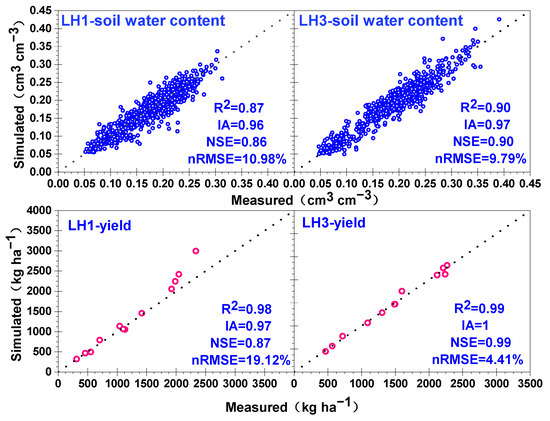
Figure 4.
Comparison of measured and simulated values of soil moisture and LH1 and LH3 production under different irrigation schedules in 2017, 2018 and 2020.
Balboa et al. [18] used APSIM to simulate the maize-soybean rotation system in the western United States, and found that the nRMSE of soybean biomass and yield were 21% and 31%, NSE were 0.81 and 0.53, R2 were 0.94 and 0.75, respectively. Sciarresi et al. [39] simulated soybean yield with DSSAT-CROPGRO model, and found that 6.5% ≤ nRMSE ≤ 13.7%, 0.68 ≤ NSE ≤ 0.81. Liang et al. [40] coupled DRAINMOD with WHCNS to simulate soybean growth and soil water dynamics in artificial drainage farmland and found that nRMSE of soil water storage, aboveground dry matter mass and yield were 5.8–9.0%, 6.5–28.4% and 6.9%, respectively. The IA was 0.56–0.86, 0.97–0.99 and 0.99, respectively. NSE was −0.91–0.32, 0.84–0.97 and 0.98, respectively. Compared with previous studies, WHCNS can be well-simulated soil moisture and yield factors of soybean under different irrigation systems of LH1 and LH3 in Northwest China.
3.2. Water Consumption and Water Use Efficiency
The simulated water balance and water use efficiency of two soybean varieties in 0–100 cm soil profile under different water treatments are summarized in Table 5. The experimental plot is located in the typical arid area of Northwest China where the rainfall is deficient and cannot meet the requirements of soybean emergence and normal growth. Therefore, the water input was composed of irrigation (I) and precipitation (P). Due to a lack of rivers around the experimental plot, the groundwater was pumped for irrigation. As the rainfall is small; and the drip irrigation method is used, there is no runoff produced. The water output is composed of evapotranspiration (ET) and drainage (D) in the study.

Table 5.
Water balance of 0–100 cm of the soil profile and water use efficiency of LH1 and LH3 in 2017, 2018 and 2020 simulated by WHCNS.
Figure 5 shows the ET, yield and WUE of LH1 and LH3 under different water treatments in the three years of the field experiment. Linear regression analysis was conducted on them, and the size and proportion of E and T in ET under various treatments were analyzed. The results showed that ET, yield and WUE of LH1 and LH3 increased linearly with irrigation amount (I) (see Table 6). When I < IEquation, LH3 > LH1; when I > IEquation, the results were opposite. The IEquation of ET, yield and WUE were 314 mm, 263 mm and 287 mm, respectively. The results also showed that T of LH1 and LH3 increased linearly with I; LH3 was greater than LH1 in most experimental irrigation, and the variation ranges of LH1 and LH3 were 50–350 and 100–400 mm, respectively; E increased nonlinearly with I, and the variation ranges of LH1 and LH3 were 82–212 and 82–137, respectively. Except for the rain-fed treatment in 2020, E in the other treatments shows LH1 > LH3.
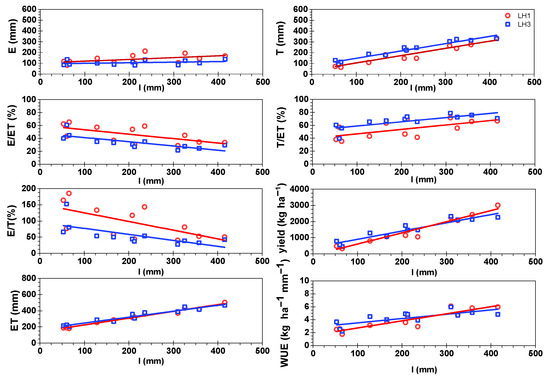
Figure 5.
Comparison of simulated values of evapotranspiration (ET), transpiration (T), evaporation (E), , , yield and water use efficiency (WUE) under different irrigation schedules of LH1 and LH3 in 2017, 2018 and 2020.

Table 6.
Statistical indices for simulated Evapotranspiration (ET), Transpiration (T), Evaporation (E), , , , yield and WUE for different irrigation schedules of LH1 and LH3 in 2017, 2018 and 2020.
of LH1 and LH3 showed a downward trend with the increase in I, and it presented as LH1 > LH3 in all treatments except the rain-fed one in 2020. of LH1 and LH3 showed an upward trend with the increase in I, and it presented as LH1 < LH3 in all treatments except the one in 2020. of LH1 and LH3 showed a downward trend with the increase in I, and it presented as LH1>LH3 in all treatments except the rain-fed one in 2020. By analyzing the relationship between and I, the conclusion can be drawn: The field water consumption of LH3 was mainly dominated by plant transpiration in almost all cases. However, for LH1, when I is greater than 194 mm, the field water consumption is dominated by plant transpiration. Otherwise, it is dominated by soil evaporation (see the of Figure 5).
3.3. Scenario Analysis
As shown in Figure 6, the indexes of LH1 and LH3 showed the same regularity with the increase in irrigation amount under different schemes. That is, the yield and WUE increased first and then kept a constant with the increase in irrigation amount, and the II increased first and then decreased with the increase in irrigation amount.
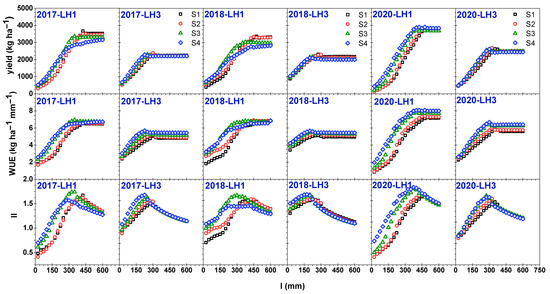
Figure 6.
Comparison of the four plans and two varieties of soybean yield, water use efficiency (WUE), integrated index (II) in 2017, 2018 and 2020.
The annual rainfall in 2020 decreased by 9.31% and 71.01%, respectively, compared with that in 2017 and 2018, and mainly concentrated in the later stage of the soybean (see Figure 7). As is shown in Figure 6, the differences among the four schemes in 2020 were more obvious than in 2017 and 2018. For LH1, with the increase in irrigation amount, the corresponding indicators of different schemes tend to be equal. Under the meteorological conditions in 2017, when the irrigation amount is small, the indicators of different schemes are S1 ≈ S2 < S3 ≈ S4. However, when the irrigation amount increased to a relatively stable yield, the yield and II of different schemes showed S4 < S3 < S2 < S1, but the WUE of different schemes are similar, which indicated that S3 and S4 can achieve the purpose of increasing yield and income, but have little effect on improving crop water use efficiency. Under the meteorological conditions in 2018, when I < 100 mm, the indicators of S3 and S4 are relatively close. When 100 mm < I < 300 mm, the indicators are S3 > S4, and with the increase in I, the difference between S3 and S4 gradually increases. Until I > 300 mm, it decreases gradually. Meanwhile, when I < 275 mm, the indicators are S1 < S2, and they have no significant difference when I > 275 mm. Under the meteorological conditions in 2020, the indexes are S1 < S2 < S3 < S4, and the indexes tend to be equal to the increase in irrigation amount. For LH3, when the irrigation amount is less than 200 mm, each index is S1 < S2 < S3 < S4, and with the increase in irrigation amount, the difference between the schemes decreases.
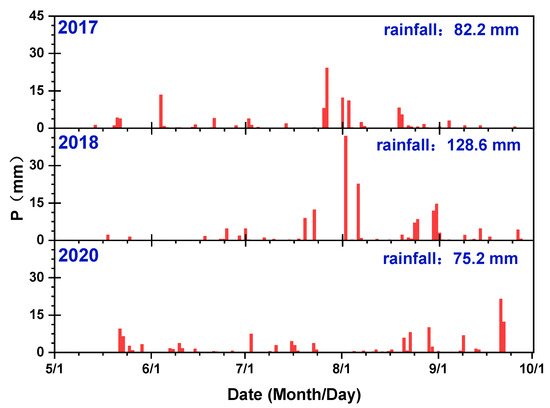
Figure 7.
Rainfall during soybean growth period in 2017, 2018, and 2020.
As shown in Table 7, When the irrigation amount is about 380 mm. the II of LH1 reaches the highest value, and the corresponding irrigation amount of LH3 is 260 mm. The maximum values of each index of LH3 were less than that of LH1, and the maximum values of yield, WUE and II of LH1 were 45.12%, 24.67% and 4.11%, respectively, which were higher than those of LH3 but accompanied by 45.60% more water input. It is worth noting that all these simulations are based on the assumption that LH1 and LH3 soybeans do not have serious lodging. However, in the actual field experiment, it is found that LH1 is easier to appear lodging than LH3. Therefore, if the lodging effect is considered, the increase here may be overestimated.

Table 7.
The maximum yield, WUE and II of different Irrigation schedules for LH1 and LH3 under corresponding hydrological conditions.
4. Conclusions
Using field experiment data in 2017, 2018, and 2020, the feasibility of using the WHCNS model to simulate soybean crop yield and soil moisture dynamics in the northwestern region was verified. Regression analysis was carried out between the drought index and the amount of irrigation water of the two varieties of soybean. By using the model’s scenario module, the impact of different irrigation schemes on soybean yield, WUE, and II is analyzed. The following conclusions can be drawn:
- (1)
- The WHCNS model can simulate the soil moisture dynamics, dry matter accumulation, and LAI changes of LH1 and LH3 soybean varieties under different irrigation schemes in Northwest China, and can simulate the yield of the two soybean varieties well.
- (2)
- Under deficit irrigation, the yield, ET and WUE increase linearly with irrigation amount. As the amount of irrigation increases, the proportion of E in ET decreases, while the proportion of T in ET increases.
- (3)
- Compared with LH3, the yield and WUE of LH1 are higher, caused by more irrigation water input. Considering economic and agronomic factors, there is no significant difference between LH1 and LH3 (the comparison of II between LH1 and LH3 is 4.11% < 5%). LH1 is more suitable for planting in the area which can provide more agricultural water resources, while LH3 is suitable for planting in the arid area.
- (4)
- Reducing the irrigation times in the branching period will not reduce the yield of crops, and may even lead to a small increase in yield and income; reducing the irrigation time at the end of the grouting period has no significant effect on yield and income.
Author Contributions
Data processing, C.W., D.Y.; software, Y.Z.; writing—original draft, Y.Z.; writing—review and editing, S.L., M.W. All authors have read and agreed to the published version of the manuscript.
Funding
We greatly appreciate the careful and precise reviews from the anonymous reviewers, who made great efforts to help improve the manuscript and study. This work was financially supported by the Chinese National Natural Science Fund (51879262, 51622907), and the Hong Kong Research Grants Council Area of Excellence Scheme (AoE/M-403/16), CUHK VC Discretionary Fund VCF2014004. M.W. is supported by the National Key Research and Development Program of China (2020YFA0607504, 2016YFA0600204), the National Natural Science Foundation of China (41901266, 42111530184), the Natural Science Foundation of Jiangsu Province (BK20190317).
Institutional Review Board Statement
This study does not involve humans.
Informed Consent Statement
This study does not involve humans.
Data Availability Statement
The data provided in this study can be provided at the request of the corresponding author. Because the data needs to be used in the next step, the data is not open.
Conflicts of Interest
The authors declare no conflict of interest.
References
- Zhao, L.; Fan, M.; Zhang, D.; Yang, R.; Zhang, F.; Xu, L.; Wei, X.; Shen, Y.; Wei, G. Distribution and diversity of rhizobia associated with wild soybean (Glycine soja Sieb. & Zucc.) in Northwest China. Syst. Appl. Microbiol. 2014, 37, 449–456. [Google Scholar] [PubMed]
- Chai, Q.; Gan, Y.T.; Turner, N.C.; Zhang, R.Z.; Yang, C.; Niu, Y.N.; Siddique, K.H.M. Water-saving innovations in Chinese agriculture. Adv. Agron. 2014, 126, 149–201. [Google Scholar]
- Yang, J.; Mao, X.; Wang, K.; Yang, W. The coupled impact of plastic film mulching and deficit irrigation on soil water/heat transfer and water use efficiency of spring wheat in Northwest China. Agric. Water Manag. 2018, 201, 232–245. [Google Scholar] [CrossRef]
- Yang, D.; Li, S.; Kang, S.; Du, T.; Guo, P.; Mao, X.; Tong, L.; Hao, X.; Ding, R.; Niu, J. Effect of drip irrigation on wheat evapotranspiration, soil evaporation and transpiration in Northwest China. Agric. Water Manag. 2020, 232, 106001. [Google Scholar] [CrossRef]
- Zhao, Y.; Mao, X.; Shukla, M.K. A modified SWAP model for soil water and heat dynamics and seed–maize growth under film mulching. Agric. For. Meteorol. 2020, 292, 108–127. [Google Scholar] [CrossRef]
- Thelen, K.; Bernards, M.; Staton, M. Effects of irrigation scheduling on soybean growth and yield; New directions for a diverse planet. In Proceedings of the 4th International Crop Science Congress in conjunction with the 12th Australian Agronomy Conference and the 5th Asian Crop Science Conference, Brisbane, Australia, 26 September–1 October 2004; p. 859. [Google Scholar]
- Li, Q.S.; Willardson, L.S.; Deng, W.; Li, X.J.; Liu, C.J. Crop water deficit estimation and irrigation scheduling in western Jilin province, Northeast China. Agric. Water Manag. 2005, 71, 47–60. [Google Scholar] [CrossRef]
- Wood, C.W.; Krutz, L.J.; Henry, W.B.; Irby, T.; Orlowski, J.M.; Bryant, C.J.; Atwill, R.L.; Spencer, G.D.; Mills, B.E. Developing sensor-based irrigation scheduling that maximizes soybean grain yield, irrigation water use efficiency, and returns above irrigation costs. CropForage Turfgrass Manag. 2020, 6, 1–7. [Google Scholar] [CrossRef]
- Banterng, P.; Hoogenboom, G.; Patanothai, A.; Singh, P.; Wani, S.P.; Pathak, P.; Tongpoonpol, S.; Atichart, S.; Srihaban, P.; Buranaviriyakul, S.; et al. Application of the Cropping System Model (CSM)-CROPGRO-Soybean for Determining Optimum Management Strategies for Soybean in Tropical Environments. J. Agron. Crop Sci. 2010, 196, 231–242. [Google Scholar] [CrossRef]
- Lopez, J.R.; Jonathan, M.W.; Joshua, E.; Alex, C.R.; Cheryl, P.; Hoogenboom, G. Integrating growth stage deficit irrigation into a process based crop model. Agric. For. Meteorol. 2017, 243, 84–92. [Google Scholar] [CrossRef]
- Battisti, R.; Sentelhas, P.C.; Boote, K.J. Inter-comparison of performance of soybean crop simulation models and their ensemble in southern Brazil. Field Crops Res. 2017, 200, 28–37. [Google Scholar] [CrossRef]
- Smith, W.; Qi, Z.; Grant, B.; VanderZaag, A.; Desjardins, R. Comparing hydrological frameworks for simulating crop biomass, water and nitrogen dynamics in a tile drained soybean-corn system: Cascade vs computational approach. J. Hydrol. 2019, 2, 114–125. [Google Scholar] [CrossRef]
- Khoshravesh, M.; Mostafazadeh-Fard, B.; Heidarpour, M.; Kiani, A. AquaCrop model simulation under different irrigation water and nitrogen strategies. Water Sci. Technol. 2013, 67, 232–238. [Google Scholar] [CrossRef]
- Paredes, P.; Wei, Z.; Liu, Y.; Xu, D.; Xin, Y.; Zhang, B.; Pereira, L.S. Performance assessment of the FAO AquaCrop model for soil water, soil evaporation, biomass and yield of soybeans in North China Plain. Agric. Water Manag. 2015, 152, 57–71. [Google Scholar] [CrossRef] [Green Version]
- Wei, Z.; Paredes, P.; Liu, Y.; Chi, W.W.; Pereira, L.S. Modelling transpiration, soil evaporation and yield prediction of soybean in North China Plain. Agric. Water Manag. 2015, 147, 43–53. [Google Scholar] [CrossRef]
- Li, Z.; Yang, J.Y.; Drury, C.F.; Yang, X.M.; Reynolds, W.D.; Li, X.; Hu, C. Evaluation of the DNDC model for simulating soil temperature, moisture and respiration from monoculture and rotational corn, soybean and winter wheat in Canada. Ecol. Model. 2017, 360, 230–243. [Google Scholar] [CrossRef]
- Yi-tao, Z.; Jian, L.; Hong-yuan, W.; Qiu-liang, L.; Hong-bin, L.; Li-mei, Z.; Tian-zhi, R.; Zhang, J. Suitability of the DNDC model to simulate yield production and nitrogen uptake for maize and soybean intercropping in the North China Plain. J. Integr. Agric. 2018, 17, 2790–2801. [Google Scholar]
- Balboa, G.R.; Archontoulis, S.V.; Salvagiotti, F.; Garcia, F.O.; Stewart, W.M.; Francisco, E.; Prasad, P.V.; Ciampitti, I.A. A systems-level yield gap assessment of maize-soybean rotation under highand low-management inputs in the Western US Corn Belt using APSIM. Agric. Syst. 2019, 174, 125–154. [Google Scholar] [CrossRef]
- Singer, J.W.; Malonea, R.W.; Jaynes, D.B.; Ma, L. Cover crop effects on nitrogen load in tile drainage from Walnut Creek Iowa using root zone water quality (RZWQ) model. Agric. Water Manag. 2011, 98, 1622–1628. [Google Scholar] [CrossRef]
- Chen, M.; Tim, J.G.; John, M.B.; Jeffrey, D.W.; Tilden, M.; Andrew, S. Comparing crop growth and carbon budgets simulated across AmeriFlux agricultural sites using the Community Land Model (CLM). Agric. For. Meteorol. 2018, 256, 315–333. [Google Scholar] [CrossRef] [Green Version]
- Li, S.; Kang, S.; Zhang, L.; Du, T.; Tong, L.; Ding, R.; Guo, W.; Zhao, P.; Chen, X.; Xiao, H. Ecosystem water use efficiency for a sparse vineyard in arid northwest China. Agric. Water Manag. 2015, 148, 24–33. [Google Scholar] [CrossRef]
- Li, S.; Kang, S.; Zhang, L.; Zhang, J. On the attribution of changing crop evapotranspiration in arid regions using four methods. J. Hydrol. 2018, 563, 576–585. [Google Scholar] [CrossRef]
- Li, S.; Kang, S.; Zhang, L.; Zhang, J.; Du, T.; Tong, L.; Ding, R. Evaluation of six potential evapotranspiration models for estimating crop potential and actual evapotranspiration in arid regions. J. Hydrol. 2016, 543, 450–461. [Google Scholar] [CrossRef]
- Li, S.; Zhang, L.; Kang, S.; Tong, L.; Du, T.; Hao, X.; Zhao, P. Comparison of several surface resistance models for estimating crop evapotranspiration over the entire growing season in arid regions. Agric. For. Meteorol. 2015, 208, 1–15. [Google Scholar] [CrossRef]
- Allen, R.G.; Pereira, L.S.; Raes, D.; Smith, M. Crop Evapotranspiration Guidelines for Computing Crop Water Requirements-FAO Irrigation and Drainage Paper. Fao Rome 1998, 300, D05109. [Google Scholar]
- Green, W.H.; Ampt, G.A. Studies on soil physics: Part 1. The flow of air and water through soils. Irrig. Sci. 1911, 4, 1–24. [Google Scholar]
- Hachum, A.Y.; Alfaro, J.F. Rain infiltration into layered soils: Prediction. J. Irrig. Drain. Div. 1980, 106, 311–319. [Google Scholar] [CrossRef]
- Driessen, P.M.; Konjin, N.T. Land Use System Analysis; Wageningen Agricultural University: Wageningen, The Netherlands, 1992. [Google Scholar]
- Liang, H. Establishing Soil Water-Carbon-Nitrogen Process and Crop Growth Joint Model and Its Application of Water and Nitrogen Management; China Agricultural University: Beijing, China, 2017. [Google Scholar]
- Liang, H.; Qi, Z.; Hu, K.; Prasher, S.O.; Zhang, Y. Can nitrate contaminated groundwater be remediated by optimizing flood irrigation rate with high nitrate water in a desert oasis using the WHCNS model? J. Environ. Manag. 2016, 181, 16–25. [Google Scholar] [CrossRef] [PubMed]
- Jamieson, P.D.; Porter, J.R.; Wilson, D.R. A test of the computer simulation model ARCWHEAT1 on wheat crops grown in New Zealand. Field Crop. Res. 1991, 27, 337–350. [Google Scholar] [CrossRef]
- Yang, J.M.; Yang, J.Y.; Liu, S.; Hoogenboom, G. An evaluation of the statistical methods for testing the performance of crop models with observed data. Agric. Syst. 2014, 127, 81–89. [Google Scholar] [CrossRef]
- Liu, H.L.; Yang, J.Y.; Drury, C.F.; Reynolds, W.D.; Tan, C.S.; Bai, Y.L.; He, P.; Jin, J.; Hoogenboom, G. Using the DSSAT-CERES-Maize model to simulate crop yield and nitrogen cycling in fields under long-term continuous maize production. Nutr. Cycl. Agroecosyst. 2011, 89, 313–328. [Google Scholar] [CrossRef]
- National Bureau of Statistics of China. National Bureau of Statistics National Bureau of Statistics, Statistical Bulletin of National Economic and Social Development in 2018; National Bureau of Statistics of China: Beijing, China, 2019.
- Shi, X.; Batchelor, W.D.; Liang, H.; Li, S.; Li, B.; Hu, K. Determining optimal water and nitrogen management under different initial soil mineral nitrogen levels in northwest China based on a model approach. Agric. Water Manag. 2020, 234, 106–110. [Google Scholar] [CrossRef]
- Wright, G.C.; Smith, C.J.; Wilson, I.B. Growth and yield of soybeans under wet soil culture and conventional furrow irrigation in south-eastern Australia. Irrig. Sci. 1988, 9, 127–142. [Google Scholar] [CrossRef]
- Cooper, R.L. Influence of early lodging on yield of soybean. Agron. J. 1971, 3, 449–450. [Google Scholar] [CrossRef]
- Doss, B.D.; Thurlow, D.L. Irrigation row width, plant population in relation to growth-characteristics of 2 soybean varieties. Agron. J. 1974, 66, 620–623. [Google Scholar] [CrossRef]
- Sciarresi, C.; Proctor, C.; Haramoto, E.R.; Lindsey, L.E.; Carmona, G.I.; Elmore, R.; Everhart, S.; Looker, W.; Guzman, M.M.; McMechan, J.; et al. Evaluating short-season soybean management adaptations for cover crop rotations with a crop simulation model. Field Crops Res. 2020, 250, 107734. [Google Scholar] [CrossRef]
- Liang, H.; Qi, Z.; Hu, K.; Li, B.; Prasher, S.O. Modelling subsurface drainage and nitrogen losses from artificially drained cropland using coupled DRAINMOD and WHCNS models. Agric. Water Manag. 2018, 195, 201–210. [Google Scholar] [CrossRef]
Publisher’s Note: MDPI stays neutral with regard to jurisdictional claims in published maps and institutional affiliations. |
© 2021 by the authors. Licensee MDPI, Basel, Switzerland. This article is an open access article distributed under the terms and conditions of the Creative Commons Attribution (CC BY) license (https://creativecommons.org/licenses/by/4.0/).