Abstract
Cholinergic innervation in the pancreas controls both the release of digestive enzymes to support the intestinal digestion and absorption, as well as insulin release to promote nutrient use in the cells of the body. The effects of muscarinic receptor stimulation are described in detail for endocrine beta cells and exocrine acinar cells separately. Here we describe morphological and functional criteria to separate these two cell types in situ in tissue slices and simultaneously measure their response to ACh stimulation on cytosolic Ca2+ oscillations [Ca2+]c in stimulatory glucose conditions. Our results show that both cell types respond to glucose directly in the concentration range compatible with the glucose transporters they express. The physiological ACh concentration increases the frequency of glucose stimulated [Ca2+]c oscillations in both cell types and synchronizes [Ca2+]c oscillations in acinar cells. The supraphysiological ACh concentration further increases the oscillation frequency on the level of individual beta cells, inhibits the synchronization between these cells, and abolishes oscillatory activity in acinar cells. We discuss possible mechanisms leading to the observed phenomena.
1. Introduction
The pancreatic endocrine islet cells and exocrine acinar and ductal cells are richly innervated by parasympathetic, sympathetic, and sensory nerves [1,2]. Cholinergic nerve fibers entering the pancreas are predominantly preganglionic. These fibers originate in the dorsal motor nucleus of N. vagus [3,4] and are under hypothalamic control [5]. Preganglionic fibers terminate in intrapancreatic ganglia. Postganglionic nerves emanate from these ganglia to terminate in the vicinity of hormone and digestive enzyme secreting cells [6]. In mice, postganglionic nerve fibers communicate with all types of endocrine cells in the islets. In contrast, parasympathetic innervation is rather scarce in exocrine tissue [7]. Furthermore, a considerably higher concentration of choline acetyltransferase is found in islets compared to exocrine tissue [8].
Preganglionic parasympathetic nerve fibers release acetylcholine (ACh) that binds to nicotinic receptors in intraganglionic neurons [1]. Inhibition of these receptors has been found to abolish insulin secretion in beta cells [9], suggesting the importance of vagal descending pathways. ACh released by postganglionic fibers through the activation of the muscarinic receptors directly triggers insulin release from islet beta cells [10] and mediates digestive enzyme secretion in acinar cells [11]. It is noteworthy that the effects of different neurotransmitters released by vagal fibers on beta cell insulin secretion differs between species [2]. Similarly, intraganglionic innervation is species-dependent [12,13], demonstrating different neuronal regulation of pancreatic endocrine function between species [13]. In both mice and humans, parasympathetic nerve endings that innervate pancreatic islets release ACh. Interestingly, human alpha cells express vesicular acetylcholine transporter and release ACh in a paracrine manner to support optimal response of beta cells to glucose [14], representing a non-neuronal source of ACh in the cholinergic system in the human islets [15].
Pharmacological characterization revealed that in mice both beta and acinar cells express the muscarinic acetylcholine receptor subtype 1 (M1R) and 3 (M3R) (Figure 1) [16]. Human beta cells additionally express M5 receptors [17]. Glucose-induced insulin release has been demonstrated to be mediated through the activation of M3R [16,18]. Mice selectively lacking M3R in beta cells show impaired glucose tolerance and reduced insulin release, whereas mice selectively overexpressing M3R in pancreatic beta cells show improved glucose tolerance and increased insulin release [19]. The activation of parasympathetic nerve fibers and ACh release is not a transient event and does not occur only in the preabsorptive phase of feeding, but persists throughout the absorptive phase [19]. The cholinergic stimulation in pancreatic acinar cells is mediated to a similar extent through both M1R and M3R receptors [11].

Figure 1.
Muscarinic activation with ACh and the IP3 signaling pathway in beta cells and acinar cells. (a) Acinar and beta cells express muscarinic receptors (MXRs), activation of which results in IP3 and DAG production. IP3 specifically binds to IP3R on the ER and triggers Ca2+ mobilization, leading to an oscillatory rise in [Ca2+]c. Additionally, RYR receptors can be activated. L-type VDCCs play a role in Ca2+ refilling of the ER. (b) Color-coded time courses for beta (light brown) and acinar cells (blue) simultaneously stimulated with 8 mM glucose in combination with a physiological (50 nM, top traces) or a supraphysiological (25 µM, bottom traces) ACh concentration. The activation onsets after the cells were stimulated for the acinar cells (red) and the beta cells (green) are indicated with the vertical dashed lines. Legend: MxR = muscarinic receptor, ACh = acetylcholine, DAG = diacylglycerol, IP3 = 1,4,5-inositol trisphosphate, IP3R = inositol (1,4,5) trisphosphate receptor, RYR = ryanodine receptors. Created with [40].
M3Rs, as other muscarinic receptors, are G-protein coupled receptors (GPCRs). Agonists that bind to GPCRs activate various signaling pathways within the cell. When bound to MxR, ACh produces a series of effects on intracellular lipid metabolism by stimulation of the activity of various phospholipases, yielding a series of fast and slow acting metabolites. The best characterized cytosolic signaling pathway is activation of phospholipase C (PLC) (Figure 1). PLC is activated to hydrolyze the phosphoinositide (PI) to produce 1,4,5-inositol trisphosphate (IP3) and diacylglycerol (DAG) [20,21,22,23]. PLC is additionally activated by the secretagogues, such as glucose, but also by depolarizing agents or cytosolic Ca2+ concentration ([Ca2+]c) elevation [24,25]. It can also be influenced through other GPCRs. For instance, glucagon-like peptide 1 (GLP-1) binds to a GPCR and strongly stimulates the activation of PLC [26]. DAG on the other hand activates PKC and subsequently sensitizes insulin exocytosis to Ca2+ ions [2,27,28].
Ca2+ ion concentration in the cell cytoplasm ([Ca2+]c) of both acinar and beta cells is kept low (10−7 M) and local or global oscillatory elevations in the concentration of these ions play a critical signaling role. Importantly, [Ca2+]c elevation can occur in the absence of extracellular Ca2+, strongly suggesting that Ca2+ is stored and can be mobilized also from the intracellular compartments [29]. The Ca2+ concentration in extracellular space and in the internal stores is a few orders of magnitude higher than in the cytosol. Difference in Ca2+ concentration across the membranes is the major driving force for influx of Ca2+ ions, which runs through numerous transporters and Ca2+ release channels.
Since the early eighties, there is evidence that elevated IP3 levels in the cytosol trigger Ca2+ release from nonmitochondrial intracellular stores in acinar cells, the same stores that get released after ACh stimulation [30]. Soon thereafter, IP3 has been recognized as an important second messenger coupling membrane receptor activation with Ca2+ mobilization [31,32]. IP3 binds specifically to the inositol (1,4,5) trisphosphate receptor (IP3R) on the ER. Three isoforms of IP3R have been identified in mouse beta cells, type 1, type 2 and type 3, and the expression of the latter two is predominant [26]. In human beta cells, type 3 IP3R is expressed predominantly [33]. Pancreatic acinar cells predominantly express IP3R type 2 and type 3 [34]. Several important domains have been identified on the IP3Rs, with the ligand-binding, regulatory and channel domain [35]. The channel domain mediates the release of intracellular Ca2+ from ER to cytosol. In addition to the IP3 binding domain, IP3Rs have a Ca2+ binding domain. Ca2+ modulates the sensitivity of IP3R to IP3. IP3R cannot open and mediate the Ca2+ release from ER without Ca2+ binding beforehand. Importantly, Ca2+ alone is unable to activate IP3R [5].
Alongside IP3 and IP3Rs, additional second messengers and receptors responsible for Ca2+ mobilization have been identified [36]. After glucose stimulation, the secondary messenger cyclic adenosine 5′-diphosphate-ribose (cADPR) is produced. cADPR is known to increase Ca2+ mobilization through modulation of the ryanodine receptors (RYRs) [37]. Independently of IP3, the second messenger nicotinic acid adenine dinucleotide phosphate (NAADP) likewise acts on separate receptors to mobilize intracellular Ca2+ [38,39].
Oscillations in [Ca2+]c are involved in the regulation of numerous cellular processes [41], including insulin secretion in beta cells [42]. [Ca2+]c oscillations in beta cells were found to be of very different time scales, and are thought to correspond to pulsatile insulin release [43,44,45,46]. Similarly, Ca2+ signaling plays a prominent role for the digestive enzyme secretion in acinar cells [47,48]. However, the exact mechanisms that produce oscillations in [Ca2+]c can vary significantly between the cells.
In acinar cells, intracellular Ca2+ stores have been well established to play a prominent role in generating Ca2+ oscillations. Acinar cells do not possess voltage-gated Ca2+ channels (VDCCs) [49], but do have store-operated Ca2+ influx from extracellular space [50]. There is accumulating evidence that the role of intracellular receptors and Ca2+ mobilization has been underestimated also in endocrine beta cells [51]. The current consensus model namely primarily builds on the key role of plasma membrane ion channels and resulting Ca2+ influx from extracellular space [52]. Briefly, glucose-dependent ATP production leads to a series of events to increase the opening probability of VDCCs, which mediate the Ca2+ influx into the cell and the resulting elevation of [Ca2+]c triggers Ca2+-dependent exocytosis of insulin [26,45]. However, new experimental evidence, performed in more physiological conditions, supports a more central role for intracellular Ca2+ release channels as the dominant contributor to glucose-dependent Ca2+ oscillations and exocytosis of insulin. IP3 receptors, in addition to ryanodine receptors, were both shown to be sufficient and necessary to control [Ca2+]c oscillations in beta cells [51]. On the other hand, Ca2+ influx through VDCCs may play only a secondary role in refilling the ER Ca2+ stores [51]. These novel insights call for the reassessment of the role of muscarinic activation and the IP3 signaling pathway in pancreatic beta cells.
Since the introduction of pancreas tissue slices [53], we have a technique that enables us to simultaneously study intact islet of Langerhans in the context of the surrounding acinar tissue. With this approach we can investigate preserved architecture and cellular function. Studying intact interaction under near-physiological conditions between homotypic and heterotypic cells is the biggest advantage tissue slices can offer [54]. Preserved environment of the endocrine and exocrine part of the pancreas is important to understand in vivo physiology and pathophysiology [55]. Pancreatic tissue slices have recently become a standard technique in a number of laboratories and have been successfully used for a broad spectrum of studies ranging from the characterization of islet microvasculature [56], analysis of diabetes pathogeneses [57], studying the function of pancreatic ductal cells [58], interaction between the different cell types [59], and Ca2+ dynamics [60]. The major aim of this paper has been to use the in situ character of the pancreatic slice preparation to learn about the cholinergic signaling by simultaneous observations of [Ca2+]c dynamics in endocrine and acinar cells, in both physiological and supraphysiological conditions.
2. Materials and Methods
2.1. Ethics Statement
Study was conducted in accordance with national and European recommendations on care and handling experimental animals. We made all efforts to minimize the suffering of animals and to implement improvements in animal care and welfare. Administration of Republic of Slovenia for Food Safety, Veterinary and Plant Protection approved the experimental protocol (No: U34401-12/2015/3) and so did The Ministry of Education, Science and Research, Republic of Austria (No: 2020-0.488.800)
2.2. Tissue Slice Preparation and Dye Loading
Male and female C57BL/6J mice, 12–26 weeks of age, were kept on a 12:12 h light:dark schedule in individually ventilated cages (Allentown) at room temperature 22–24 °C and 45–55% relative humidity. Pancreas tissue slices were prepared as described before [53,61]. Briefly, mice were killed using CO2. Next, laparotomy was performed to access the abdominal cavity. Before the injection of the low-melting-point 1.9% agarose (Lonza, Basel, Switzerland), bile duct at the major duodenal papilla was clamped, allowing agarose to preferentially perfuse pancreas. Agarose was dissolved in extracellular solution composed of (in mM) 125 NaCl, 2.5 KCl, 26 NaHCO3, 1.25 NaH2PO4, 2 Na pyruvate, 0.25 ascorbic acid, 3 myo-inositol, 6 glucose, 1 MgCl2, 2 CaCl2 and 6 lactic acid (ECS). Temperature of injected agarose was 40 °C. After the injection, perfused pancreas was cooled with ice-cold ECS (ECS was buffered with CO2). Injection of agarose was a prerequisite for successfully conducted experiments. Ultimately, we cut 140 µM thick tissues slices using vibratome (VT 1000 S, Leica). Slices were transferred into 6 mM HEPES-buffered solution (HBS) consisting of (in mM) 150 NaCl, 10 HEPES, 5 KCl, 2 CaCl2, 1 MgCl2; titrated to pH = 7.4 using 1 M NaOH. For staining we used solution consist of 6 µM Calbryte 520, 0.03% Pluronic F-127 (w/v) and 0.12% dimethylsulphoxide (v/v) dissolved in HBS. Slices were stained with Calbryte 520, a Ca2+ (AAT Bioquest) for 50 min at room temperature. After staining, slices were transferred and kept in extracellular HEPES solution (in mM): 125 NaCl, 2.5 KCl, 10 HEPES, 10 NaHCO3, 1.25 NaH2PO4, 2 Na pyruvate, 0.25 ascorbic acid, 3 myo-inositol, 6 glucose, 1 MgCl2, 2 CaCl2, 6 lactic acid; titrated to pH = 7.4 using 1 M NaOH, until Ca2+ measurement. All chemicals, if not specify otherwise were obtained from Sigma-Aldrich, St. Louis, MO, USA.
2.3. Calcium Imaging
Imaging was performed on a Leica TCS SP5 upright confocal system using a Leica HCX APO L water immersion objective (20×, NA 1.0). Calbryte 520 was excited by a 488 nm argon laser. Emitted fluorescence was detected and measured by a Leica HyD hybrid detector in the range of 500–700 nm with the standard mode (Leica Microsystem, Wetzlar, Germany). Frequency of imaging was set to around 20 Hz at 256 × 256 pixels. Pixel size was close to 1 µm2, enabling quantification of Ca2+ oscillations.
The islet-containing slices that were subjected to imaging were chosen randomly to avoid biased selection from the head, neck, or tail of pancreas. Three to five slices were imaged from each mouse pancreas, and 6 or 8 mM glucose-containing, temperature-maintained (37 °C) ECS were perfused to the pancreas slice during Ca2+ imaging. Supraphysiological (25 µM) or the physiological (50 nM) concentrations of ACh were added in the ECS to study cholinergic effects. Time period of exposure to 8 mM glucose with or without ACh was adjusted depending on the time until the plateau activity was achieved. After the glucose stimulation, slices were perfused with substimulatory glucose (6 mM), before 8 mM glucose was reintroduced to the slices, or otherwise the experiments were discontinued.
2.4. Analysis
Analyses were performed as described before by Postić et al. [51]. In brief, we followed the analysis pipeline to first automatically detect ROIs (regions of interest) and sampled information about the time profile of [Ca2+]c changes, their spatial coordinates, and neighboring ROIs, as well as about movie statistics, recording frequency, and pixel size. In the next step we distilled out all significant changes (z-score > 4) in [Ca2+]c at all realistic time scales within each ROI. The events were characterized by the start time (t0), their maximal height, and the width at the half of their peak amplitude. The event was considered real if it was detected at multiple timescales and started around the same time and had approximately the same halfwidth. If their start and end times were within 20% of the halfwidth, they were considered cognate events, having arisen due to the same real event. Events that lasted less than three timeframes, as well as those too close to the beginning or end of the recording, were neglected. Figure 2a demonstrates the result of the automatic ROI selection and how different cell types were selected within the recorded part of the pancreatic slice (see video S1).
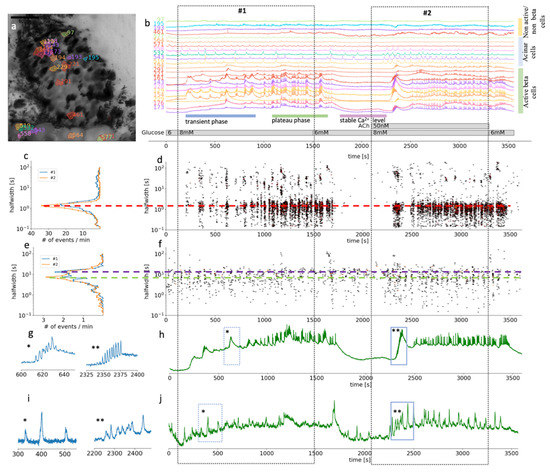
Figure 2.
Time scales and heterogeneity of responses of cytosolic Ca2+ oscillations in mouse beta and acinar cells stimulated with 8 mM glucose or 8 mM glucose plus 50 nM ACh. (a) Localization of several beta, acinar and non-active beta on non-beta cells in a pancreas tissue slice. (b) Time course of the [Ca2+]c changes in beta, acinar and non-active beta on non-beta cells selected in (a). The two dashed rectangles stretching across the panels indicate the periods of stimulation. (c) Frequency histogram of the halfwidth durations of the events and (d), onset time of the [Ca2+]c events at measured time scales for beta cells (n = 82). Addition of 50 nM ACh increased the frequency of the [Ca2+]c events, the dominant halfwidth duration stayed unchanged (red dashed line). (e) Frequency histogram of the halfwidth durations of the events and (f), onset time of the [Ca2+]c events at measured time scales for functional region of acinar cells (n = 48). Addition of 50 nM ACh increased the frequency of the [Ca2+]c events, the dominant halfwidth length shortened (blue and green dashed line). (g) Expanded time traces of an individual ROI (*) from a representative beta cells or an average of all ROIs (**) of active beta cells (n = 82) as indicated by small blue rectangles in (h). (i) Expanded time traces of an individual ROI (*) from a representative acinar ROI or an average of all functional regions of acinar cells ROIs (**) (c = 48) as indicated on the temporal profile in (j) with small blue rectangles.
All the data samples that were used in statistical analysis failed the normality test. We used Mann-Whitney Rank Sum test to calculate the median, Q1 and Q3 as well as to assess the statistical significance. p-value smaller than 0.025 was considered as significant.
3. Results
In this study we used confocal microscopy with high spatial and temporal resolution to record, and custom-made Python code to identify individual cells and realistic time scale oscillations in [Ca2+]c in pancreatic tissue slices. [Ca2+]c oscillations were induced by elevation of physiological glucose concentration (8 mM) alone or in combination with either physiological (50 nM) or supraphysiological (25 µM) concentration of ACh. We particularly focused on MxR triggered intracellular Ca2+ release, which is well established in pancreatic acinar cells, and compared the responses in both cell types recorded at the same time. In this way we could directly compare the concentration dependence of the response to glucose and ACh in both cell types. The experiments were designed to validate the importance of ACh stimulation in metabolic homeostasis.
We intended to answer two major questions: (1) can we, in addition to morphological features, use the functional pattern of changes in [Ca2+]c to distinguish the ACh responses in beta and acinar cells? (2) Can the improved spatially and temporally resolved imaging of [Ca2+]c oscillations and optimized data analysis yield new insights into the mechanisms of ACh actions in pancreas?
3.1. Morphological and Functional Determination of Cell Types in Pancreatic Tissue Slices
Being able to distinguish between the different cell types in a composite tissue is a prerequisite for the analysis of temporal changes in the physiological parameters. Islets in a pancreas of wild-type mice are mostly well defined interlobular structures, which can be easily morphologically separated from the neighboring acinar cells (Figure 2a) [7]. Islet composition in mouse islets has been described to have beta cells occupying the majority of the central part of the islet, while non-beta cells form a mantle part, with important exceptions to the rule [7]. Furthermore, a typical biphasic activity after exposure to stimulatory glucose concentration is a distinctive characteristic of active beta cells (Figure 2b) [61]. For this study, we selected and further analyzed ROIs that represent beta cells and functional regions of acinar cells, based on the morphological features and their [Ca2+]c oscillations pattern (Figure 2). Physiological [Ca2+]c elevations in acinar cells occur locally in the apical granular pole [50]. Automatic detection of ROIs in our analyzing system have been optimized for detecting islet cells, which are compared to acinar cells smaller in size. Therefore, automatically detected ROIs in acinus region do not correspond to the size of acinar cell, but to the locally functioning region of acinar cells.
At the substimulatory 6 mM glucose concentration, beta cells had stable resting [Ca2+]c (Figure 2b). Physiological stimulatory concentration of glucose, after a delay of several hundred seconds, triggered a biphasic Ca2+ response, composed of a series of slow, non-synchronized oscillations in [Ca2+]c during the initial transient phase (Figure 2b). This delay can differ quite substantially between the islets when stimulated with physiological glucose concentration. The initial phase was followed by prolonged plateau activity with fast synchronized oscillations (Figure 2b). This plateau activity diminished reliably when glucose was lowered back to 6 mM (Figure 2b). Note that the initial beta cell response to stimulatory glucose concentrations is very heterogenous with different onset times, different sizes of activating cell clusters, and duration as well as number of slow oscillatory events, which is in line with our previous work [61]. Slower oscillations in the transient phase have a mean duration of some tens of seconds (Figure 2c,d). On the other hand, during the plateau phase, well synchronized faster events with a duration of 2–3 s predominate. Those events are, however, also compound events, presenting a temporal summation of even faster Ca2+ spikes that are believed to correspond to burst of membrane potential depolarizations.
Acinar cells in situ reproducibly responded to glucose stimulation with slow [Ca2+]c oscillations that were mostly not synchronized between the cells. The dominant halfwidth duration of these oscillations was above 10 s (Figure 2 and Figure 3). The glucose response was concentration-dependent, with a faster onset to 8 mM glucose stimulation and delayed switch off during the substimulatory 6 mM glucose washout period compared to beta cells (Figure 2 and Figure 3).
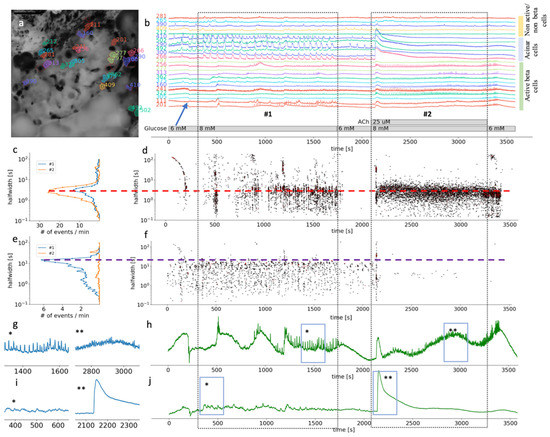
Figure 3.
Time scales and heterogeneity of responses of cytosolic Ca2+ oscillations in mouse beta and acinar cells stimulated with 8 mM glucose or 8 mM glucose plus 25 µM ACh. (a) Localization of several beta, acinar and non-active beta on non-beta cell in pancreas tissue slices. (b) Temporal profile of the [Ca2+]c changes in a beta, acinar and non-active beta on non-beta cells shown in pancreas tissue slice in (a). The two dashed rectangles stretching across the panes indicate the periods of stimulation. (c) The frequency histogram of the halfwidth durations of the events and (d), onset time of the [Ca2+]c events at measured time scales for active beta cells (n = 113). Addition of 25 μM ACh increased the frequency of the [Ca2+]c events, the dominant halfwidth duration stayed unchanged (red dashed line). (e) The frequency histogram of the halfwidth durations of the events in acinar cell and (f), onset time of the [Ca2+]c events at measured time scales for functional regions of acinar cells (n = 33). Addition of 25 μM ACh abolished [Ca2+]c oscillations of the dominant scale (violet dashed line). (g) Expanded time traces of an average from all ROIs specify as active beta cell shown in (h) (n = 113). (h) (*) is indicating plateau phase of the response to glucose stimulatory concentration. (**) is indicating fast events in plateau phase during stimulation with 25 µM on top of the 8 mM glucose in panel. (i) Expanded time traces of an average from all ROIs correspond to functional regions of acinar cells (n = 33), shown in (j). (*) is indicating average [Ca2+]c events during stimulation with 8 mM glucose. (**) is indicating average [Ca2+]c events during stimulation with 25 µM ACh on top of the stimulatory glucose concentration. Blue arrow on (b) is indicating an artefact due to a transient slice movement that occurred during imaging and was detectable in multiple time traces.
Our results showed that based on the morphological and functional features, after stimulation with a physiological glucose concentration, it is possible to reliably differentiate pancreatic beta cells from acinar cells by measuring [Ca2+]c changes in situ. The [Ca2+]c oscillations in beta cells are about an order of magnitude more frequent compared to acinar cells and are by about the same factor shorter in duration, but also well-synchronized. In acinar cells, physiological levels of ACh enhanced synchronization and shortened the duration of the events (Figure 2e,j).
3.2. Differential Effects of Glucose and ACh on Oscillations in [Ca2+]c
In the second part of the experiments, ACh was coapplied during the 8 mM glucose stimulation (Figure 2 and Figure 3, video S2). Under these stimulatory conditions, the application of a physiological concentration of ACh still produced an apparent biphasic response in beta cells. However, the onset time delays between different cell clusters during the transient phase were diminished (Figure 2b,d) to the extent that the typical time profile of the compound slow events we could record from individual ROI representing a beta cell became apparent also on the average signal representing all active beta cells (Figure 2g). The median delay to the first event was reduced from 358 s (Q1 308 s, Q3 576 s) to 223 s (Q1 182 s, Q3 253 s, p < 0001). Furthermore, this stimulation produced an elevation of the frequency of the fast [Ca2+]c oscillatory activity during the plateau phase and the halfwidth duration of the oscillations decreased from 1.6 s (Q1 1.3 s, Q3 1.9 s) to 1.3 s (Q1 1.1 s, Q3 1.6 s, p < 0.001) (Figure 2c). Similar to faster and synchronous onsets of [Ca2+]c oscillations, these events also tended to wash out faster when the stimulatory glucose concentration was replaced with a non-stimulatory 6 mM glucose in the ECS.
In acinar cells, addition of 50 nM ACh triggered [Ca2+]c oscillations, which were better synchronized between the ROIs compared to glucose stimulation alone (Figure 2i) as can be seen from the average signal from all functional regions of acinar cells (Figure 2j). The events with the median halfwidth value of about 7, did not change after the ACh stimulation (Figure 3e). The peaks of [Ca2+]c recorded at this ACh concentration showed only moderate temporal summation, which would confirm that we stimulated in the physiological range (Figure 2b,i,j). Acinar cells responded to ACh sooner (median 140 s, Q1 104 s, Q3 179 s) compared to the activation onset of beta cells in the same slice (median 223 s, Q1 181 s, Q3 253 s, p < 0.001).
Supraphysiological concentrations of ACh have been more often used in isolated preparations of pancreas tissue, such as isolated islets or isolated acini. In our experiments, both beta and acinar cells responded to 25 µM ACh with a biphasic response (Figure 3b,g). At this high ACh concentration, the initial response was still faster in acinar cells (median 43 s, Q1 42 s, Q3 44 s) compared to beta cells (median 47 s, Q1 46 s, Q3 48 s, p < 0.001) (Figure 3d,i); however, the difference was only a few seconds. At the level of individual beta cells, the second phase was characterized with higher frequency oscillations compared to glucose stimulation alone, and with a shorter dominant halfwidth duration of [Ca2+]c events (median 2.8 s, Q1 1.9 s, Q3 3.8 s) compared to glucose only (median 3.0 s, Q1 1.8 s, Q3 4.2 s, p < 0.025) (Figure 3c). The major difference to the glucose only control conditions or physiological ACh stimulation was that the fast plateau oscillations in beta cells were no longer synchronized on the islet level (Figure 3c,g). On the temporal profile showing an average of all active beta cells, oscillations are therefore hardly noticeable (Figure 3h). Interestingly, the beta cells resynchronized rapidly after ACh has been washed out of the recording chamber (Figure 3b,h). This result showed that the high ACh effect washed out faster than that of stimulatory glucose (Figure 3b,d).
In acinar cells, the second phase of the response to 8 mM glucose and 25 µM ACh produced a sustained and elevated plateau, with only weakly detectable oscillations in [Ca2+]c (Figure 3f,i). Elevation in [Ca2+]c under these conditions is pathologically high, which has also been picked up by the size of the ROIs, which now covered the complete area of the acinar cell, showing activity in apical as well as basolateral pole of an acinar cell.
Our results show that ACh stimulation produced concentration-dependent dual effects and that ACh above micromolar concentration does not represent physiological conditions.
4. Discussion
The morphological identification of exocrine acinar cells in wild-type mouse pancreatic tissue slices has been well established and straightforward. Our study here provides additional means to distinguish acinar cells from islet beta cells. We revealed the different functional features between these two cell types upon stimulation with secretagogues with known effects. All the more valuable can this functional discrimination become in discrimination of endocrine cells from acinar cells in studying human tissue slices, slices of the diabetic or genetically modified mouse models, where the morphological features are not always apparent.
In acinar cells, stimulation of M1Rs and M3Rs, and the ensuing formation of IP3 is the major mechanism to robustly driving digestive enzyme release [11]. M3Rs were suggested to play a key role in maintaining insulin release and nutrient homeostasis of beta cells [19]. However, the exact mechanisms downstream of these receptors activation in beta cells are less well known, since a number of different mechanism have been discussed [2]. Even more controversial is the role of glucose-dependent stimulation on acinar cells which should, at least transiently, play an important physiological role in stimulation of the amylase release. In this study we tried to correlate the effects of stimulatory glucose and ACh measured simultaneously from the fresh pancreatic tissue slice.
In a number of previous studies, ACh was used predominantly in its supraphysiological range to determine the effect of this parasympathetic neurotransmitter on the islets electrical activity and [Ca2+]c oscillations [2]. ACh in supraphysiological concentrations was used to study cholinergic signal transduction in several other tissues and cell types [62,63]. Glucose and ACh were found to utilize secretagogue-specific effects on the electrical activity pattern [64]. Increasing glucose concentration resulted in burst prolongation and eventually reduced frequency [46]. On the other hand, higher ACh increased frequency, while the burst duration did not increase [64].
At stimulatory glucose concentrations, addition of physiological concentration of ACh should primarily trigger membrane depolarization mediated by a Na+-dependent mechanism, which was suggested to operate through transient receptor potential-canonical (TRPC) channels [65]. This depolarization further induces Ca2+ influx through VACCs, which is compatible with an increased frequency of [Ca2+]c events. All effects of ACh on membrane potential could be antagonized by atropine, suggesting an involvement of MxRs [64]. At pharmacological ACh concentrations, the primary mechanism should involve Ca2+ mobilization from the ER and inhibition of L-type VACCs. The latter was suggested to serve prevention of a deleterious Ca2+ overload [2]. Interestingly, despite the inhibition of VACCs at high ACh, insulin release was not inhibited unless stimulation was prolonged [2].
What new can we learn from our analysis? Both glucose and ACh in the physiological range stimulate [Ca2+]c oscillations in beta and acinar cells. Acinar cells are more sensitive to both stimulations compared to beta cells. They were shown to switch on earlier and switch off later. In case of glucose stimulation this likely reflects differential expression of GLUT transporters in these two different cell types. Beta cells in mice express low-affinity GLUT2 transporters, while acinar cells express high-affinity GLUT1 and GLUT3 transporters [66]. Higher sensitivity to ACh in acinar cells may on the other hand reflect scarcer innervation of exocrine tissue compared to the innervation of islets [7]. At saturating concentrations of ACh, both cell types activated practically at the same time.
One of the more prominent effects of physiological ACh stimulation is complete synchronization of the activation onsets between different beta cells in an islet. A possible explanation is that in the slices there is a residual tonus of ACh related to the innervation of individual beta cells, which contributes to apparent heterogeneity between the activation onsets in different beta cells. Addition of a physiological level of ACh possibly overrides these local differences. Alternatively, pancreatic tissue slices are thick enough to contain intraganglionic neurons that express nicotinic ACh receptors. Future work with antagonists of both muscarinic and nicotinic receptors is needed to resolve this issue. At more extreme ACh concentrations, the frequency of [Ca2+]c oscillations in individual beta cells was further increased; however, the synchronization of the events on the plateau phase between beta cells in an islet was completely lost. It has been previously reported that fast [Ca2+]c oscillations during the plateau phase and their synchronization predominantly reflect the activity of RYRs [51]. An enhanced stimulation of IP3 receptors due to chronic muscarinic stimulation and IP3 production could interfere with the function of RYR receptors and lead to desynchronization.
Ca2+ oscillations mediated by muscarinic activation depend on agonist concentration and we believe they are essential for not only physiological response of beta cells to glucose, but also normally functional acinar cells. Furthermore, elevated intracellular Ca2+ alone cannot promote IP3 production in beta cells [51], which is another piece of evidence to support the importance of ACh signaling through muscarinic activation. Moreover, IP3R activation could be evoked with ACh in combination with substimulatory glucose concentration and is resulting in [Ca2+]c oscillations very akin to oscillation observed in the first phase during the 8 mM glucose stimulation. In addition, significance of the IP3 signaling pathway was shown with the IP3 inhibitor Xestospongin C, which selectively blocks activity of IP3. Xestospongin C blocked events in the transient phase and changed the phenotype of the first initial phase, but left the plateau phase intact [51]. It is well established that ACh in acinar cells mediates action through the muscarinic receptors, followed by IP3 production that consequently generates Ca2+ oscillations [67], hence ACh stimulates acinar enzyme secretion [68]. Experimental data, obtained from isolated single acinar cells with specific muscarinic receptor knock-out, strongly suggest the importance of muscarinic activation and IP3 signaling in acinar cells [69].
Acinar cells at physiological concentrations of agents such as ACh, that evoke Ca2+ from intracellular stores, start local and short lasting [Ca2+]c oscillations, which are synchronized among the neighboring cells, and which control enzyme and acinar fluid secretion [70]. High supraphysiological ACh concentrations generated a distinct Ca2+ spike followed by abolished [Ca2+]c oscillations. The described course of events in acinar cells is expected when [Ca2+]c is drastically increased, eventually resulting in long-term inhibition of digestive enzyme secretion [71].
In summary, fresh tissue slices are the method of choice to simultaneously assess different endocrine and exocrine cell types in pancreas. Both morphological and progressively better functional characterization can provide useful information about differences between the observed cell types as well uncover delicate interactions between these cell types. The high sensitivity to physiological and pharmacological substances better represents the in vivo situation compared to dispersed cells or cell clusters. Our findings provide an important base for the future studies in physiology and pathophysiology of pancreas using mouse models and tissue from human donors. However, beta cell function can be inherently tied to calcium activity and caution is required to identify dysfunctional beta cells in severe phenotypes.
Supplementary Materials
The following are available online at https://www.mdpi.com/article/10.3390/cells10071580/s1, Video S1: Video of Figure 2; Video S2: Video of Figure 3.
Author Contributions
Conceptualization, N.S., Y.-C.H., A.S. and M.S.R.; methodology, N.S., S.P., S.S.; writing—original draft preparation, N.S., S.P., Y.-C.H., A.S. and M.S.R.; writing—review and editing, N.S., S.P., Y.-C.H., A.S. and M.S.R.; funding acquisition, A.S. and M.S.R. All authors have read and agreed to the published version of the manuscript.
Funding
MSR receives grants by the Austrian Science Fund/Fonds zur Förderung der Wissenschaftlichen Forschung (bilateral grants I3562-B27 and I4319-B30). MSR and AS further received financial support from the Slovenian Research Agency (research core funding programs P3-0396 and I0-0029, as well as projects N3-0048, N3-0133 and J3-9289). Open Access Funding by the Austrian Science Fund (FWF).
Institutional Review Board Statement
We conducted the study in strict accordance with all national and European recommendations on care and handling experimental animals, and all efforts were made to minimize the suffering of animals. The Ministry of Education, Science and Research, Republic of Austria (No: 2020-0.488.800) and administration of the Republic of Slovenia for Food Safety, Veterinary and Plant Protection (No: U34401-12/2015/3) approved the experimental protocol (No: U34401-12/2015/3).
Informed Consent Statement
Not applicable.
Data Availability Statement
The data presented in this study are available on request from the corresponding author. The data are not publicly available due to their large size.
Acknowledgments
Open Access Funding by the Austrian Science Fund (FWF).
Conflicts of Interest
The authors declare no conflict of interest. The funders had no role in the design of the study; in the collection, analyses, or interpretation of data; in the writing of the manuscript, or in the decision to publish the results.
References
- Ahrén, B. Autonomic regulation of islet hormone secretion–Implications for health and disease. Diabetologia 2000, 43, 393–410. [Google Scholar] [CrossRef]
- Gilon, P.; Henquin, J.-C. Mechanisms and Physiological Significance of the Cholinergic Control of Pancreatic β-Cell Function. Endocr. Rev. 2001, 22, 565–604. [Google Scholar] [PubMed]
- Brunicardi, F.C.; Shavelle, D.M.; Andersen, D.K. Neural Regulation of the Endocrine Pancreas. Int. J. Pancreatol. 1995, 18, 177–195. [Google Scholar] [PubMed]
- Ahrén, B.; Taborsky, G.J.; Porte, D. Neuropeptidergic versus cholinergic and adrenergic regulation of islet hormone secretion. Diabetologia 1986, 29, 827–836. [Google Scholar] [CrossRef] [PubMed]
- Taylor, C.W. Inositol trisphosphate receptors Ca2+-modulated intracellular Ca2+ channels. Biochim. Et Biophys. Acta BBA Mol. Cell Biol. Lipids 1998, 1436, 19–33. [Google Scholar] [CrossRef]
- Miller, R.E. Pancreatic Neuroendocrinology-Peripheral Neural Mechanisms in the Regulation of the Islets for Langerhans. Endocr. Rev. 1981, 2, 471–494. [Google Scholar] [CrossRef]
- Dolenšek, J.; Rupnik, M.S.; Stožer, A. Structural similarities and differences between the human and the mouse pancreas. Islets 2015, 7, e1024405. [Google Scholar] [CrossRef]
- Godfrey, D.A.; Matschinsky, F.M. Enzymes of the cholinergic system in islets of Langerhans. J. Histochem. Cytochem. 1975, 23, 645–651. [Google Scholar] [CrossRef]
- Ahrén, B.O.; Gerald, J.; Taborsky, J.R. The mechanism of vagal nerve stimulation of glucagon and insulin secretion in the dog. Endocrinology 1986, 118, 1551–1557. [Google Scholar] [CrossRef]
- Van Der Zee, E.A.; Buwalda, B.; Strubbe, J.H.; Strosberg, A.D.; Luiten, P.G.M. Immunocytochemical localization of muscarinic acetylcholine receptors in the rat endocrine pancreas. Cell Tissue Res. 1992, 269, 99–106. [Google Scholar] [CrossRef]
- Gautam, D.; Han, S.J.; Heard, T.S.; Cui, Y.; Miller, G.; Bloodworth, L.; Jürgen, W. Cholinergic stimulation of amylase secretion from pancreatic acinar cells studied with muscarinic acetylcholine receptor mutant mice. J. Pharmacol. Exp. Ther. 2005, 313, 995–1002. [Google Scholar] [CrossRef]
- Arciszewski, M.Z.-S.A. Cholinergic innervation of the pancreas in the sheep. Acta Biol. Hung. 2007, 58, 151–161. [Google Scholar] [CrossRef]
- Li, W.; Yu, G.; Liu, Y.; Sha, L. Intrapancreatic Ganglia and Neural Regulation of Pancreatic Endocrine Secretion. Front. Neurosci. 2019, 13, 21. [Google Scholar] [CrossRef] [PubMed]
- Moede, T.; Leibiger, I.B.; Berggren, P.O. Alpha cell regulation of beta cell function. Diabetologia 2020, 63, 2064–2075. [Google Scholar] [CrossRef] [PubMed]
- Rodriguez-Diaz, R.; Dando, R.; Jacques-Silva, M.C.; Fachado, A.; Molina, J.; Abdulreda, M.H.; Ricordi, C.; Roper, S.D.; Berggren, P.-O.; Caicedo, A. Alpha cells secrete acetylcholine as a non-neuronal paracrine signal priming beta cell function in humans. Nat. Med. 2011, 17, 888–892. [Google Scholar] [CrossRef] [PubMed]
- Duttaroy, A.; Zimliki, C.L.; Gautam, D.; Cui, Y.; Mears, D.; Wess, J. Muscarinic Stimulation of Pancreatic Insulin and Glucagon Release Is Abolished in M3 Muscarinic Acetylcholine Receptor-Deficient Mice. Diabetes 2004, 53, 1714–1720. [Google Scholar] [CrossRef] [PubMed]
- Molina, J.; Rodriguez-Diaz, R.; Fachado, A.; Jacques-Silva, M.C.; Berggren, P.O.; Caicedo, A. Control of Insulin Secretion by Cholinergic Signaling in the Human Pancreatic Islet. Diabetes 2014, 63, 2714–2726. [Google Scholar] [CrossRef]
- Zawalich, W.S.; Zawalich, K.C.; Tesz, G.J.; Taketo, M.M.; Sterpka, J.; Philbrick, W.; Matsui, M. Effects of muscarinic receptor type 3 knockout on mouse islet secretory responses. Biochem. Biophys. Res. Commun. 2004, 315, 872–876. [Google Scholar] [CrossRef]
- Gautam, D.; Han, S.-J.; Hamdan, F.F.; Jeon, J.; Li, B.; Li, J.H.; Cui, Y.; Mears, D.; Lu, H.; Deng, C.; et al. A critical role for β cell M3 muscarinic acetylcholine receptors in regulating insulin release and blood glucose homeostasis In Vivo. Cell Metab. 2006, 3, 449–461. [Google Scholar] [CrossRef]
- Weng, L.; Davies, M.; Ashcroft, S.J. Effects of cholinergic agonists on diacylglycerol and intracellular calcium levels in pancreatic beta-cells. Cell. Signal. 1993, 5, 777–786. [Google Scholar] [CrossRef]
- Kelley, G.G.; Zawalich, K.C.; Zawalich, W.S. Synergistic interaction of glucose and neurohumoral agonists to stimulate islet phosphoinositide hydrolysis. Endocrinol. Metab. 1995, 269, E575–E582. [Google Scholar] [CrossRef]
- Verspohl, E.J.; Tacke, R.; Mutschler, E.; Lambrecht, G. Muscarinic receptor subtypes in rat pancreatic islets-binding and functional studies. Eur. J. Pharmacol. 1990, 178, 303–311. [Google Scholar] [CrossRef]
- Mikoshiba, K. IP3 receptor/Ca2+ channel: From discovery to new signaling concepts. J. Neurochem. 2007, 102, 1426–1446. [Google Scholar] [CrossRef]
- Tamarina, N.A.; Kuznetsov, A.; Rhodes, C.J.; Bindokas, V.P.; Philipson, L.H. Inositol (1,4,5)-trisphosphate Dynamics and Intracellular Calcium Oscillations in Pancreatic beta-cells. Diabetes 2005, 54, 3073–3081. [Google Scholar] [CrossRef] [PubMed]
- Zawalich, W.S. Time-dependent potentiation of insulin release induced by alpha-ketoisocaproate and leucine in rats: Possible involvement of phosphoinositide hydrolysis. Diabetologia 1988, 31, 435–442. [Google Scholar] [CrossRef] [PubMed]
- Rorsman, P.; Ashcroft, F.M. Pancreatic β-Cell Electrical Activity and Insulin Secretion: Of Mice and Men. Physiol. Rev. 2018, 98, 117–214. [Google Scholar] [CrossRef]
- Mandic, S.A.; Skelin, M.; Johansson, J.U.; Rupnik, M.S.; Berggren, P.-O.; Bark, C. Munc18-1 and Munc18-2 Proteins Modulate β-Cell Ca2+ Sensitivity and Kinetics of Insulin Exocytosis Differently. J. Biol. Chem. 2011, 286, 28026–28040. [Google Scholar] [CrossRef] [PubMed]
- Gilon, P.; Yakel, J.; Gromada, J.; Zhu, Y.; Henquin, J.C.; Rorsman, P. G protein-dependent inhibition of L-type Ca2+ currents by acetylcholine in mouse pancreatic B-cells. J. Physiol. 1997, 499, 65–76. [Google Scholar] [CrossRef]
- Berridge, M.J. Neuronal Calcium Signaling. Neuron 1998, 21, 13–26. [Google Scholar] [CrossRef]
- Streb, H.; Irvine, R.F.; Berridge, M.J.; Schulz, I. Release of Ca2+ from a nonmitochondrial intracellular store in pancreatic acinar cells by inositol-1,4,5-trisphosphate. Nature 1983, 306, 67–69. [Google Scholar] [CrossRef]
- Berridge, M.J. Rapid accumulation of inositoltrisphosphate reveals that agonists hydrolyse polyphosphoinositides instead of phosphatidylinositol. Biochem. J. 1983, 212, 849–858. [Google Scholar] [CrossRef]
- Prentki, M.; Biden, T.J.; Janjic, D.; Irvine, R.F.; Berridge, M.J.; Wollheim, C.B. Rapid mobilization of Ca2+ from rat insulinoma microsomes by inositol-1,4,5-trisphosphate. Nature 1984, 309, 562–564. [Google Scholar] [CrossRef]
- Blodgett, D.M.; Nowosielska, A.; Afik, S.; Pechhold, S.; Cura, A.J.; Kennedy, N.J.; Kim, S.; Kucukural, A.; Davis, R.J.; Kent, S.C.; et al. Novel Observations From Next-Generation RNA Sequencing of Highly Purified Human Adult and Fetal Islet Cell Subsets. Diabetes 2015, 64, 3172–3181. [Google Scholar] [CrossRef]
- Wojcikiewicz, R.J. Type I, II, and III inositol 1,4,5-trisphosphate receptors are unequally susceptible to down-regulation and are expressed in markedly different proportions in different cell types. J. Biol. Chem. 1995, 270, 11678–11683. [Google Scholar] [CrossRef]
- Joseph, S.K. The inositol triphosphate receptor family. Cell. Signal. 1996, 8, 1–7. [Google Scholar] [CrossRef]
- Santulli, G.; Nakashima, R.; Yuan, Q.; Marks, A.R. Intracellular calcium release channels: An update. J. Physiol. 2017, 595, 3041–3051. [Google Scholar] [CrossRef] [PubMed]
- Cancela, J.M.; Petersen, O.H. Regulation of Intracellular Ca2+ Stores by Multiple Ca2+-Releasing Messengers. Diabetes 2002, 51 (Suppl. S3), S349–S357. [Google Scholar] [CrossRef]
- Lee, H.C. Mechanism of calcium signaling by cyclic ADP-ribose and NAADP. Physiol. Rev. 1997, 77, 1133–1164. [Google Scholar] [CrossRef] [PubMed]
- Masgrau, R.; Churchill, G.C.; Morgan, A.J.; Ashcroft, S.J.H.; Galione, A. NAADP: A New Second Messenger for Glucose-Induced Ca2+ Responses in Clonal Pancreatic β Cells. Curr. Biol. 2003, 4, 247–251. [Google Scholar] [CrossRef]
- BioRender. Available online: https://biorender.com/ (accessed on 14 May 2021).
- Berridge, M.J.; Lipp, P.; Bootman, M.D. The versatility and universality of calcium signalling. Nat. Rev. Mol. Cell Biol. 2000, 1, 11–21. [Google Scholar] [CrossRef]
- Wollheim, C.B.; Sharp, G.W. Regulation of insulin release by calcium. Physiol. Rev. 1981, 61, 914–973. [Google Scholar] [CrossRef]
- Bergsten, P. Slow and fast oscillations of cytoplasmic Ca2+ in pancreatic islets correspond to pulsatile insulin release. Am. J. Physiol. Endocrinol. Metab. 1995, 268, E282–E287. [Google Scholar] [CrossRef]
- Zmazek, J.; Klemen, M.S.; Markovič, R.; Dolenšek, J.; Marhl, M.; Stožer, A.; Gosak, M. Assessing Different Temporal Scales of Calcium Dynamics in Networks of Beta Cell Populations. Front. Physiol. 2021, 12, 337. [Google Scholar] [CrossRef] [PubMed]
- Skelin Klemen, M.; Dolensek, J.; Slak Rupnik, M.; Stozer, A. The triggering pathway to insulin secretion: Functional similarities and differences between the human and the mouse beta cells and their translational relevance. Islets 2017, 9, 109–139. [Google Scholar] [CrossRef]
- Stožer, A.; Klemen, M.S.; Gosak, M.; Bombek, L.K.; Pohorec, V.; Rupnik, M.S.; Stožer, A. Glucose-dependent activation, activity, and deactivation of beta cell networks in acute mouse pancreastissueslices. BioRxiv 2021. Available online: https://www.biorxiv.org/content/10.1101/2020.03.11.986893v1 (accessed on 14 May 2021).
- Stauffer, P.L.; Zhao, H.; Luby-Phelps, K.; Moss, R.L.; Star, R.A.; Muallem, S. Gap junction communication modulates [Ca2+]i oscillations and enzyme secretion in pancreatic acini. J. Biol. Chem. 1993, 268, 19769–19775. [Google Scholar] [CrossRef]
- Gryshchenko, O.; Gerasimenko, J.V.; Peng, S.; Gerasimenko, O.V.; Petersen, O.H. Calcium signalling in the acinar environment of the exocrine pancreas: Physiology and pathophysiology. J. Physiol. 2018, 596, 2663–2678. [Google Scholar] [CrossRef] [PubMed]
- Gerasimenko, J.V.; Gerasimenko, O.V.; Petersen, O.H. The role of Ca 2+ in the pathophysiology of pancreatitis. J. Physiol. 2014, 592, 269–280. [Google Scholar] [CrossRef]
- Petersen, O.H. Ca2+ signaling in pancreatic acinar cells: Physiology and pathophysiology. Braz. J. Med. Biol. Res. 2009, 42, 9–16. [Google Scholar] [CrossRef][Green Version]
- Postić, S.; Sarikas, S.; Pfabe, J.; Pohorec, V.; Bombek, L.K.; Sluga, N.; Klemen, M.S.; Dolenšek, J.; Korošak, D.; Stožer, A.; et al. Intracellular Ca2+ channels initiate physiological glucose signaling in beta cells examined in situ. BioRxiv 2021. Available online: https://www.biorxiv.org/content/10.1101/2021.04.14.439796v2 (accessed on 14 May 2021).
- Ashcroft, F.M.; Rorsman, P. Electrophysiology of the pancreatic β-cell. Prog. Biophys. Mol. Biol. 1989, 54, 87–143. [Google Scholar] [CrossRef]
- Speier, S.; Rupnik, M. A novel approach to in situ characterization of pancreatic β-cells. Pflüg. Arch. 2003, 446, 553–558. [Google Scholar] [CrossRef] [PubMed]
- Stožer, A.; Dolenšek, J.; Križančić Bombek, L.; Pohorec, V.; Slak Rupnik, M.; Klemen, M.S. Confocal Laser Scanning Microscopy of Calcium Dynamics in Acute Mouse Pancreatic Tissue Slices. J. Vis. Exp. 2021, 170, 1–26. [Google Scholar] [CrossRef]
- Marciniak, A.; Cohrs, C.M.; Tsata, V.; Chouinard, J.A.; Selck, C.; Stertmann, J.; Reichelt, S.; Rose, T.; Ehehalt, F.; Weitz, J.; et al. Using pancreas tissue slices for in situ studies of islet of Langerhans and acinar cell biology. Nat. Protoc. 2014, 9, 2809–2822. [Google Scholar] [CrossRef]
- Mateus Gonçalves, L.; Almaça, J. Functional Characterization of the Human Islet Microvasculature Using Living Pancreas Slices. Front. Endocrinol. 2021, 11, 1015. [Google Scholar] [CrossRef] [PubMed]
- Panzer, J.K.; Hiller, H.; Cohrs, C.M.; Almaça, J.; Enos, S.J.; Beery, M.; Cechin, S.; Drotar, D.M.; Weitz, J.R.; Santini, J.; et al. Pancreas tissue slices from organ donors enable in situ analysis of type 1 diabetes pathogenesis. JCI Insight 2020, 5, e134525. [Google Scholar] [CrossRef] [PubMed]
- Gál, E.; Dolenšek, J.; Stožer, A.; Pohorec, V.; Ébert, A.; Venglovecz, V. A Novel in situ Approach to Studying Pancreatic Ducts in Mice. Front. Physiol. 2019, 10, 938. [Google Scholar] [CrossRef] [PubMed]
- Weitz, J.R.; Makhmutova, M.; Almaça, J.; Stertmann, J.; Aamodt, K.; Brissova, M.; Speier, S.; Rodriguez-Diaz, R.; Caicedo, A. Mouse pancreatic islet macrophages use locally released ATP to monitor beta cell activity. Diabetologia 2018, 61, 182–192. [Google Scholar] [CrossRef] [PubMed]
- Dolenšek, J.; Špelič, D.; Klemen, M.; Žalik, B.; Gosak, M.; Rupnik, M.; Stožer, A. Membrane Potential and Calcium Dynamics in Beta Cells from Mouse Pancreas Tissue Slices: Theory, Experimentation, and Analysis. Sensors 2015, 15, 27393–27419. [Google Scholar] [CrossRef]
- Stožer, A.; Dolenšek, J.; Rupnik, M.S. Glucose-Stimulated Calcium Dynamics in Islets of Langerhans in Acute Mouse Pancreas Tissue Slices. PLoS ONE 2013, 8, e54638. [Google Scholar] [CrossRef]
- Sekiguchi-Tonosaki, M.; Obata, M.; Haruki, A.; Himi, T.; Kosaka, J. Acetylcholine induces Ca2+ signaling in chicken retinal pigmented epithelial cells during dedifferentiation. Am. J. Physiol. Cell Physiol. 2009, 296, C1195–C1206. [Google Scholar] [CrossRef]
- Zhao, M.; Jia, H.H.; Liu, L.Z.; Bi, X.Y.; Xu, M.; Yu, X.J.; He, X.; Zang, W.-J. Acetylcholine attenuated TNF-alpha-induced intracellular Ca(2+) overload by inhibiting the formation of the NCX1-TRPC3-IP3R1 complex in human umbilical vein endothelial cells. J. Mol. Cell Cardiol. 2017, 107, 1–12. [Google Scholar] [CrossRef]
- Cook, D.L.; Crill, W.E.; Porte, D. Glucose and Acetylcholine Have Different Effects on the Plateau Pacemaker of Pancreatic Islet Cells. Diabetes 1981, 30, 558–561. [Google Scholar] [CrossRef] [PubMed]
- Roe, M.W.; Worley, J.F.; Qian, F.; Tamarina, N.; Mittal, A.A.; Dralyuk, F.; Blair, N.T.; Mertz, R.J.; Philipson, L.H.; Dukes, l.D. Characterization of a Ca2+ Release-activated Nonselective Cation Current Regulating Membrane Potential and [Ca2+] Oscillations in Transgenically Derived β-Cells. J. Biol. Chem. 1998, 273, 10402–10410. [Google Scholar] [CrossRef] [PubMed]
- Zhao, F.-Q.; Keating, A. Functional Properties and Genomics of Glucose Transporters. Curr. Genom. 2007, 8, 113–128. [Google Scholar] [CrossRef] [PubMed]
- Perc, M.; Rupnik, M.; Gosak, M.; Marhl, M. Prevalence of stochasticity in experimentally observed responses of pancreatic acinar cells to acetylcholine. Chaos 2009, 19, 037113. [Google Scholar] [CrossRef] [PubMed]
- Phillips, P.A.; Yang, L.; Shulkes, A.; Vonlaufen, A.; Poljak, A.; Bustamante, S.; Warren, A.; Xu, Z.; Guilhaus, M.; Pirola, R.; et al. Pancreatic stellate cells produce acetylcholine and may play a role in pancreatic exocrine secretion. Proc. Natl. Acad. Sci. USA 2010, 107, 17397–17402. [Google Scholar] [CrossRef]
- Nakamura, K.; Hamada, K.; Terauchi, A.; Matsui, M.; Nakamura, T.; Okada, T.; Mikoshiba, K. Distinct roles of M1 and M3 muscarinic acetylcholine receptors controlling oscillatory and non-oscillatory [Ca2+]i increase. Cell Calcium 2013, 54, 111–119. [Google Scholar] [CrossRef] [PubMed]
- Petersen, O.H.; Tepikin, A.V. Polarized calcium signaling in exocrine gland cells. Annu. Rev. Physiol. 2008, 70, 273–299. [Google Scholar] [CrossRef]
- Tsunoda, Y.; Stuenkel, E.L.; Williams, J.A. Characterization of sustained [ Ca2+]i increase in pancreatic acinar cells and its relation to amylase secretion. Am. J. Physiol. 1990, 259, G792–G801. [Google Scholar] [CrossRef]


Publisher’s Note: MDPI stays neutral with regard to jurisdictional claims in published maps and institutional affiliations. |
© 2021 by the authors. Licensee MDPI, Basel, Switzerland. This article is an open access article distributed under the terms and conditions of the Creative Commons Attribution (CC BY) license (https://creativecommons.org/licenses/by/4.0/).