Article

Medium-Frequency Electrical Resistance Sintering of Soft Magnetic Powder Metallurgy Iron Parts

1
Engineering of Advanced Materials Group, Higher Technical School of Engineering, University of Sevilla, Avda. de los Descubrimientos s/n, 41092 Sevilla, Spain
2
Engineering of Advanced Materials Group, Higher Technical School of Engineering, University of Huelva, Avda. Tres de Marzo s/n, 21071 Huelva, Spain
*
Author to whom correspondence should be addressed.
Metals 2021, 11(6), 994; https://doi.org/10.3390/met11060994
Submission received: 18 May 2021 / Revised: 16 June 2021 / Accepted: 17 June 2021 / Published: 21 June 2021
(This article belongs to the Special Issue Metals Powders 2021: Synthesis and Processing)

Abstract

:
The fabrication of soft magnetic Fe parts by the medium-frequency electrical resistance sintering (MF-ERS) technique is studied in this paper. This consolidation technique involves the simultaneous application to metallic powders of pressure and heat, the latter coming from the Joule effect of a low-voltage and high-intensity electric current. Commercially pure iron powder was used in the consolidation experiences. The porosity distribution, microhardness, electrical resistivity and hysteresis curves of the final compacts were determined and analysed. The results obtained were compared both with those of compacts consolidated by the conventional powder metallurgy (PM) route of cold pressing and vacuum furnace sintering, and with fully dense compacts obtained by double cycle of cold pressing and furnace sintering in hydrogen atmosphere.

1. Introduction

The two major applications of sintered soft magnetic components in electromagnetic systems are sensors, which convert a movement into an electrical signal, and actuators, with the opposite working principle. Several iron-base materials [1], depending on the required properties, are used in sensors acting, for example, in engines or brake systems, or actuators in coil cores or poles. The automotive industry demands a large amount of these components [2].
As happens in many other contexts, the conventional powder metallurgy (PM) fabrication route, consisting in pressing a preform that is subsequently furnace sintered, can be supposed to offer certain advantages to these magnetic products. Thus, besides being a near net shape process and attaining a high-dimensional precision even in complex shapes, other advantages related to the surface finish, microstructural homogeneity, vibration damping because of the presence of microporosity, and the production repeatability, must be taken into account. Another singularly important advantage must be considered when PM processing includes methods such as mechanical alloying [3]: the possibility of obtaining in the starting powder compositions and homogeneities impossible to be attained by equilibrium methods.
Some of the aforementioned advantages cannot be maintained when alternative PM consolidation routes such as electrical consolidation are used, although some new as the speed of the process, the low applied pressure or fact of being unnecessary protective atmospheres must be considered. There are also present some drawbacks, for example, the difficulty of getting a homogeneous temperature distribution inside the powder mass, and finding the proper die material with a good durability. Other drawbacks arise from continuing insufficient theoretical knowledge of the various mechanisms involved [4].
Since the first patent on PM electrical consolidation was granted in 1933, many modalities have been developed and many attempts have been made to reach an industrial scale (see Grasso et al. [5], Orrù et al. [6] and Olevsky et al. [7]). The extended use of graphite dies with low wear resistance, and the application of combined alternating- and direct-current in specific designs, result in very expensive equipment. Thus, under these conditions, the application areas are limited. To increase the economy of the process, more durable alumina dies can be used instead, as well as much cheaper equipment adapted from the extended resistance welding field. The modality known as electrical resistance sintering (ERS), firstly described by Taylor [8] and developed by Lenel [9], takes advantage of this latter possibility.
Noteworthy when comparing the ERS and traditional PM routes are the high densification attained in ERS with low pressures (around 100 MPa), the very short processing times (around 1–2 s) and, as a consequence, the possibility of not using protective atmospheres [10]. However, the use of low pressures, and the usual inhomogeneous temperature distribution inside the processed powder, make it highly difficult to achieve isotropic properties and homogeneous microstructures in the three space directions. In addition, it is problematic to find a material for the die with an acceptable cost and durability (improving the alumina performance) [11]. Some recent works dealing with this modality can be found in [12,13]. In these works, a process conceptually similar to the ERS technique was successfully applied to iron-base materials, gold, silver tin oxide, titanium or rare-earth magnets.
In this paper, soft magnetic commercially pure iron powder was consolidated by medium-frequency electrical resistance sintering (MF-ERS). The medium-frequency technology supposes a great advantage, allowing the use of direct current, and the size and weight reduction of the welding transformer core at the time that maintains its power. Iron was chosen because of its simplicity to clearly analyse the virtues and defects of the MF-ERS technique in the manufacture of soft magnetic materials. To the best of the authors’ knowledge, no ERS works focusing on magnetic properties have been published before.
The objective of this work is to study if the MF-ERS process can lead to products with acceptable electromagnetic properties, to be added to the advantages of quickness and energetic saving inherent to the electric processing. Thus, porosity distribution, microhardness, electrical resistivity and hysteresis curves of MF-ERS Fe compacts were determined and compared with those measured in a compact prepared by the conventional PM route of cold pressing and vacuum furnace sintering, and with a fully dense compact processed by double press and sinter cycle in hydrogen atmosphere. The study is an extension of the work in [14], looking for practical uses (in this case, the magnetic applications) taking advantages of the MF-ERS technique.

2. Materials and Experimental Procedure

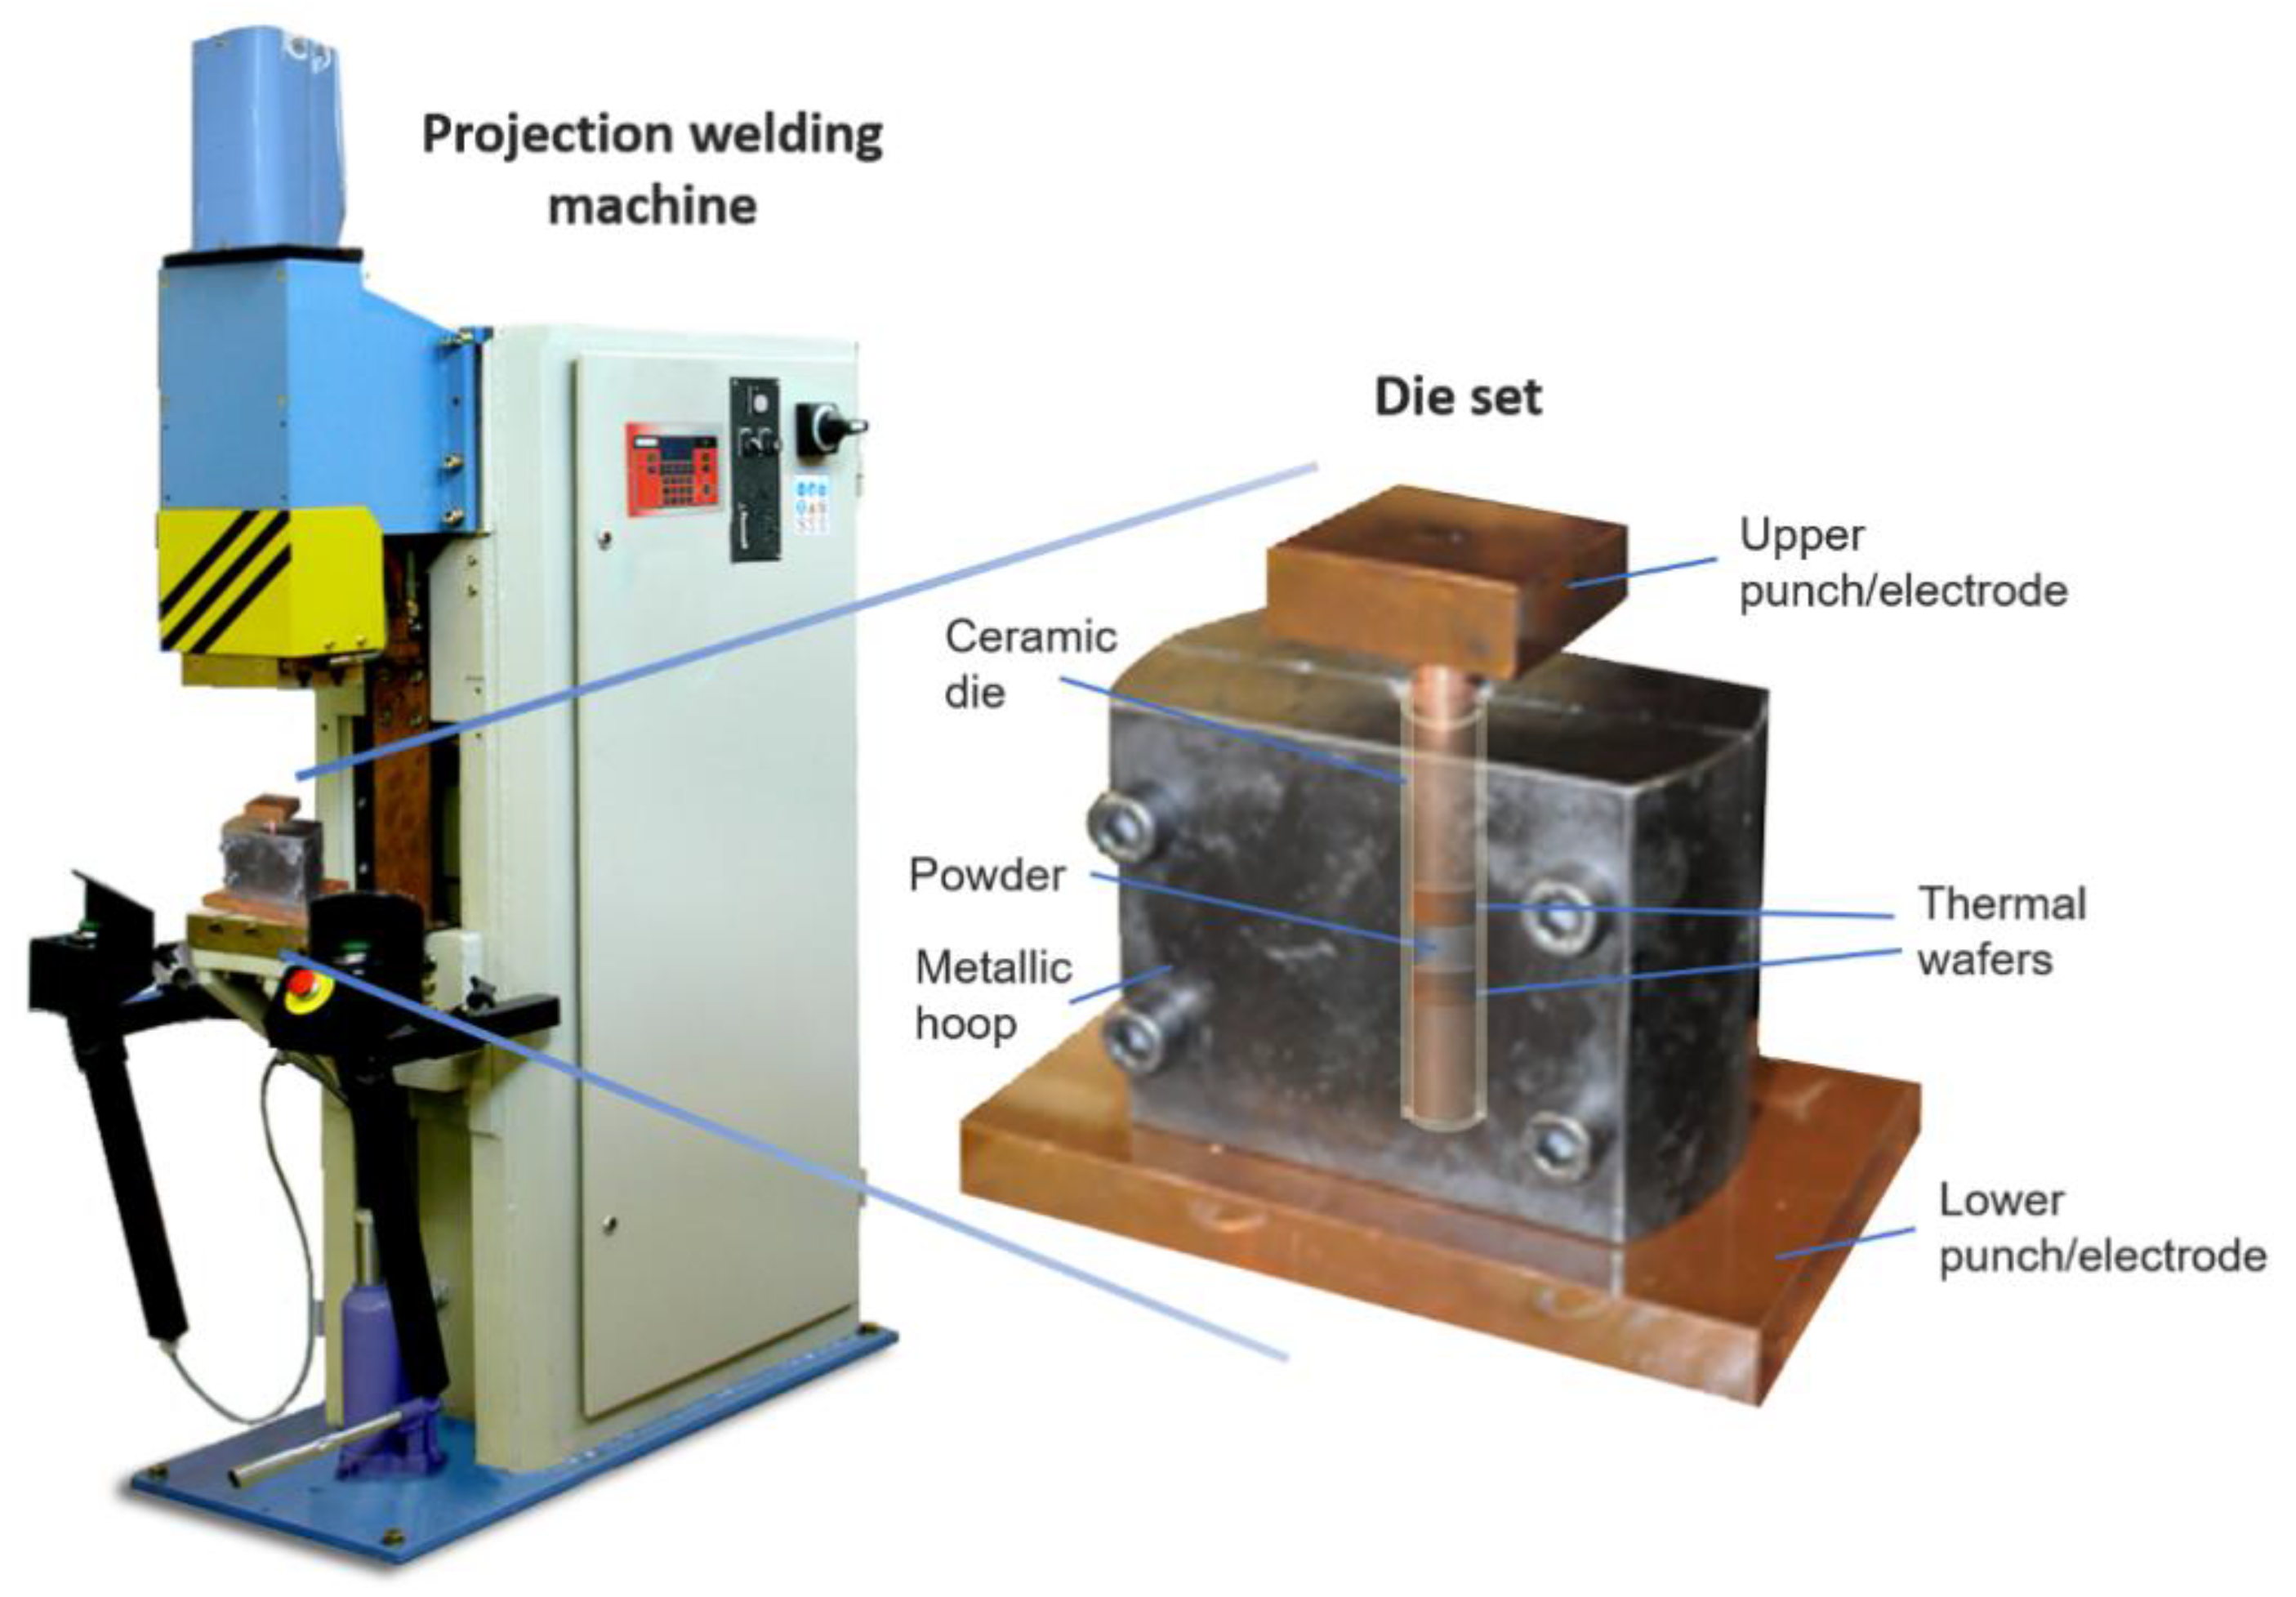
2.1. Medium-Frequency Electrical Resistance Sintering (MF-ERS) Equipment
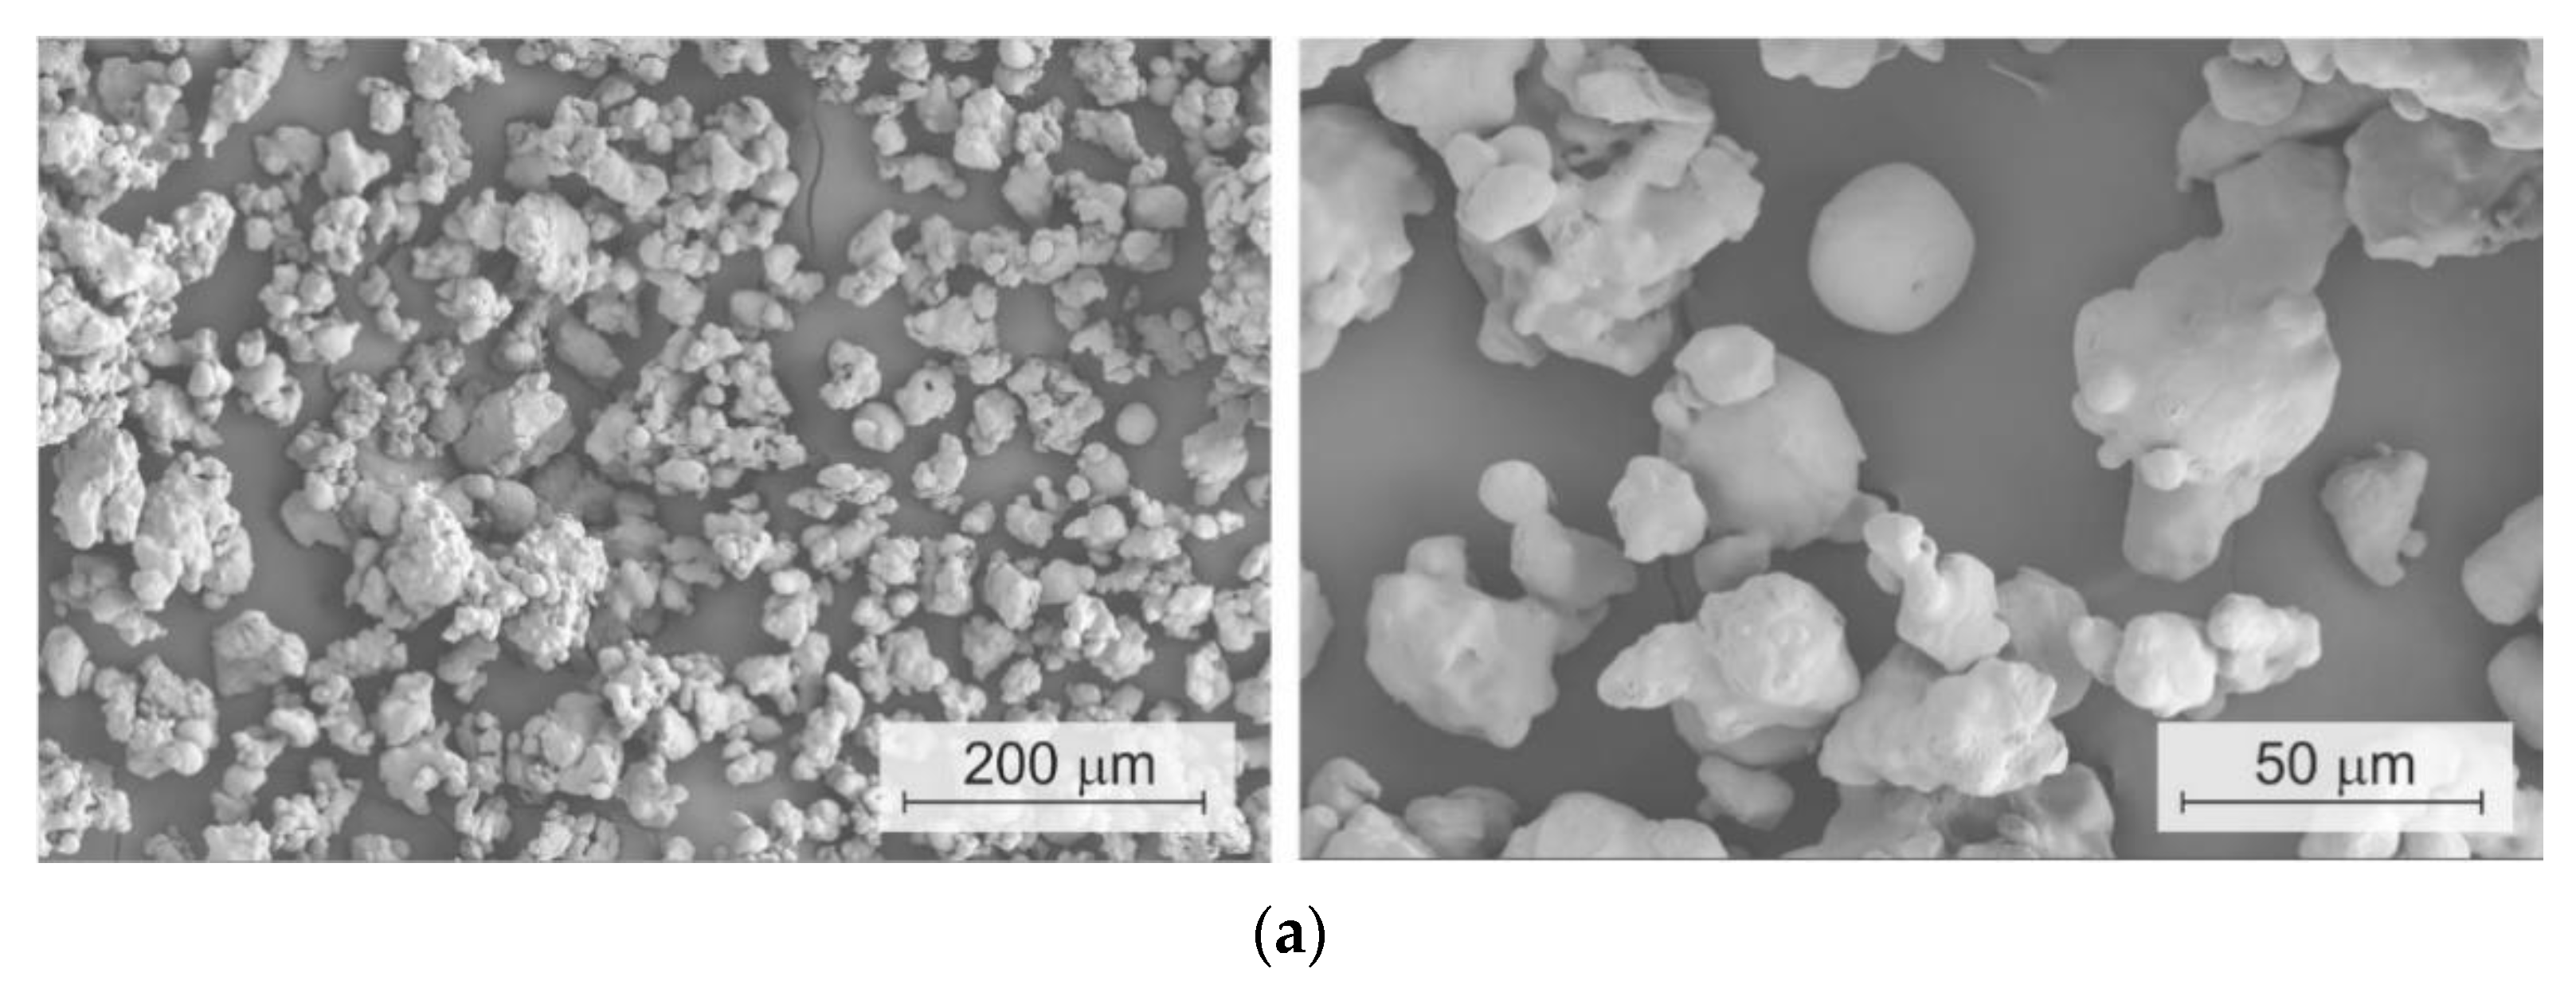
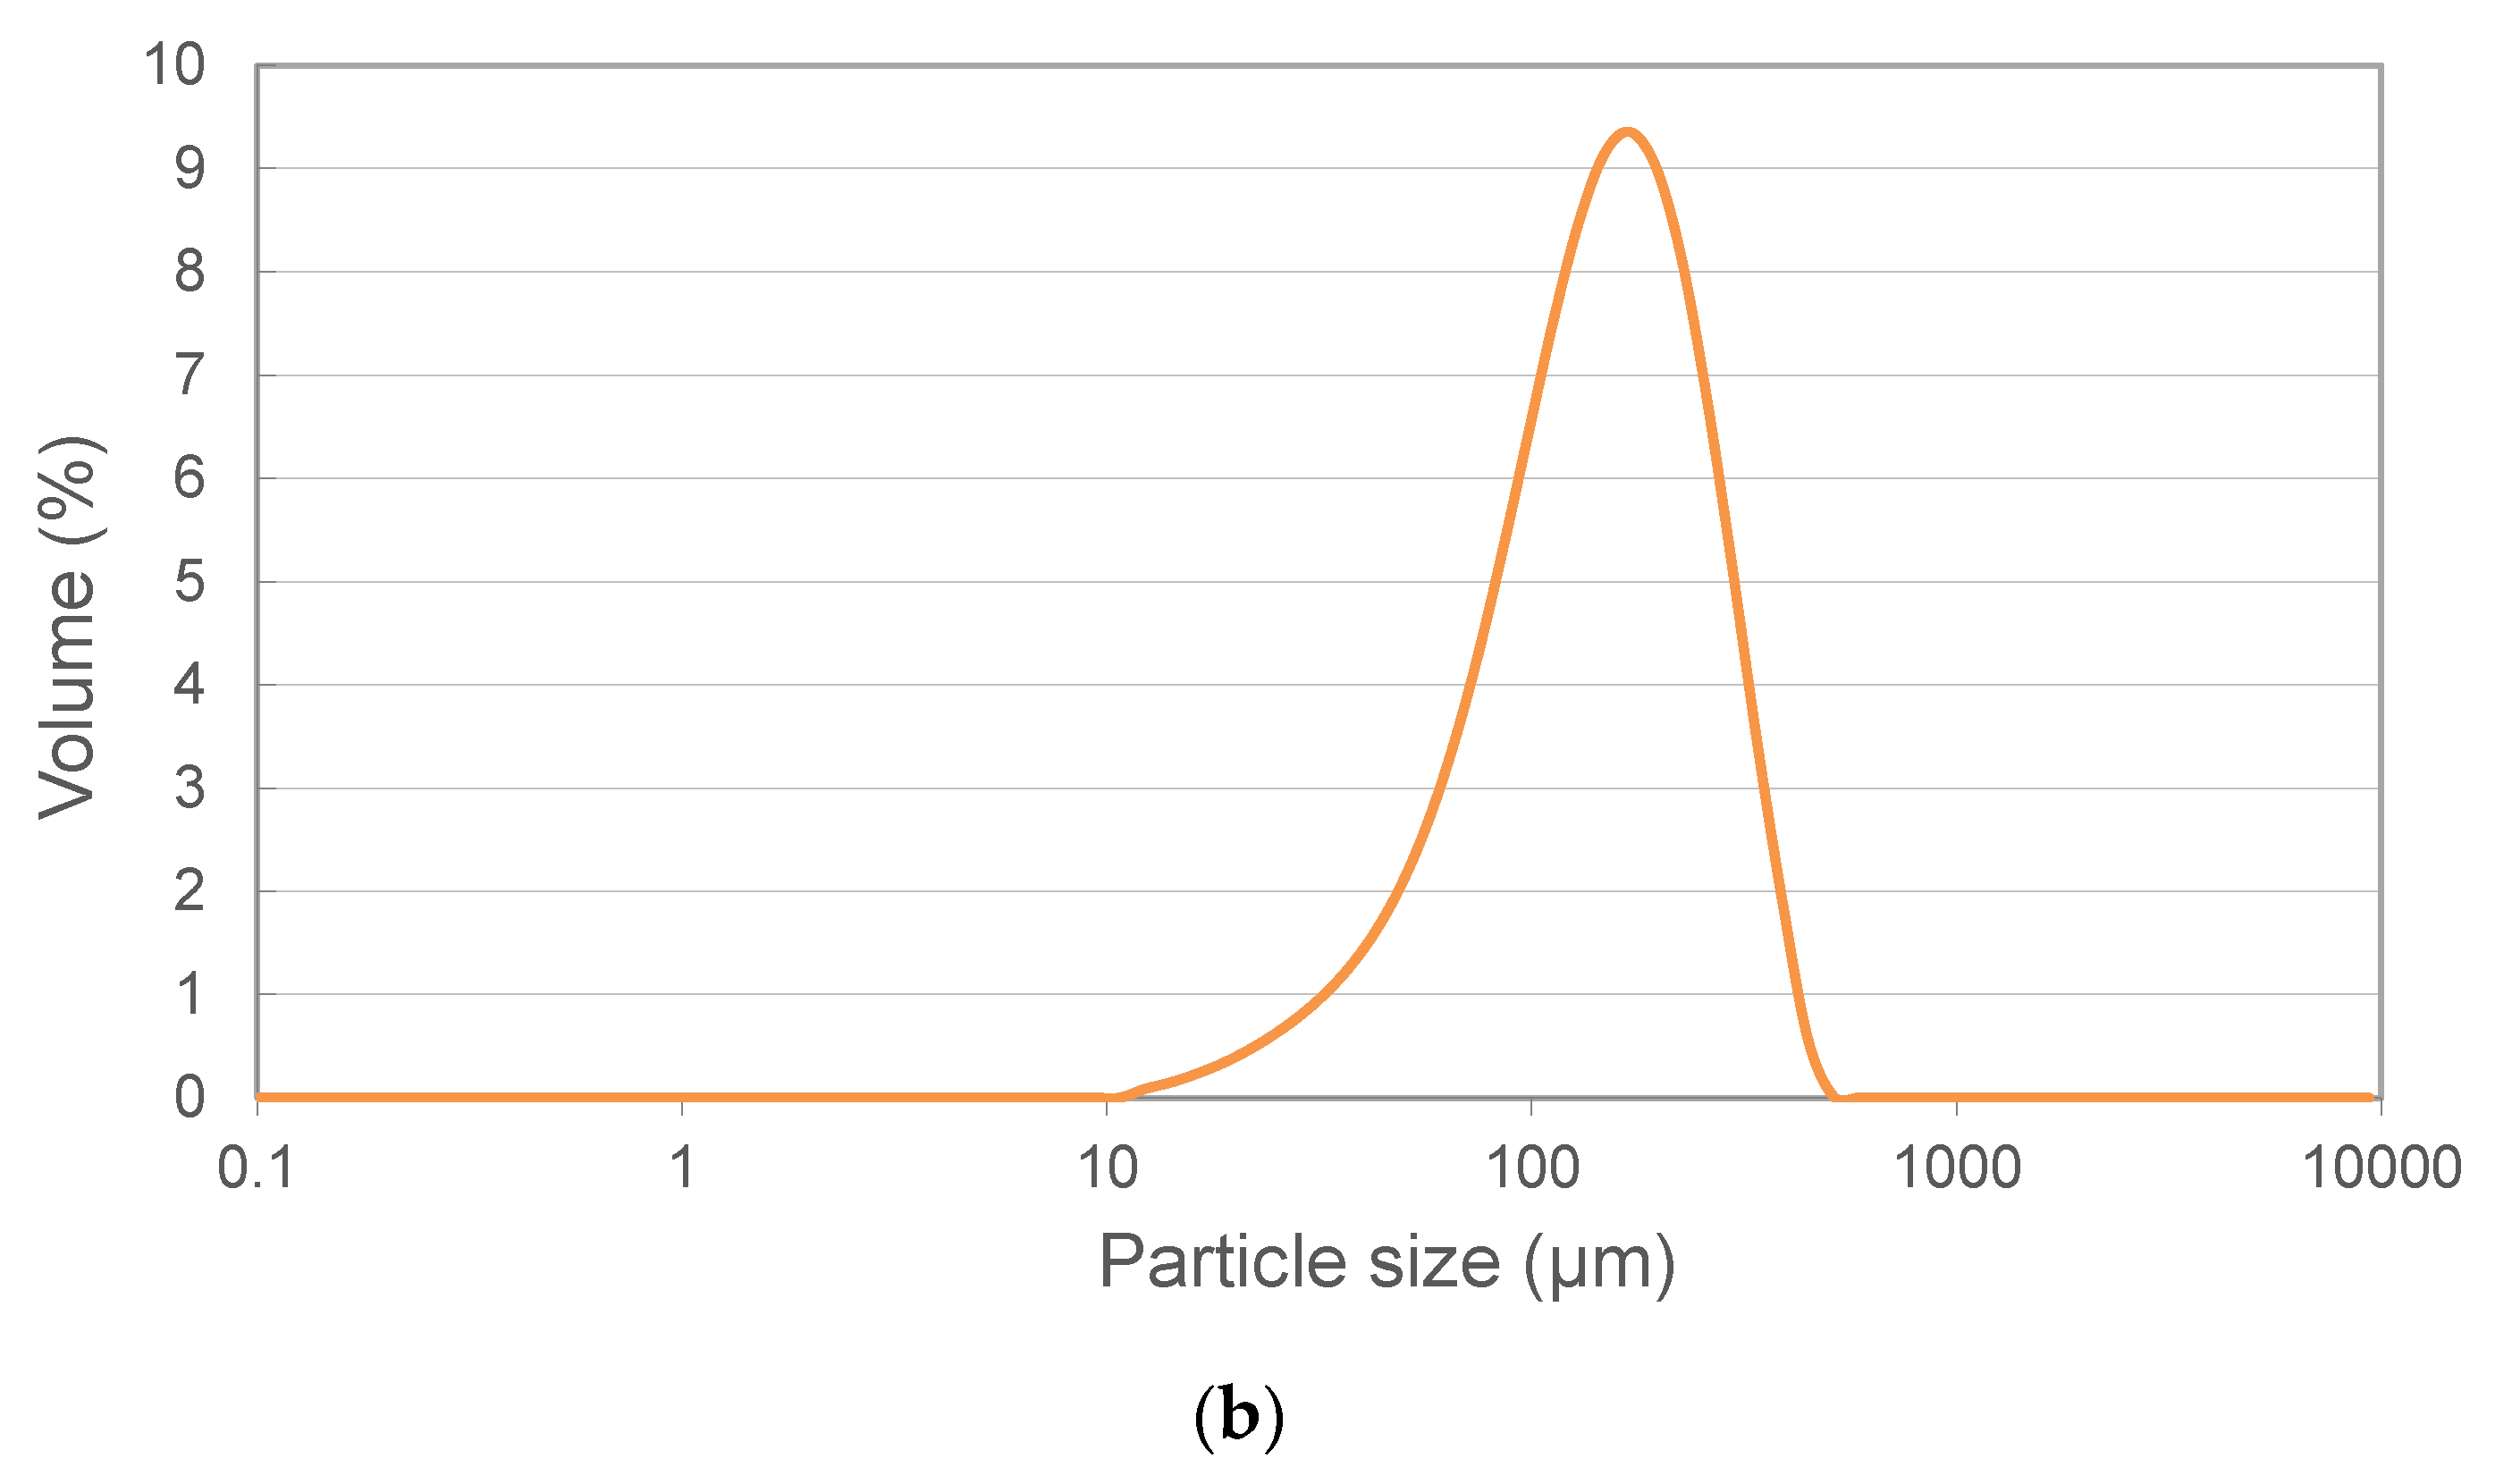
Projection-type resistance welding equipment (Beta-214, Serra Soldadura S.A., Barcelona, Spain) was adapted to carry out the MF-ERS experiments. The 1000 Hz and 100 kVA three-phase transformer serves to produce an electronically controlled and rectified current intensity, and the servodriven upper head to produce a maximum force of 15 kN. Values of current intensity, voltage between the bedplates of the equipment, and upper head position were monitored during the equipment work. The rectified current waveform gives special characteristics to this technique, otherwise magnetic field effects would be significant, as described in [15].
The sintering process also needs tools to contain and press the powder. Following the idea already described by Lenel [9], a 12 mm inner diameter alumina ceramic die was used to contain the powder, although it had to be strengthened by a steel hoop. The pressure was applied through electroerosion resistant and nonsticking heavy metal wafers 75.3% W–24.6% Cu in direct contact with the powder to be sintered, followed by temperature-resistant electrodes 98.9% Cu-1% Cr-0.1% Zr (Figure 1). These wafers also have a low thermal conductivity, thus damping the heat transfer to the electrodes and the water-refrigerated bedplates.
One of the main disadvantages of the MF-ERS technique is that it is not possible (or at least it is not easy) to measure the temperature evolution inside the compact, resulting in it being even more difficult to know the temperature distribution. The only possible way is the simulation of the process, as described in [16].

2.2. Material

A commercially pure iron, Fe WPL200 (QMP, Monchengladbach, Germany), was chosen as the starting powder. The main impurities are 0.01 wt% C, 0.2 wt% Mn and 0.1 wt% O. An apparent density [17] of 2.65 g/cm3 (a 34% of the absolute density) and a mean particle size of 78 μm (Figure 2) were measured, the latter by the laser diffraction technique (Mastersizer 2000, Malvern Panalytical Ltd., Malvern, UK).

2.3. Experimental Procedure

Before each sintering process, powder was vibrated inside the die up to reach its tap density [18], of 2.9 g/cm3 (which represents, taking into account the experimental uncertainties, a tap porosity of 0.63 ± 0.05). MF-ERS experiments start with a cold-pressing period of 1000 ms. In this period, a selected constant pressure was applied to the powder mass, but no current was passing through. The sequence followed with a heating period, with the only difference of current intensity being applied. The applied intensity and duration of this period could be varied in each experiment. The last period consisted in a cooling period of 300 ms, when again only pressure was applied. The duration of the initial and final periods were selected according to previous experiences [19] to ensure a proper processing.
The applied pressure was always 100 MPa, which guaranties current passing and an adequate duration of the die, at the time that a correct sintering [19]. The use of higher pressures can lead to a high densification level during the cold-pressing period, resulting a low resistive powder mass and low Joule thermal power, therefore producing a poor densification. In this situation, a higher intensity was required, and the process resulted in being more difficult to control.
In order to apply the selected pressure to the powder mass avoiding wear and load loss, a graphite-acetone suspension was deposited on the inner die wall and wafers base as a very thin layer, acting both with lubricant and unsticking effect.
Experiments were carried out with current intensities of 6, 8 and 10 kA, and heating times of 400, 700 and 1000 ms. The combination of lower intensities and heating times did not adequately consolidate the powder mass, whereas higher values welded the compact and wafers. These current intensities, normalised with the cross-sectional area of the compacts, represented current densities between 5.3 and 8.8 kA/cm2. The 3.5 g of powder used in the experiments made the compact to reach a height/diameter aspect ratio near 1/2. Four different compacts were prepared and characterised for each combination of current intensity and heating time, being the mean value and standard deviation computed for each property. Some properties measurement required cutting the compacts, and two series of four compacts were necessary. As usually happening in PM, deviations are clearly higher than the experimental uncertainty caused by the measurements precision. The final porosity (in fraction) of the whole compacts after consolidation was calculated from the final dimensions and weight of the specimen.
Three 3.5 g–12 mm diameter compacts were conventionally consolidated, i.e., cold compacted at 500 MPa (die wall lubrication) and vacuum furnace sintered at 1175 °C for 30 min. The final porosity of these compacts was about 0.15 ± 0.01, an adequate value to be compared with the MF-ERS compacts (porosities under 0.08–0.09 can be reached with conventional processing by using reducing atmospheres with specially designed Fe powder [20,21]). As happening with the electrically consolidated compacts, two series were prepared to measure different properties because of the need of cutting the specimens. Again, the porosity level of the compacts after consolidation was calculated from the determination of dimensions and weight.
Moreover, three 3.5 g–12 mm diameter fully dense samples, with a residual porosity of 0.02 ± 0.01, were produced by a double pressing at 1400 MPa (with intermediate annealing at 600 °C) and final sintering at 1175 °C during 3 h in hydrogen atmosphere. Despite these compacts having some residual porosity, we will refer to them as fully dense compacts. Two series of three compacts were prepared to measure the different properties.
All the electrically and furnace sintered consolidated compacts were analysed to determine the electrical resistivity on the compact base, the hysteresis curve, and the porosity and HV1 microhardness distribution (in this order, although results will be shown in a different sequence to facilitate the discussion).
A four points probe and a Kelvin bridge (CA 10, Chauvin Arnoux, Paris, France) were used for the electrical resistance measurements at room temperature (Figure 3), with a measuring range between 0.01 mΩ and 1000 Ω and values in the range 9.39–38.35 mΩ. The thermoelectric effects were eliminated by changing the probes polarity in two different measurements, and the mean value was considered for each specimen.
For the probe electrodes spacing (d = 2 mm), the electrical resistivity can be calculated as [22]:
ρ = 2 π d R m e a s u r e d
The relative error in the resistivity calculations, according to the uncertainty in the measurement of the resistance values, is always lower than 7%. The hysteresis curves were determined with a permeameter (AMH-1K-S, Laboratorio Elettrofisico, Milan, Italy) according to the standard [23]. This method requires of a hollow cylindrical specimen to roll up the primary and secondary windings. Therefore, an orifice 8 mm in diameter was drilled in the specimens of one of the aforementioned series. Moreover, precise measurements required of specimens with a thickness of about 1 mm. Two of these slices were cut by electroerosion after embedding the specimens with acetone-soluble cold-curing resin to avoid cracking. Resin was subsequently dissolved. The slices were obtained at about one quarter and one half of the total height. Finally, 22 spires of the primary and other 22 of the secondary circuits were wound in each specimen.
The porosity distribution was qualitatively studied on diametrical sections of the compacts. Optical macrographs (EPIPHOT 200, Nikon, Tokyo, Japan) were sufficient for this analysis, with dark areas being caused by the presence of pores. The non-homogeneous porosity distribution in MF-ERS compacts is a consequence of the temperature achieved in different compact zones.
Vickers microhardness (DURAMIN-A300, Struers GmbH, Willich, Germany) of consolidated compacts was measured in a cross-sectional quadrant at five different points, as shown in Figure 4 (different measurements were needed because of the non-uniform porosity distribution). Other quadrants were supposed to behave in a similar way due to the symmetry of the compact. The applied load was 1 kg, according to the standard [24].

3. Results and Discussion

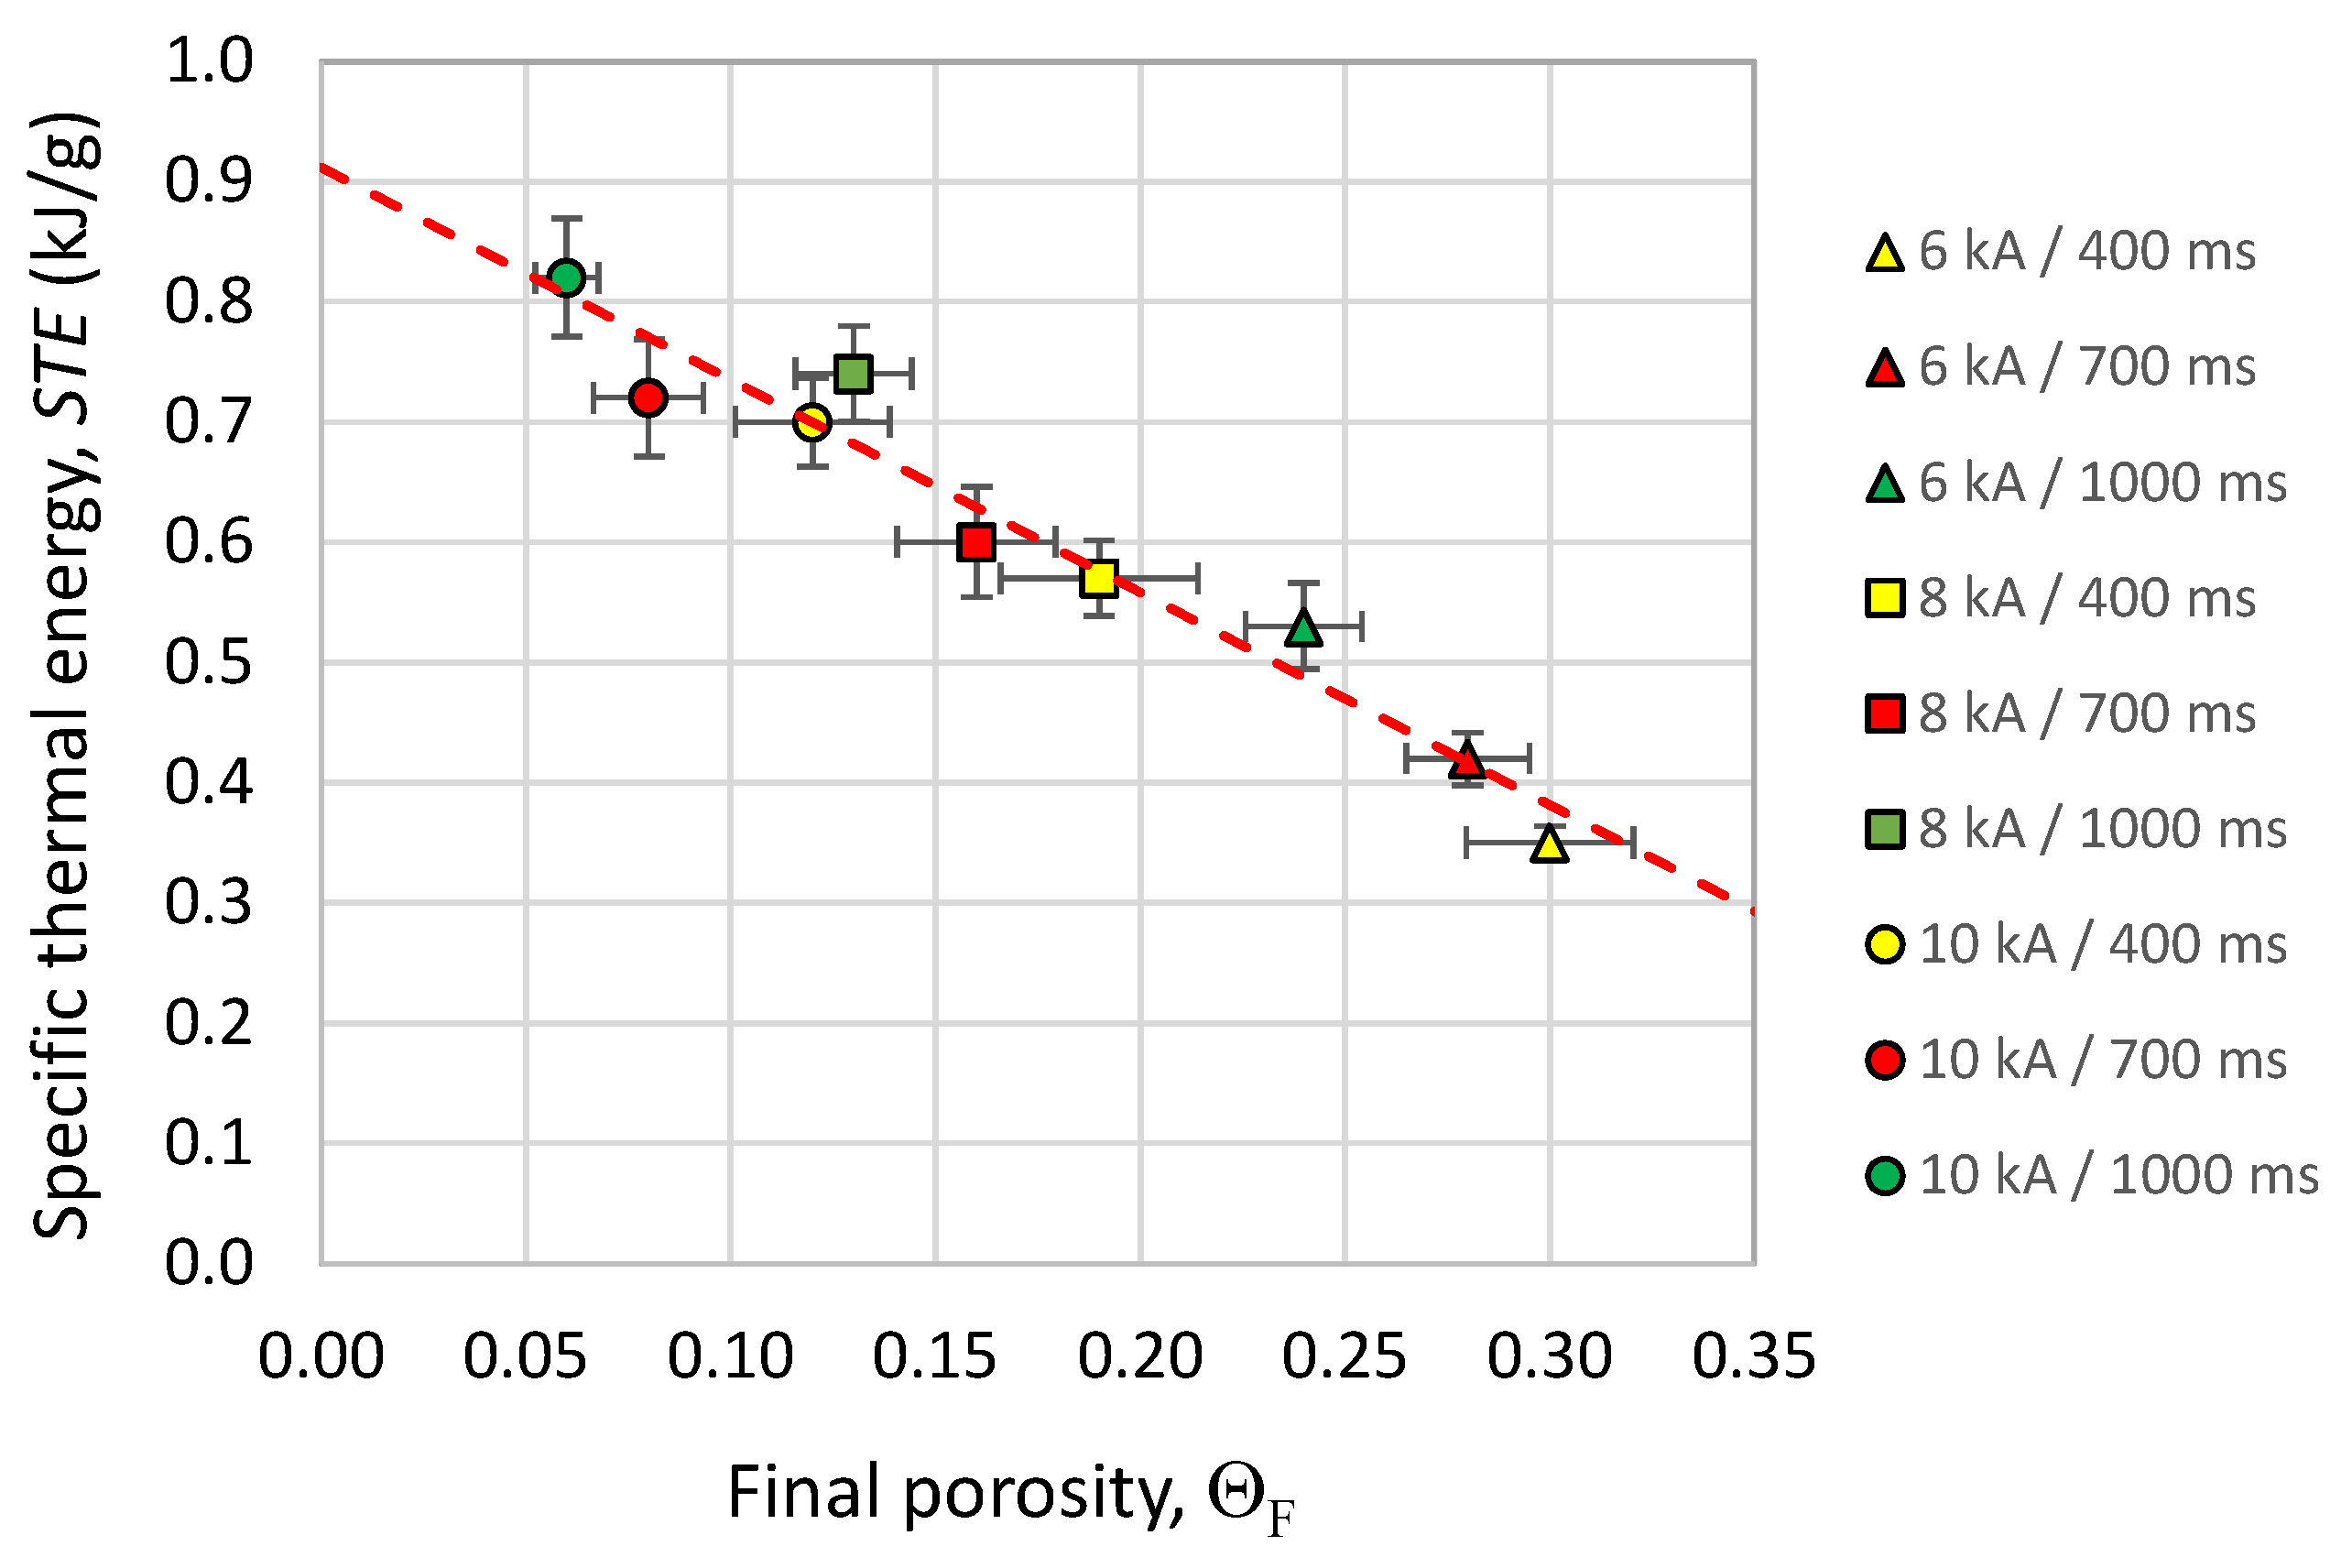
3.1. Final Porosity and Specific Thermal Energy

The final porosity ΘF of the MF-ERS compacts is shown in Table 1 as a function of the current intensity (I) and the heating time (tH) applied during the heating period.
Resulting final porosities seemed to be reasonable, higher for lower values of the considered parameters, and decreasing by increasing any of the parameters. However, the process evolution can be better characterised by the Joule thermal energy released per powder unit mass, which will be called the specific thermal energy (STE). In order to obtain these values, the dissipated electrical power needs to be time integrated during the process; thus,
S T E = 1 M 0 t H V ( τ ) I ( τ ) d τ S T E = 1 M 0 t H V ( τ ) I ( τ ) d τ
where M is the powder mass, I the current intensity that flows through the powder mass, V is the voltage drop in the powder column, and tH is the time of passage of the electric current (heating time). STE values are shown in Table 2, following the expected behaviour, with higher values for higher intensities and heating times.
The final porosity (ΘF) vs. STE curve is shown in Figure 5. As expected, higher porosities are obtained for lower STE values.
A slight scatter can be found in the represented data, revealing that probably not only the STE affects the final porosity obtained. For instance, the powdered character of the studied material could account for a relatively erratic die filling process and subsequent cold pressing. Nevertheless, the also erratic character of the first moments of current passing, with few available electrical paths, must be even more determining. This is because of the presence of oxide layers covering metallic powder particles. These dielectric layers avoid the metal–metal continuity and limit the number of electric current paths. Higher porosities are found for 6 kA, as a result of the less efficient ERS process. The approximately linear trend of the STE vs. ΘF shows that, independent of the porosity level, for a certain porosity reduction to be attained, similar STE increments are needed.
The simulation of the process for this powder and similar intensities and current passing times show that the mean temperature in the compact reach values of up to 600–700 K [16]. Nevertheless, the temperature reached in the compact core can reach much higher values.

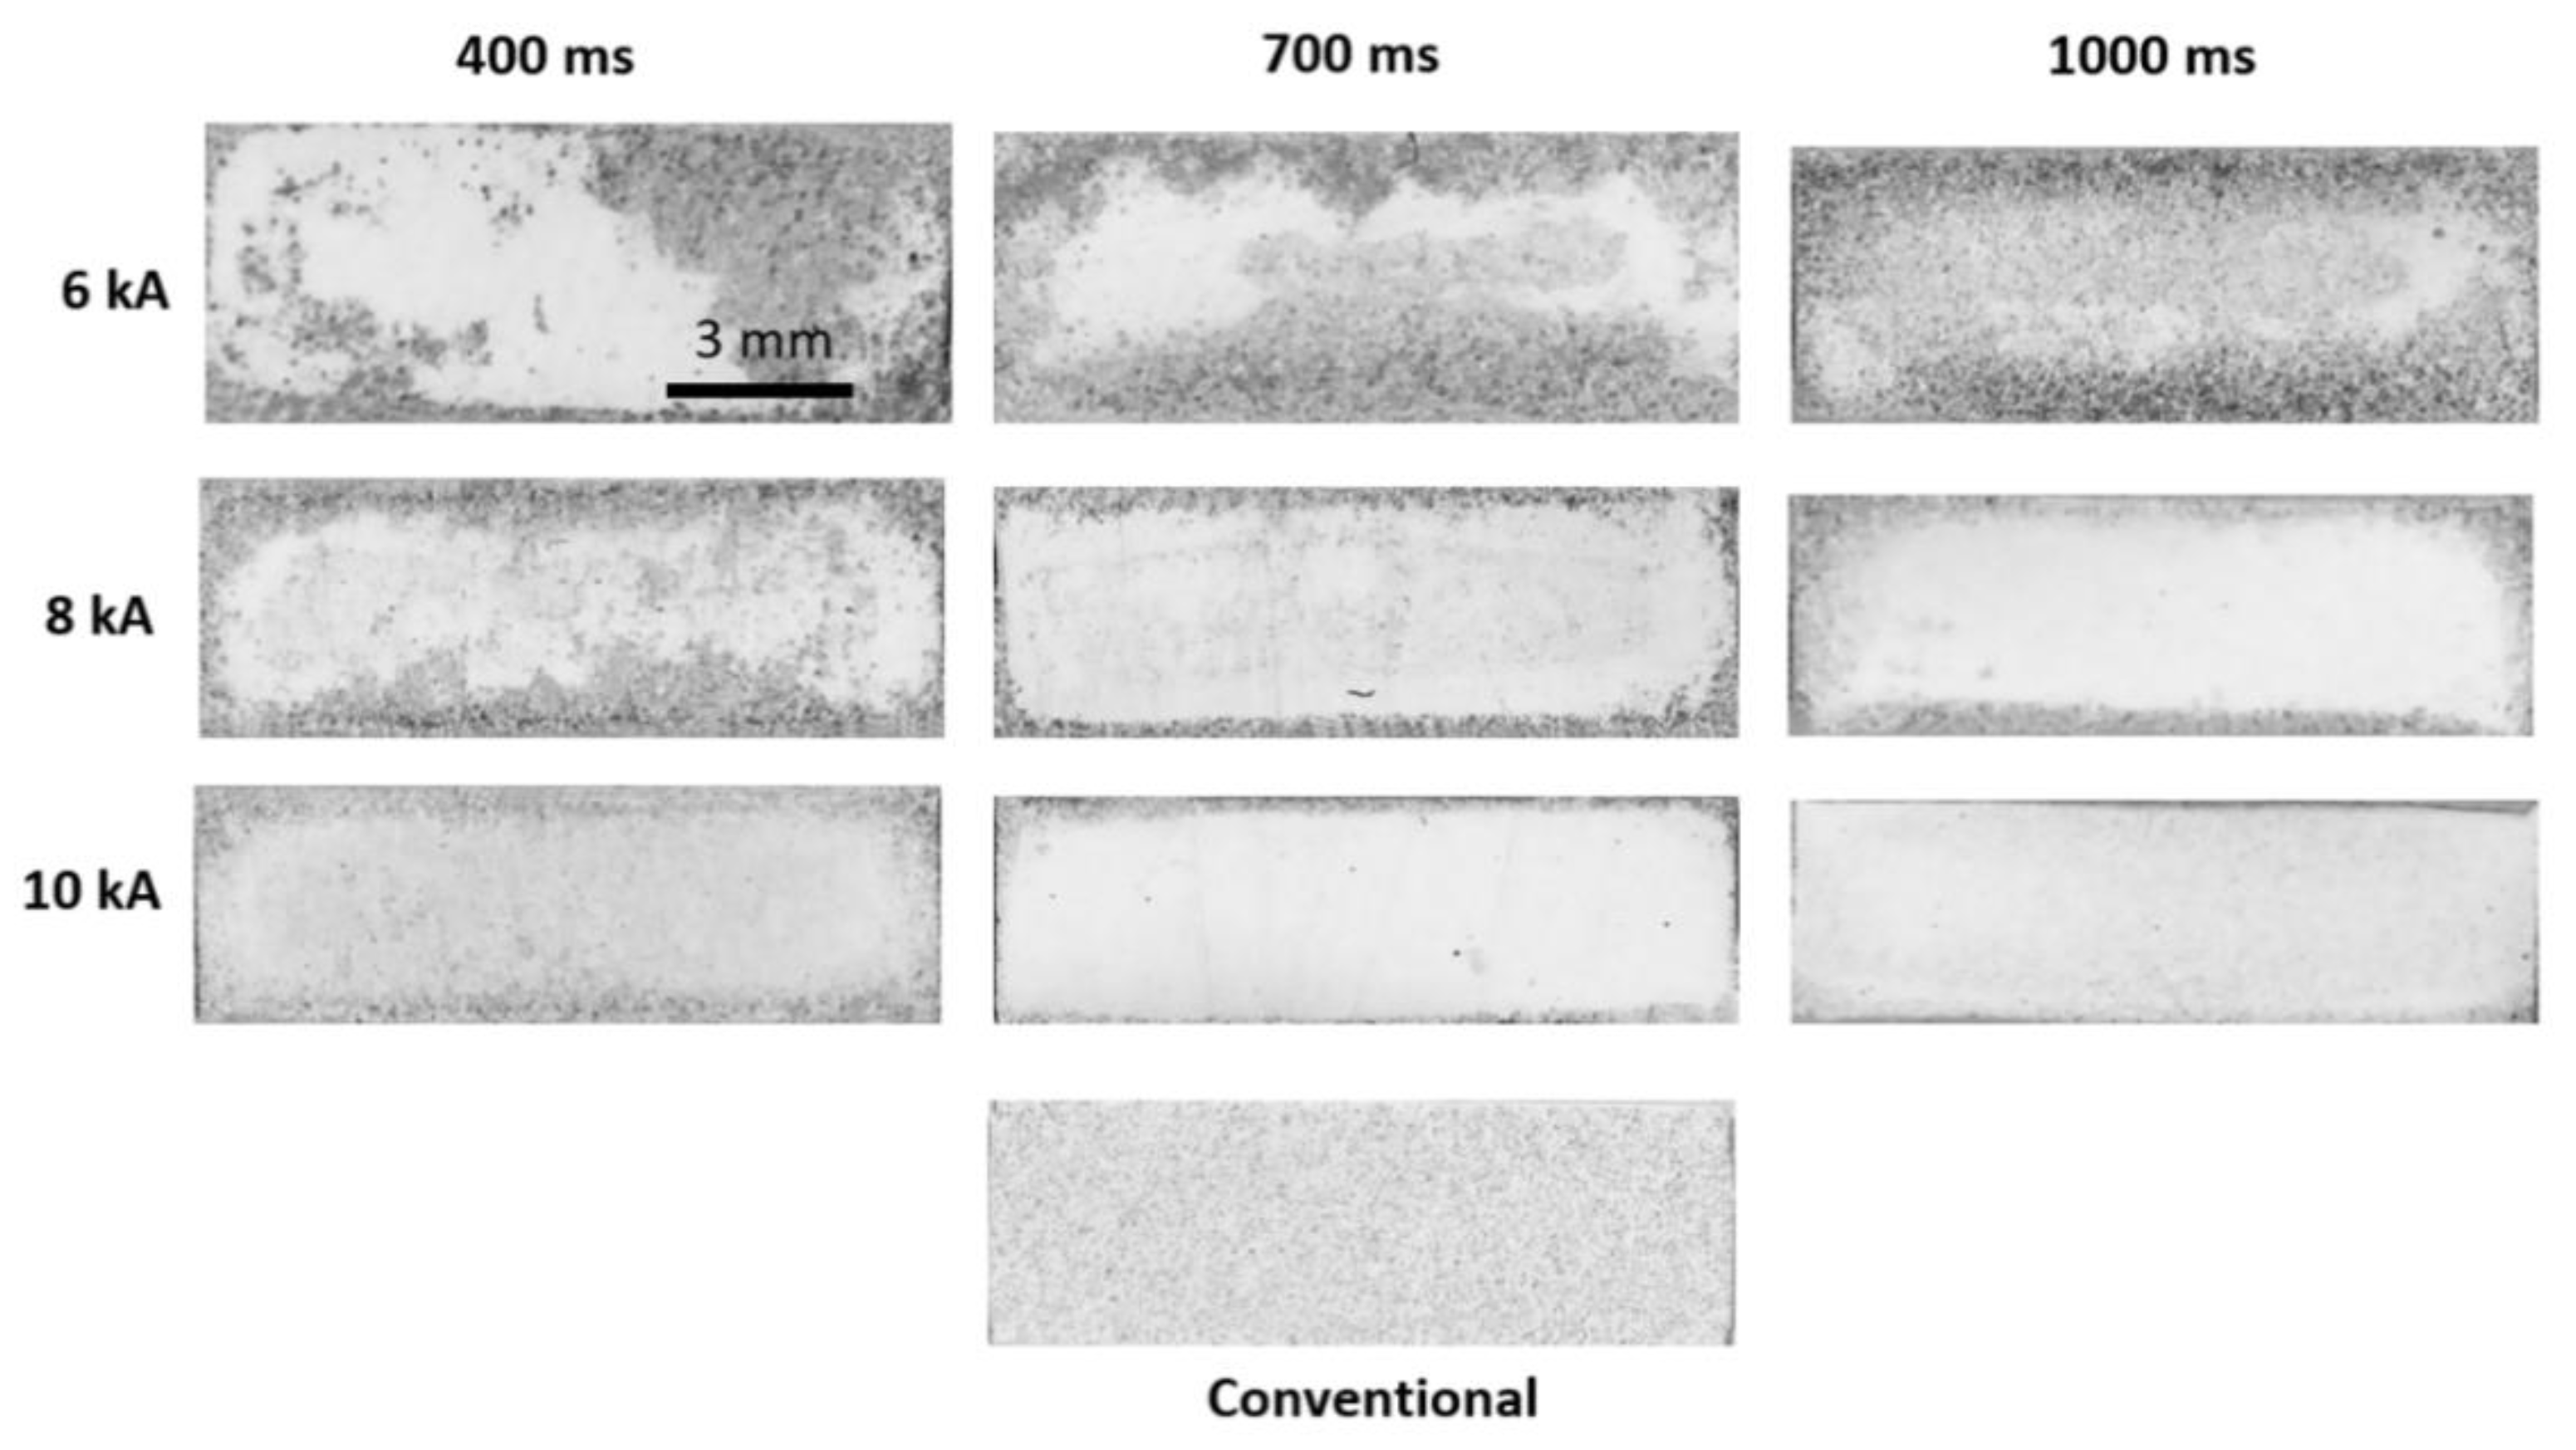
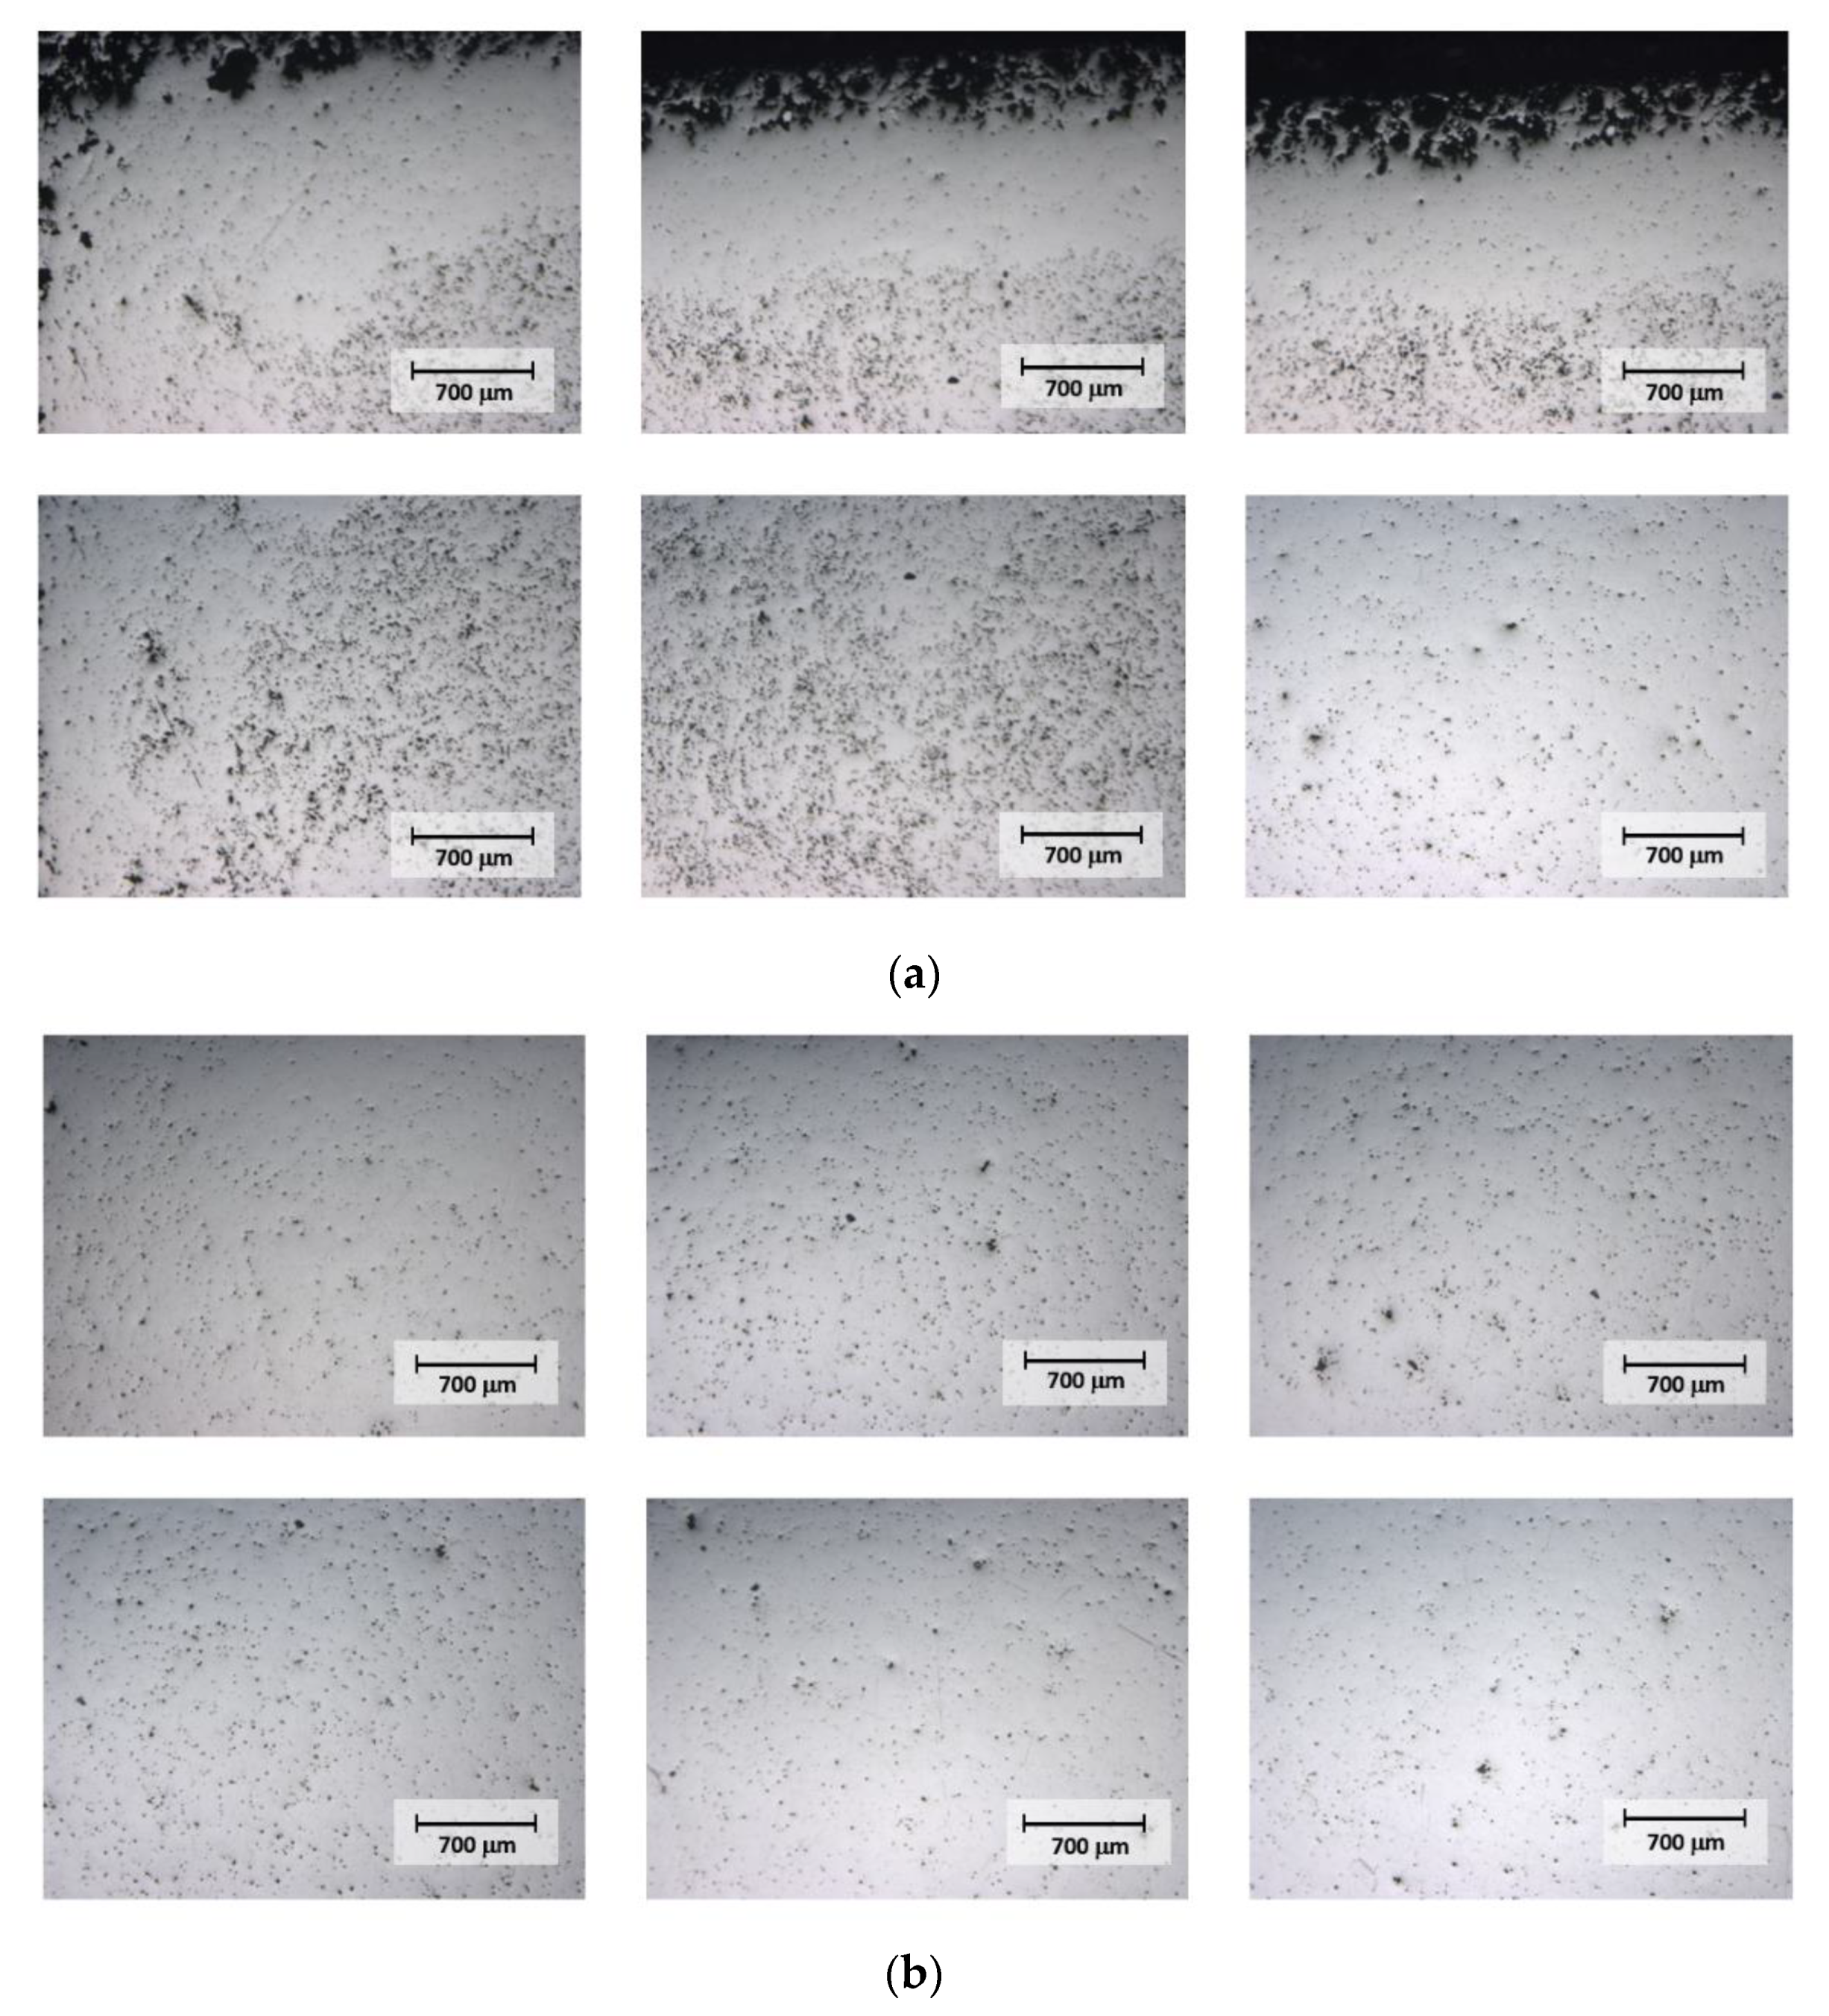
3.2. Porosity Distribution
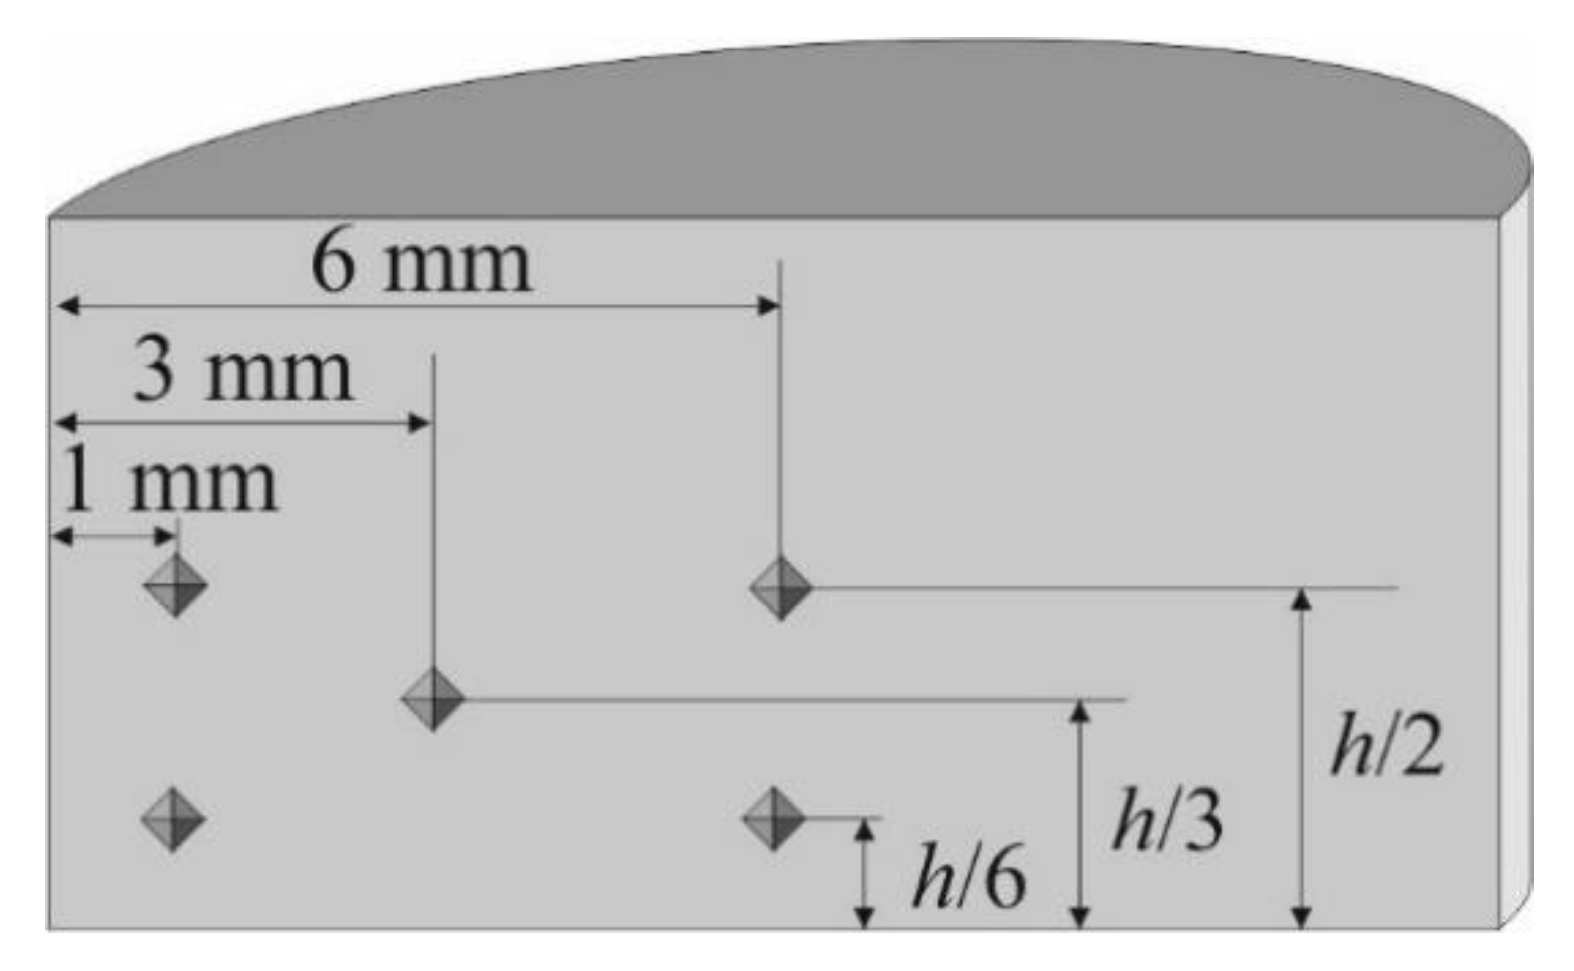
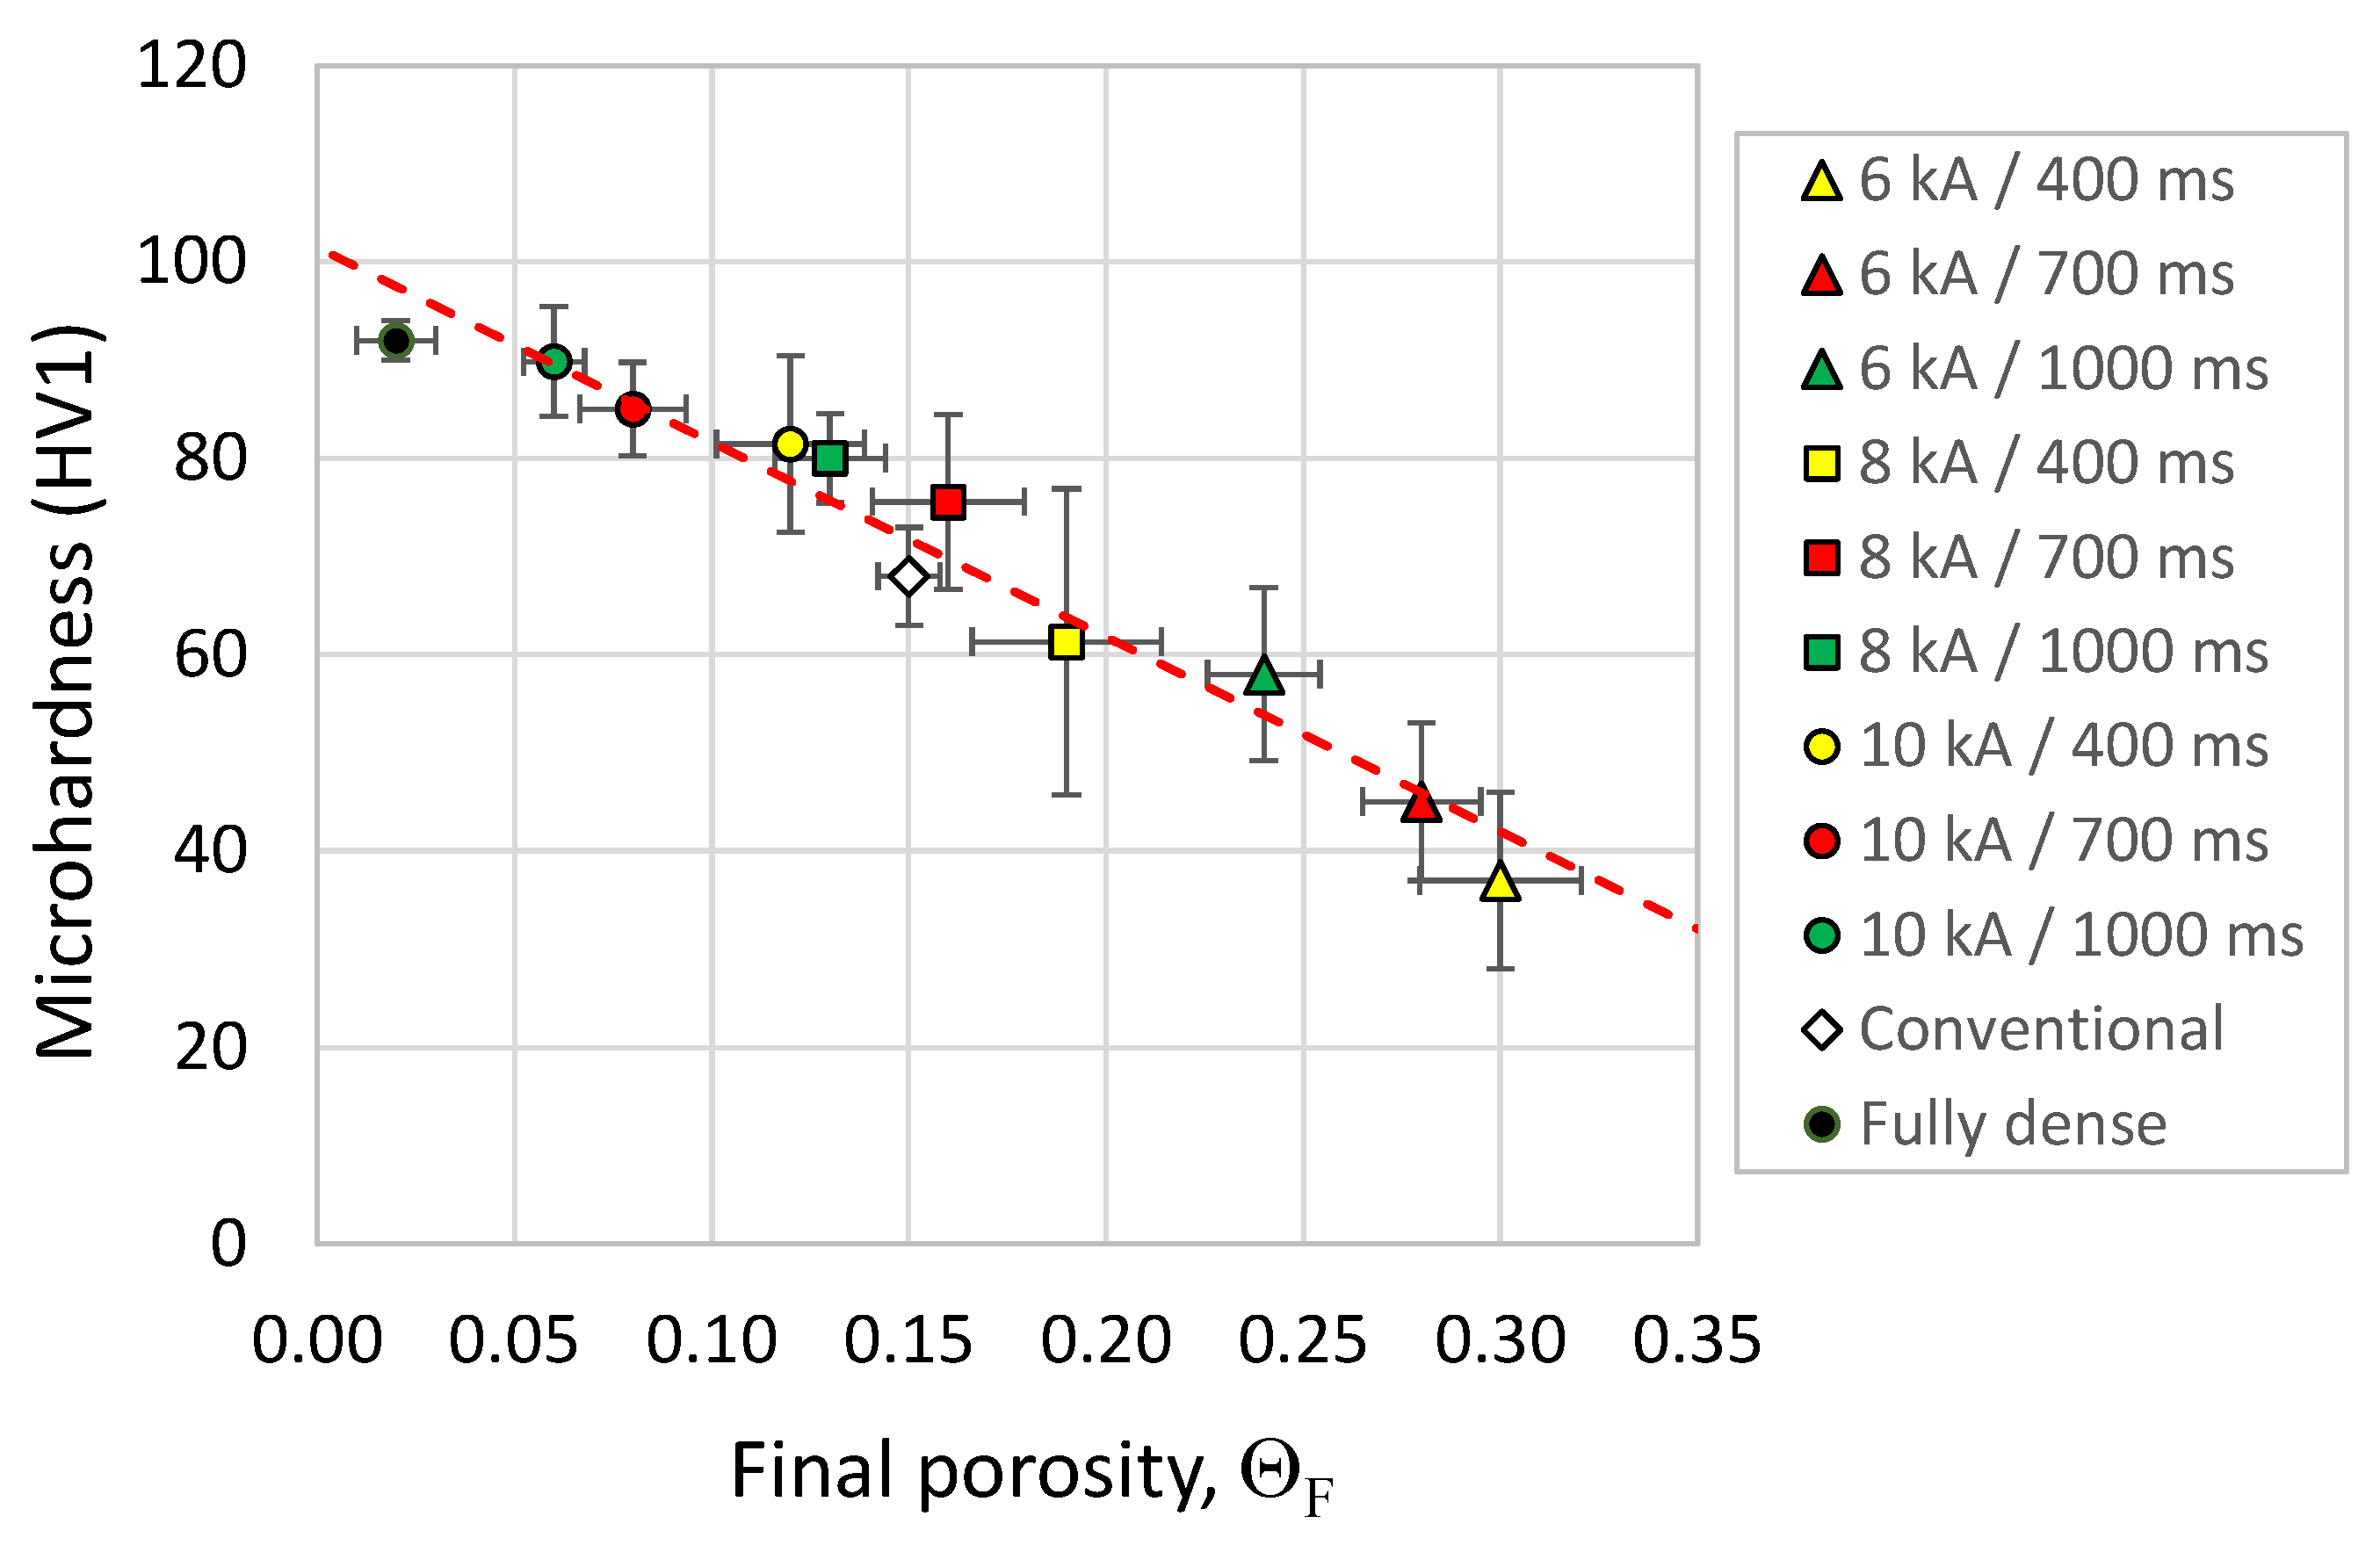
The aforementioned peculiarities of the ERS process result in very different micro and macrostructural features with respect to compacts obtained by the conventional route. A diametrical section of a conventionally sintered compact, with a relatively uniform porosity of about a 15% is shown in Figure 6. The high porosity value reveals that the native oxide layer covering the powder particles impeded the diffusive processes necessary for particle sintering. This is an old PM problem usually solved by using reducing atmospheres that help removing these oxide layers. The different nature of the electrical process allows reaching higher densifications without the need to reduce atmospheres. Macrographs of diametrical sections of the different MF-ERS compacts are also shown in Figure 6. A heterogeneous porosity distribution is revealed, consequence of the heterogeneous temperature distribution, higher in the compact centre. As expected, both the wafers and electrodes (in contact with refrigerated bedplates) and the die walls act as heat sinks, and the lower the temperature reached the higher the porosity.
For the MF-ERS compacts, a relatively uniform porosity distribution, good enough for practical uses, only seems to be attained for specimens consolidated with 10 kA. Also, some 8 kA compacts could be adequate for practical use after mechanically retiring the external and more porous layer. With the best processing conditions, the residual porosity is reduced to 0.06, a higher value than that obtained after processing by double cold pressing and the sintering cycle under reducing atmosphere (0.02). Nevertheless, this higher porosity, usually a disadvantage regarding mechanical properties, could suppose an advantage for the electrotechnical properties, as shown later.
Details are shown in Figure 7, with optical micrographs from six different zones covering a quadrant of the diametrical section of the compact processed with 8 kA-700 ms and 10 kA-1000 ms. The first sample was selected to show the porosity gradients aforementioned, as well as pores becoming more spherical in the compact core, where the temperature reached is higher. The second sample was selected to show the improvement in the densification with more energetic conditions.

3.3. Microhardness

Microhardness of conventionally processed specimens resulted in a value of (68 ± 5) HV1, being (92 ± 2) HV1 that of fully dense specimens. For the different conditions of MF-ERS, the microhardness values resulting from the five measurements of each one of the four specimens are shown in Table 3.
Regarding the difference between conventional and electrical consolidation, a slightly lower hardness was attained in the conventional specimen compared to MF-ERS compacts with similar porosity, i.e., 8 kA–700 ms. This could be due to the inefficiency of the conventional process to achieve a correct sintering in a non-reducing atmosphere when using iron powder. The electrical sintering process, however, achieves a better joining between particles, as shown by the higher microhardness values.
It is clearly observed for the MF-ERS compacts that the mean microhardness increases with the current intensity and heating time. This trend is graphically shown in Figure 8, where a direct relationship between the mean microhardness and the final porosity of the compacts can be observed.
Analysing results from Figure 8, it can be observed that compacts processed with 6 kA, in which higher porosities were obtained, now reveal in general lower microhardness. The well-known dependence in PM parts between porosity and hardness is clearly revealed, with a linear relationship to describe the lower hardness attained for higher porosities. The microhardness of the furnace sintered materials is slightly lower to that expected according to the trend of the electrically consolidated materials. This can be caused by the high cooling rate of the electrically consolidated compacts, leading to residual internal stresses and a consequent hardness increase.

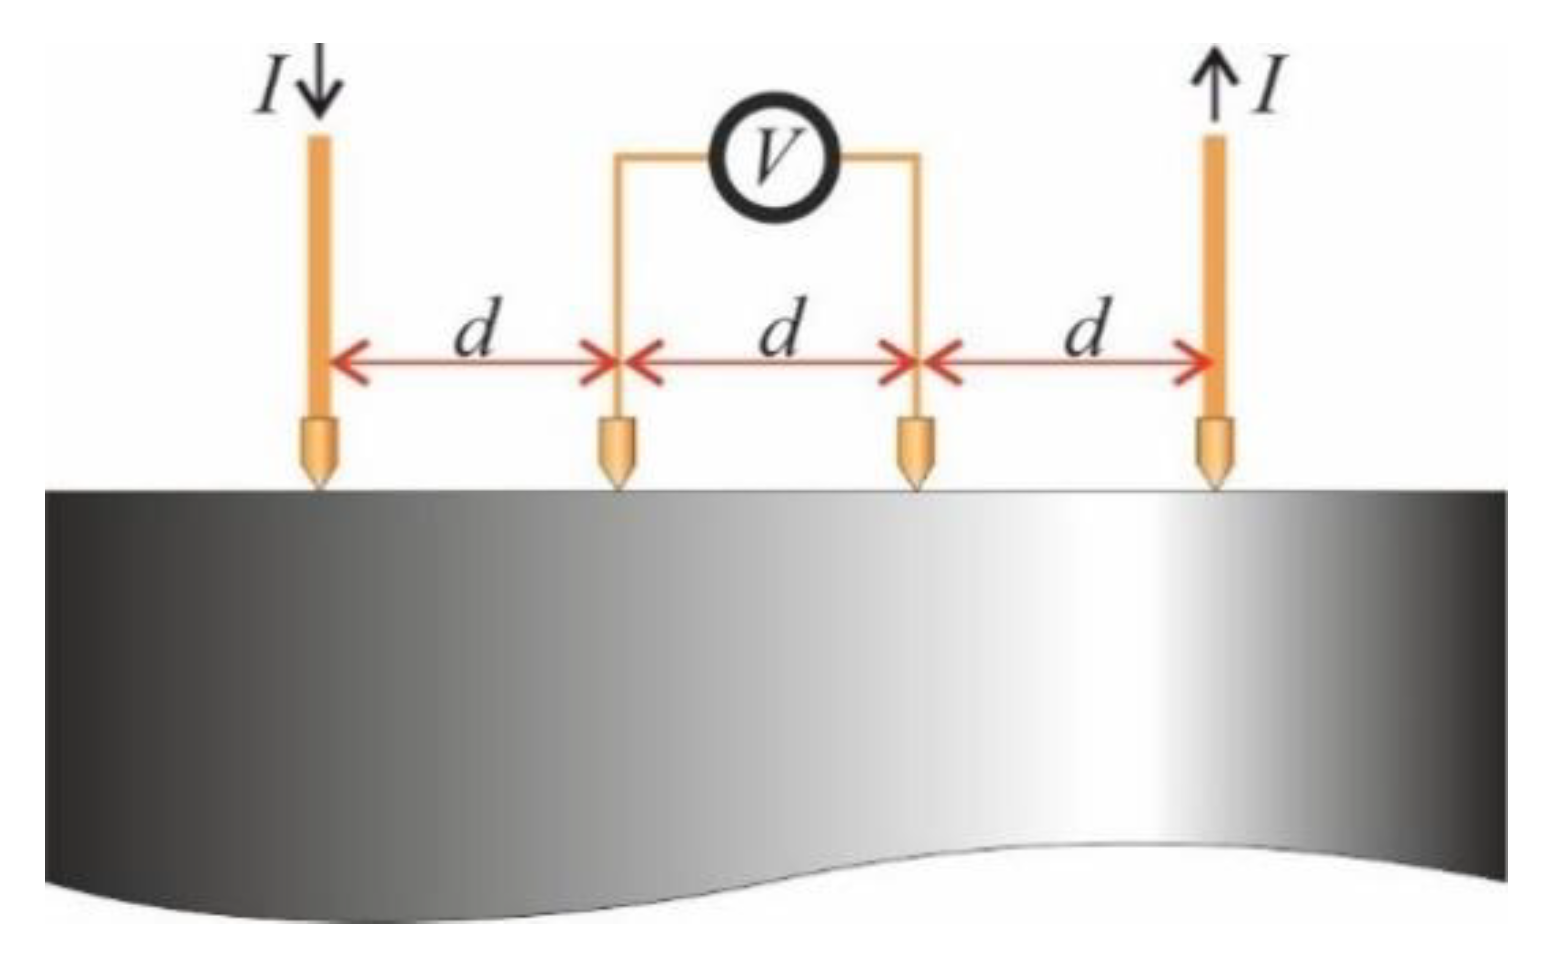
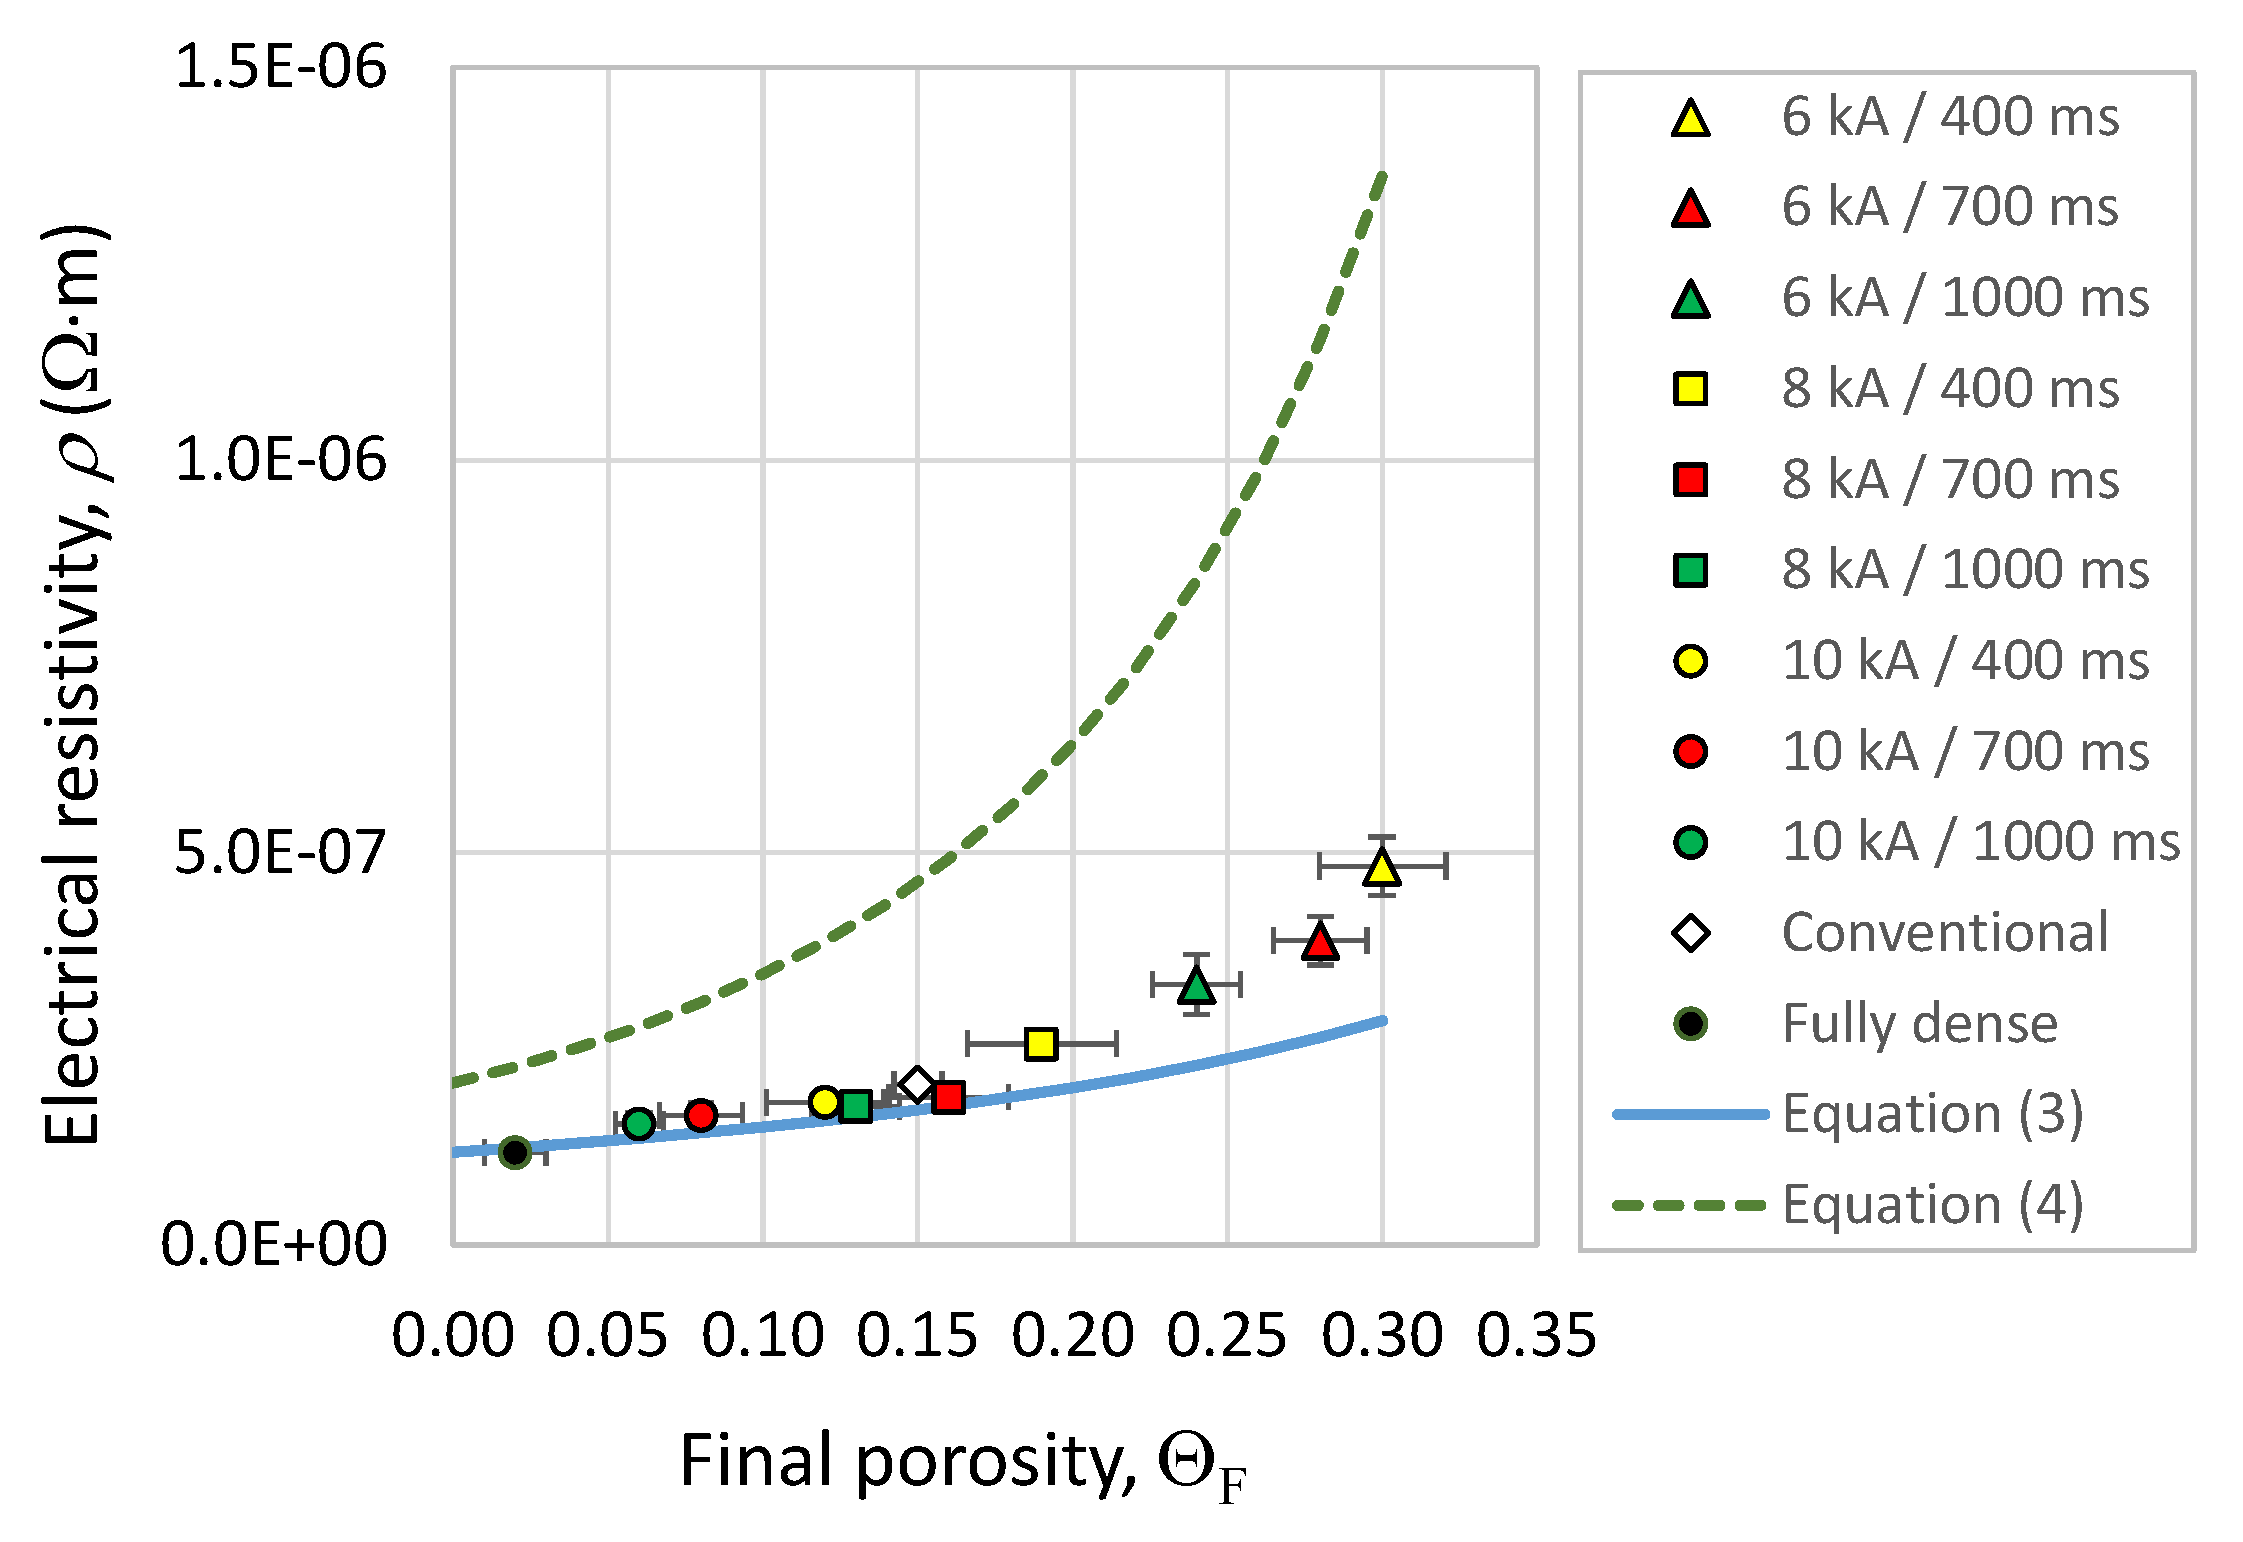
3.4. Electrical Resistivity

The measured resistivity of the fully dense specimen was (1.18 ± 0.02) × 10−7 Ω·m, whereas that of the conventionally consolidated compact was (2.04 ± 0.05) × 10−7 Ω·m. The difference can be mainly attributed to the presence of porosity in the later specimen. Also, particles contact resistance, consequence of a deficient sintering because of the oxide layers surrounding particles, must be considered when the non-reducing atmosphere was used.
Table 4 gathers the mean resistivity values of the MF-ERS compacts and their respective standard deviations. As expected, the resistivity decreases by increasing the current intensity and/or the heating time, because of the decrease in porosity and better joining between particles.
In a previous work, the electrical resistivity of sintered compacts and powder aggregates was studied [25]. It was then concluded that for porous sintered compacts (with metal–metal contacts between the powder particles) the electrical resistivity, ρ, could be described by the following law:
ρ = ρ M ( 1 Θ / Θ M ) 3 / 2
being ρM the electrical resistivity of the bulk material, Θ the porosity of the compact and ΘM the tap porosity [18] of the powder used to fabricate the compact.
A similar expression is required to describe the electrical resistivity of powder aggregates (not sintered) under pressure. It was concluded that such resistivity could be described by:
ρ = ρ r e s ( 1 Θ / Θ M ) n
where ρres is the residual resistivity (higher than or equal to ρM) remaining at Θ = 0, mainly as a consequence of the mechanical oxides descaling process not being completed. The exponent n is a fitting parameter, which describes the descaling rate; if there are no oxide layers, its value would be equal to 3/2, but with their presence it takes higher values.
Resistivity values from the different compacts, and the trend indicated by Equations (3) and (4), have been represented in Figure 9. The values ρM = 1.18 × 10⁻⁷ Ω·m, ρres = 2.263 × 10⁻⁷ Ω·m, ΘM = 0.673 and n = 3.2 were used for the equations. These values were obtained in [25] by the least squares fitting of Equations (3) and (4) to the experimental data obtained in sintered Fe compacts with different degrees of porosity and Fe powder under increasing pressure, respectively. The value of ΘM obtained in the fitting process, although inside the experimental uncertainty, is slightly different to the value experimentally measured (0.63 ± 0.05).
As can be observed, the first five experimental points in Figure 9 are very near the theoretical curve for sintered specimens given by the Equation (3). This means that the corresponding compacts are correctly sintered, i.e., those processed with 8 and 10 kA, except that with 8 kA and 400 ms. It can also be checked that the other four experimental points start deviating from the prediction given by the Equation (3), and follow the trend (although with lower values) of the curve given by the Equation (4), which describes the behaviour of pressed and not sintered powder. This means that, at least in the compact base, where the electrical resistance measurements were carried out, rests of oxide must be present in particles contacts, impeding a good metal–metal joining. The value of the conventionally processed specimen is merged among the MF-ERS values.
As compared to the fully dense material resistivity, higher values are obtained for conventional and MF-ERS compacts. By contrast with the properties required in other applications, a high resistivity is desirable for soft magnetic materials (especially for electric transformers and motor cores) to reduce Foucault losses. Thus, because electrically consolidated specimens can reach higher resistivities, the MF-ERS is probably revealed to be a process to produce PM soft magnetic parts.

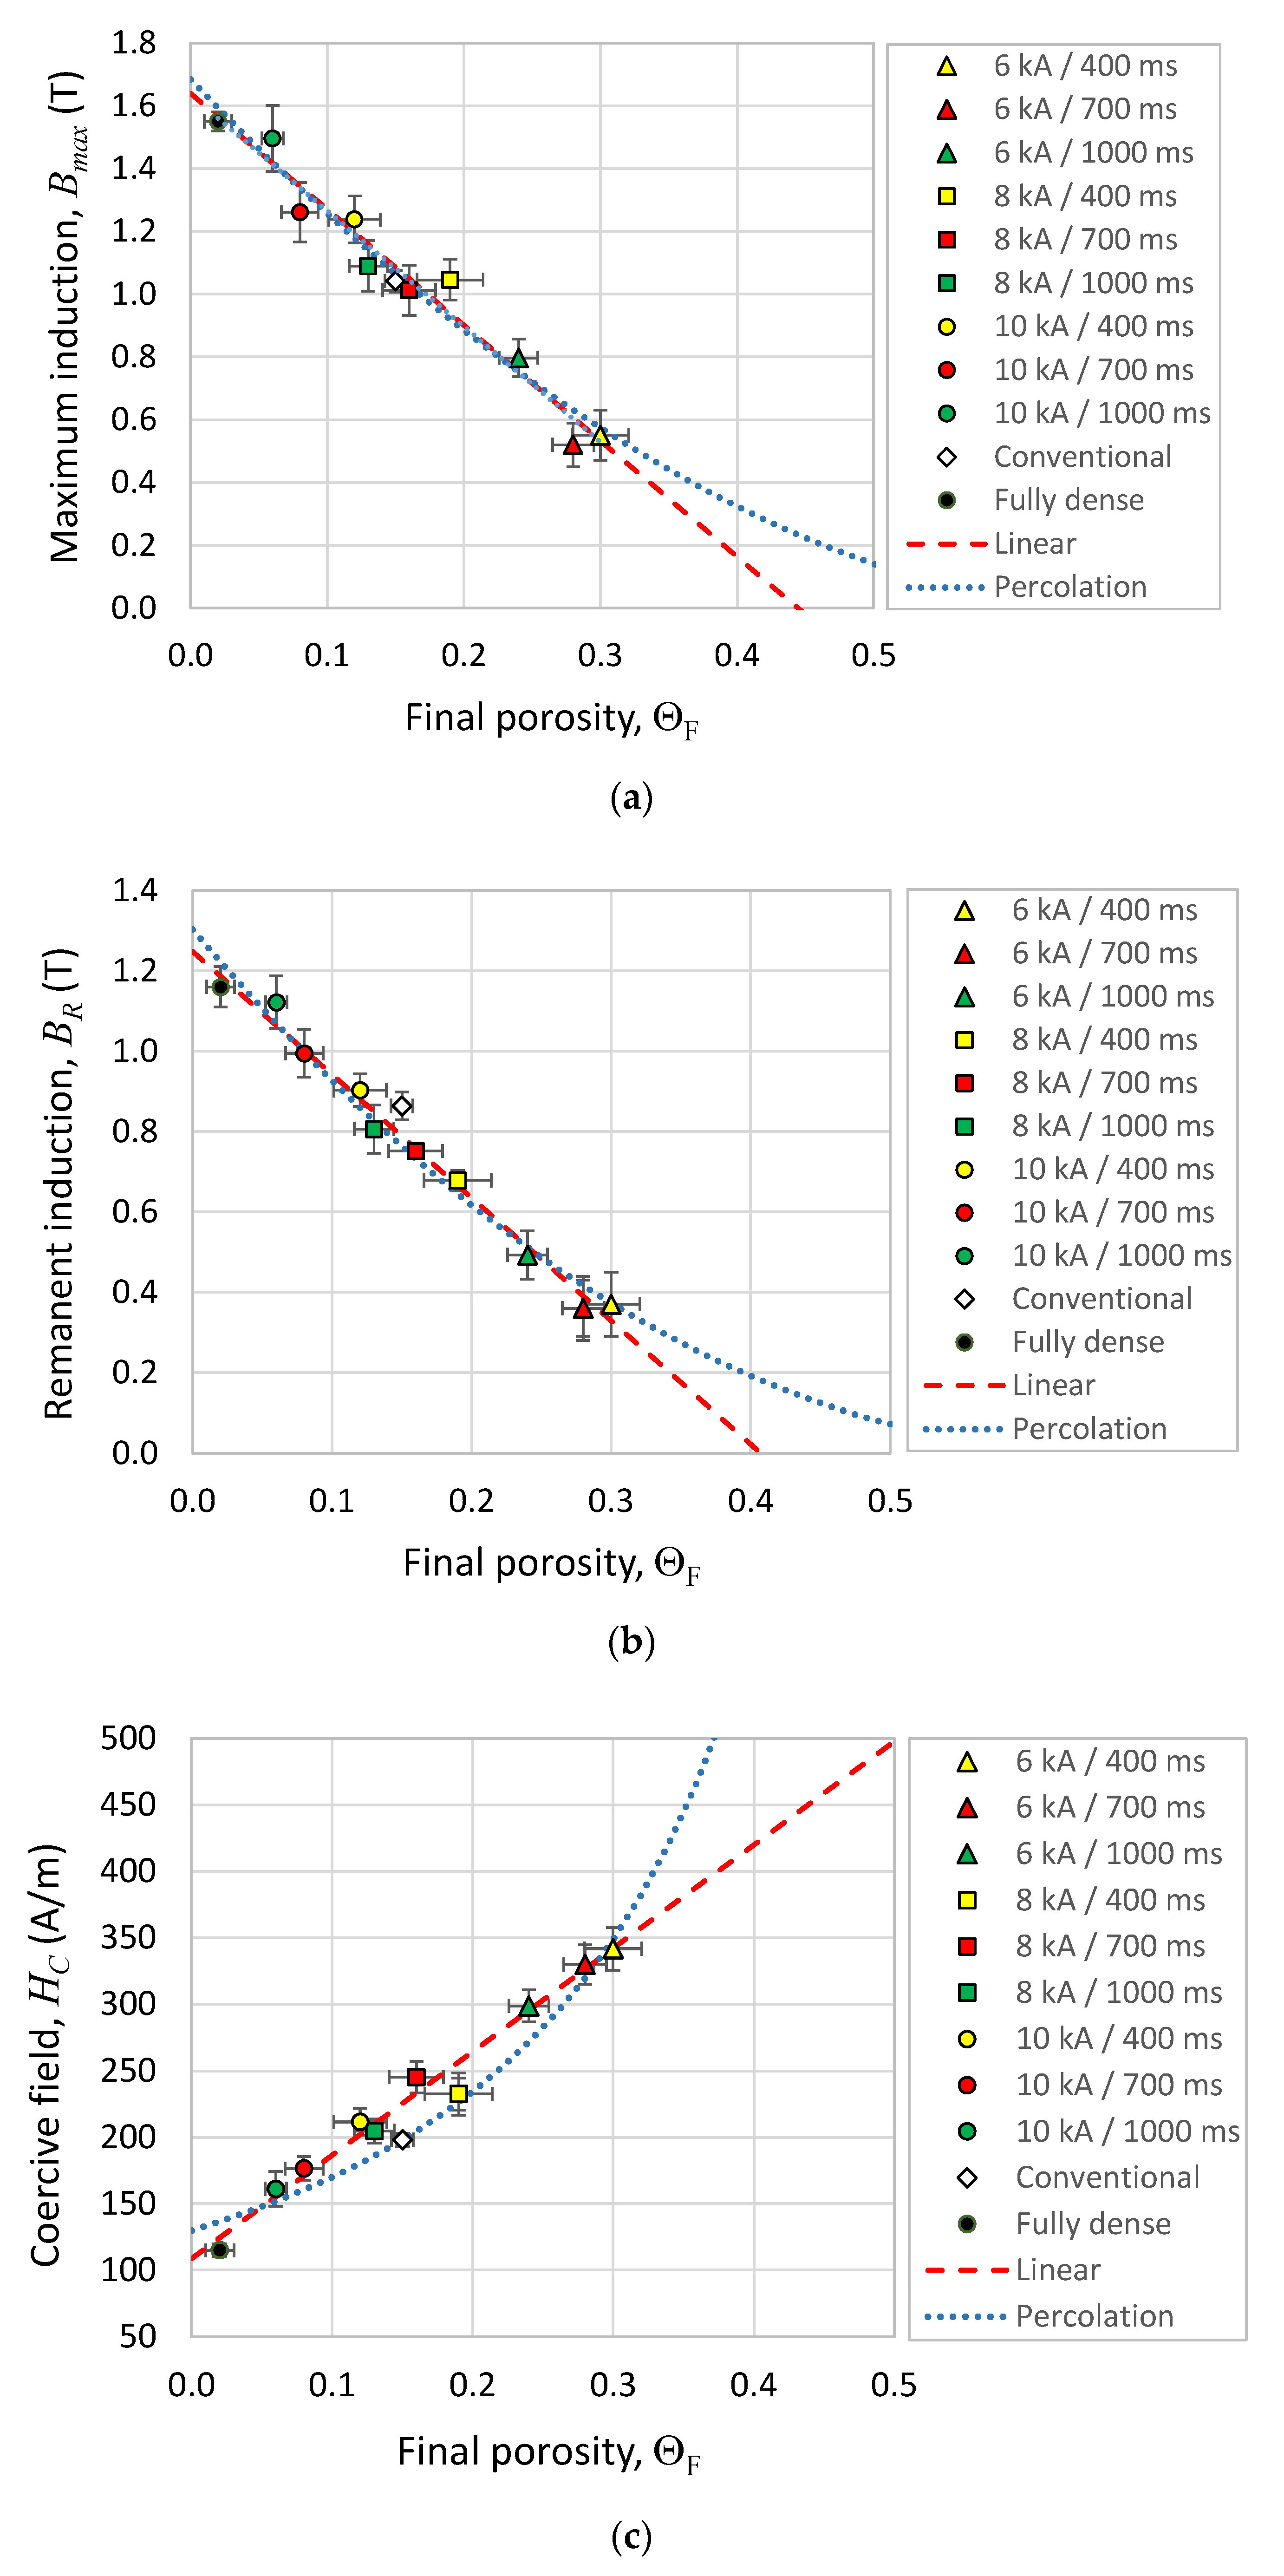
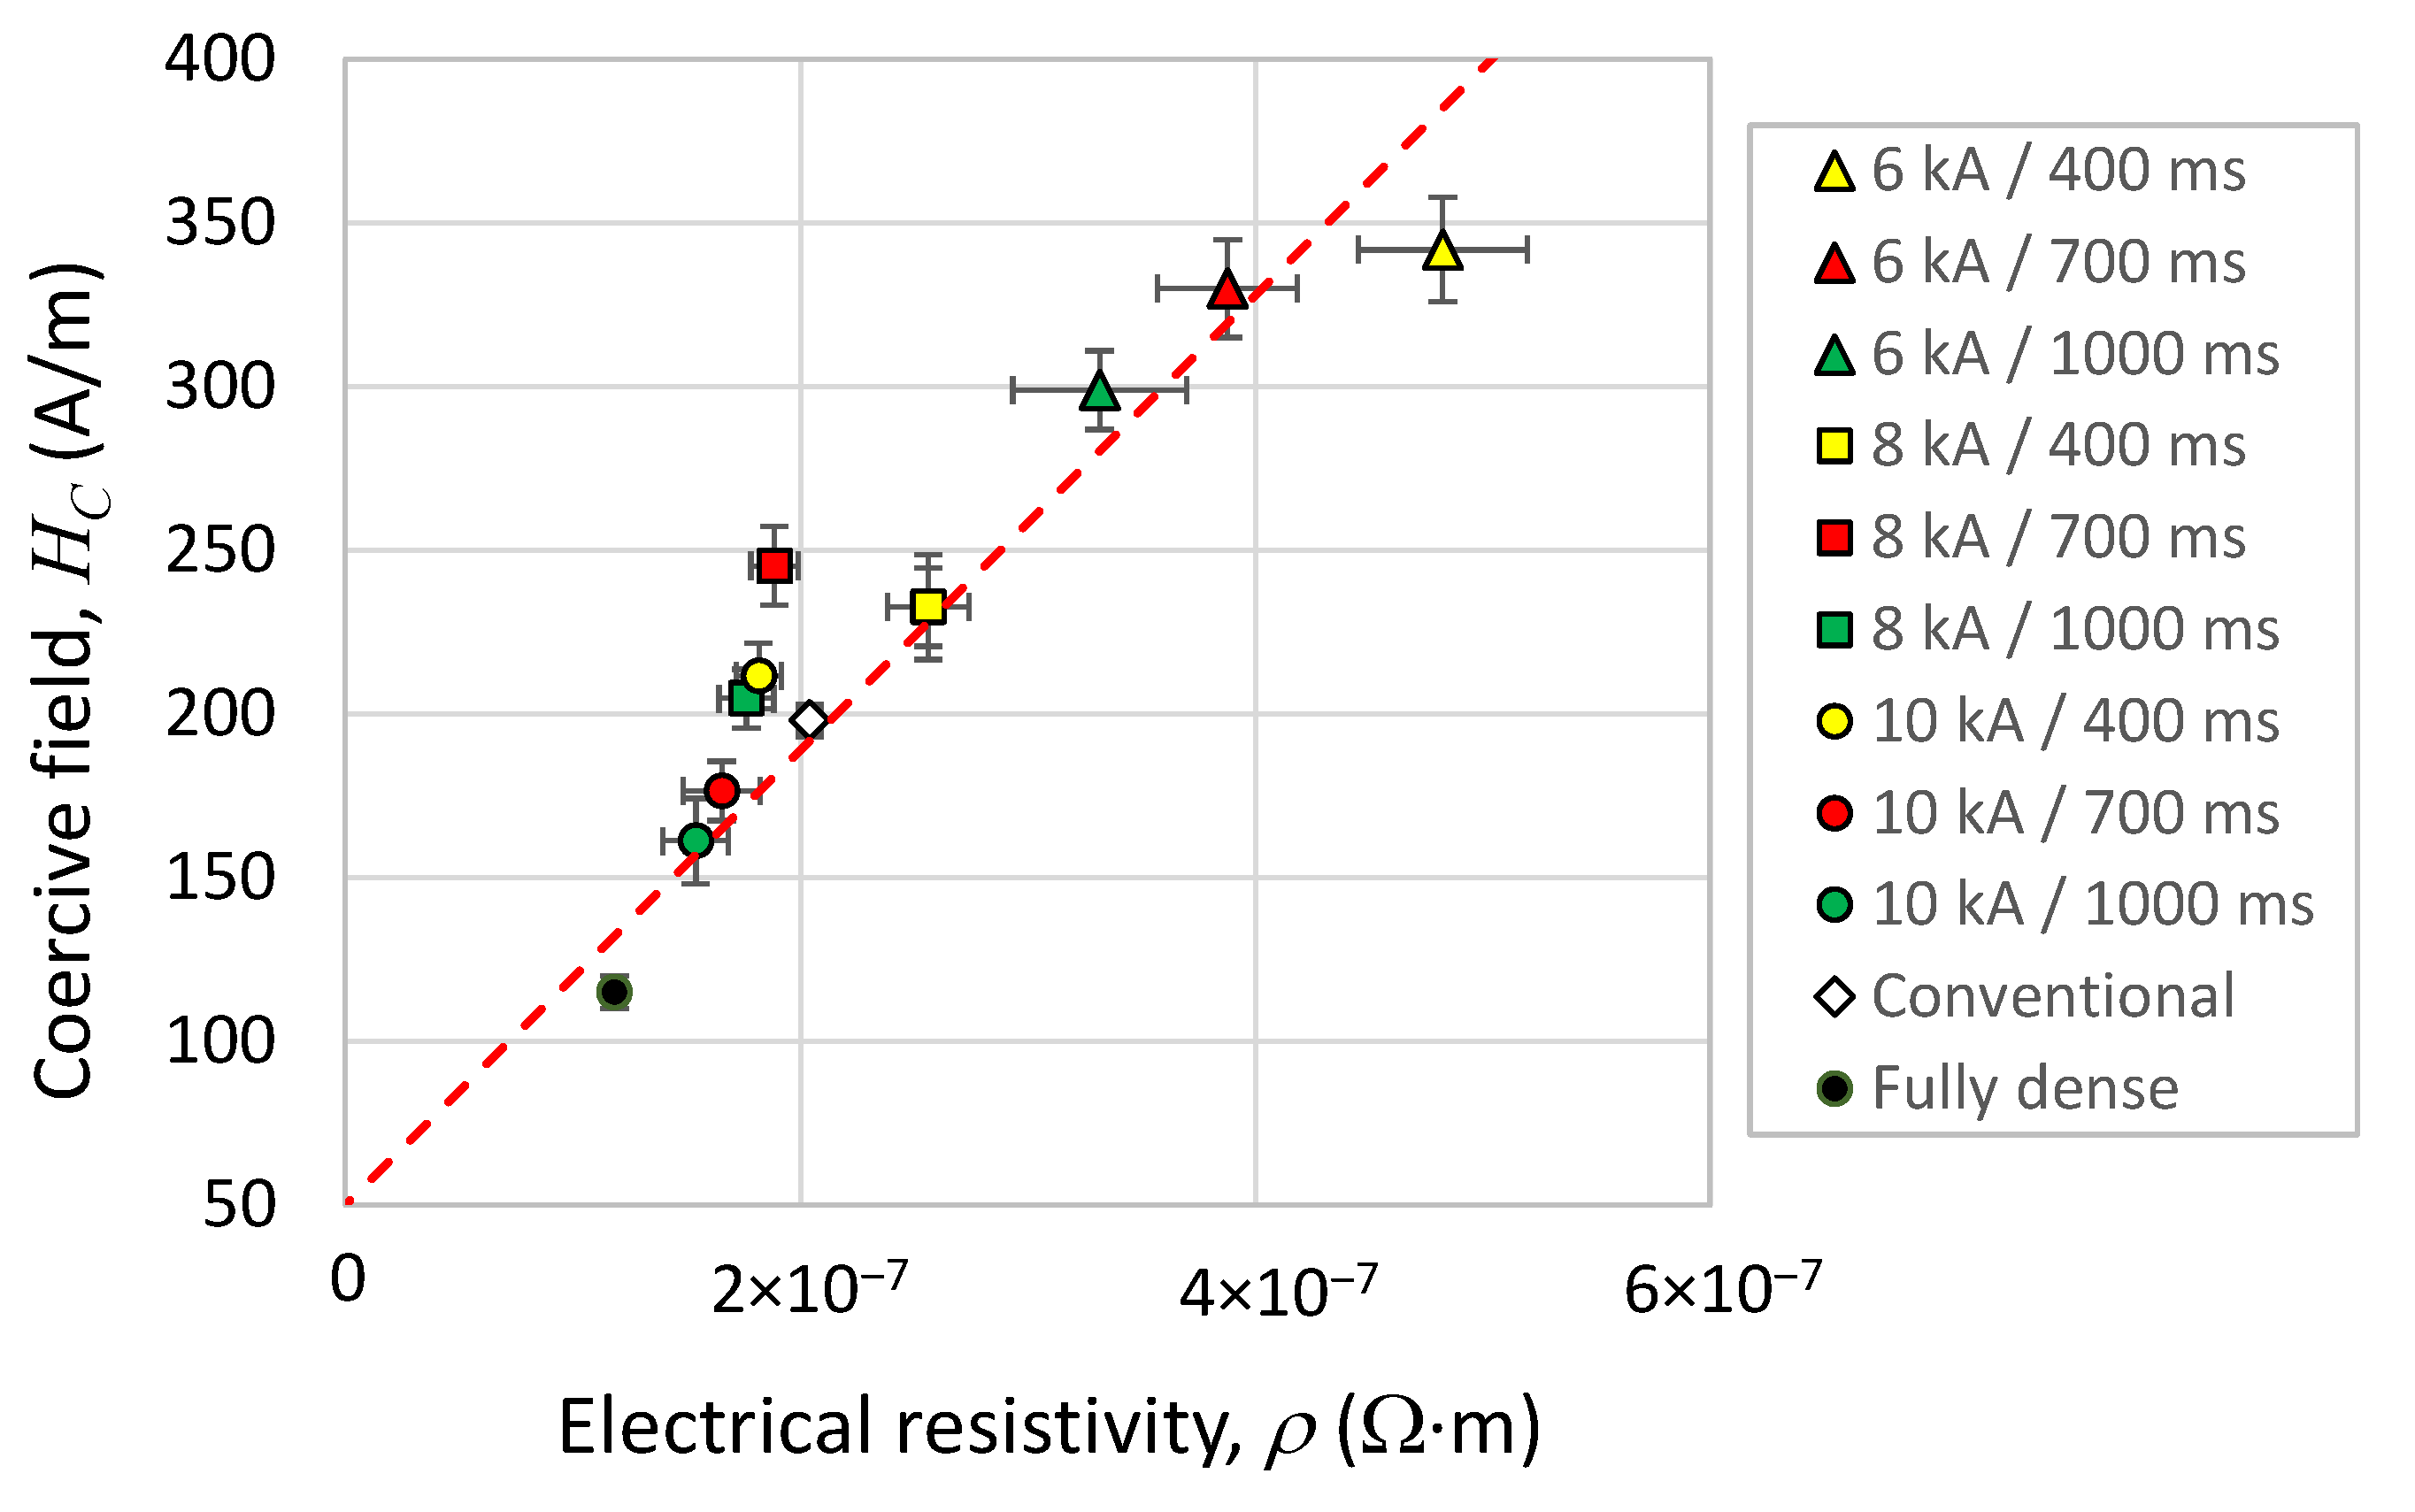
3.5. Hysteresis Curves

It is finally pending to check if magnetic properties of the electrically consolidated specimens are also acceptable, and the obtained results as compared to those of the furnace sintered compacts.
Table 5 gathers the main magnetic characteristics of the MF-ERS and furnace sintered compacts: the maximum induction (Bmax), the remanent induction (BR) and the coercive field (HC).
Figure 10 represents these magnetic properties as a function of the porosity.
Graphs in Figure 10 show two trend curves obtained by fitting by the least squares method the experimental data to a linear law,
p = p 0 + m Θ
and to a percolation law of the type shown in Equation (4), which has been shown to adequately describe the magnetic behaviour in [26],
p = p 0 ( 1 Θ / Θ M ) n
Table 6 shows the values of the parameters obtained after fitting process of these equations.
Table 6 shows that the determination coefficients, R2, are slightly higher for the linear fitting. This is because the porosity range analysed is not wide enough, and the linear law does not show its limitations; moreover, the parameter ΘM in Equation (6) has been fixed to the value 0.673, found in Section 2.3. (in the case of being considered a free parameter, the fitting goodness could improve).
Besides the presence of impurities, it is well known that porosity is one of the main factors negatively affecting soft magnetic properties in sintered materials [1,26,27,28]. Porosity is merely an absence of material that therefore is not available to be magnetised. However, porosity does not have the same relevance in all magnetic properties. For example, Bmax measured in pore-free properly sintered compacts should be equivalent to that of bulk materials of similar composition. The influence of the porosity level here is decisive and very clear, despite the fact that other microstructural factor should also be taken into account. Thus, following the sintered compacts data trend in Figure 10, the Bmax value of the bulk compact is approximately reached. A similar behaviour to Bmax is found for BR. In this paper, experimental values of Bmax and BR vs. porosity (Figure 10) show a decrease of these properties as the porosity level increases, with an approximately linear trend, in a first approach. The mean values for MF-ERS compacts are 0.97 and 0.71 T for Bmax and BR, respectively. These values are lower than those measured in this work for fully dense samples: 1.55 and 1.16 T, respectively, being these latter values very near to those reported for properly sintered commercially pure iron samples in [1]: 1.6 T and 1.2 T, respectively. Careful processing can even improve these results. Reported values for fully dense commercially pure iron samples (obtained by sintering in hydrogen at 1120 °C for 30 min, then hot re-pressed, and sintered at 1260 °C in hydrogen for 30 min, and cooled at 5.5 °C/min) are around Bmax = 1.6 T and BR = 1.5 T [29]. If parts are sintered at temperatures higher than 1260 °C, held at temperature for long time, and hot forged to remove the pores, the maximum and remanent induction can reach 2.2 T and 1.8 T, respectively [1]. In order to obtain these figures it is essential to control grain growth and impurities within the material. (Obviously, the described techniques are not widely used in commercial practice.) High values of Bmax and BR are required for soft magnetic materials applications in order to obtain high amplifications of the magnetic fields produced by the coils. This allows reducing the winding number in the coil and/or the current intensity, without decreasing the strength of the generated magnetic field. Nevertheless, the values obtained in the MF-ERS specimens are, in general, acceptable, and in accordance with their porosity level.
On the other hand, the influence of the porosity on HC is, in general, the opposite, making coercivity to increase for higher porosities [1,30]. Moreover, it is known that some magnetic properties are strongly affected by the shape and size of the pores, the strain and residual stresses, the grain size, or the presence of precipitates/inclusions, which also affect properties of bulk materials [1,30]. In particular, these microstructural features can become even more important than the porosity level for the magnetic coercivity [31,32,33].
However, the HC trend with the porosity shown in Figure 10c results in agreement with the increasing trend expected from [1,30]. A mean value of 239 A/m is obtained in MF-ERS samples, higher than 115 A/m for fully dense sintered compacts [1]. Nevertheless, it is worth nothing that the more densified MF-ERS sample reaches a value of 161 A/m, lower that the value of the conventionally sintered sample, with a value of 198 A/m. (It is nevertheless possible to reduce this value by improving densification with reducing sintering atmospheres).
However, it would be desirable for soft magnetic materials to have a high coercivity and a low resistivity, thus minimising hysteretic and Foucault magnetic losses. It is well known that only metallic glasses get this desirable combination of properties [34]. Figure 11 represents coercivity vs. electrical resistivity, showing, as expected, that it is not possible to lower the coercivity without a resistivity decrease. In this sense, MF-ERS allows obtaining more resistive compacts (reducing Foucault losses), but with a coercivity increase (increasing the hysteresis losses) that must be assessed in each particular application.
In summary, it could be said that the electrotechnical properties of electrically consolidated compacts are not worse than those of obtained by the conventional PM route. Moreover, MF-ERS specimens have the added value of being consolidated in a lower time, with lower applied pressures and without needing reducing atmospheres. Achieving similar properties through a faster and less energy-intensive process is already a major achievement. However, it might be interesting to study whether it is not possible, via the MF-ERS route, to improve the final properties of the materials. Since both magnetic and electrical conductivity are affected by the high dislocation density derived from the fast processing, a possible option to study in the future could be to consider a post-annealing treatment, as indicated in [35].

4. Conclusions

Medium-frequency projection welding equipment was adapted for the electrical consolidation process denominated MF-ERS. With this process, iron sintered compacts 12 mm in diameter and 3.5 g were obtained by using a 100 MPa pressure, current intensities of 6, 8 and 10 kA and heating times of 400, 700 and 1000 ms.
Porosity and microhardness were in accordance with processing conditions, with lower porosity and higher microhardness for more energetic conditions.
The electrical resistivity followed a reasonable trend, according to that expected for sintered compacts only for high current intensity and passing time, and behaving following the trend of pressed powder for low energy values.
Regarding magnetic properties, Bmax and BR values for conventional and MF-ERS compacts were lower than those of the fully dense specimen. The value of HC was, however, lower in the fully dense specimen. The influence of the porosity in these properties was as expected: Bmax and BR decreased for higher porosities, whereas HC increased with the porosity. The values of Bmax, BR and HC were equal for conventional and electrically consolidated specimens, comparing compacts with a similar level of porosity. This is a remarkable achievement for this faster technique. As expected, the obtained properties were lower than those of the fully dense material.
This study allows us to conclude that the electrical resistivity dependence on the porosity, both for the pressed powder and the consolidated powder, is correctly described by a percolation type law (Equations (3) and (4)). This law has also been tested for the dependence of the magnetic properties on the porosity, although the porosity range studied in this work is too narrow to conclude that the percolation law (Equation (6)) is better than linear correlations (Equation (5)). Nevertheless, extrapolating to higher porosity levels seems to show that the linear laws cannot be appropriate.
Finally, it has been proved that the MF-ERS consolidation route can be an alternative to traditional routes for the manufacturing of small magnetic parts, resulting in a quick and low-energy consumption process. The electric car industry could be a potential candidate for this manufacturing procedure.

Author Contributions

Conceptualization, J.M.M., J.C. and F.G.C.; methodology, J.C. and F.T.; validation, R.A. and F.T.; writing—original draft, R.A.; writing—review and editing, F.G.C. and J.M.M. All authors have read and agreed to the published version of the manuscript.

Funding

Financial support of the Ministerio de Economía y Competitividad (Spain) and Feder (EU) through the research projects DPI2015-69550-C2-1-P and DPI2015-69550-C2-2-P is gratefully acknowledged.

Acknowledgments

The authors also wish to thank the technicians J. Pinto, M. Madrid and M. Sánchez (University of Seville, Spain) for experimental assistance.

Conflicts of Interest

The authors declare no conflict of interest.

References

  1. Moyer, K.H. Magnetic materials and properties for part applications. In ASM Handbook, Volume 7, Powder Metal Technologies and Applications, Section Materials Systems, Properties, and Applications; ASM International: Russell, OH, USA, 1998; Volume 7, pp. 1006–1020. [Google Scholar]
  2. Bas, J.A.; Calero, J.A.; Dougan, M.J. Sintered soft magnetic materials. J. Magn. Magn. Mater. 2003, 254–255, 391–398. [Google Scholar] [CrossRef]
  3. Cuevas, F.G.; Montes, J.M.; Cintas, J.; Gallardo, J.M. Production of Al-Al3Ti powders by mechanical alloying and annealing. Powder Metall. 2005, 48, 365–370. [Google Scholar] [CrossRef]
  4. Anselmi-Tamburini, U.; Groza, J.R. Critical assessment: Electrical field/current application—A revolution in materials processing/sintering? Mater. Sci. Technol. 2017, 33, 1855–1862. [Google Scholar] [CrossRef] [Green Version]
  5. Grasso, S.; Sakka, Y.; Maizza, G. Electric current activated/assisted sintering (ECAS): A review of patents 1906-2008. Sci. Technol. Adv. Mater. 2009, 10, 1–24. [Google Scholar] [CrossRef]
  6. Orrù, R.; Licheri, R.; Locci, A.M.; Cincotti, A.; Cao, G. Consolidation/synthesis of materials by electric current activated/assisted sintering. Mat. Sci. Eng. R. 2009, 63, 127–287. [Google Scholar] [CrossRef]
  7. Olevsky, E.A.; Dudina, D.V. Field-Assisted Sintering Science and Applications, 1st ed.; Springer International Publishing: Cham, Switzerland, 2018. [Google Scholar]
  8. Taylor, G.F. Apparatus for Making Hard Metal Compositions. U.S. Patent 1,896,854, 7 February 1933. [Google Scholar]
  9. Lenel, F.V. Resistance sintering under pressure. JOM 1955, 7, 158–167. [Google Scholar] [CrossRef]
  10. Montes, J.M.; Rodríguez, J.A.; Cuevas, F.G.; Cintas, J. Consolidation by electrical resistance sintering of Ti powder. J. Mater. Sci. 2011, 46, 5197–5207. [Google Scholar] [CrossRef]
  11. Cuevas, F.G.; Andreouli, D.; Gallardo, J.M.; Oikonomou, V.; Cintas, J.; Torres, Y.; Montes, J.M. Ceramic dies selection for electrical resistance sintering of metallic materials. Ceram. Int. 2019, 45, 14555–14561. [Google Scholar] [CrossRef]
  12. Fais, A. A Faster FAST: Electro-Sinter-Forging. Met. Powder Rep. 2018, 73, 80–86. [Google Scholar] [CrossRef]
  13. Cannella, E.; Nielsen, C.V.; Bay, N. Process Investigation and Mechanical Properties of Electro Sinter Forged (ESF) Titanium Discs. Int. J. Adv. Manuf. Technol. 2019, 104, 1985–1998. [Google Scholar] [CrossRef]
  14. Ternero, F.; Astacio, R.; Caballero, E.S.; Cuevas, F.G.; Montes, J.M. Influence of Processing Parameters on the Conduct of Electrical Resistance Sintering of Iron Powders. Metals 2020, 10, 540. [Google Scholar] [CrossRef]
  15. Deng, H.; Dong, J.; Boi, F.; Saunders, T.; Hu, C.; Grasso, S. Magnetic Field Generated during Electric Current-Assisted Sintering: From Health and Safety Issues to Lorentz Force Effects. Metals 2020, 10, 1653. [Google Scholar] [CrossRef]
  16. Montes, J.M.; Cuevas, F.G.; Reina, F.J.V.; Ternero, F.; Astacio, R.; Caballero, E.S.; Cintas, J. Modelling and Simulation of the Electrical Resistance Sintering Process of Iron Powders. Met. Mater. Int. 2020, 26, 1045–1059. [Google Scholar] [CrossRef]
  17. MPIF Standard 4. Determination of Apparent Density of Free-Flowing Metal Powders Using the Hall Apparatus. In Standard Test Methods for Metal Powders and Powder Metallurgy Products; Metal Powder Industries Federation (MPIF): Princeton, NJ, USA, 2016. [Google Scholar]
  18. MPIF Standard 46. Determination of tap density of metal powders. In Standard Test Methods for Metal Powders and Powder Metallurgy Products; Metal Powder Industries Federation (MPIF): Princeton, NJ, USA, 2016. [Google Scholar]
  19. Montes, J.M.; Cuevas, F.; Ternero, F.; Astacio, R.; Caballero, E.S.; Cintas, J. Medium-frequency electrical resistance sintering of oxidized C.P. iron powder. Metals 2018, 8, 426. [Google Scholar] [CrossRef] [Green Version]
  20. Ugarteche, C.V.; Furlan, K.P.; Pereira, R.V.; Tringade, G.; Binder, R.; Binder, C.; Klein, A.N. Effect of microstructure on the thermal properties of sintered iron-copper composites. Mater. Res. 2015, 18, 1176–1182. [Google Scholar] [CrossRef] [Green Version]
  21. Bardhan, P.K.; Patra, S.; Sutradhar, G. Analysis of density of sintered iron powder component using the response surface method. Mater. Sci. Appl. 2010, 1, 152–157. [Google Scholar] [CrossRef]
  22. Uhlir, A.J. The potentials of infinite systems of sources and numerical solutions of problems in semiconductor engineering. Bell Syst. Tech. J. 1955, 34, 105–128. [Google Scholar] [CrossRef]
  23. ASTM A773/A773M-21. Standard Test Method for Direct Current Magnetic Properties of Low Coercivity Magnetic Materials Using Hysteresigraphs; ASTM International: West Conshohocken, PA, USA, 2021. [Google Scholar]
  24. ISO Standard ISO 6507-1:2018. Metallic Materials-Vickers Hardness Test-Part 1: Test. Method; European Committee for Standardization (CEN): Brussels, Belgium, 2018. [Google Scholar]
  25. Montes, J.M.; Cuevas, F.G.; Cintas, J.; Ternero, F.; Caballero, E.S. Electrical resistivity of powdered porous compacts. In Electrical and Electronic Properties of Materials; Alam, M.K., Ed.; IntechOpen: London, UK, 2018. [Google Scholar]
  26. Ternero, F.; Rosa, L.G.; Urban, P.; Montes, J.M.; Cuevas, F.G. Influence of the Total Porosity on the Properties of Sintered Materials—A Review. Metals 2021, 11, 730. [Google Scholar] [CrossRef]
  27. Burrows, C.W. Correlation of the Magnetic and Mechanical Properties of Steel (Classic Reprint); Forgotten Books: London, UK, 2018. [Google Scholar]
  28. Dorogina, G.A.; Kuznetsov, I.A.; Balakirev, V.F. Physical properties of sintered specimens of powder iron of different purity. Met. Sci. Heat Treat. 2014, 56, 108–110. [Google Scholar] [CrossRef]
  29. Lenel, F.V. Magnetic applications. In Metals Handbook Ninth Edition, Volume 7, Powder Metallurgy, Section Powder Systems and Applications; ASM International: Russell, OH, USA, 1984; Volume 7, pp. 638–645. [Google Scholar]
  30. Jangg, G.; Drozda, M.; Danninger, H.; Nad, R.E. Magnetic properties of sintered iron: The influence of porosity on the magnetic properties of sintered iron. Powder Metall. Int. 1983, 15, 173–177. [Google Scholar]
  31. Steinitz, R. Magnetic properties of iron compacts in relation to sintering temperatures. J. Appl. Phys. 1949, 20, 712–714. [Google Scholar] [CrossRef]
  32. Chang, C.R.; Shyu, J.P. Interaction energy among pores within porous particles. J. Magn. Magn. Mater. 1992, 104-107, 1543–1544. [Google Scholar] [CrossRef]
  33. Chang, C.R.; Shyu, J.P. Particle interaction and coercivity for acicular particles. J. Magn. Magn. Mater. 1993, 120, 197–199. [Google Scholar] [CrossRef]
  34. Lashgari, H.R.; Chu, D.; Xie, S.; Sun, H.; Ferry, M.; Li, S. Composition dependence of the microstructure and soft magnetic properties of Fe-based amorphous/nanocrystalline alloys: A review study. J. Non-Cryst. Solids 2014, 391, 61–82. [Google Scholar] [CrossRef]
  35. Biesuz, M.; Saunders, T.; Ke, D.; Reece, M.J.; Hu, C.; Grasso, S. A review of electromagnetic processing of materials (EPM): Heating, sintering, joining and forming. J. Mater. Sci. Technol. 2021, 69, 239–272. [Google Scholar] [CrossRef]
Figure 1. Electrical resistance welding equipment adapted to act as the medium-frequency electrical resistance sintering (MF-ERS) equipment, and detail of the die and electrodes/punches set employed in the experiments (a superimposed image shows the internal arrangement of the components).
Metals 11 00994 g001
Figure 2. (a) Scanning electron microscopy (SEM) micrograph (FEI Teneo, FEI Company, Hillsboro, OR, USA) of the Fe WPL200 powder used in the MF-ERS experiments and conventional and double cycle PM consolidation. (b) Granulometric curve of the powder, showing a monomodal distribution.
Metals 11 00994 g002aMetals 11 00994 g002b
Figure 3. Representation of the four points probe for the electrical resistance measurements. For convenience, the distance between electrodes is the same (d). The electrodes are connected to a Kelvin bridge, which supplies the ratio V/I (with electrical resistance dimensions, Rmeasured) used to calculate the electrical resistivity.
Metals 11 00994 g003
Figure 4. Microhardness indentation map on a compact diametrical section. All the measured values were averaged to determine the hardness of the whole specimen.
Metals 11 00994 g004
Figure 5. STE vs. final porosity (ΘF) for the different MF-ERS compacts, and linear trend obtained by the least squares method.
Metals 11 00994 g005
Figure 6. Porosity distribution in MF-ERS and conventionally processed iron compacts. The denser and thus more reflecting clear areas indicate a lower porosity.
Metals 11 00994 g006
Figure 7. Porosity distribution in the upper-left quadrant of MF-ERS compacts processed with (a) 8 kA and 700 ms, and (b) 10 kA and 1000 ms.
Metals 11 00994 g007
Figure 8. Mean microhardness (HV1) vs. final porosity (ΘF) for the different MF-ERS compacts, the conventionally sintered compact and the fully dense sample.
Metals 11 00994 g008
Figure 9. Electrical resistivity (ρ) vs. final porosity (ΘF) for the MF-ERS compacts, conventional compact and fully dense sample. The theoretical models given by Equations (3) and (4) are also represented.
Metals 11 00994 g009
Figure 10. Magnetic properties vs. final porosity (ΘF) for the MF-ERS and furnace sintered compacts: (a) maximum magnetic induction (Bmax); (b) remanent magnetic induction (BR); (c) coercive field (HC). Dashed trend lines are obtained by fitting Equations (5) and (6).
Metals 11 00994 g010
Figure 11. Coercivity (HC) vs. electrical resistivity (ρ) of the different compacts studied in this work.
Metals 11 00994 g011
Table 1. Values of the compacts final porosity (ΘF) for the different MF-ERS experiments. The mean values and standard deviations were computed from the values measured in four compacts obtained under identical conditions.
Heating Time (ms)
4007001000
Intensity (kA)60.30 ± 0.020.28 ± 0.010.24 ± 0.01
80.19 ± 0.020.16 ± 0.020.13 ± 0.01
100.12 ± 0.020.08 ± 0.010.06 ± 0.01
Table 2. Specific thermal energy (STE) values (expressed in kJ/g) for the different MF-ERS experiments. The mean values and standard deviations were computed from the values measured in four compacts obtained under identical conditions.
Heating Time (ms)
4007001000
Intensity (kA)60.35 ± 0.010.42 ± 0.020.53 ± 0.04
80.57 ± 0.030.60 ± 0.050.74 ± 0.04
100.70 ± 0.040.72 ± 0.050.82 ± 0.05
Table 3. Values of microhardness (HV1) for the different MF-ERS compacts. The mean values and standard deviations have been computed from each specimen with the values measured in the five points indicated in Figure 4. The final results are the mean values from the four studied compacts obtained under identical conditions.
Heating Time (ms)
4007001000
Intensity (kA)637 ± 945 ± 858 ± 9
861 ± 1676 ± 980 ± 5
1081 ± 985 ± 590 ± 6
Table 4. Values of electrical resistivity ρ (expressed in Ω·m) for the different MF-ERS compacts. The mean values and standard deviations have been computed from the values measured in four compacts obtained under identical conditions.
Heating Time (ms)
4007001000
Intensity (kA)6(4.82 ± 0.4) × 10−7(3.88 ± 0.3) × 10−7(3.32 ± 0.4) × 10−7
8(2.56 ± 0.2) × 10−7(1.88 ± 0.1) × 10−7(1.76 ± 0.1) × 10−7
10(1.82 ± 0.1) × 10−7(1.65 ± 0.2) × 10−7(1.54 ± 0.2) × 10−7
Table 5. Values of the magnetic properties measured for each experiment of ERS, conventionally consolidated compacts and fully dense compacts. The mean values and standard deviations have been computed from the values measured in four compacts obtained under identical conditions.
MaterialMagnetic Property
Bmax (T)BR (T)HC (A/m)
6 kA/400 ms (ΘF = 0.30)0.55 ± 0.080.37 ± 0.08342 ± 16
6 kA/700 ms (ΘF = 0.28)0.52 ± 0.070.36 ± 0.07330 ± 15
6 kA/1000 ms (ΘF = 0.24)0.80 ± 0.060.49 ± 0.06299 ± 12
8 kA/400 ms (ΘF = 0.19)1.05 ± 0.070.68 ± 0.03233 ± 12
8 kA/700 ms (ΘF = 0.16)1.01 ± 0.080.75 ± 0.02245 ± 12
8 kA/1000 ms (ΘF = 0.13)1.09 ± 0.080.81 ± 0.06205 ± 9
10 kA/400 ms (ΘF = 0.12)1.24 ± 0.080.90 ± 0.04212 ± 10
10 kA/700 ms (ΘF = 0.08)1.26 ± 0.100.99 ± 0.06176 ± 9
10 kA/1000 ms (ΘF = 0.06)1.50 ± 0.111.12 ± 0.07161 ± 13
Conventional (ΘF = 0.15)1.04 ± 0.040.86 ± 0.04198 ± 5
Fully dense (ΘF = 0.02)1.55 ± 0.031.16 ± 0.05115 ± 5
Table 6. Values of the parameters obtained by fitting the magnetic experimental data to Equations (5) and (6).
Linear Law, Equation (5)Percolation Law, Equation (6)
p0mR2p0ΘMnR2
Bmax (T)1.6381−3.68560.96251.68390.6731.81350.9553
BR (T)1.2481−3.06490.98721.30330.6732.10990.9816
Hc (A/m)108.8670777.68440.9795130.00210.673−1.74520.9192
Publisher’s Note: MDPI stays neutral with regard to jurisdictional claims in published maps and institutional affiliations.

