
Numerical and Experimental Investigation on Concrete Splitting Failure of Anchor Channels


1
Faculty of Civil Engineering, University of Rijeka, Radmile Matejčić 3, 51000 Rijeka, Croatia
2
Hilti Corporation, Feldkircherstrasse 100, 9494 Schaan, Liechtenstein
3
Institute of Construction Materials, University of Stuttgart, Pfaffenwaldring 4, 70569 Stuttgart, Germany
*
Author to whom correspondence should be addressed.
CivilEng 2021, 2(2), 502-522; https://doi.org/10.3390/civileng2020028
Submission received: 11 May 2021
/
Revised: 9 June 2021
/
Accepted: 15 June 2021
/
Published: 18 June 2021
(This article belongs to the Special Issue Connections in Concrete)
Abstract
:Concrete splitting failure due to tension load can occur when fastening systems are located close to an edge or corner of a concrete member, especially in thin members. This failure mode has not been extensively investigated for anchor channels. Given the current trend in the construction industry towards more slender concrete members, this failure mode will become more and more relevant. In addition, significantly different design rules in the United States and Europe indicate the need for harmonization between codes. Therefore, an extensive numerical parametric study was carried out to evaluate the influence of member thickness, edge distance, and anchor spacing on the capacity of anchor channels in uncracked and unreinforced concrete members. One of the main findings was that the characteristic edge distance depends on the member thickness and can be larger than 3hef (hef = embedment depth) for thin members. Based on the numerical and experimental test results, modifications of the design recommendations for the splitting failure mode are proposed. Overall, the authors recommend performing the splitting verification separately from the concrete breakout to design anchor channels in thin members more accurately.
1. Introduction
Concrete splitting failure due to tension load can be decisive when installing a fastening system close to an edge or corner, especially in relatively thin concrete members. In recent years, concrete elements have become thinner and lighter, leading to design challenges and creating a need for shallow embedment fastening systems. The curtain wall application is a typical example in which brackets are attached via elements such as anchor channels under geometric configurations that are prone to concrete splitting failure.
The main objective of this paper is to study the behaviour of anchor channels subjected to tension close to an edge. Experimental tests and an extensive numerical parametric study were carried out to evaluate the influence of member thickness, edge distance, and anchor spacing on the capacity of anchor channels in uncracked and unreinforced concrete members. Possible improvements for the current design model for concrete splitting are proposed and the conclusions are discussed in detail. Another challenge arises from the different design rules for concrete splitting failure in the US (ACI 318 [1] with the amendment of AC 232 [2] for anchor channels) and Europe (EN 1992-4 [3]). A base for the harmonization of the codes in the US and Europe is also provided in this paper.
Asmus and Hüer [4,5,6] already investigated the splitting failure for different types of fastening systems. Asmus [4] extensively investigated headed studs, undercut anchors, and expansion anchors near an edge or corner of a concrete member or in a narrow element. He proposed different calculation methods depending on the load transfer mechanism, but his first proposal was less suitable for design purposes due to its high complexity. Therefore, Asmus [5] later proposed a simplified model valid for different types of typical anchor systems based on the well-known concrete capacity (CC) method [7]. The main feature of his proposal is a product-dependent factor kp, which takes into account the effect of the load transfer mechanism or of the load bearing area, depending on the fastening system. This factor should be obtained through unconfined tension tests in the corner of a concrete member.
Hüer [6] focused his research mainly on bonded anchors and proposed a design method based on the experimental and numerical results for two possible setups, i.e., confined and unconfined. For unconfined tests, the reaction support of the test rig was located at a distance of at least twice the embedment depth from the anchor, which ensures an unrestricted concrete cone formation. For confined tests, concrete breakout failure was suppressed by introducing the reaction forces into the concrete close to the anchor. In this case, steel failure of the anchor, anchor pull-out, or failure due to formation of splitting cracks in the concrete may occur. It was shown that the maximum load obtained from the confined setup is generally (significantly) greater than that from the unconfined setup, especially when the member thickness is limited. Bending stresses induced by the unconfined setup lead to bending stresses and cracks in the concrete member which, consequently, leads to a decrease in capacity. Therefore, it was concluded that cases where qualification tests for concrete splitting failure were performed under unconfined conditions do not provide reliable information on the actual “global” splitting resistant. Moreover, in thin members, the concrete breakout capacity could be additionally affected by the bending stresses introduced by external loads on the fastening elements.
Furthermore, the work of Nilforoush [8] should be mentioned, although he investigated fasteners without the influence of edge distance. Among others, the most relevant topic for this investigation is the influence of member thickness on the concrete breakout capacity for cast-in headed studs. With increasing member thickness and consequent increased global bending stiffness of the slab, the concrete bending/splitting failure transitions to concrete breakout. This increase in member thickness prevents cracks from bending/splitting, but promotes circumferential cone-shaped cracks. Based on the numerical and experimental results, a modification factor was proposed to take into account the influence of member thickness on the concrete breakout failure. Since the behaviour of headed studs and anchor channels under tension is very similar, this contribution also needs to be considered.
Only a few investigations have been performed for anchor channels with respect to shallow embedment depths, both under tension [9] and shear load [10]. Regarding the tension load, a modification of the factor αch,N in the current design provisions has been proposed by Grosser et al. [9], which allows an accurate design even for very shallow embedded anchor channels.
2. Design Provisions for the Concrete Splitting Failure Due to Loading
Currently, the design rules for concrete splitting failure of anchor channels differ significantly between Europe (EN 1992-4 [3]) and the United States (ACI 318 [1] with the amendment of AC 232 [2] for anchor channels). In the United States, the verification of concrete splitting failure is included in the concrete breakout verification by means of an additional factor:
where cac represents the edge distance required to develop full concrete capacity in absence of anchor reinforcement and ccr,N is the characteristic (critical) edge distance for concrete breakout failure. It should be noted that the influence of member thickness is not taken into account.
On the other hand, even if still based on the basic concrete breakout capacity and a similar equation, concrete splitting failure is treated as a distinct failure mode in Europe. According to EN 1992-4 [3], the characteristic resistance of an anchor channel in the case of concrete splitting failure shall be calculated according to the following equation:
where the factor N0Rk is the minimum of basic characteristic concrete breakout resistance and characteristic pull-out resistance:
The basic characteristic concrete breakout resistance contains the modification factor αch,N, which takes into account the negative effect of the channel profile on the capacity as a function of the embedment depth. However, this applies to standard anchor channels, i.e., hch/hef ≤ 0.4 and/or bch/hef ≤ 0.7, where hch and bch are the channel height and width, respectively. For anchor channels not falling in these intervals, a modification factor of 1.0 and a hypothetical embedment depth hef* = hef − hch must be conservatively assumed according to EN 1992-4 [3]. According to AC 232 [2], qualification tests may be alternatively carried out. Modification factors Ψch,s,N, Ψch,c,N, Ψch,e,N, and Ψre,N in Equation (1) should be calculated according to the provisions for concrete breakout failure. However, the characteristic edge distance ccr,N and spacing scr,N shall be replaced by ccr,sp and scr,sp, respectively. The influence of edge distance should therefore be calculated according to the following equation:
The characteristic edge distance in the case of splitting under load ccr,sp is given in relevant ETA, whereas the characteristic spacing scr,sp is defined as twice the value of the characteristic edge distance for splitting. Although for most fastening systems the characteristic edge distance for splitting ccr,sp should be derived from qualification tests, this is not the case for anchor channels. Instead, this value should be taken as 3hef, i.e., no tests are required [2,11]. An additional factor Ψh,sp takes into account the influence of member thickness and is computed as follows:
where h is the actual member thickness, hef stands for the effective embedment depth and hmin corresponds to the minimum slab thickness allowable by the manufacturer (generally close to the value of hef [2]). At the upper limit of 2.0 for Ψh,sp a characteristic member thickness of 2.83hmin can be calculated. Moreover, no verification is required if (according to EN 1992-4 [3]):
- The edge distance in all directions is c ≥ 1.2ccr,sp, and the member thickness is h ≥ hmin with hmin corresponding to ccr,sp.
- The characteristic resistances for concrete breakout failure and pull out failure are calculated for cracked concrete and reinforcement resists the splitting forces and limits the crack width to wk ≤ 0.3 mm.
Asmus [5] and Hüer [6] proposed equations for the basic splitting load that are significantly different from the equation for the basic concrete breakout resistance. Since the design model for splitting according to EN 1992-4 is based on concrete breakout, a direct comparison with the design models for splitting introduced by Asmus [5] and Hüer [6] is beyond the scope of this paper. However, the modification factor for the influence of the member thickness can be compared directly. An overview of the characteristic member thicknesses and modification factors from the literature is given in Table 1 and further investigated in the numerical parametric study. In general, the influence of the member thickness is considered with different exponents, varying between 0.25 [8] and 0.5 [5], as well as different approaches for the characteristic member thickness. Asmus [5] and Hüer [6] proposed similar approaches where the ratio Ac,sp/A0c,sp predicts that the failure load is proportional to the projected area and thus directly proportional to the thickness of the concrete member. However, it was found that the splitting failure load is less than directly proportional to the factor Ac,sp/A0c,sp, and therefore additional factors were introduced. According to Nilforoush [8], a characteristic member thickness of approximately 4.15 can be calculated from the upper limit of the modification factor. Even though the considered failure modes are partly different, this appears to be considerably larger than the value provided in [6] or in EN 1992-4 for the splitting failure.
3. FE Models and Experimental Validation
The numerical simulations were performed using a 3D nonlinear finite element code (FE). The code is based on the microplane constitutive law for concrete with relaxed kinematic constraint, which means that the microplane strains are assumed to be projections of the macroscopic strain tensor [12]. The macroscopic response is determined by monitoring stresses and strains in different predefined directions. The analysis is performed in the framework of the smeared crack approach, which requires a regularization technique to prevent mesh-dependent results. One of the simplest techniques, the crack band method [13], was used. This method, despite its drawbacks [14,15], has been successfully used in a number of 3D numerical studies [8,16]. The commercial program FEMAP [17] was used for model preparation and evaluation of numerical results.
3.1. Validation of the Numerical Model
As this study is a part of the project aiming to propose a design model for anchor channels in composite slabs, the experimental program was intended to validate the numerical model for both plain and composite slabs. Therefore, 4 tests were carried out for anchor channels in uncracked plain concrete slabs as well as in composite slabs (steel decking Cofraplus 60) with the same overall thickness of h = 130 mm. Anchor channels were installed parallel to the orientation of the steel decking in composite slabs with a distance between the anchors and the steel decking of 50 mm. The dimensions and arrangement of the reinforcement were identical for the plain slab and the composite slabs to obtain information on the capacity reduction due to the presence of the steel decking. The width and length of the slabs were 1300 mm and the arrangement of the reinforcement is shown in Figure 1a. Note that Figure 1a also shows the anchor channels that were tested in shear, which are discussed in [16]. A large amount of reinforcement was placed at a distance of 2hef from the anchors to ensure that it is outside of the expected concrete breakout body. The reinforcement not only prevents the whole slab from splitting but guarantees that the test results are not affected by concrete cracks after the previous tests.
A medium size anchor channel (HAC-60 profile provided by the company Hilti [18]) equipped with two anchors was used in all experiments and installed at an edge distance c1 = 100 mm, which is a common distance in curtain wall applications. The selected anchor spacing was s = 200 mm, but the original anchors were replaced with shorter anchors of the same diameter to reduce the embedment depth (hef) from 148 mm to 106 mm which allows for installation in thin slabs. The tests were carried out in accordance with the EAD [11] in the laboratory of the Faculty of Civil Engineering in Rijeka, Croatia, using a Zwick Roell servo-hydraulic actuator with 500 kN load cell. The load was distributed equally to two channel bolts (HBC-C M20x80 8.8F) inserted directly over the anchors, as shown in Figure 1b. All the slabs were made of the same batch of a low strength concrete (Table 2). Crushed (edged) aggregate with a maximum size of 16 mm was used. The measured concrete properties were: fcc = 34.61 N/mm2 (fc = 27.69 N/mm2) measured on 5 cubes (150 × 150 × 150) with CoV = 3.90%, ft = 2.39 N/mm2 measured on 3 cylinders (300 × 150) with CoV = 2.56% and GF = 55 J/m2 measured on 6 prismatic specimens (100 × 100 × 400) with CoV = 4.82%. For more on the evaluation of macroscopic material parameters, see [16].
The numerical model was discretized using four-node and eight-node solid finite elements, as illustrated in Figure 2a. The finite element size was set to about 10 mm in the fracture process zone and gradually increased towards the edges. The contact between concrete and steel was modeled using 1D linear contact elements which can take up only compressive forces and in-plane shear forces (friction). The cross-sectional area of these elements is calculated from the surface of the 3D concrete elements that are connected to the corresponding node of the contact element. The concrete and steel surfaces which are in contact must have the same discretization. Note that the axial (compressive) stiffness of interface elements should be sufficiently high. However, the stiffness should not be too high in order to prevent numerical problems. To minimize errors and to assure convergence, it is important that the stiffness matrix is updated after each iteration [19]. Anchor channels mainly transfer applied tension loads to the base material through mechanical interlock. Thus, the friction coefficient was set to 0.3 because its influence will be minimal. Steel parts were modeled as linear elastic with a Young’s modulus E = 210 GPa and Poisson’s ratio νs = 0.33.
The geometry and boundary conditions were taken from the corresponding experiments. The reinforcement was modeled using linear elastic solid finite elements and assuming a perfect bond with concrete. Double symmetry was utilized to reduce the computational cost (Figure 2b). Experimentally obtained macroscopic concrete parameters were taken in the simulations. As the Young’s modulus and Poisson’s ratio were not experimentally investigated, they were estimated according to CEB-FIP Model Code 90 [20] as E = 29,862 MPa and νc = 0.18. The load was applied incrementally with a displacement rate of 0.03 mm per load increment.
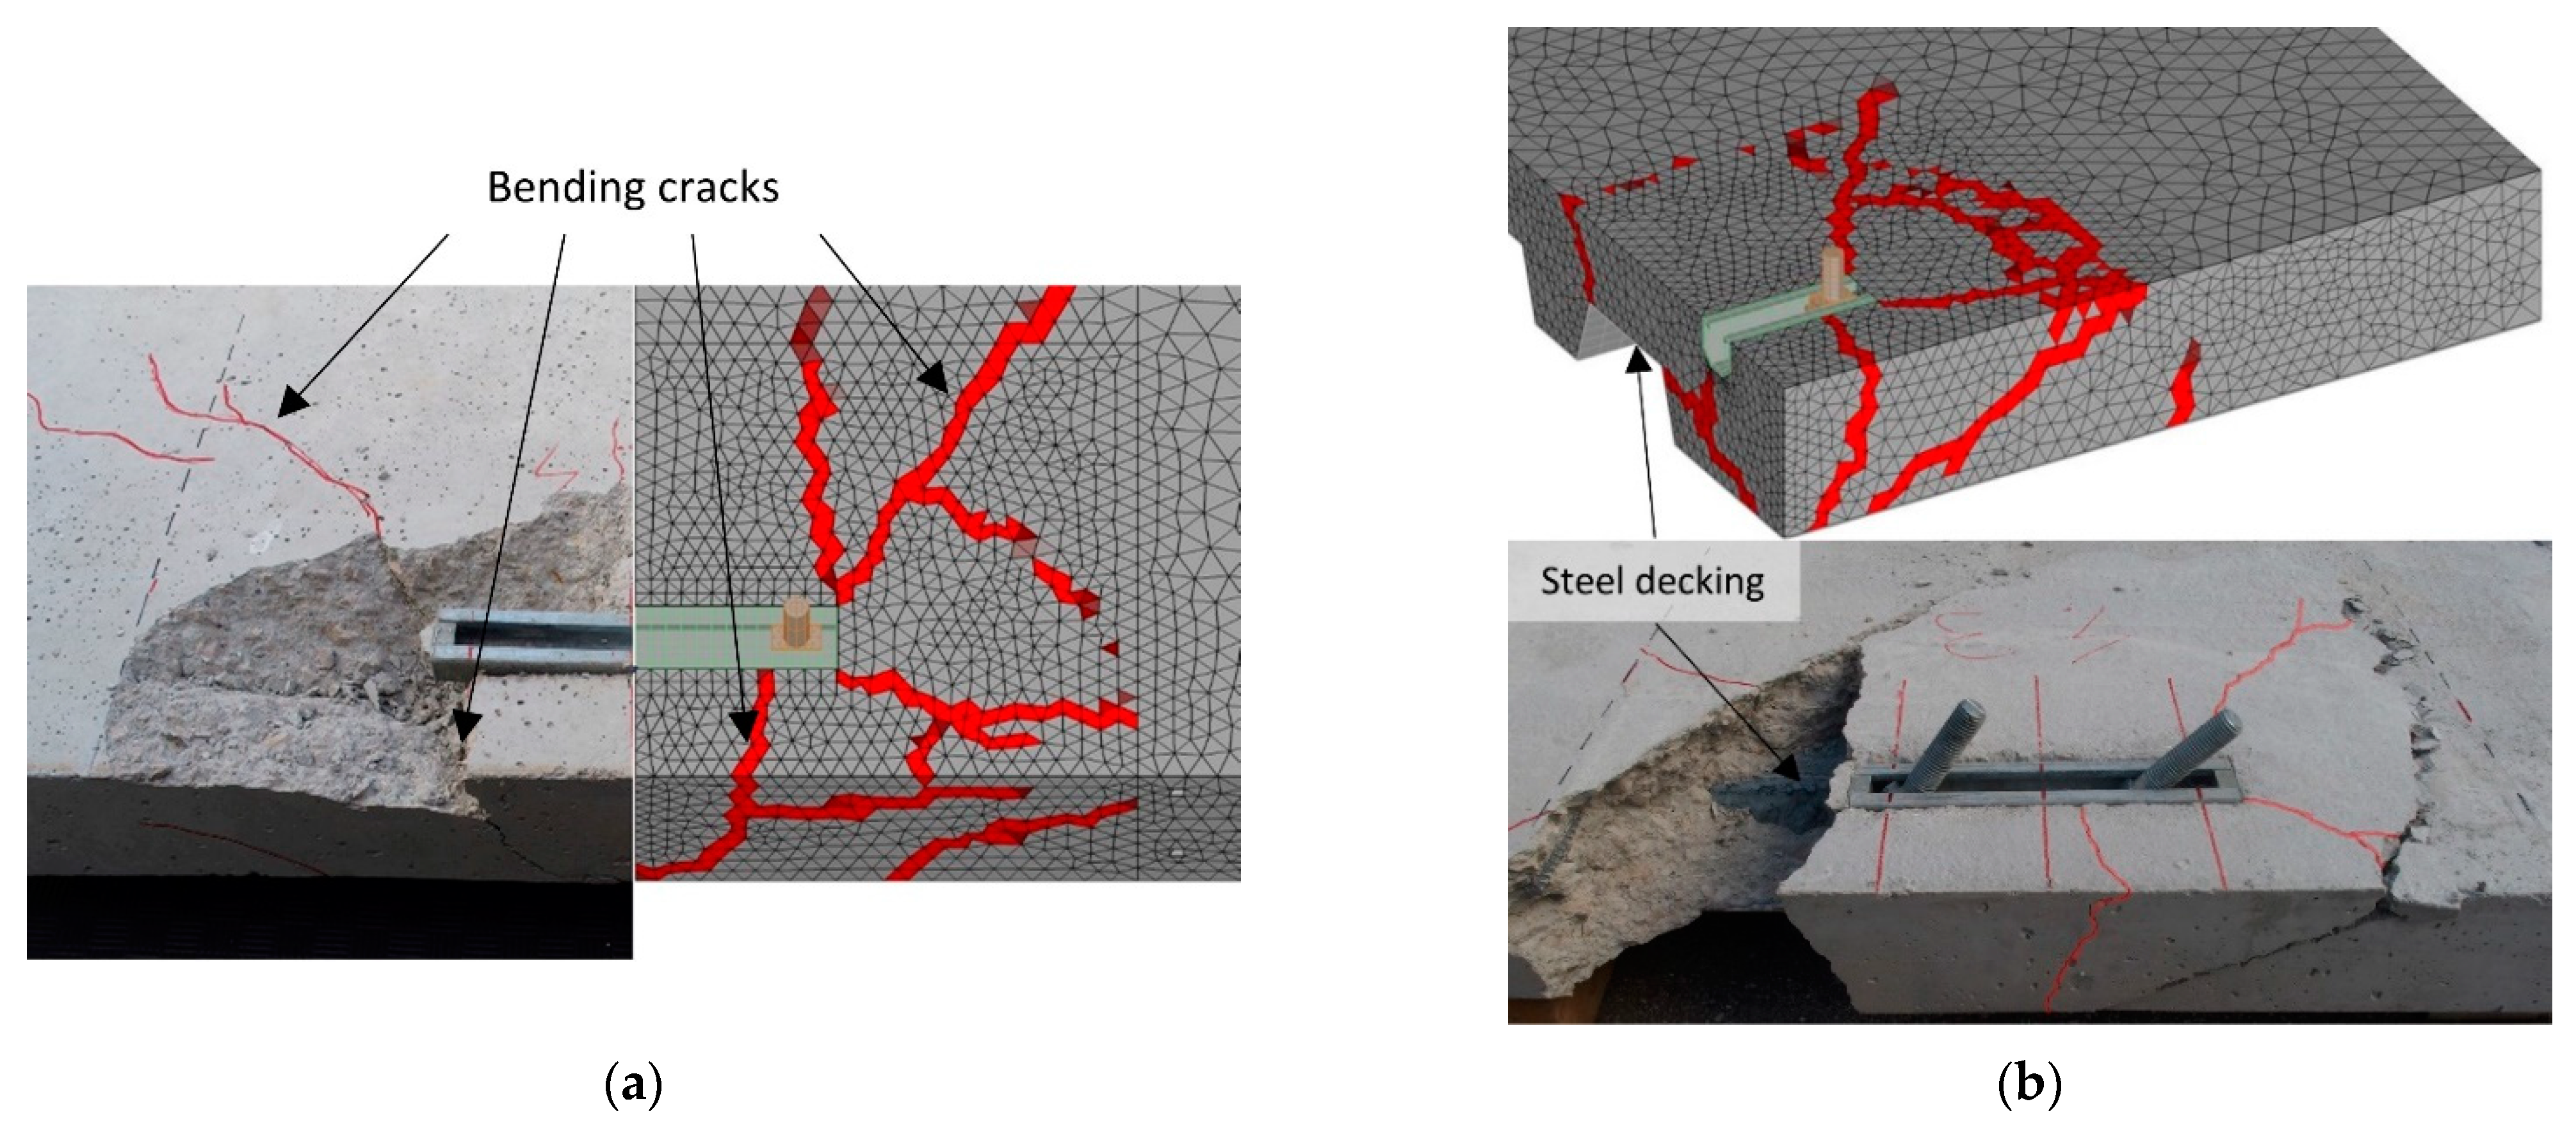
Table 3 shows a comparison between the experimentally obtained mean ultimate loads Nu,m and simulation results. The very small discrepancies (less than 6%) indicate that the numerical model is able to realistically predict the ultimate load. Moreover, the experimentally and numerically obtained crack patterns also have comparable shapes, as shown in Figure 3, both for the plain concrete slab and composite slab. The finite elements colored in red correspond to a crack width of approximately 0.1 mm or larger.
To further demonstrate the predictive ability of the numerical model, additional experiments were simulated, which are explained in detail in Section 6. The concrete mix presented in Table 2 was used and the obtained mean concrete compressive strength measured on 4 cores was fc,core = 29.14 N/mm2 (fc = 24.54 N/mm2) with CoV = 6.04. The concrete compressive strength was slightly lower due to the shorter time between casting and testing. Anchor channels equipped with short anchors were simulated in plain concrete slabs with different thicknesses. As shown in Table 4, the numerical model is quite accurate in terms of peak loads, although the result for very thin members (h = 70 mm) is overestimated by 9%. This can be attributed to the large scatter in the experimental results, which is not surprising for such a shallow embedment depth and member thickness [10].
Numerically and experimentally obtained load-displacement curves are plotted in Figure 4. The numerical results replicate the experimental results reasonably well, although a slightly stiffer response can be observed. This effect is already known in the literature [21] and was explained by the nonlocal effects, e.g., local crushing of concrete around the anchor head, that cannot be properly accounted for in macroscopic analyses. However, this discrepancy is not of great importance to the outcome of the investigation. In general, the behavior of anchor channels in thin slabs is strongly influenced by bending. A significant change in stiffness can be observed on the load-displacement curves. This change corresponds to the formation of bending cracks prior to the ultimate load at the positions indicated in Figure 3a. It occurs when the load introduced by the anchor exceeds the bending capacity of the slab.
3.2. Definition of the Support and Boundary Conditions
In the numerical parametric study, a slightly different FE model was used, i.e., the boundary conditions were defined so that the model replicates a typical slab for a real-word application, which has significantly larger dimensions than the experimental samples. The edges of the slab were fixed at a certain distance from the anchor (Figure 5a). Since bending has a significant effect on the results, the distance between the anchor and the vertical support might affect the behavior and results. However, as shown in Figure 5b for two embedment depths, the influence of support spans is not pronounced for distances 2–4 times the embedment depth. For larger values, the bending capacity of the slab is reached before anchorage failure, whereas for smaller values, the formation of the full breakout body is restricted. Double symmetry was utilized for the in-field simulations.
4. Numerical Parametric Study
The main parameters considered in the parametric study were the member thickness, edge distance and anchor spacing. The simulation program was therefore divided into three parts, each focusing on one of these parameters. In all simulations, a medium size anchor channel that is commonly specified for curtain wall applications is used, namely the Hilti HAC-50. This channel has nearly identical geometry to the HAC-60 (further details can be found in [18]). It is equipped with two anchors in the model with varying embedment depths and anchor spacings for the different configurations.
The first part of the program is the one related to the influence of the member thickness. Anchor channels with four embedment depths ranging from hef = 60 mm to hef = 175 mm were investigated in plain concrete slabs with different thicknesses. The anchor spacing s = 250 mm was kept constant and in the vast majority of simulations the anchor channel was installed at the edge distance c1 = 100 mm, which is a common distance in curtain wall applications. To understand the cross correlation with the edge distance, the influence of member thickness was investigated at an additional edge distance c1 = 200 mm and embedment depth hef = 100 mm. Table 5 shows the summary of all the performed simulations.
In the second part of the program, the influence of edge distance was investigated for three embedment depths hef = 60, 100 and 175 mm (see Table 6), at a constant anchor spacing of s = 250 mm. For each embedment depth, two or three different slab thicknesses and several different ratios of edge distance to effective embedment depth c1/hef were simulated. As a reference, in-field simulations without the influence of an edge were also performed.
Regarding the third part of the simulation program, the anchor spacing varied from s = 100 mm to s = 300 mm, considering different embedment depths. However, for the smallest embedment depth, the anchor spacing was increased to s = 840 mm, which is much larger than the maximum allowable spacing for common anchor channel systems. This large spacing is simulated to get a clear picture of the characteristic spacing and its behavior as a function of member thickness. A summary of the third part of the simulation program is given in Table 7.
In the numerical parametric study, the uniaxial cylinder compressive strength fc = 20 N/mm2 was selected, whereas other macroscopic properties of concrete were defined in accordance with the CEB FIP Model Code 90 [20]: uniaxial tensile strength ft = 1.57 N/mm2, fracture energy GF = 50 J/m2, Young’s modulus Ec = 27,100 N/mm2, and Poisson’s ratio νc = 0.18. Since this research is focused on the concrete failure modes, steel was assumed to be linear elastic, with the same parameters as introduced in Section 3.1. The influence of slab or hanger reinforcement was not studied in detail in this research.
5. Numerical Results and Evaluation
5.1. Influence of Member Thickness
The numerical results shown in Figure 6a for the edge distance c1 = 100 mm indicate that as the relative member thickness h/hef decreases, the concrete tensile capacity also decreases. Loads introduced to concrete members by fasteners can cause larger bending stresses in thin concrete members. This generally affects the concrete splitting resistance and load-bearing behavior. Conversely, the larger the embedment depth, the smaller the characteristic value of the ratio h/hef at which the influence of member thickness is not relevant anymore. This observation would be in contrast with the Hüer’s finding that the characteristic member thickness should be hcr,cb = 2.25hef [6]. A possible reason for this difference could be the limited number of investigated configurations in his work. The current factor Ψh,sp = (h/hef)2/3 (Equation (5)) of EN 1992-4 is also represented in Figure 6a with the dashed curves. It could be observed that the factor provides a reasonable estimate for the influence of the member thickness. Note that, in Figure 6a, the ratio h/hef (and not h/hmin) has been selected as the parameter for the horizontal axis. Since hef is a physical dimension and is not selected arbitrarily by the manufacturer similar to hmin, it more convenient for comparison purposes.
The numerical results for the edge distances c1 = 100 mm and c1 = 200 mm are shown in Figure 6b (only for hef = 100 mm). The capacities without the influence of member thickness were obtained for similar h/hef ratios for both investigated edge distances. Moreover, the dashed lines in Figure 6b also show a comparison with the modification factors from the literature [5,6,8] that are introduced in Table 1. In all the available design proposals, the exponent related to the ratio h/hef and the characteristic member thickness indicates the dependence of the ultimate capacity on the slab thickness. The range in which the influence of member thickness becomes relevant is relatively narrow (1.0 < h/hef < 2.0) and the choice of the appropriate exponent is not of the utmost importance. The choice of the characteristic member thickness appears to be more relevant. While the exponent of 0.5 proposed by Asmus [5] seems to provide a good shape for the modification factor, the characteristic member thickness (see Table 1) seems to be too large (especially for the larger edge distances). This leads to relative capacities that differ greatly from the numerical results. In contrast, Hüer [6] proposes an exponent of 1/3 and Nilforoush [8] introduces an exponent of 0.25 for the in-field installation. These two proposed exponents are slightly smaller than the exponents obtained by fitting the numerical results (0.42 and 0.45—black lines), but they seem to provide a better estimate due to the smaller characteristic thickness.
To conclude, the influence of the member thickness varied between several authors, but the reason for this discrepancy could possibly lie in the range of the h/hef ratios investigated and the boundary conditions selected. In general, as mentioned above, the current modification factor of EN 1992-4 is sufficiently accurate and its exponent, which is the largest of all the exponents considered, ensures that the member thickness will have a strong influence on the results.
5.2. Influence of Edge Distance
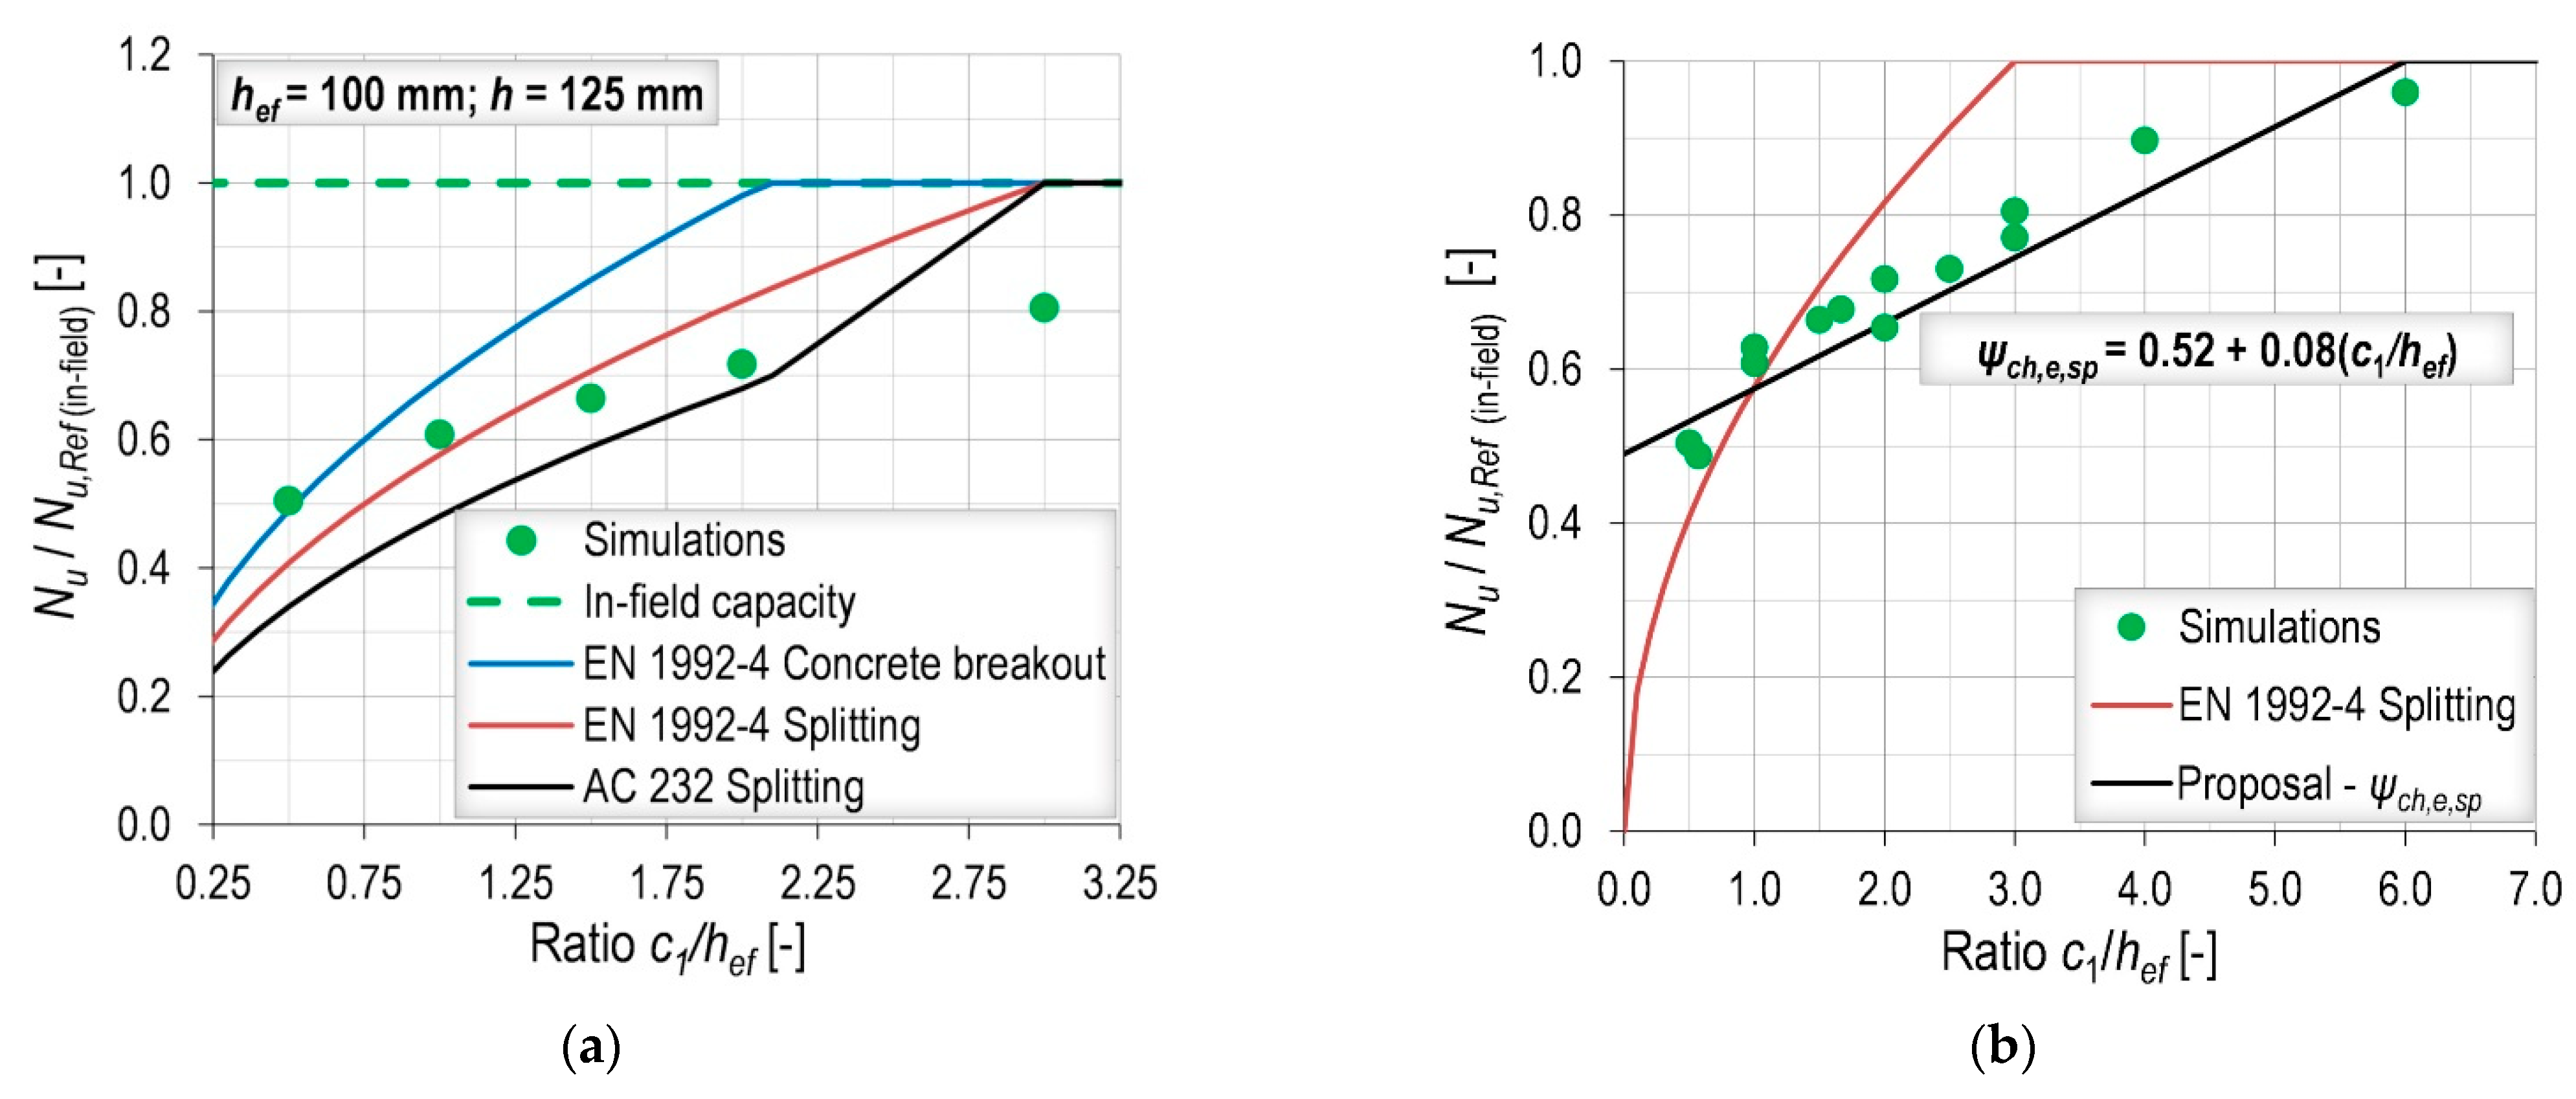
While the influence of edge distance has been extensively studied for the concrete breakout failure mode, experimental and numerical investigations are lacking for concrete splitting. Currently, the characteristic edge distance is set to 3hef in both the USA and Europe. However, the numerical results showed that this distance can be larger than the value recommended in the code for cases with thin members. As an example, it can be observed in Figure 7a, that for the embedment depth hef = 100 mm and member thickness h = 125 mm, only 80% of the in-field value was obtained for the edge distance of 3hef. Figure 7a also shows curves representing the expected reduction in concrete capacity from calculations performed according to EN 1992-4 and AC232. Comparing the curves, we see that the reduction in capacity due to decreases in the relative edge c1/hef is less pronounced in the simulations than the current code provisions. In other words, the simulations show larger capacities than those calculated for small edge distances and smaller capacities for larger edge distances.
Considering all of the simulation results for small h/hef ratios, it was found that the influence of the edge distance can be well approximated by a linear function of the relative edge distance c1/hef (Figure 7b). This linear function becomes equal to one for c1 = 6hef, which is twice the value of the current characteristic edge distance in the code. The function does not reduce to zero for the theoretical edge distance c1 equal to zero. This is considered acceptable because very small edge distances (c1 < 40 mm) are excluded due to the qualification procedure and the concrete breakout verification becomes decisive as the edge distance decreases.
5.3. Influence of Anchor Spacing
Similar to the influence of edge distance, the numerical results for thin members showed that the characteristic anchor spacing scr,sp should be larger than the current value of EN 1992-4 which is currently defined as the double of the characteristic edge distance (scr,sp = 2ccr,sp). As shown in Figure 8a for the member thickness h = 75 mm, the influence of anchor spacing was not relevant for s/c1 ratios greater than 12, i.e., the results for s = 12hef and s = 14hef are almost at the same level. Moreover, the results obtained for member thickness h = 125 mm in Figure 8b (green and orange data points) showed that the curve representing the influence of the anchor spacing on splitting, according to EN 1992-4, should have a smaller inclination. Knowing that the minimum value of the factor Ψch,s,N is 0.5 for a theoretical anchor spacing equal to zero, such an inclination can be achieved only by increasing the characteristic anchor spacing. Therefore, it is proposed to increase the characteristic anchor spacing scr,sp = 2ccr,sp = 12hef, which is consistent with the definition of EN 1992-4 and with the proposal for the characteristic edge distance. The expected Nu/Nu,ref ratios are reported with the dashed curves in Figure 8a,b. A further increase in the slab thickness to h = 200 mm (black points in Figure 8b) leads to conditions in which the splitting failure is no longer decisive and the concrete breakout equation (EN 1992-4) is able to correctly estimate the obtained failure loads.
5.4. Modifications of the Current Design Model for Concrete Splitting of EN 1992-4
To summarize, it is recommended to improve the splitting verification of the current model of EN 1992-4 (Equation (2)) with the following modifications.
In the modification factor to account for the influence of the member thickness, the hmin should be replaced by hef:
The embedment depth, being a physical quantity, is a more convenient choice, and is not dependent on the manufacturer’s preference.
For the influence of edge distance, the existing exponential function (Equation (4)) should be replaced by a linear function:
As mentioned previously, according to this equation the characteristic edge distance is set to ccr,sp = 6hef, although this is not explicitly stated. Moreover, according to the obtained results, the characteristic anchor spacing should also be increased, and in order to be consistent with the characteristic edge distance, the following value is proposed:
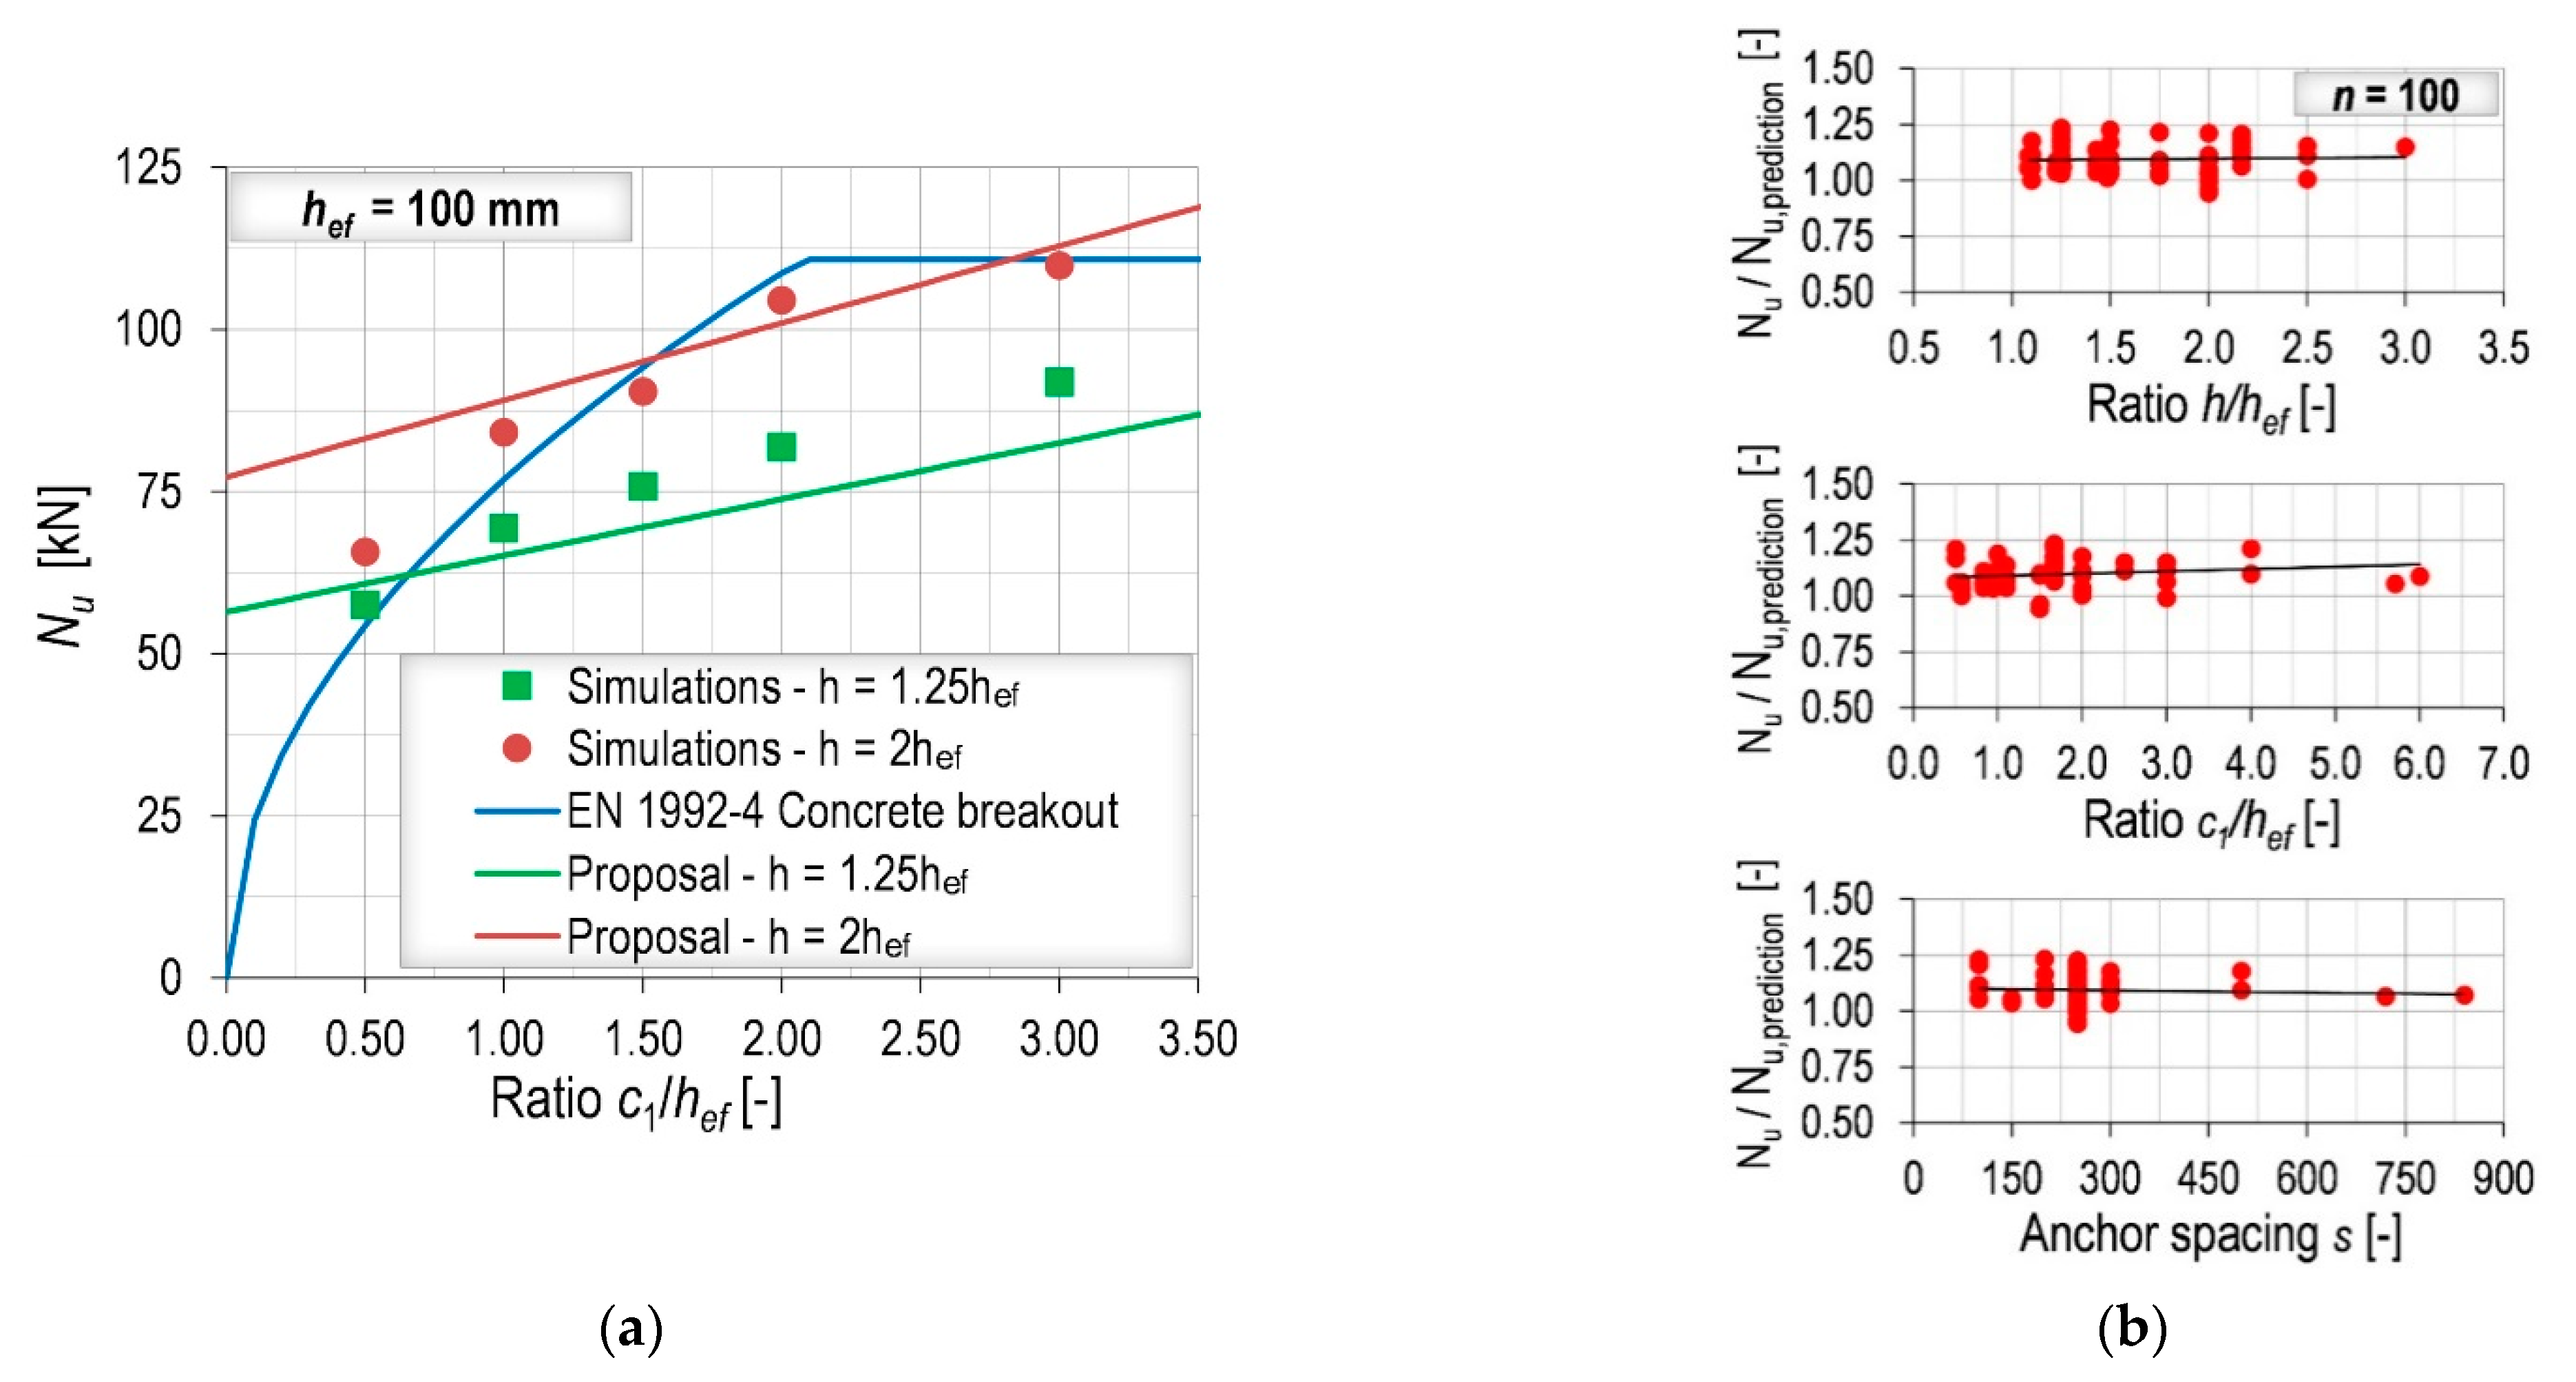
To illustrate how this proposal performs for different configurations, an example is given in Figure 9a for the embedment depth hef = 100 mm. The numerically obtained points for the different edge distances and the two thicknesses (h = 125 mm and h = 200 mm) are compared with the current model for concrete breakout and with the new design proposal for splitting. As can be seen, the linear function that takes into account the influence of the edge distance accurately predicts the numerical results, while the modification factor for the influence of member thickness allows the linear function to move upward. It is worth noting that the greater the member thickness, the narrower the range in which concrete splitting is the decisive failure mode.
These modifications also require an adjustment of the constant pre-factor of the basic capacity N0Rk to ensure optimal agreement between the results (numerical and experimental) and the proposed model for concrete splitting. Therefore, a factor of 1.15 is introduced in Equation (2) to increase the basic capacity and allow the model to be more predictable:
Without this factor, the model predictions, i.e., the calculated concrete splitting resistances, would be on the safe side. A comparison of all numerical results (100 simulations) with the modified design proposal shows excellent predictability with a mean of 1.09 and a standard deviation of 6%. It should be noted that the mean value is slightly higher than 1.0 to ensure that for any case the simulation results do not fall short of the predicted values
A comparison of all numerical results (100 simulations) with the modified design proposal shows excellent predictive ability with a mean of 1.09 and a standard deviation of 6%. Figure 9b shows all of the simulation results in relation to the three investigated parameters. The fact that the results do not show any particular trend with respect to the investigated parameters proves the reliability of the proposed method. The basic concrete breakout capacity N0Rk,c was considered as the basic characteristic resistance for splitting N0Rk (Equation (3)), because the governing failure mode in all simulations was concrete breakout. The summary of all numerical results can be found in Appendix A. For the short anchors (hef = 60 mm), the basic characteristic concrete breakout resistance was calculated following the proposal of Grosser et al. [9].
6. Experimental Results
Due to the actual trend towards thinner concrete members and to check the validity of the simulations for thicknesses that were not already investigated in the literature, anchor channels (Section 3.1) equipped with short anchors (hef = 65 mm) were tested. This embedment depth is currently not covered by the code as hch/hef > 0.4 and/or bch/hef > 0.7. The experimental program was aimed at investigating the influence of member thickness, both for anchor channels with and without edge influence, and the influence of edge distance. The tests were carried out under the same conditions explained in Section 3.1 and the ultimate loads were normalized to the cylinder concrete compressive strength of fc = 20 N/mm2.
The results for anchor channels tested without edge influence are shown in Table 8. The tests showed an increase in concrete breakout capacity with the increase in slab thickness. Even though the current design model of EN 1992-4 does not consider the influence of member thickness, calculating the concrete capacity for shallow embedment depths still leads to a very conservative estimation of the capacity. Indeed, the calculated capacity Nu,code is 24.47 kN, which was calculated with the reduced hef of 30 mm, is far below the average failure loads Nu,m between 40.5 kN and 57.4 kN for the slab thicknesses between 70 mm and 130 mm. In order to calculate the capacity more accurately, the proposal of Grosser et al. [9] for the αch,N can be considered. With this modification, a capacity Nu,Grosser of 50.37 kN is obtained, which more accurately predicts the failure loads of the experiments. In general, since the experimental results show that the influence of the member thickness cannot be neglected, this should be taken into account in the design.
Additionally, the expected reductions according to the proposal of Nilforoush [8] ((h/2hef)0.25) are reported in the last column of Table 8. These reductions vary between 0.86 and 1.00 for the slab thicknesses between 70 and 130 mm and therefore are not sufficient to properly represent the experimentally obtained reductions Nu,m/Nu,m,Ref. The reason why the proposal of Nilforoush [8] is not capable of predicting the reductions may be attributed to a larger minimum investigated h/hef ratio of 1.5, beside the fact that a different fastening system was investigated (headed studs).
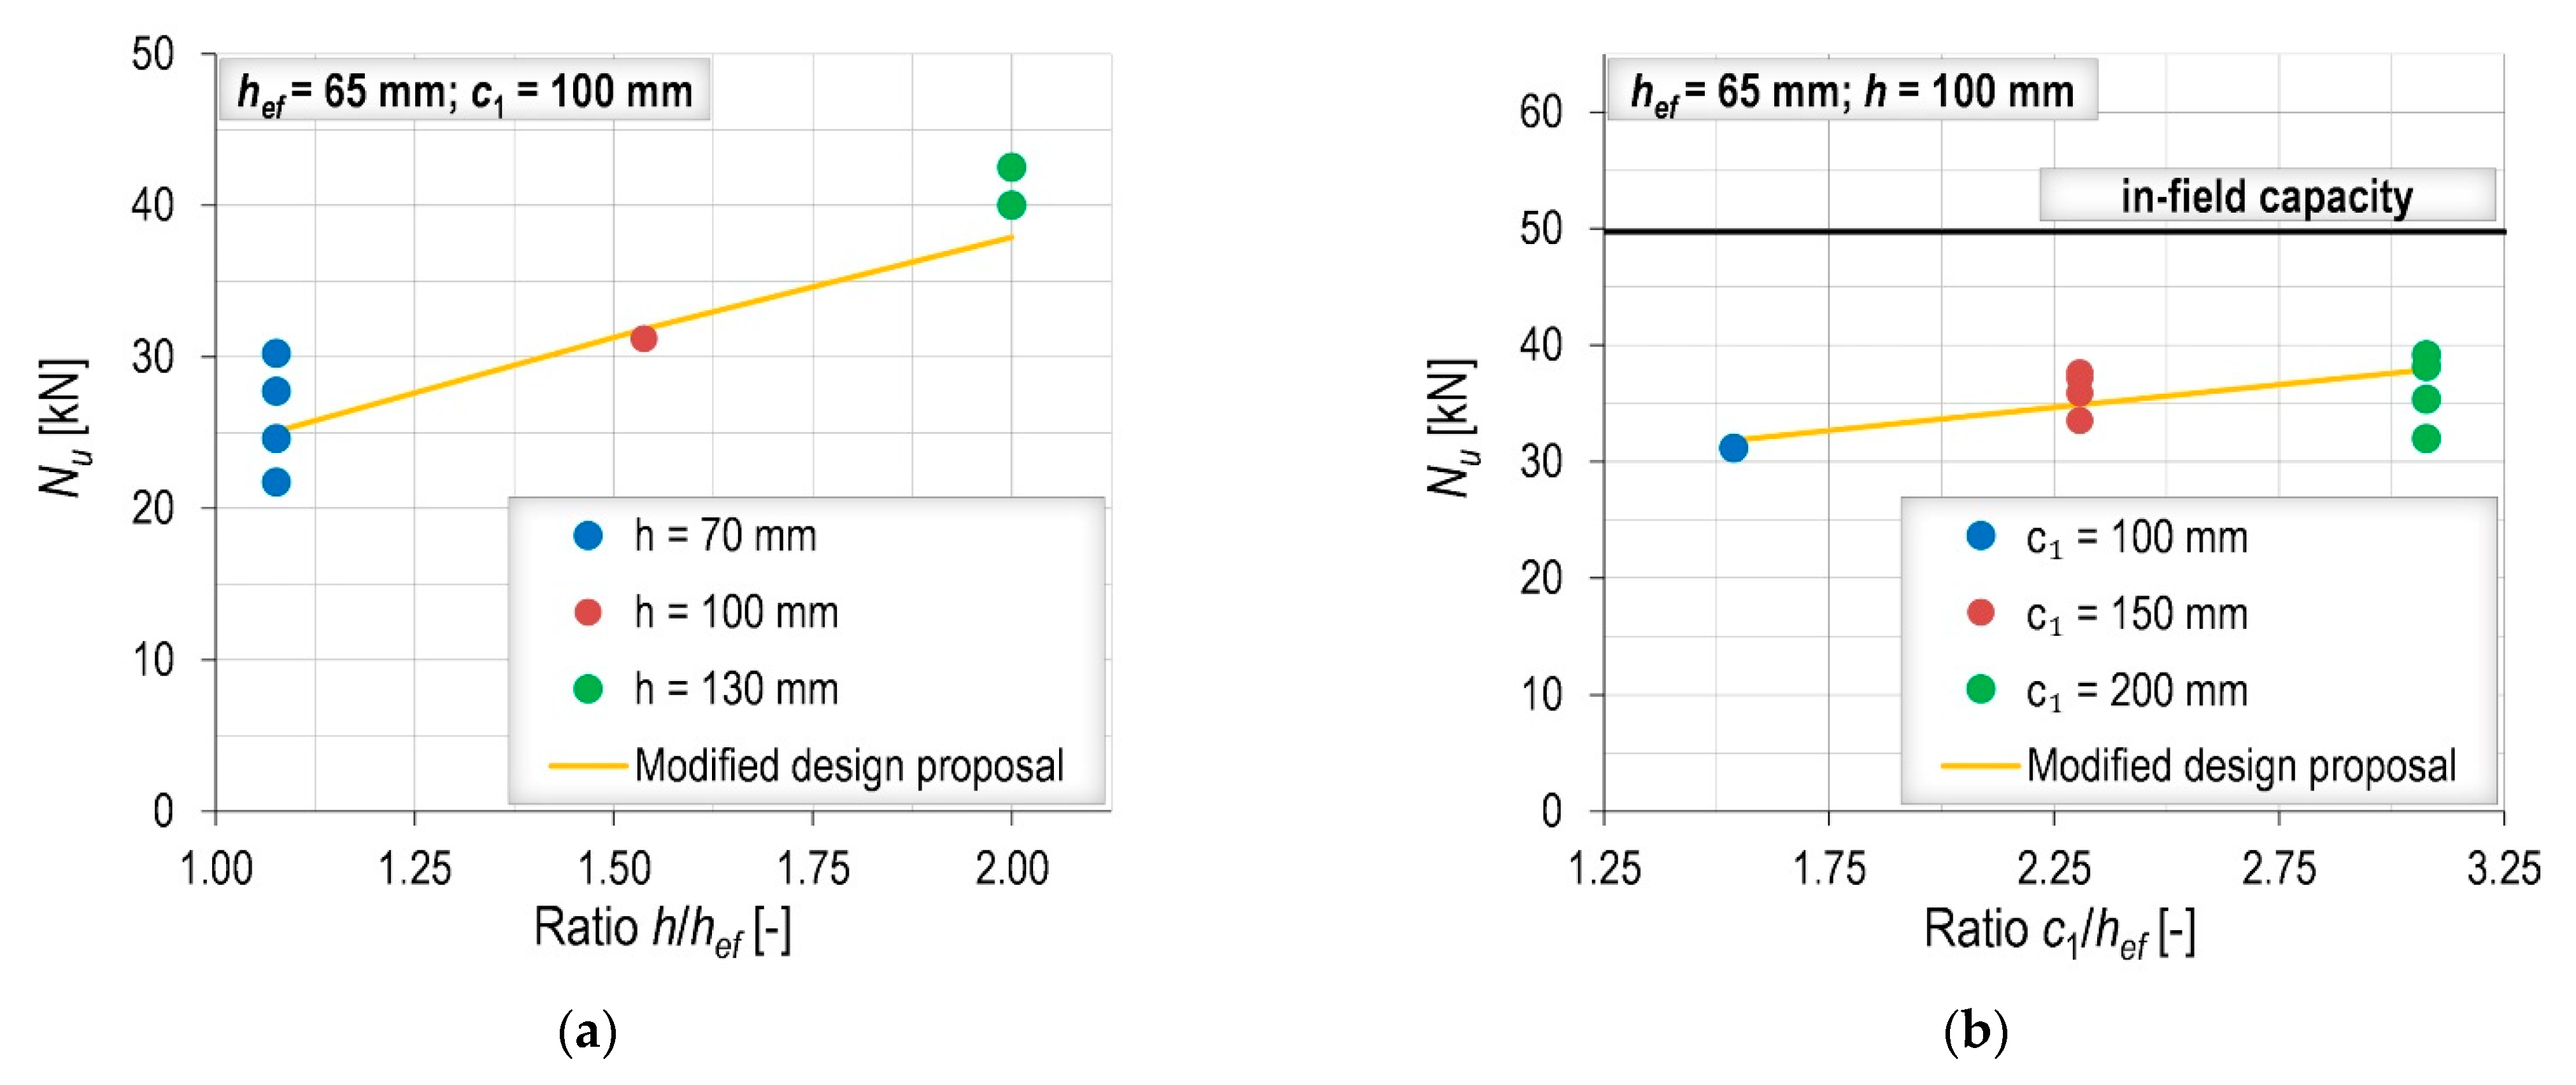
The test results for anchor channels installed close to the edge are summarized in Table 9. The influence of member thickness was investigated for the same three thicknesses (h = 70, 100, 130 mm). Due to a problem with the acquisition system, only 1 and 2 results are respectively available slab thickness of h = 100 mm and h = 130 mm. Considering the design proposed in Section 5 and calculating the concrete capacity Nu,proposal for the tested configurations, the experimental results accurately estimated by the modified design model for concrete splitting (Figure 10a) with ratios Nu,m/Nu,proposal between 0.98 and 1.09. In this case, too, the basic capacity was calculated with the factor αch,N according to the proposal introduced by Grosser et al. [9], and the modification factors proposed in the previous section are applied.
Two configurations with larger edge distances (c1 = 150 and c1 = 200 mm) were also tested to check how the edge distance affects the results and further validate the design proposal for splitting. Also in these cases, the proposed design model was able to accurately estimate the obtained experimental results, as shown in Figure 10b (with Nu,m/Nu,proposal ratios between 0.95 and 1.04.). Additionally, it is worth noting that, for the ratio c1/hef = 3 (c1 = 200 mm), the ultimate load was only 73% of the in-field capacity, which shows the correct formulation of the proposed characteristic edge distance. The breakout patterns for the in-field and near the edge installations are shown in Figure 11. When installed in-field, a typical cone-shaped pattern is formed. Simulations also show that before formation of the cone, bending cracks appear in the slab. On the other hand, installation near the edge leads to the typical splitting failure, i.e., cracking and separation of the concrete in front of the channel for the full slab thickness, which is again preceded by bending cracks.
7. Conclusions
In the present work, anchor channels subjected to tension loads were investigated. The focus was set on thin concrete members and shallow embedment depths. Due to the different design rules in the USA and Europe and the limited number of investigations, the focus was placed on the splitting failure mode, which is more likely for anchor channels placed closer to the edge in thin members. Based on the numerical and experimental results, the following can be concluded:
- The 3D FE code employed in the numerical investigation, which is based on the microplane model for concrete, the smeared crack approach and the crack band regularization method, was able to replicate the experimentally obtained ultimate capacities and failure modes. However, the load-bearing behavior in numerical simulations was stiffer than in experiments resulting in smaller displacements at the ultimate capacity. The possible reason could be the local crushing of concrete around the anchor head that cannot be properly accounted for in macroscopic analyses.
- The influence of member thickness should be considered in the design model for concrete splitting. It was found that the existing factor of EN 1992-4 is relatively accurate at predicting the influence of member thickness. An improvement for the modification factor to take the slab thickness into account is proposed. The value hmin (chosen by the manufacturer for qualification testing) should be replaced by the embedment depth hef (physical dimension) together with a different calibrating factor of 1.15. The experimental results also showed that the influence of member thickness is present for anchor channels without edge influence, which is consistent with the findings of Nilforoush [8] for headed studs, although with slightly different results.
- Currently, the characteristic edge distance for splitting is set to ccr,sp = 3hef. According to the numerical and experimental results, a larger value is required to attain the capacity without edge influence, especially when the concrete member is relatively thin. In addition, it was found that the influence of edge distance can be well approximated by a linear function that yields to the limit value for c1 = 6hef.
- The numerical results indicated that the proportion between the characteristic edge distance and characteristic anchor spacing should be scr,sp = 2ccr,sp = 12hef.
- The doubling of the critical edge and spacing distances may seem excessive but, together with the other proposed modifications, results in the splitting failure only being decisive for small slab thicknesses compared to the concrete breakout failure.
- The experimental results showed that the modified design model for splitting is able to accurately predict the tensile capacity of anchor channels in thin slabs. This is very important as a basis for future work on the design of anchor channels in composite slabs, where an additional reduction factor should be applied to account for complex geometry of the concrete above the metal deck.
- In the prospective harmonization of the US and European verifications, the authors recommend keeping the two verifications for splitting and concrete breakout separately as per EN 1992-4, accordingly modifying the splitting verification, as this approach was proven to provide an overall excellent accuracy.
Outlook
The challenges in defining an appropriate design method for anchor channels and, in general, for all fastening systems in thin concrete members are mainly due to the fact that the load introduced by the fastening system often causes substantial stresses in the concrete member. The authors see the need for further research on the following points:
- The influence of corners on the capacity of anchor channels in thin members should be clarified.
- The influence of reinforcement should be studied in detail since the presence of adequate reinforcement is considered to be a condition when the splitting verification can be omitted.
- Further numerical and experimental investigations for anchor channels without edge influence are required to determine how to consider the influence of member thickness in the verification for concrete breakout.
Author Contributions
Conceptualization, A.B., D.C. and J.O.; methodology, A.B., D.C. and J.O.; software, J.O.; validation, A.B.; formal analysis, A.B.; investigation, A.B., D.C. and J.O.; resources, A.B. and D.C.; data curation, A.B.; writing—original draft preparation, A.B.; writing—review and editing, D.C. and J.O.; visualization, A.B.; supervision, J.O.; project administration, D.C.; funding acquisition, D.C. and J.O. All authors have read and agreed to the published version of the manuscript.
Funding
This research was funded by HILTI AG, Principality of Liechtenstein.
Data Availability Statement
Data available within the article and from the corresponding author on request.
Acknowledgments
The authors are grateful to Hilti Corporation, 9494 Schaan, Principality of Liechtenstein, for financial support and especially to Philipp Grosser for valuable contribution. Thanks also to RI-ISA d.o.o, 51000 Rijeka, Croatia, a member of Permasteelisa Group, for sharing information about the challenges in the design of anchor channels in composite slabs and the relevant configurations for the real applications. The authors are thankful to GP Krk d.d. for the preparation of specimens and the lab technician Dominik Štrok for his help in the experimental part of the investigation. Testing equipment at the Faculty of Civil Engineering in Rijeka was purchased under the project Research Infrastructure for Campus-based Laboratories at the University of Rijeka, number RC.2.2.06-0001, which was co-funded from the European Fund for Regional Development (ERDF).
Conflicts of Interest
The authors declare no conflict of interest.
Appendix A

Table A1.
Numerical simulations—influence of member thickness.
| c1 [mm] | hef [mm] | h [mm] | s [mm] | Nu [kN] | Nu,CB1 [kN] | Nu,proposal2 [kN] | Nu/Nu,decisive3 [−] |
|---|---|---|---|---|---|---|---|
| 100 | 60 | 75 | 250 | 33.46 | 40.20 | 28.47 | 1.18 |
| 100 | 60 | 90 | 250 | 39.38 | 40.20 | 32.15 | 1.22 |
| 100 | 60 | 105 | 250 | 43.25 | 40.20 | 35.63 | 1.21 |
| 100 | 60 | 130 | 250 | 45.91 | 40.20 | 41.09 | 1.14 |
| 100 | 60 | 150 | 250 | 46.29 | 40.20 | 42.67 | 1.15 |
| 100 | 60 | 180 | 250 | 46.16 | 40.20 | 42.67 | 1.15 |
| 100 | 100 | 110 | 250 | 66.39 | 76.87 | 59.82 | 1.11 |
| 100 | 100 | 125 | 250 | 69.39 | 76.87 | 65.15 | 1.07 |
| 100 | 100 | 150 | 250 | 77.51 | 76.87 | 73.56 | 1.05 |
| 100 | 100 | 175 | 250 | 82.40 | 76.87 | 81.53 | 1.07 |
| 100 | 100 | 200 | 250 | 84.09 | 76.87 | 89.12 | 1.09 |
| 100 | 100 | 250 | 250 | 85.26 | 76.87 | 93.03 | 1.11 |
| 200 | 100 | 110 | 250 | 79.71 | 108.72 | 67.80 | 1.18 |
| 200 | 100 | 125 | 250 | 81.87 | 108.72 | 73.83 | 1.11 |
| 200 | 100 | 150 | 250 | 90.93 | 108.72 | 83.37 | 1.09 |
| 200 | 100 | 175 | 250 | 94.40 | 108.72 | 92.40 | 1.02 |
| 200 | 100 | 200 | 250 | 104.47 | 108.72 | 101.00 | 1.03 |
| 200 | 100 | 250 | 250 | 105.80 | 108.72 | 105.43 | 1.00 |
| 100 | 120 | 130 | 250 | 80.20 | 93.66 | 76.13 | 1.05 |
| 100 | 120 | 150 | 250 | 86.72 | 93.66 | 83.75 | 1.04 |
| 100 | 120 | 180 | 250 | 98.72 | 93.66 | 94.58 | 1.05 |
| 100 | 120 | 210 | 250 | 101.96 | 93.66 | 104.81 | 1.09 |
| 100 | 120 | 240 | 250 | 102.00 | 93.66 | 114.57 | 1.09 |
| 100 | 175 | 193 | 250 | 129.21 | 153.06 | 129.24 | 1.00 |
| 100 | 175 | 220 | 250 | 149.80 | 153.06 | 141.27 | 1.06 |
| 100 | 175 | 260 | 250 | 154.79 | 153.06 | 157.91 | 1.01 |
| 100 | 175 | 306 | 250 | 158.54 | 153.06 | 176.03 | 1.04 |
| 100 | 175 | 350 | 250 | 157.74 | 153.06 | 181.85 | 1.03 |
1 EN 1992-4—concrete breakout failure (αch,N according to Grosser et al. [9] for hef = 60 mm). 2 Modified design proposal for splitting failure mode. 3 Nu,decisive represents smaller of the two calculated capacities.
Table A2.
Numerical simulations—influence of edge distance.
| c1 [mm] | hef [mm] | h [mm] | s [mm] | Nu [kN] | Nu,CB1 [kN] | Nu,proposal2 [kN] | Nu/Nu,decisive3 [−] |
|---|---|---|---|---|---|---|---|
| 60 | 60 | 75 | 250 | 31.04 | 31.14 | 26.15 | 1.19 |
| 100 | 60 | 75 | 250 | 33.46 | 40.20 | 28.47 | 1.18 |
| 150 | 60 | 75 | 250 | 36.07 | 47.90 | 31.38 | 1.15 |
| 180 | 60 | 75 | 250 | 38.06 | 47.90 | 33.12 | 1.15 |
| 240 | 60 | 75 | 250 | 44.29 | 47.90 | 36.61 | 1.21 |
| 360 | 60 | 75 | 250 | 47.38 | 47.90 | 43.58 | 1.09 |
| ∞ | 60 | 75 | 250 | 49.37 | 47.90 | / | 1.03 |
| 60 | 60 | 130 | 250 | 36.85 | 31.14 | 37.73 | 1.18 |
| 100 | 60 | 130 | 250 | 45.91 | 40.20 | 41.09 | 1.14 |
| 150 | 60 | 130 | 250 | 50.33 | 47.90 | 45.28 | 1.11 |
| 180 | 60 | 130 | 250 | 50.78 | 47.90 | 47.79 | 1.06 |
| 240 | 60 | 130 | 250 | 52.53 | 47.90 | 52.82 | 1.10 |
| ∞ | 60 | 130 | 250 | 53.88 | 47.90 | / | 1.12 |
| 50 | 100 | 125 | 250 | 57.55 | 54.36 | 60.80 | 1.06 |
| 100 | 100 | 125 | 250 | 69.39 | 76.87 | 65.15 | 1.07 |
| 150 | 100 | 125 | 250 | 75.83 | 94.15 | 69.49 | 1.09 |
| 200 | 100 | 125 | 250 | 81.87 | 108.72 | 73.83 | 1.11 |
| 300 | 100 | 125 | 250 | 91.89 | 110.81 | 82.52 | 1.11 |
| ∞ | 100 | 125 | 250 | 114.12 | 110.81 | / | 1.03 |
| 50 | 100 | 150 | 250 | 63.43 | 54.36 | 68.66 | 1.17 |
| 100 | 100 | 150 | 250 | 77.51 | 76.87 | 73.56 | 1.05 |
| 150 | 100 | 150 | 250 | 86.29 | 94.15 | 78.47 | 1.10 |
| 200 | 100 | 150 | 250 | 90.93 | 108.72 | 83.37 | 1.09 |
| ∞ | 100 | 150 | 250 | 114.12 | 110.81 | / | 1.03 |
| 50 | 100 | 200 | 250 | 65.74 | 54.36 | 83.18 | 1.21 |
| 100 | 100 | 200 | 250 | 84.09 | 76.87 | 89.12 | 1.09 |
| 150 | 100 | 200 | 250 | 90.43 | 94.15 | 95.06 | 0.96 |
| 200 | 100 | 200 | 250 | 104.47 | 108.72 | 101.00 | 1.03 |
| 300 | 100 | 200 | 250 | 109.84 | 110.81 | 112.88 | 0.99 |
| ∞ | 100 | 200 | 250 | 123.06 | 110.81 | / | 1.11 |
| 100 | 175 | 193 | 250 | 129.21 | 153.06 | 129.24 | 1.00 |
| 350 | 175 | 193 | 250 | 173.13 | 250.95 | 155.34 | 1.11 |
| ∞ | 175 | 193 | 250 | 264.75 | 250.95 | / | 1.06 |
| 100 | 175 | 350 | 250 | 157.74 | 153.06 | 181.85 | 1.03 |
| 262 | 175 | 350 | 250 | 193.99 | 247.74 | 205.66 | 0.94 |
| ∞ | 175 | 350 | 250 | 255.28 | 250.95 | / | 1.02 |
1 EN 1992-4—concrete breakout failure (αch,N according to Grosser et al. [9] for hef = 60 mm). 2 Modified design proposal for splitting failure mode. 3 Nu,decisive represents smaller of the two calculated capacities.
Table A3.
Numerical simulations—influence of anchor spacing.
| c1 [mm] | hef [mm] | h [mm] | s [mm] | Nu [kN] | Nu,CB1
[kN] | Nu,proposal2 [kN] | Nu/Nu,decisive3 [−] |
|---|---|---|---|---|---|---|---|
| 100 | 60 | 75 | 100 | 29.72 | 27.51 | 24.17 | 1.23 |
| 100 | 60 | 75 | 200 | 33.20 | 36.06 | 26.95 | 1.23 |
| 100 | 60 | 75 | 250 | 33.46 | 40.20 | 28.47 | 1.18 |
| 100 | 60 | 75 | 300 | 35.34 | 41.86 | 30.09 | 1.17 |
| 100 | 60 | 75 | 500 | 40.66 | 41.86 | 37.21 | 1.09 |
| 100 | 60 | 75 | 720 | 44.56 | 41.86 | 43.49 | 1.06 |
| 100 | 60 | 75 | 840 | 44.83 | 41.86 | 43.49 | 1.07 |
| 100 | 60 | 130 | 100 | 33.20 | 27.51 | 34.88 | 1.21 |
| 100 | 60 | 130 | 200 | 41.98 | 36.06 | 38.89 | 1.16 |
| 100 | 60 | 130 | 250 | 45.91 | 40.20 | 41.09 | 1.14 |
| 100 | 60 | 130 | 300 | 47.17 | 41.86 | 43.41 | 1.13 |
| 100 | 60 | 130 | 500 | 49.29 | 41.86 | 53.69 | 1.18 |
| 100 | 100 | 125 | 100 | 64.63 | 57.89 | 59.13 | 1.12 |
| 100 | 100 | 125 | 200 | 66.53 | 70.04 | 63.06 | 1.05 |
| 100 | 100 | 125 | 250 | 69.39 | 76.87 | 65.15 | 1.07 |
| 100 | 100 | 125 | 300 | 72.72 | 83.90 | 67.31 | 1.08 |
| 100 | 100 | 200 | 100 | 60.90 | 57.89 | 80.89 | 1.05 |
| 100 | 100 | 200 | 200 | 77.84 | 70.04 | 86.27 | 1.11 |
| 100 | 100 | 200 | 250 | 84.09 | 76.87 | 89.12 | 1.09 |
| 100 | 100 | 200 | 300 | 92.13 | 83.90 | 92.08 | 1.10 |
| 200 | 100 | 125 | 100 | 73.66 | 81.88 | 67.02 | 1.10 |
| 200 | 100 | 125 | 200 | 78.37 | 99.05 | 71.47 | 1.10 |
| 200 | 100 | 125 | 250 | 81.87 | 108.72 | 73.83 | 1.11 |
| 200 | 100 | 125 | 300 | 83.40 | 118.66 | 76.29 | 1.09 |
| 100 | 91 | 130 | 150 | 59.34 | 57.32 | 58.43 | 1.04 |
| 100 | 91 | 130 | 200 | 64.51 | 63.43 | 60.55 | 1.07 |
| 100 | 91 | 130 | 250 | 67.98 | 69.95 | 62.76 | 1.08 |
| 100 | 91 | 130 | 300 | 73.96 | 76.52 | 65.06 | 1.14 |
| 100 | 106 | 130 | 150 | 68.21 | 68.09 | 65.51 | 1.04 |
| 100 | 106 | 130 | 200 | 73.19 | 74.65 | 67.53 | 1.08 |
| 100 | 106 | 130 | 250 | 73.45 | 81.70 | 69.63 | 1.05 |
| 100 | 106 | 130 | 300 | 74.28 | 89.01 | 71.81 | 1.03 |
| 100 | 120 | 130 | 150 | 76.13 | 79.01 | 72.15 | 1.06 |
| 100 | 120 | 130 | 200 | 78.46 | 86.06 | 74.11 | 1.06 |
| 100 | 120 | 130 | 250 | 80.20 | 93.66 | 76.13 | 1.05 |
| 100 | 120 | 130 | 300 | 86.79 | 101.64 | 78.22 | 1.11 |
1 EN 1992-4—concrete breakout failure (αch,N according to Grosser et al. [9] for hef = 60 mm). 2 Modified design proposal for splitting failure mode. 3 Nu,decisive represents smaller of the two calculated capacities.
References
- ACI 318. Building Code Requirements for Structural Concrete (ACI 318-14) and Commentary (ACI 318R-14); American Concrete Institute: Farmington Hills, MI, USA, 2014. [Google Scholar]
- AC232. Acceptance Criteria for Anchor Channels in Concrete Elements; ICC-ES: Whittier, CA, USA, 2019. [Google Scholar]
- EN 1992-4. Eurocode 2—Design of Concrete Structures—Part 4: Design of Fastenings for Use in Concrete (EN 1992-4:2018); European Committee for Standardization (CEN): Brussels, Belgium, 2018. [Google Scholar]
- Asmus, J. Bemessung von Zugbeanspruchten Befestigungen bei der Versagensart Spalten des Betons (Design of Tension Loaded Anchorages for the Splitting Failure Mode). Ph.D. Thesis, University of Stuttgart, Stuttgart, Germany, 1999. (In German). [Google Scholar]
- Asmus, J.; Eligehausen, R. Design Method for Splitting Failure Mode of Fastenings. In Proceedings of the 2nd International Symposium on Connections between Steel and Concrete, Stuttgart, Germany, 4–7 September 2007. [Google Scholar]
- Hüer, T. Tragverhalten von Randnahen Zugbeanspruchten Befestigungen bei der Versagensart “Spalten des Betons” (Behavior of Tension Loaded Fasteners near the Edge for the Concrete Splitting Failure Mode). Ph.D. Thesis, University of Stuttgart, Stuttgart, Germany, 2014. (In German). [Google Scholar]
- Fuchs, W.; Eligehausen, R.; Breen, J.E. Concrete capacity design (CCD) approach for fastenings to concrete. ACI Struct. J. 1995, 2, 73–94. [Google Scholar]
- Nilforoush, R. Numerical and Experimental Evaluations of Load-Carrying Capacity of Cast-in-Place Headed Anchors and Post-Installed Adhesive Anchors. Ph.D. Thesis, University of Lulea, Lulea, Sweden, 2017. [Google Scholar]
- Grosser, R.; Dimitrova, T.; Winkler, B. Anchor channels with short embedment depth used in composite slab construction. In Proceedings of the 3rd International Symposium on Connections between Steel and Concrete, Stuttgart, Germany, 27–29 September 2017. [Google Scholar]
- Mahrenholtz, C.; Sharma, A. Load Capacity of Shallow Embedded Anchor Channels. CivilEng 2020, 1, 243–252. [Google Scholar] [CrossRef]
- EAD 330008-03-0601. Anchor Channels, European Assessment Document; OJEU 2018/C; EOTA: Brussels, Belgium, 2018. [Google Scholar]
- Ožbolt, J.; Li, Y.; Kožar, I. Microplane model for concrete with relaxed kinematic constraints. Int. J. Solids Struct. 2001, 38, 2683–2711. [Google Scholar] [CrossRef]
- Bažant, Z.P.; Oh, B. Crack band theory for fracture of concrete. Mater. Struct. 1983, 16, 155–177. [Google Scholar] [CrossRef] [Green Version]
- Ožbolt, J.; Gambarelli, S. Microplane model with relaxed kinematic constraint in the framework of micro polar Cosserat continuum. Eng. Fract. Mech. 2018, 199, 476–488. [Google Scholar] [CrossRef]
- Jirásek, M.; Bauer, M. Numerical aspects of the crack band approach. Comput. Struct. 2012, 110, 60–78. [Google Scholar] [CrossRef]
- Bogdanić, A.; Casucci, D.; Ožbolt, J. Numerical and Experimental Investigation of Anchor Channels Subjected to Shear Load in Composite Slabs with Profiled Steel Decking. Eng. Struct. 2021, 240, 112347. [Google Scholar] [CrossRef]
- FEMAP®; Version 11.2.2; Siemens PLM Software: Plano, TX, USA, 2015.
- ETA-11/0006. Hilti Anchor Channels (HAC) with Channel Bolts (HBC); DIBt: Berlin, Germany, 2016. [Google Scholar]
- Fichtner, S. Implementierung Einer Kontaktschicht Mit Reibeigenschaften für Kleine Verformungen in das Programm MASA; Prüfbericht Nr. HT 141/01-04/8; Institute of Construction Materials, University of Stuttgart: Stuttgart, Germany, 2005. [Google Scholar]
- CEB-FIP Model Code 1990. Comité Euro-International du Béton and Fédération Internationale de la Précontrainte; Tomas Telford: London, UK, 1993. [Google Scholar]
- Jebara, K.; Ožbolt, J.; Hoffman, J. Pryout failure of single headed stud anchor: 3D numerical FE analysis. Mater. Struct. 2016, 49, 4551–4563. [Google Scholar] [CrossRef]
Figure 1.
(a) Reinforcement arrangement—2 tension and 2 shear tests per slab; (b) Experimental setup.
Figure 1.
(a) Reinforcement arrangement—2 tension and 2 shear tests per slab; (b) Experimental setup.
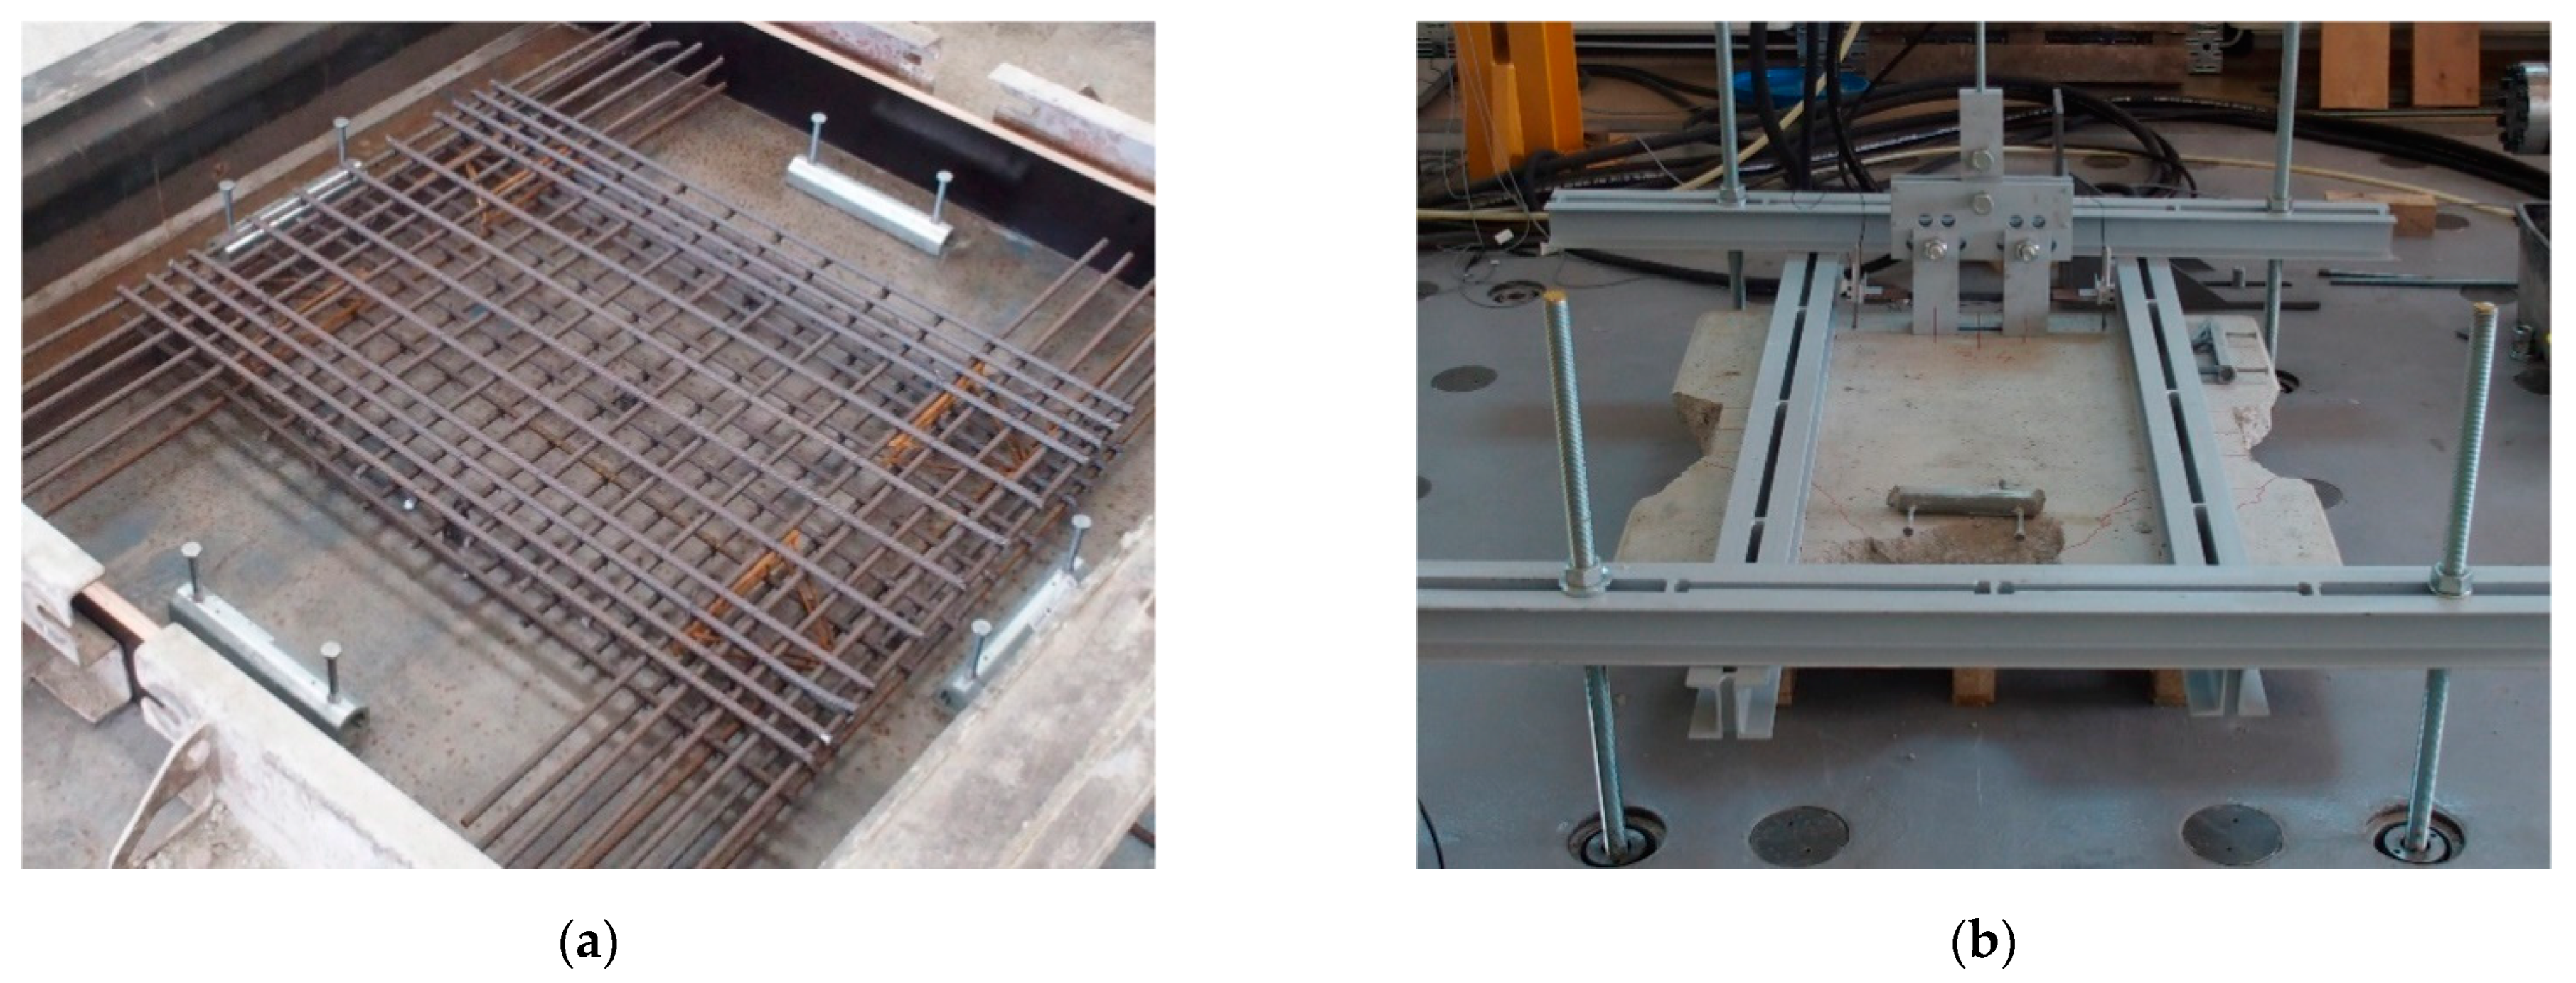
Figure 2.
(a) FE discretization: 1—concrete slab, 2—anchor, 3—channel, 4—T-bolt with nut, 5—steel plate, 6—anchor interface, 7—channel interface, 8—T-bolt interface, 9—teflon sheet; (b) FE model and boundary conditions.
Figure 2.
(a) FE discretization: 1—concrete slab, 2—anchor, 3—channel, 4—T-bolt with nut, 5—steel plate, 6—anchor interface, 7—channel interface, 8—T-bolt interface, 9—teflon sheet; (b) FE model and boundary conditions.

Figure 3.
Comparison between experimental and numerical breakout patterns for: (a) plain concrete slab; (b) composite slab.
Figure 3.
Comparison between experimental and numerical breakout patterns for: (a) plain concrete slab; (b) composite slab.

Figure 4.
Comparison between experimental and numerical LD curves obtained for: (a) member thickness h = 70 mm; (b) member thickness h = 130 mm.
Figure 4.
Comparison between experimental and numerical LD curves obtained for: (a) member thickness h = 70 mm; (b) member thickness h = 130 mm.

Figure 5.
(a) FE model used in the numerical parametric study; (b) Influence of support span.

Figure 6.
Influence of member thickness: (a) relative capacities for different embedment depths; (b) relative capacities compared to the existing design models in the literature.
Figure 6.
Influence of member thickness: (a) relative capacities for different embedment depths; (b) relative capacities compared to the existing design models in the literature.
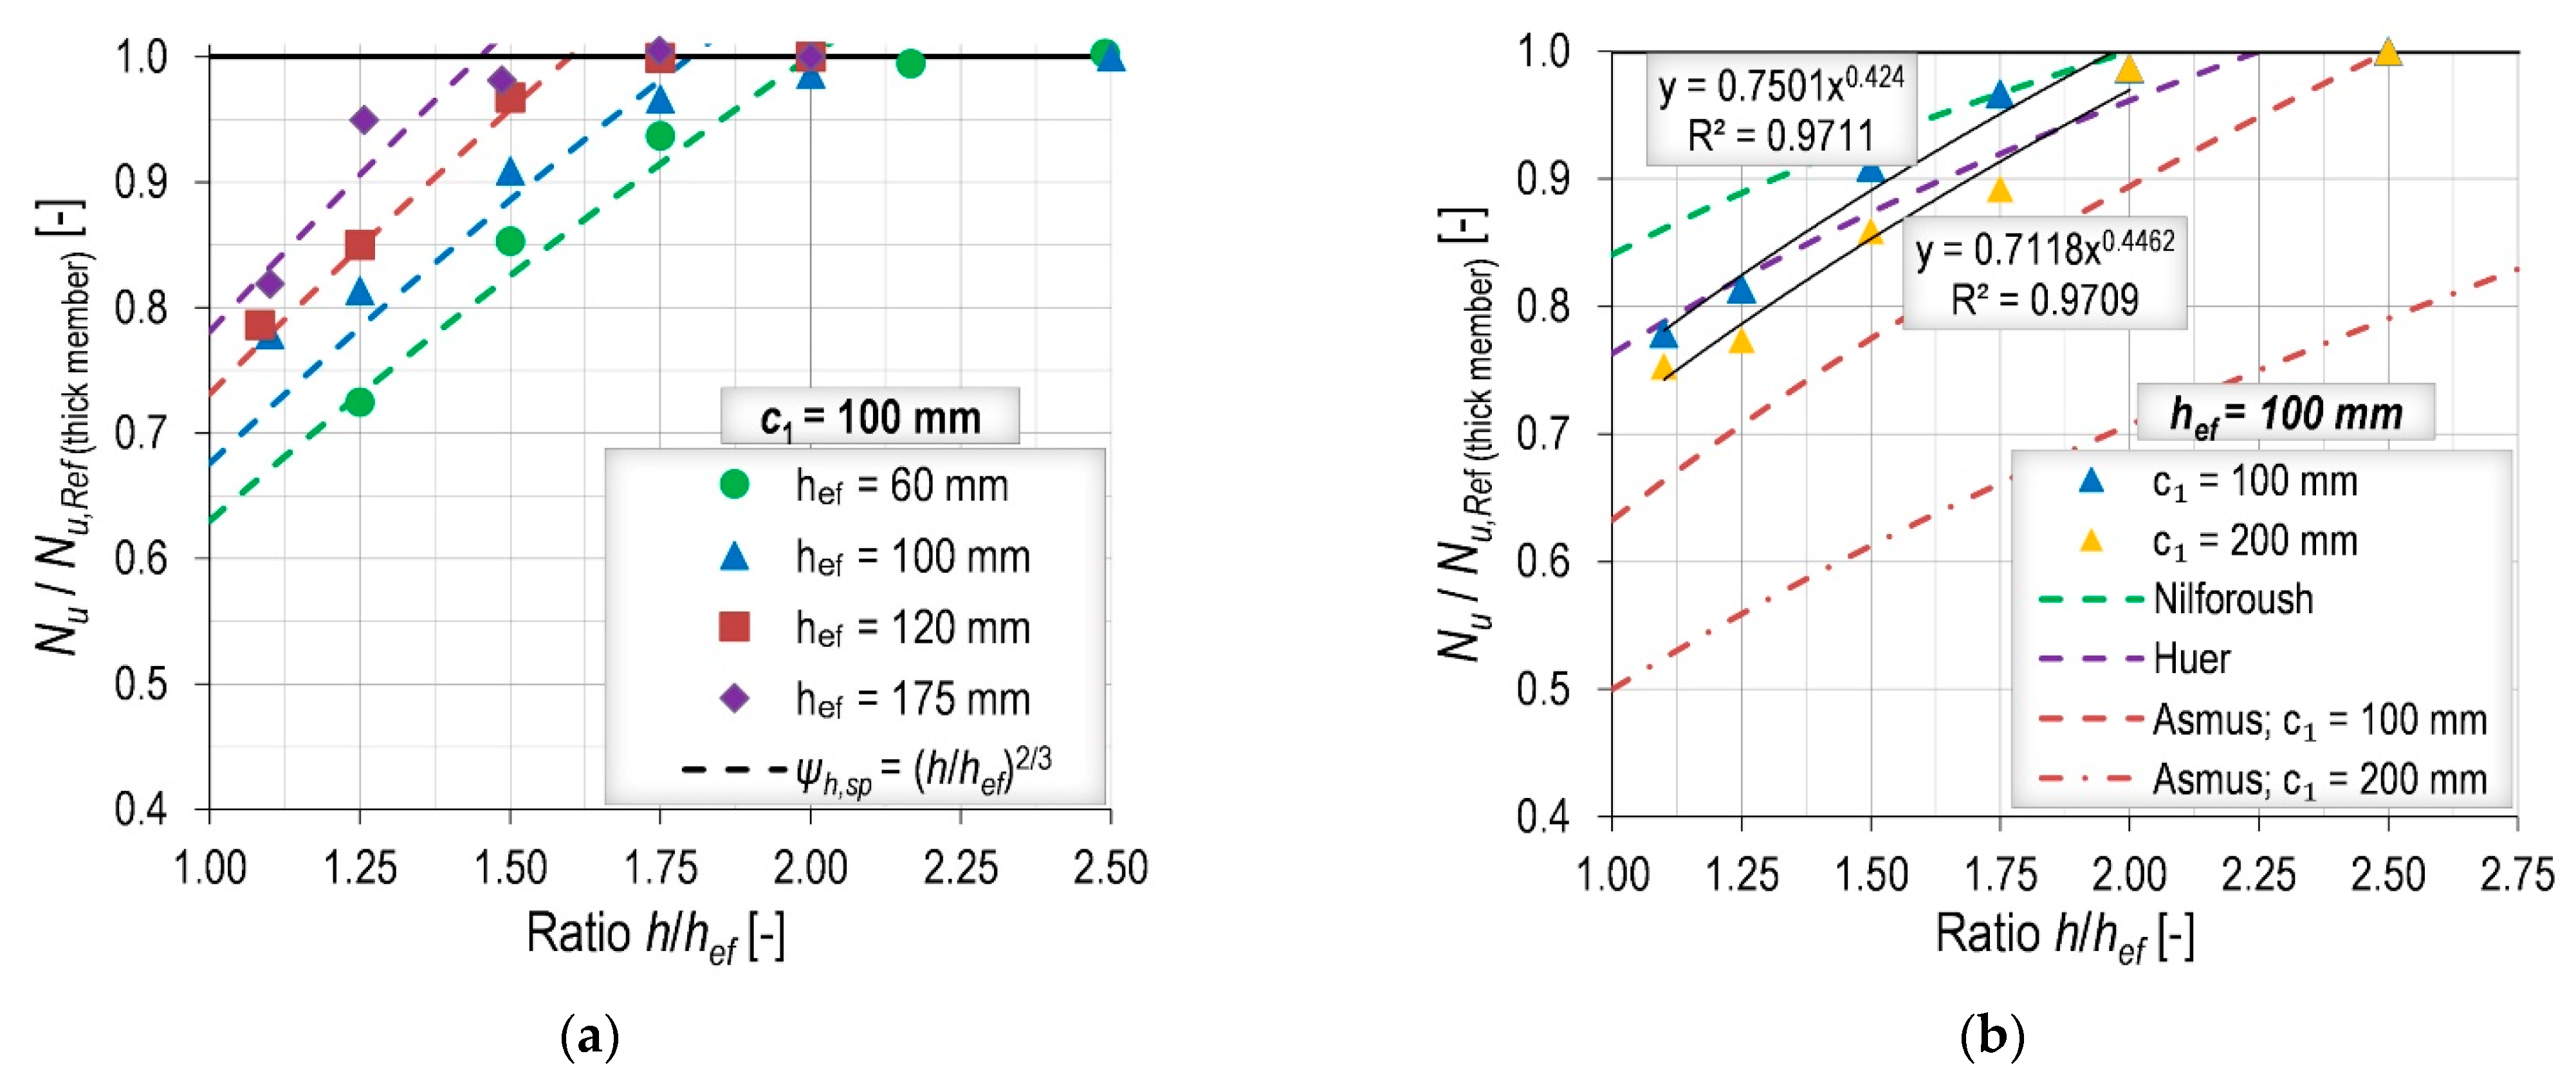
Figure 7.
Influence of edge distance: (a) numerical results compared to the current code provisions; (b) numerical results for different embedment depths and small h/hef ratios described by a linear function.
Figure 7.
Influence of edge distance: (a) numerical results compared to the current code provisions; (b) numerical results for different embedment depths and small h/hef ratios described by a linear function.

Figure 8.
Influence of anchor spacing-numerical results compared to the current code provisions for: (a) shallow embedment depth—scr,N is calculated for actual hef; (b) typical embedment depth.
Figure 8.
Influence of anchor spacing-numerical results compared to the current code provisions for: (a) shallow embedment depth—scr,N is calculated for actual hef; (b) typical embedment depth.
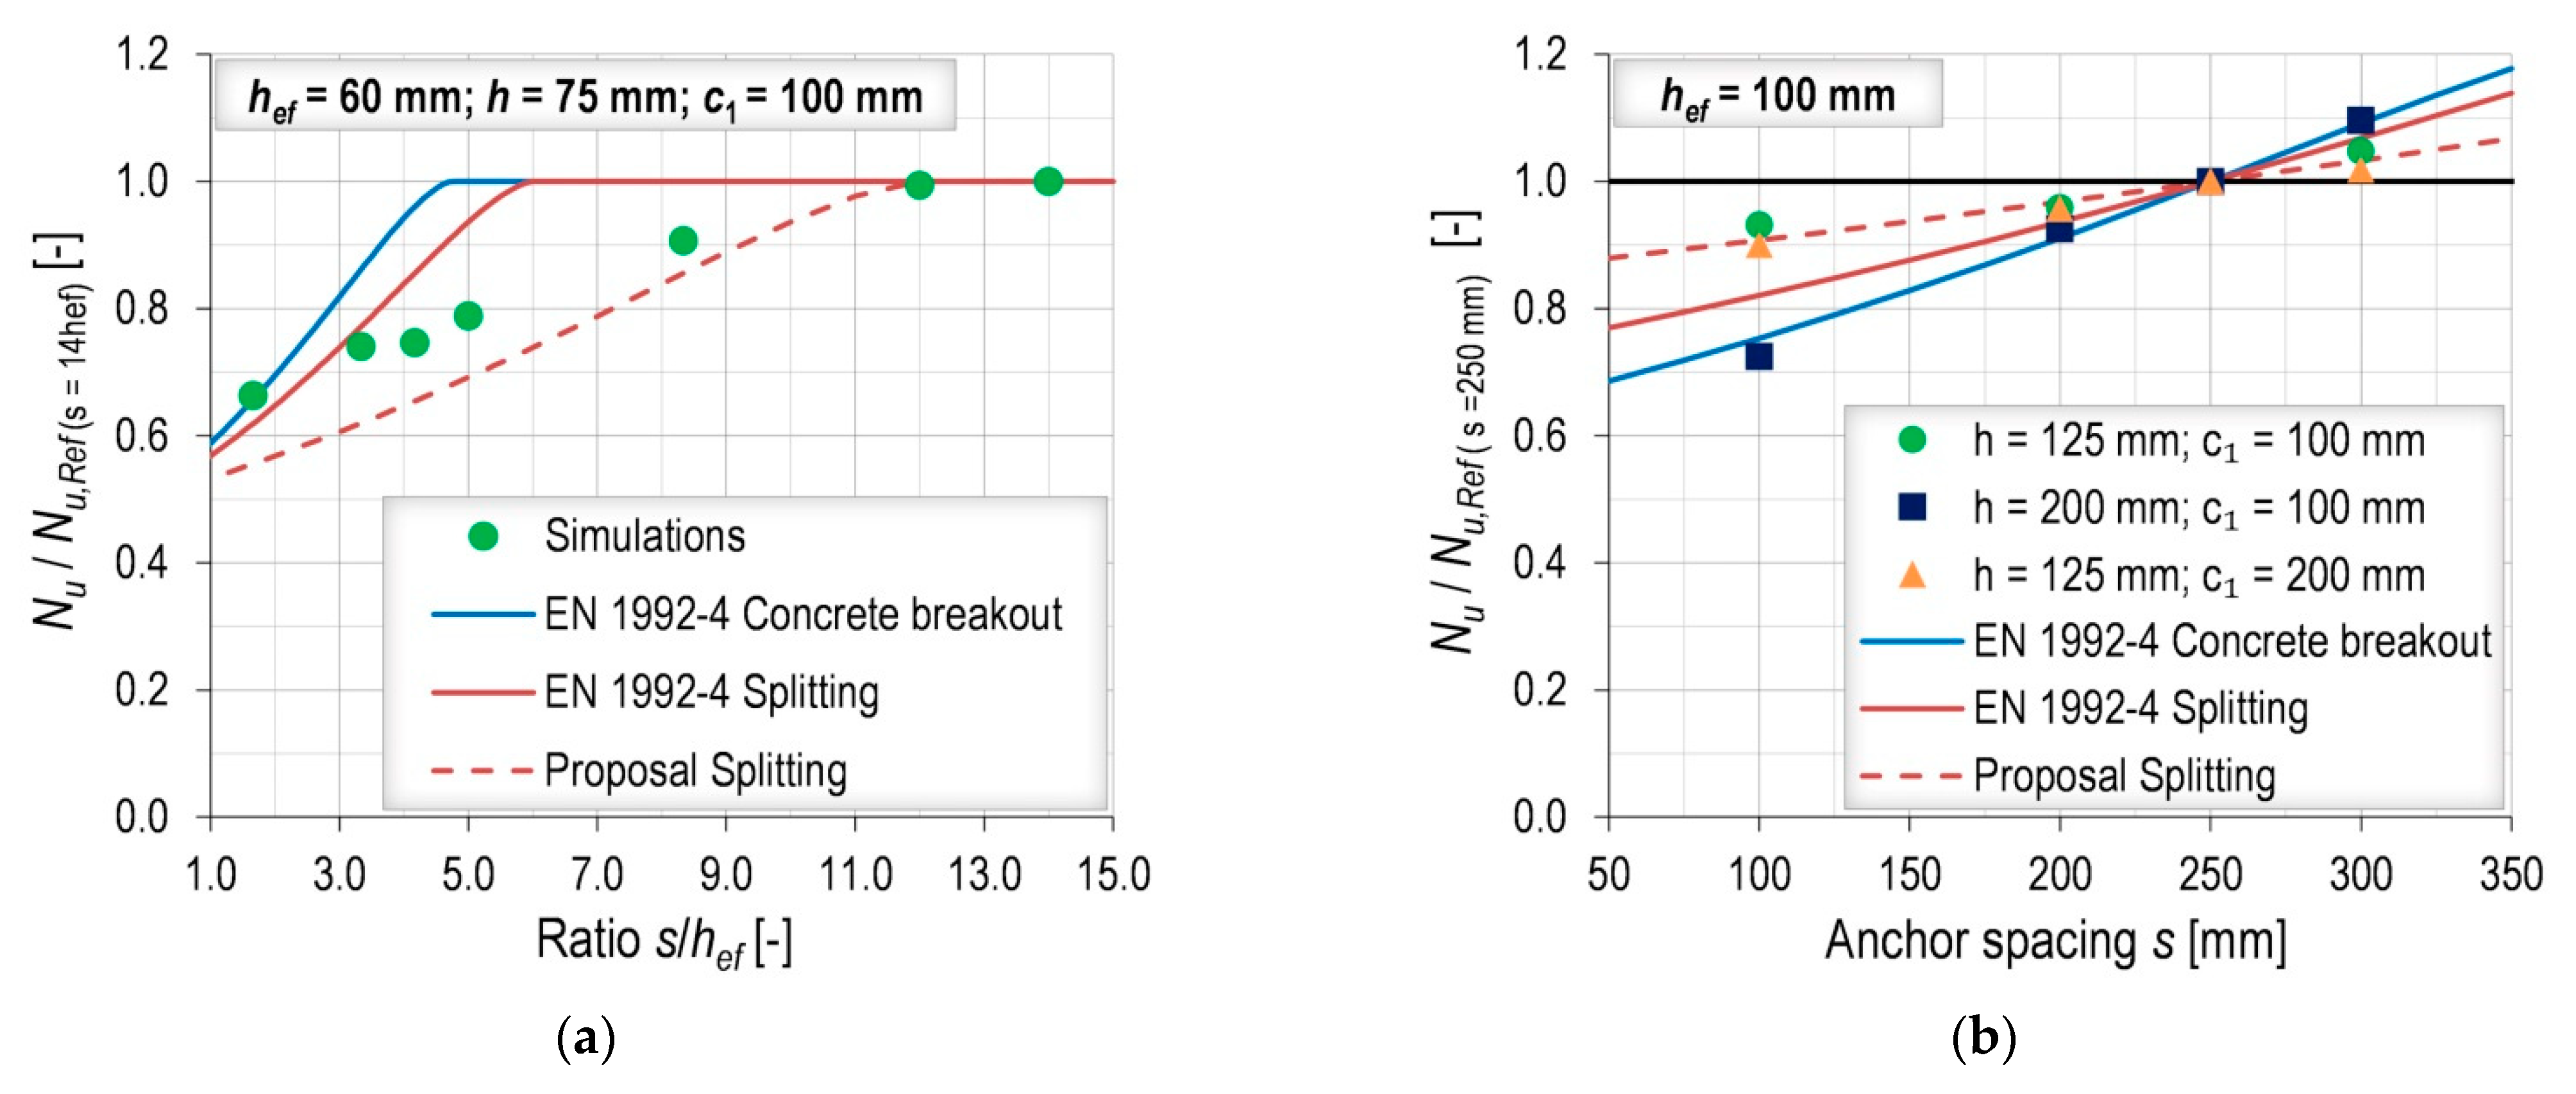
Figure 9.
(a) Illustration of the principle of the modified design proposal; (b) Numerical results compared to the modified design proposal as a function of investigated parameters.
Figure 9.
(a) Illustration of the principle of the modified design proposal; (b) Numerical results compared to the modified design proposal as a function of investigated parameters.

Figure 10.
Experimental results: (a) influence of member thickness; (b) influence of edge distance.

Figure 11.
Breakout patterns: (a) in-field installation—h = 100 mm; (b) installation near the edge—c1 = 150 mm.
Figure 11.
Breakout patterns: (a) in-field installation—h = 100 mm; (b) installation near the edge—c1 = 150 mm.

Table 1.
Comparison between modification factors for the influence of member thickness that can be found in the literature [5,6,8].
| Author | Characteristic Member Thickness | Modification Factor |
|---|---|---|
| Asmus | ||
| Hüer | ||
| Nilforoush | 1 |
1 Not provided explicitly, calculated from a limit of 1.2.
Table 2.
Concrete mix design.
| Strength Class | CEM II/B-M (S-LL) 42.5 N [kg/m3] | Aggregate (Dmax = 16 mm) [kg/m3] | Water [kg/m3] |
|---|---|---|---|
| C16/20 | 290 | 1870 | 208 (w/c = 0.72) |
Table 3.
Comparison between experimental and numerical results—4 tests were performed for each configuration.
Table 3.
Comparison between experimental and numerical results—4 tests were performed for each configuration.
| Slab Type | c1 [mm] | hef [mm] | h [mm] | Nu,m [kN] | σ [kN] | CoV [%] | Nu,sim [kN] | Nu,sim/Nu,m [−] |
|---|---|---|---|---|---|---|---|---|
| plain | 100 | 106 | 130 | 79.00 | 0.90 | 1.14 | 74.48 | 0.94 |
| composite | 100 | 106 | 130 | 52.22 | 2.95 | 5.66 | 51.08 | 0.98 |
Table 4.
Comparison between experimental and numerical results—plain concrete slabs.
| c1 [mm] | hef [mm] | h [mm] | Nu,m [kN] | n [−] | σ [kN] | CoV [%] | Nu,sim [kN] | Nu,sim/Nu,m [−] |
|---|---|---|---|---|---|---|---|---|
| 100 | 65 | 70 | 28.89 | 4 | 4.10 | 14.20 | 31.46 | 1.09 |
| 100 | 65 | 130 | 45.72 | 2 | 1.97 | 4.31 | 45.16 | 0.99 |
Table 5.
Simulation program—influence of member thickness.
| c1 [mm] | hef [mm] | h/hef [−] |
|---|---|---|
| 100 | 100, 120, 175 | 1.10 |
| 100 | 60, 100, 120, 175 | 1.25 |
| 100 | 60, 100, 120, 175 | 1.50 |
| 100 | 60, 100, 120, 175 | 1.75 |
| 100 | 60, 100, 120, 175 | 2.00 |
| 100 | 60, 100 | 2.50 |
| 100 | 60 | 3.00 |
| 200 | 100 | 1.10–2.50 |
Table 6.
Simulation program—influence of edge distance.
| c1/hef [−] | hef [mm] | h [mm] |
|---|---|---|
| 1.00, 1.67, 2.50, 3.00, 4.00, 6.00, in-field | 60 | 75 |
| 1.00, 1.67, 2.50, 3.00, 4.00, in-field | 60 | 130 |
| 0.50, 1.00, 1.50, 2.00, 3.00, in-field | 100 | 125 |
| 0.50, 1.00, 1.50, 2.00, in-field | 100 | 150 |
| 0.50, 1.00, 1.50, 2.00, 3.00, in-field | 100 | 200 |
| 0.50, 2.00, in-field | 175 | 193 |
| 0.50, 1.50, in-field | 175 | 350 |
Table 7.
Simulation program—influence of anchor spacing.
| s [mm] | c1 [mm] | hef [mm] | h [mm] |
|---|---|---|---|
| 150, 200, 250, 300 | 100 | 91 | 130 |
| 150, 200, 250, 300 | 100 | 106 | 130 |
| 150, 200, 250, 300 | 100 | 120 | 130 |
| 100, 200, 250, 300, 500, 720, 840 | 100 | 60 | 75 |
| 100, 200, 250, 300, 500 | 100 | 60 | 130 |
| 100, 200, 250, 300 | 100 | 100 | 125 |
| 100, 200, 250, 300 | 100 | 100 | 200 |
| 100, 200, 250, 300 | 200 | 100 | 125 |
Table 8.
Experimental results—in-field installation; 3 tests were performed for each configuration.
| h [mm] | Nu,m [kN] | Nu,m/Nu,m,Ref (h = 130 mm) [−] | σ [kN] | CoV [%] | Nu,code [kN] | Nu,Grosser [kN] | (h/2hef)0.25 [−] |
|---|---|---|---|---|---|---|---|
| 70 | 40.51 | 0.71 | 1.26 | 2.81 | 24.27 | 50.37 | 0.86 |
| 100 | 49.71 | 0.87 | 1.63 | 2.96 | 24.27 | 50.37 | 0.94 |
| 130 | 57.44 | 1.00 | 4.69 | 7.38 | 24.27 | 50.37 | 1.00 |
Table 9.
Experimental results—installation near the edge.
| c1 [mm] | hef [mm] | h [mm] | Nu,m [kN] | ntest [−] | σ [kN] | CoV [%] | Nu,proposal [kN] | Nu,m/Nu,proposal [kN] |
|---|---|---|---|---|---|---|---|---|
| 100 | 65 | 70 | 26.08 | 4 | 4.10 | 14.20 | 25.09 | 1.04 |
| 100 | 65 | 100 | 31.20 | 1 | - | - | 31.82 | 0.98 |
| 100 | 65 | 130 | 41.27 | 2 | 1.97 | 4.31 | 37.90 | 1.09 |
| 150 | 65 | 100 | 36.06 | 4 | 2.04 | 5.10 | 34.86 | 1.03 |
| 200 | 65 | 100 | 36.19 | 4 | 3.56 | 8.89 | 37.91 | 0.95 |
Publisher’s Note: MDPI stays neutral with regard to jurisdictional claims in published maps and institutional affiliations. |
© 2021 by the authors. Licensee MDPI, Basel, Switzerland. This article is an open access article distributed under the terms and conditions of the Creative Commons Attribution (CC BY) license (https://creativecommons.org/licenses/by/4.0/).
Share and Cite
MDPI and ACS Style
Bogdanić, A.; Casucci, D.; Ožbolt, J. Numerical and Experimental Investigation on Concrete Splitting Failure of Anchor Channels. CivilEng 2021, 2, 502-522. https://doi.org/10.3390/civileng2020028
AMA Style
Bogdanić A, Casucci D, Ožbolt J. Numerical and Experimental Investigation on Concrete Splitting Failure of Anchor Channels. CivilEng. 2021; 2(2):502-522. https://doi.org/10.3390/civileng2020028
Chicago/Turabian StyleBogdanić, Anton, Daniele Casucci, and Joško Ožbolt. 2021. "Numerical and Experimental Investigation on Concrete Splitting Failure of Anchor Channels" CivilEng 2, no. 2: 502-522. https://doi.org/10.3390/civileng2020028