
Blood–Brain Barrier Dynamic Device with Uniform Shear Stress Distribution for Microscopy and Permeability Measurements

 and
and 
Abstract
:1. Introduction
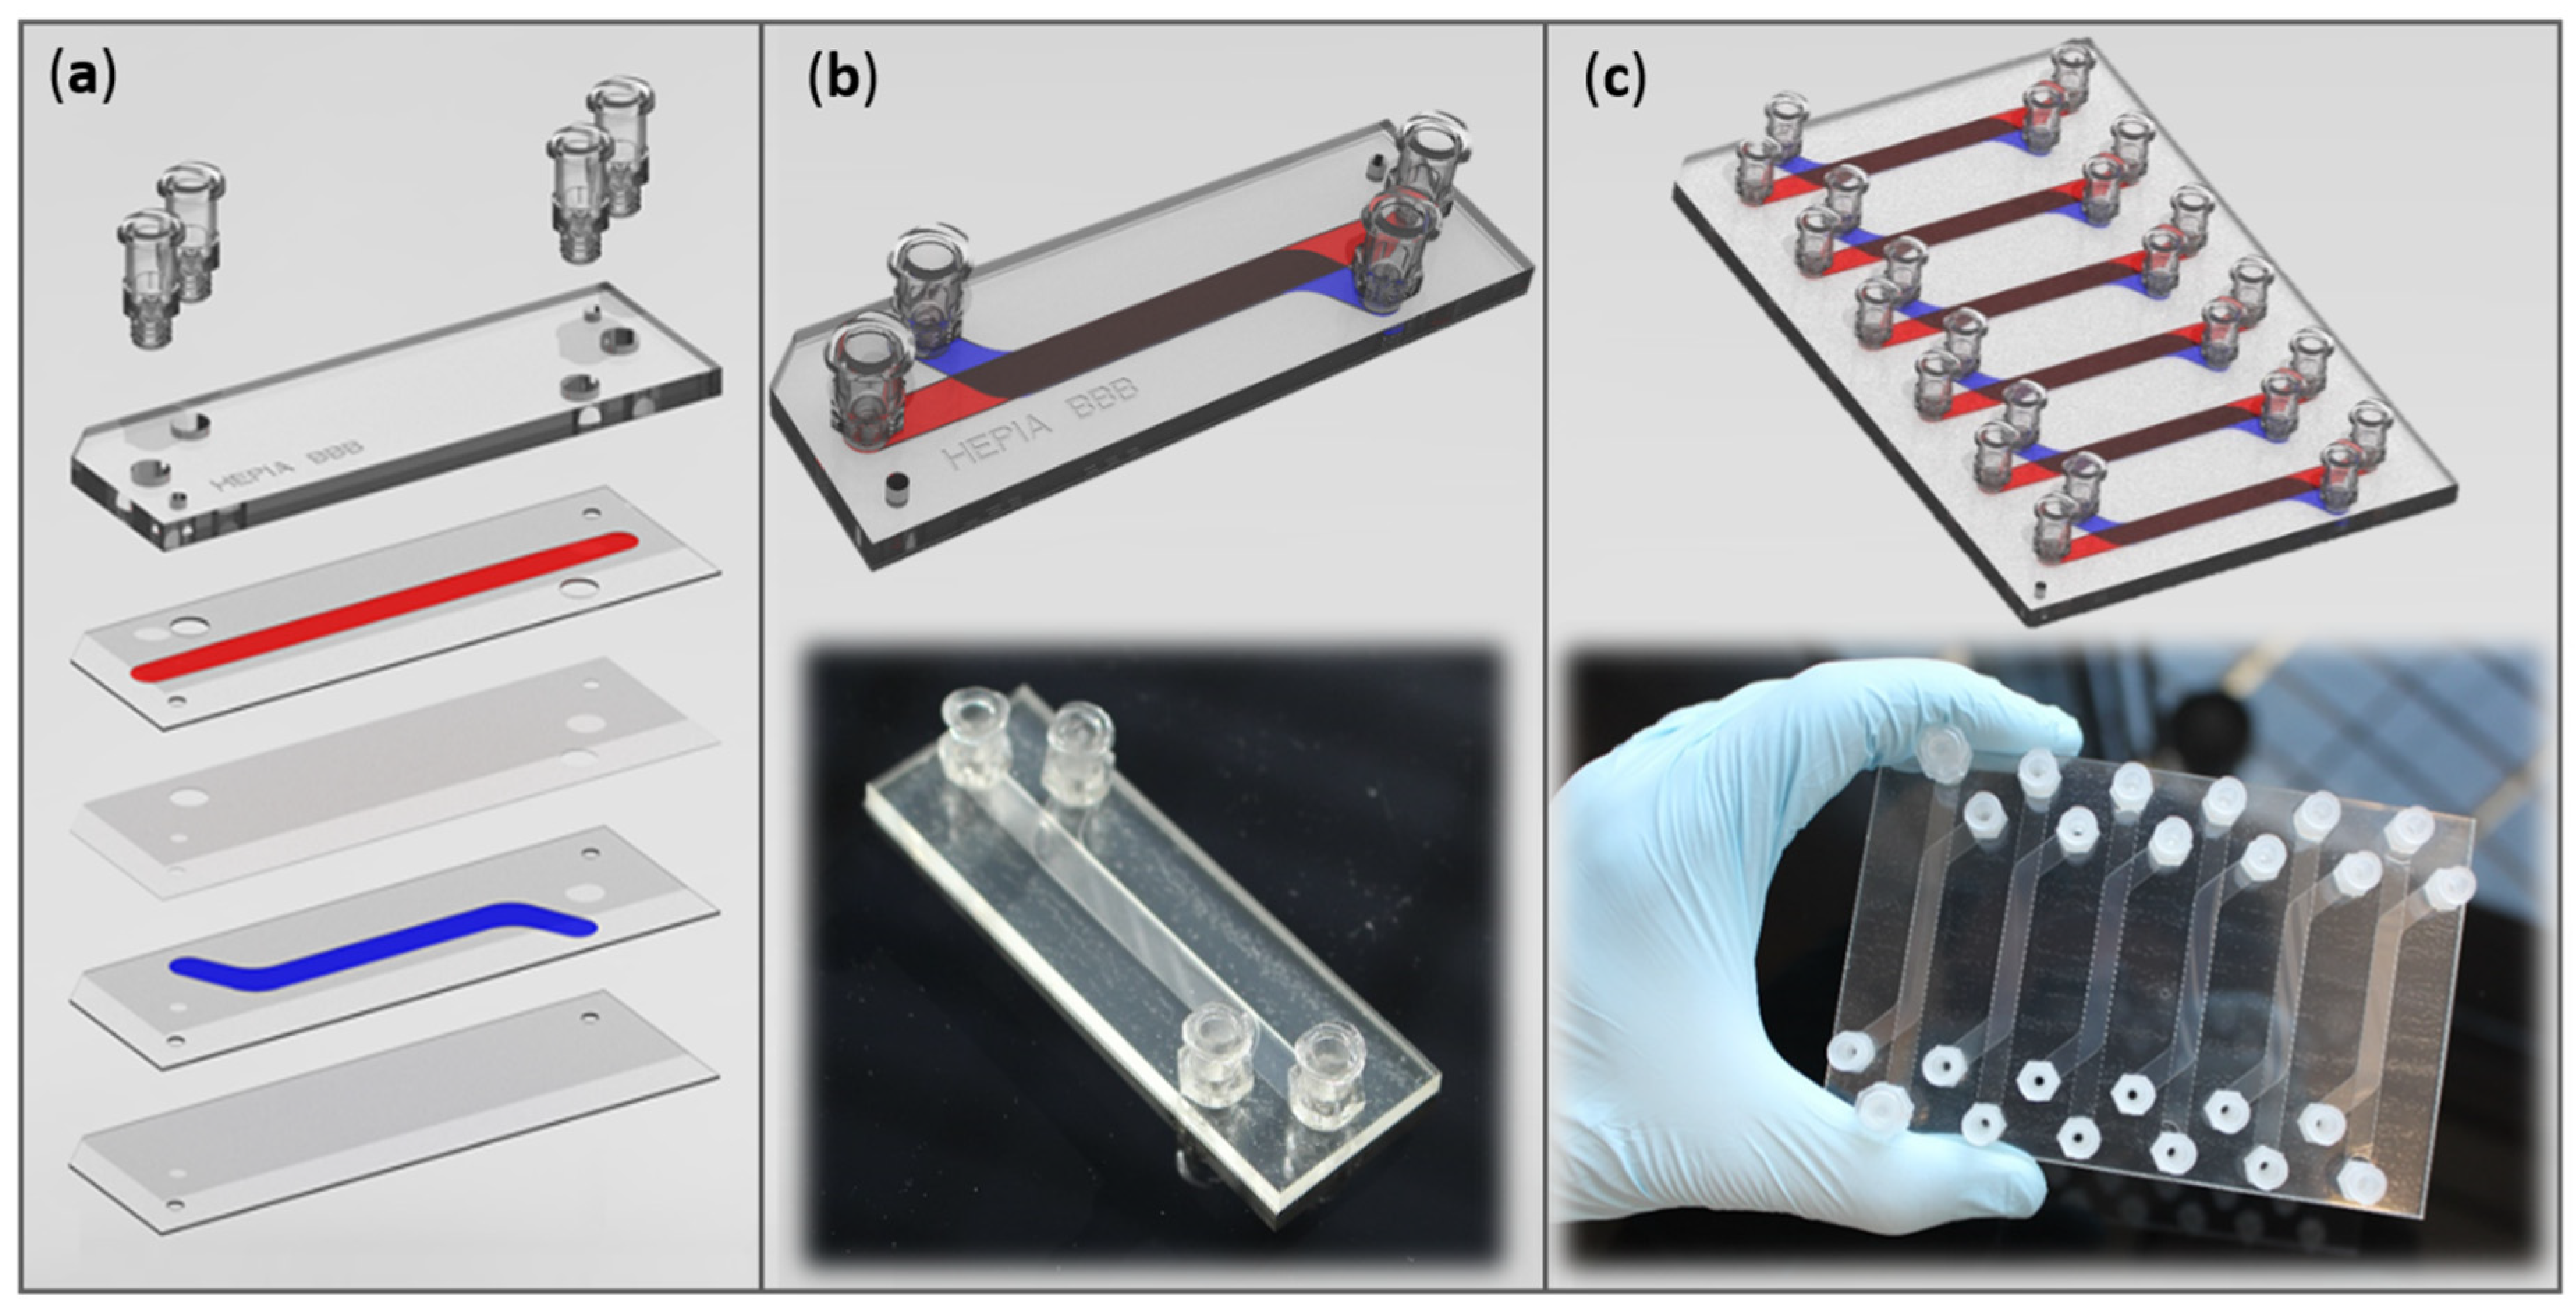
- A robust, low-cost, disposable (to limit potential contaminations or substance releases), and non-removable (to ensure sealing) barrier device,
- Cultivation of a monolayer of human BMEC on a porous membrane at the interface between two compartments,
- Simple cell culture in both static and dynamic conditions with uniform shear stress to achieve BMEC differentiation,
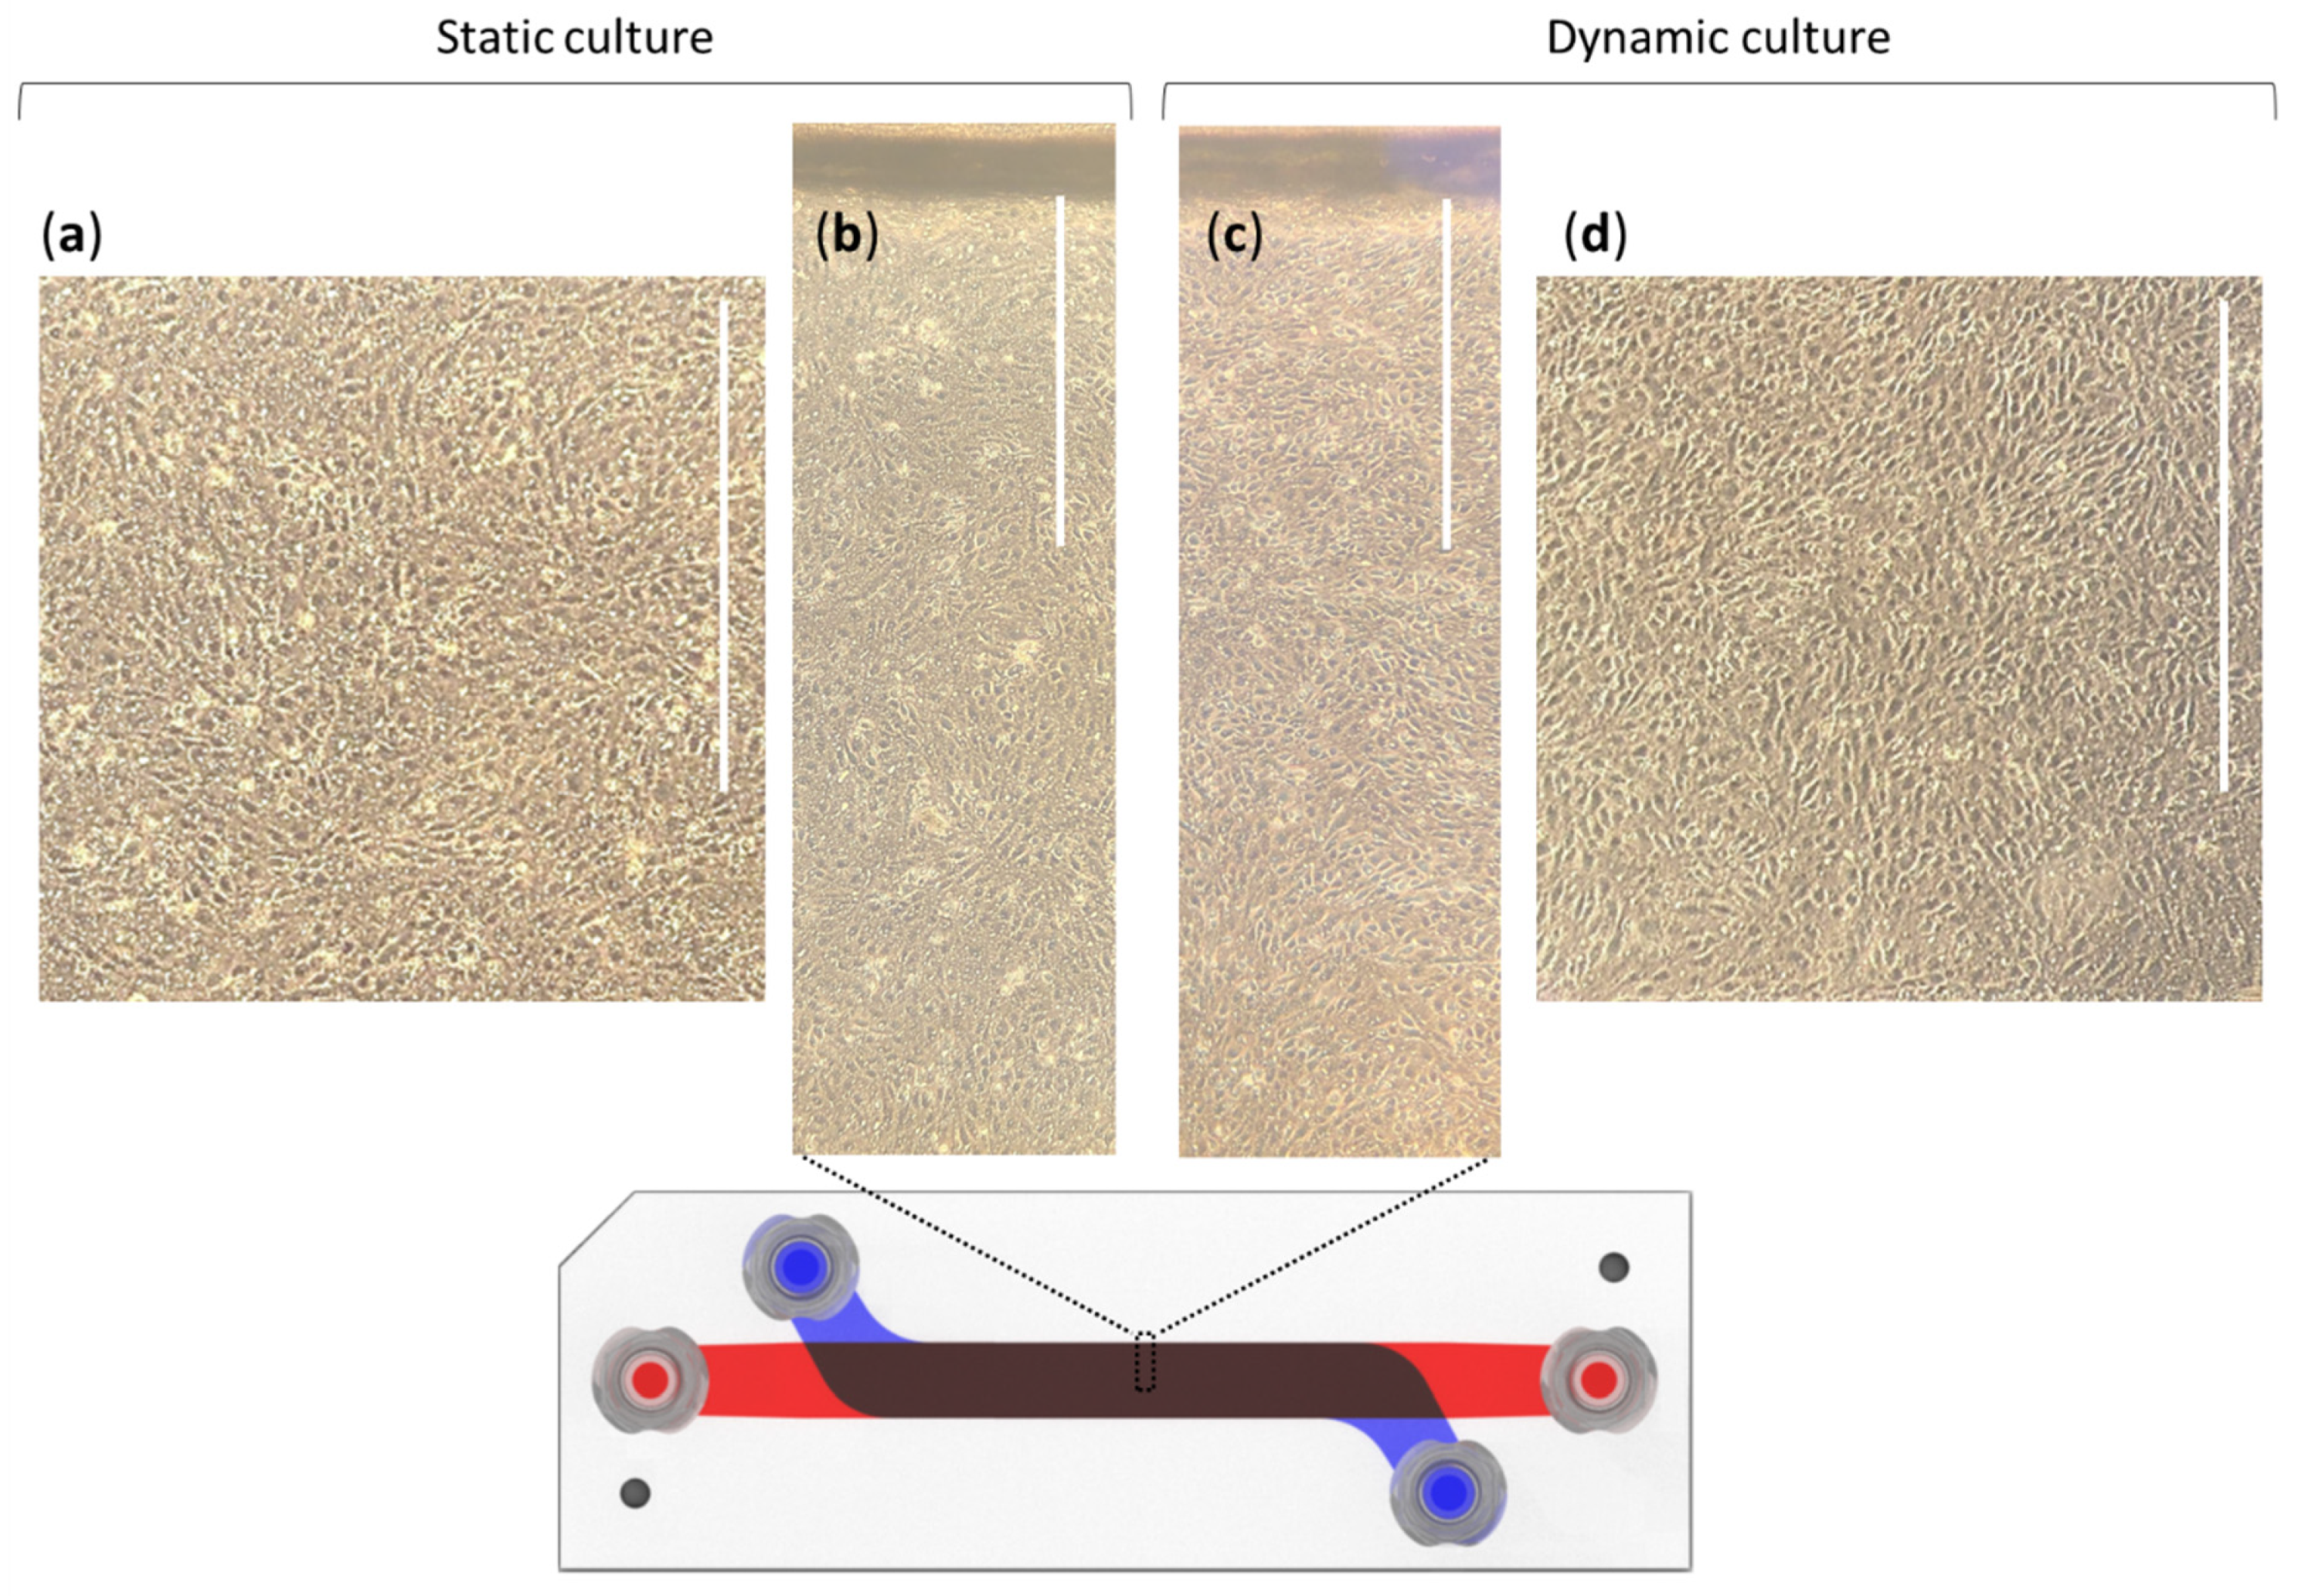
- Compatibility with phase contrast microscopy to visualize the entire cell monolayer for monitoring cell growth and confluence, as well as confocal microscopy for characterization,
- The possibility to combine several conditions in parallel, and to sample both compartments by recovering sufficient volumes for permeability or transporter studies.
2. Materials and Methods
2.1. Materials
2.2. Barrier Device Fabrication
2.3. Endothelial Cell Culture
2.4. Cell Culture Characterization
- Viability test:
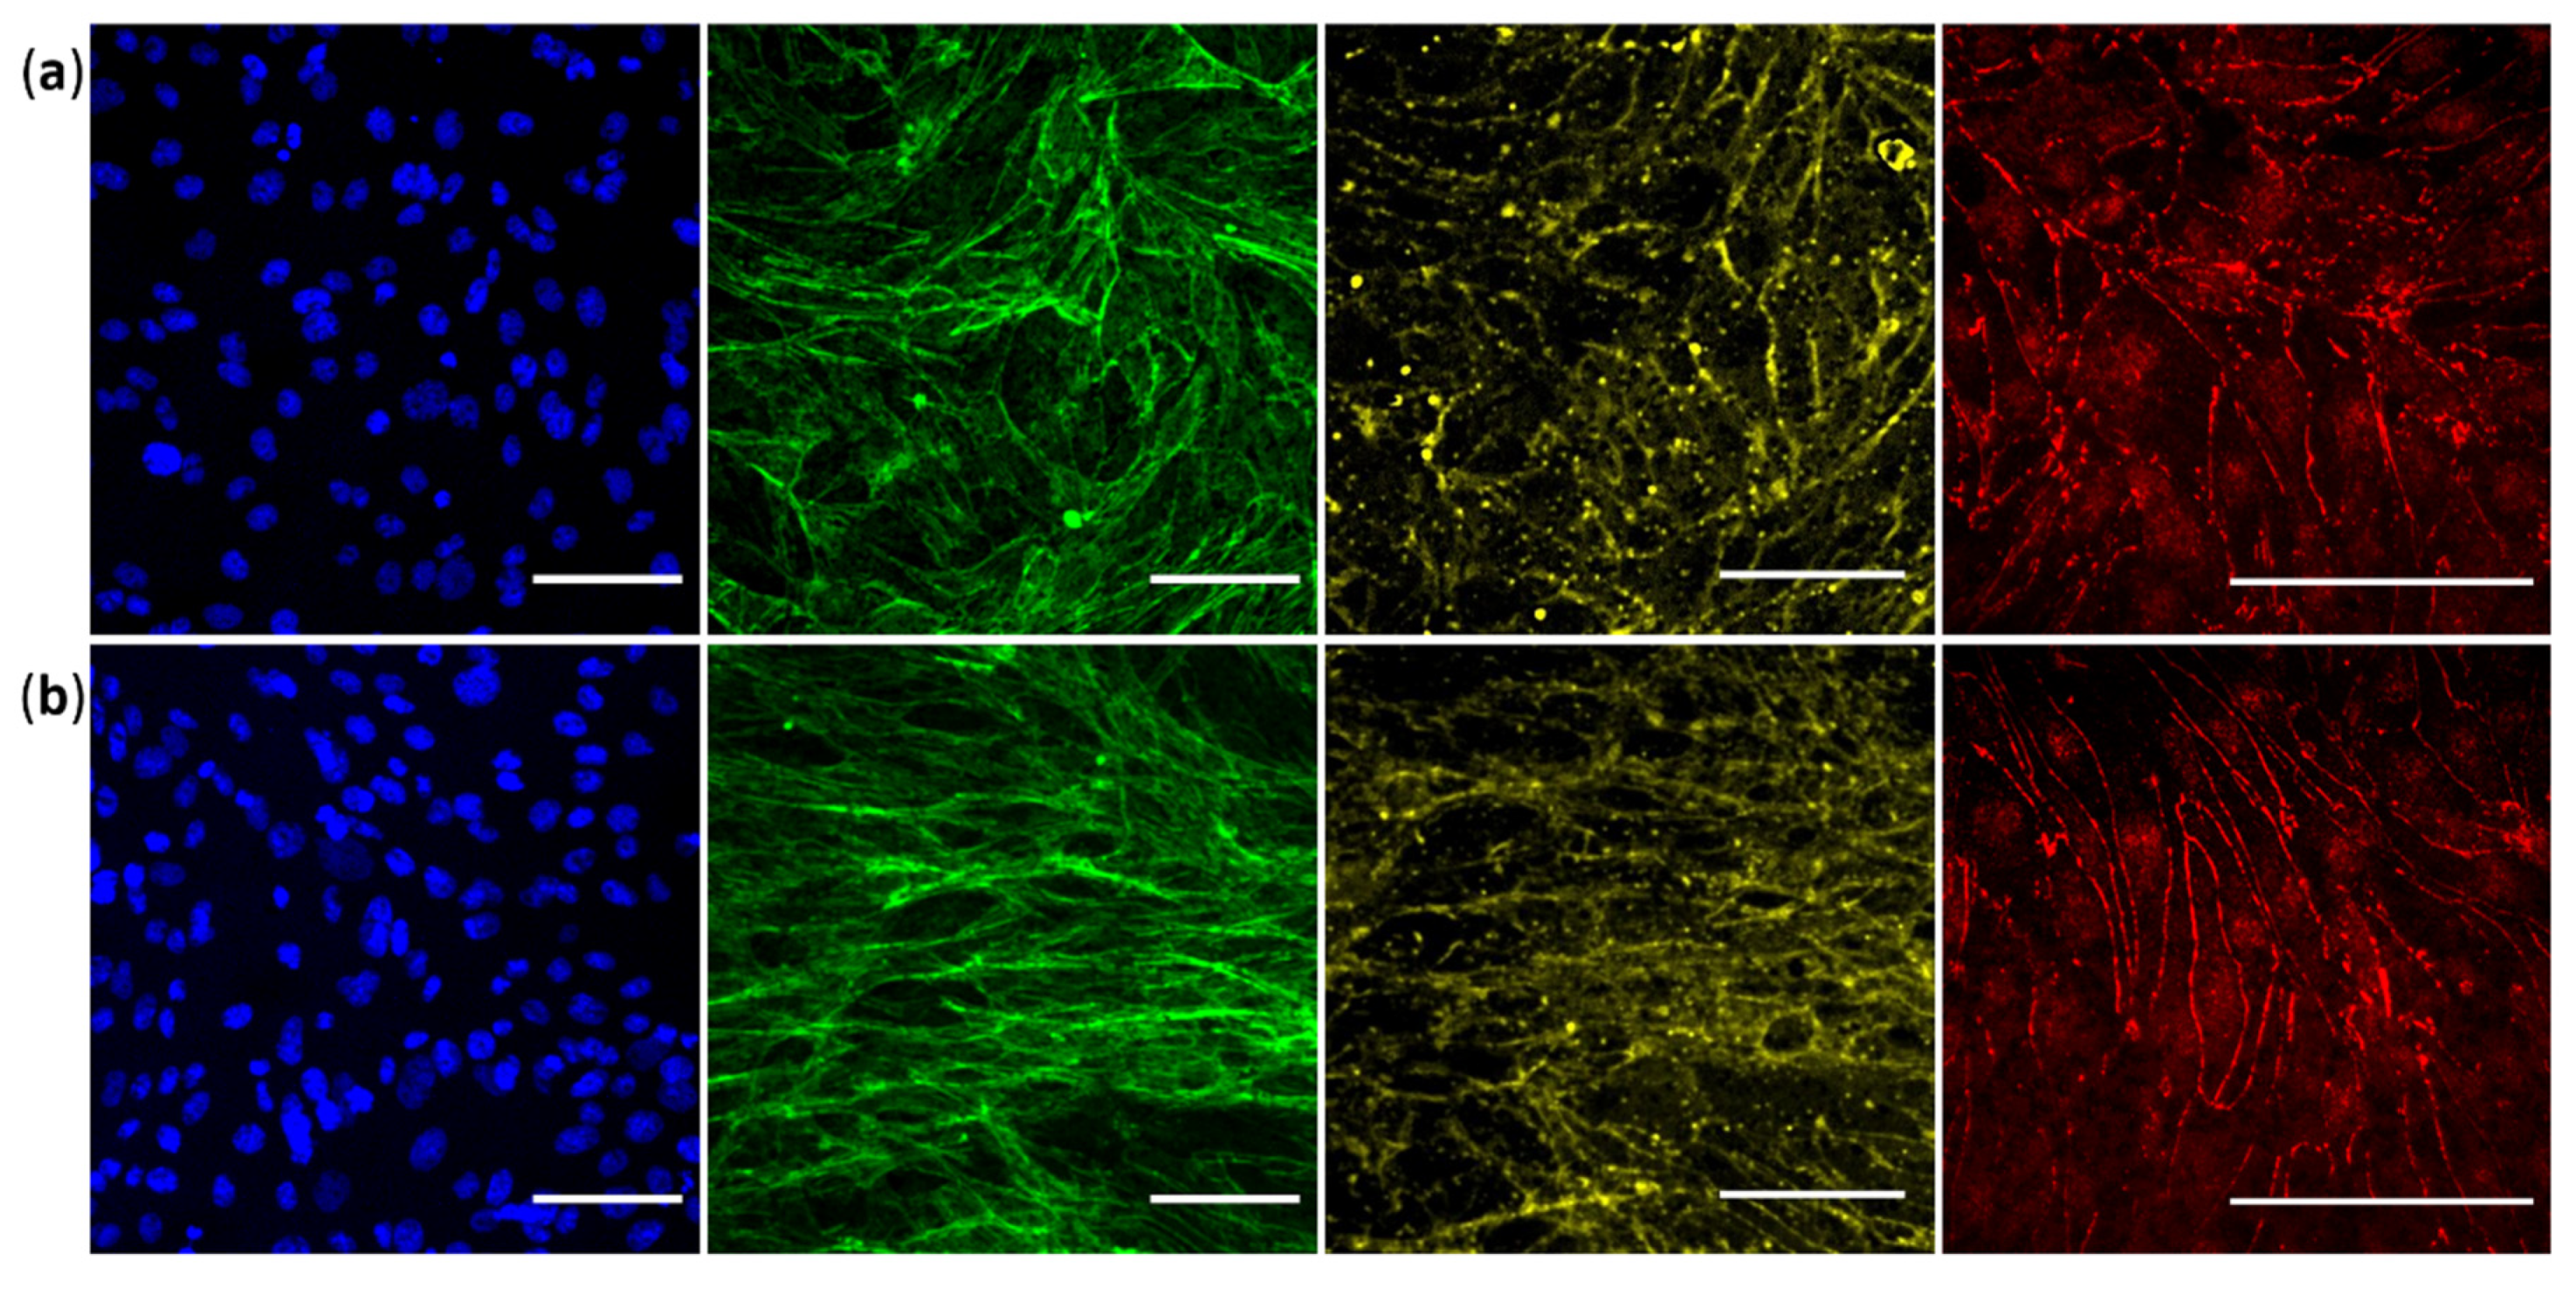
- Immunostaining:
2.5. Permeability Measurement
| : cumulative LY concentrations | : membrane surface area |
| : lower compartment volume | : Initial LY concentration |
| : incubation time | |
3. Results
3.1. Barrier Device Design
3.1.1. Materials for Device Fabrication
3.1.2. Channel Dimensions
- Channel lengths:
- Channel width (w):
- Upper channel height (h):
- Lower channel height:
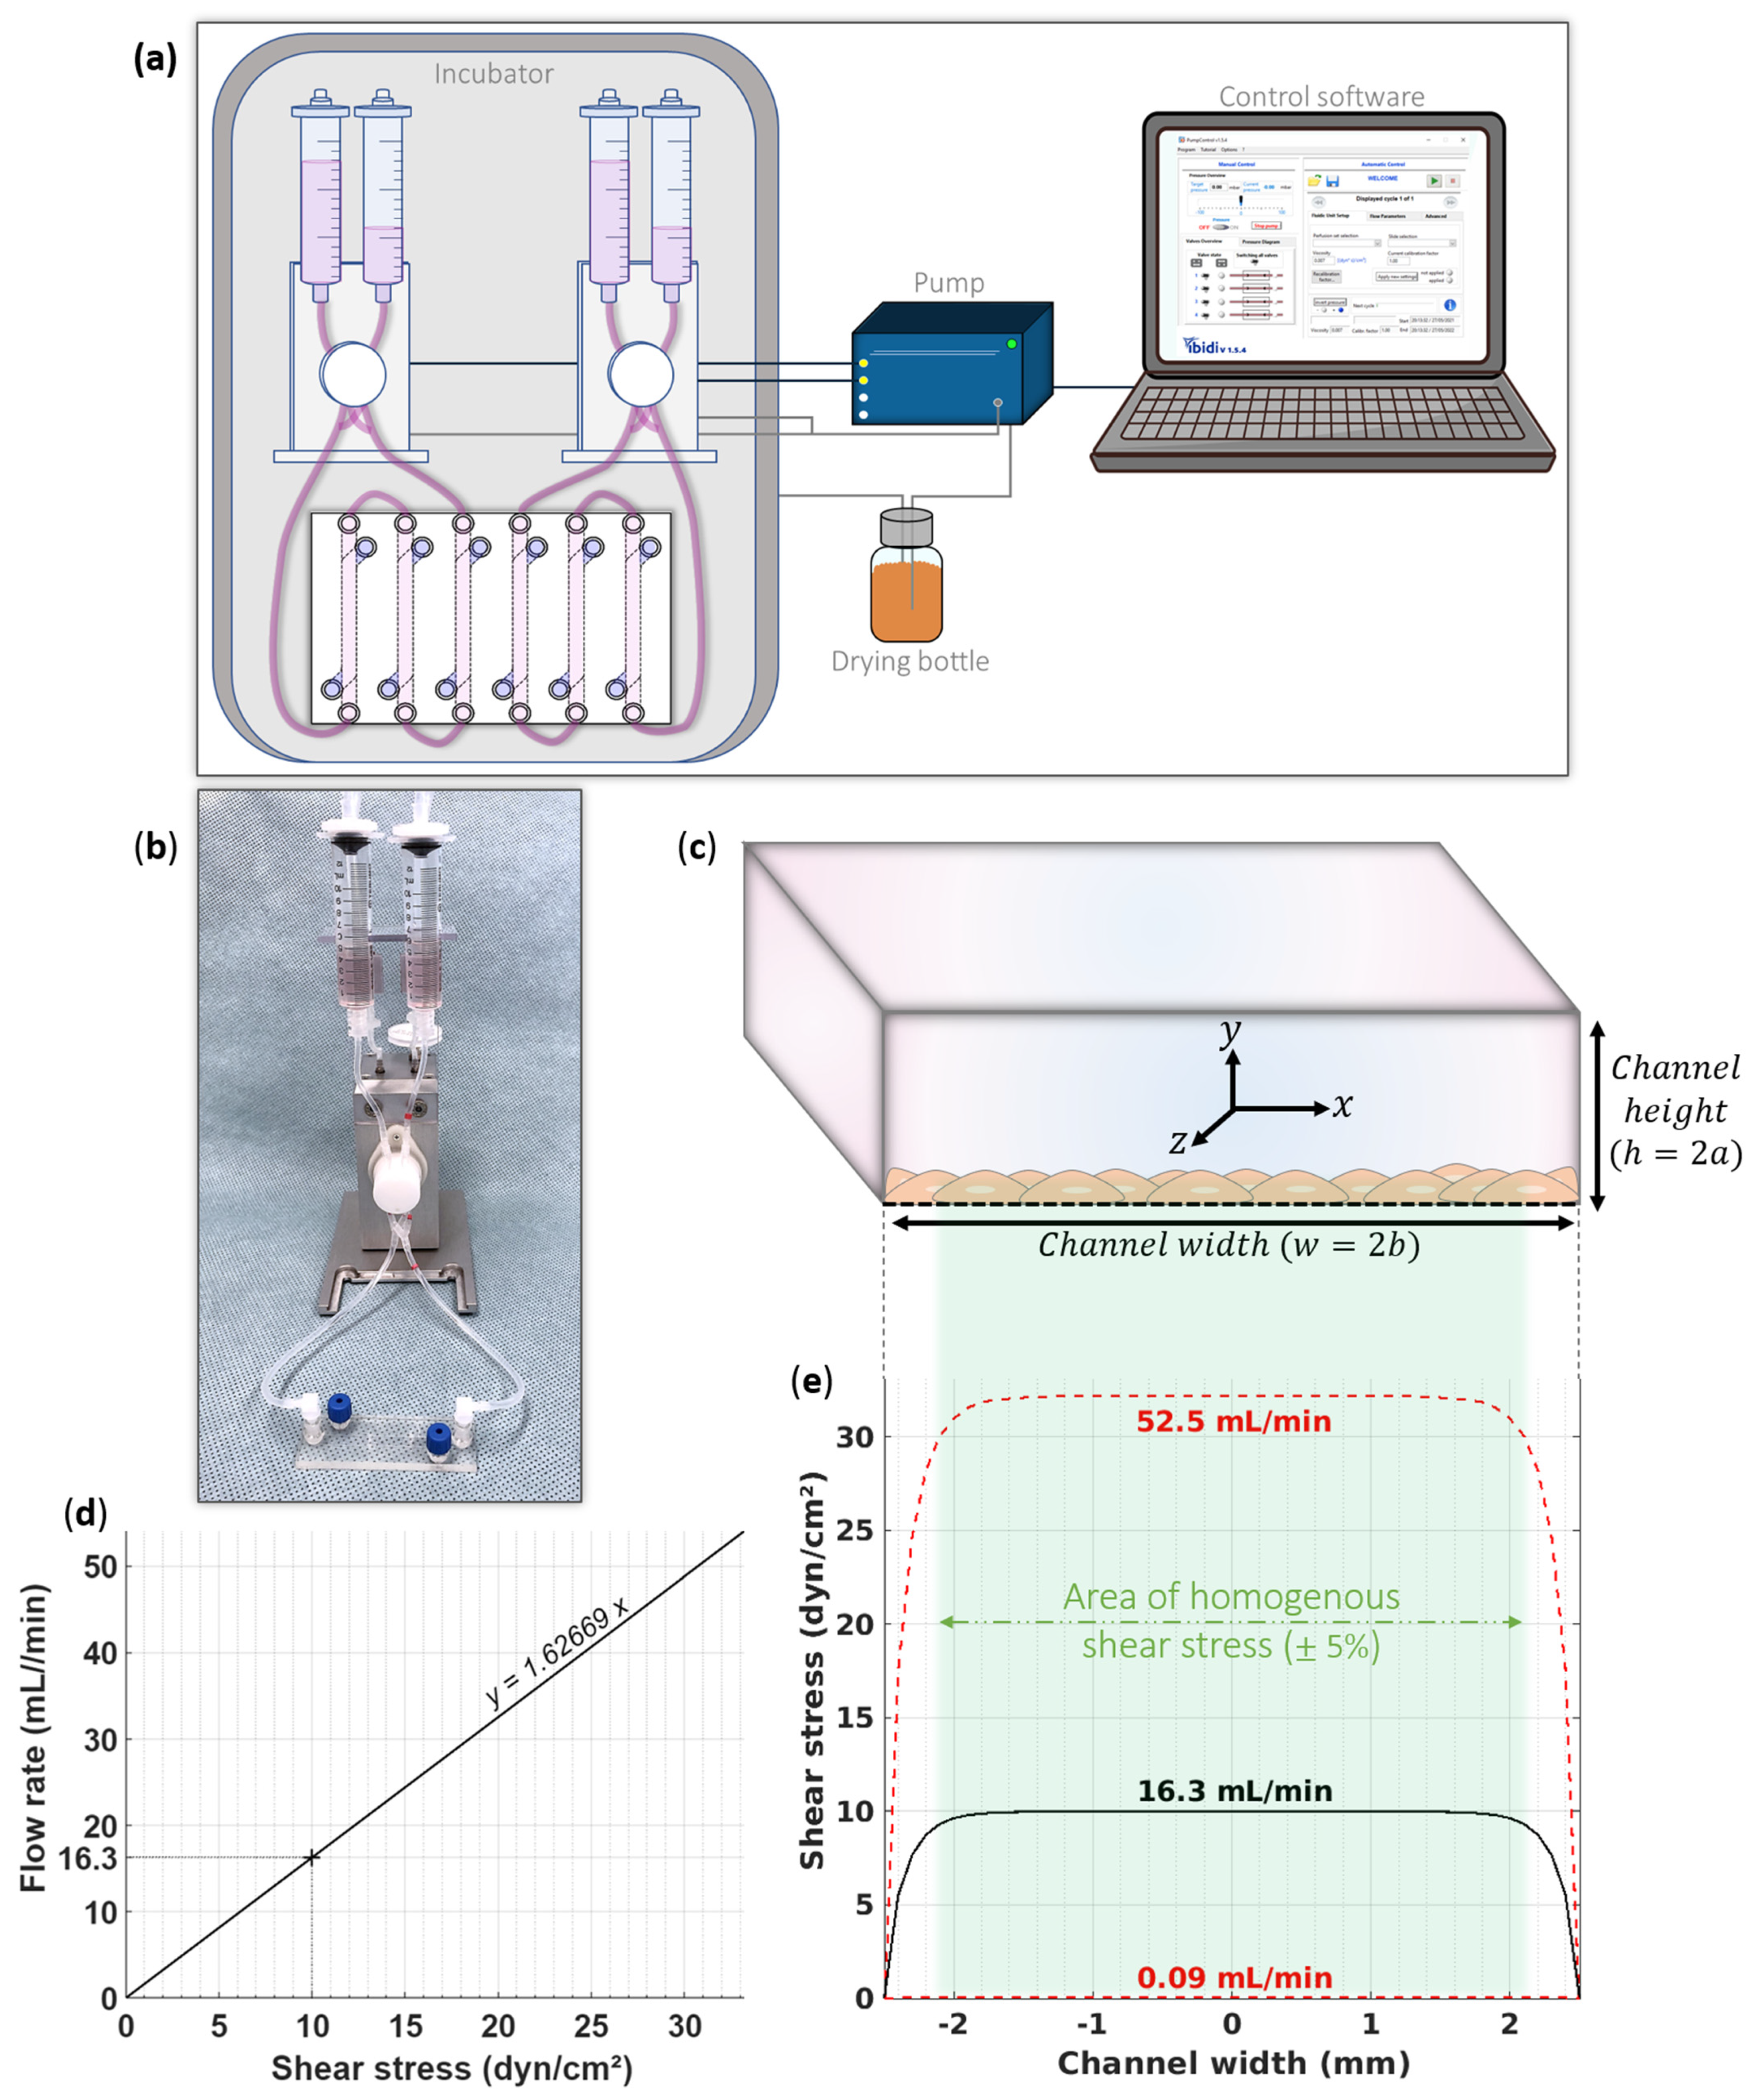
3.2. Flow Profile
- Pump system:
- Flow rate:
- Laminarity:
| : culture medium density (993 kg·m−3) | : dynamic viscosity (0.72 × 10⁻³ kg·m−1·s−1) |
| : flow velocity (in m·s−1) | : flow rate (in m3·s−1) |
| : channel height (0.5 × 10⁻³ m) | : channel width (5 × 10⁻³ m) |
3.3. Cell Culture
3.4. Validation of Specific Junctional Markers
3.5. Permeability Study
4. Discussion
- Limitations and future works:
5. Conclusions
Supplementary Materials
Author Contributions
Funding
Acknowledgments
Conflicts of Interest
References
- Feigin, V.L.; Nichols, E.; Alam, T.; Bannick, M.S.; Beghi, E.; Blake, N.; Culpepper, W.J.; Dorsey, E.R.; Elbaz, A.; Ellenbogen, R.G.; et al. Global, Regional, and National Burden of Neurological Disorders, 1990–2016: A Systematic Analysis for the Global Burden of Disease Study 2016. Lancet Neurol. 2019, 18, 459–480. [Google Scholar] [CrossRef] [Green Version]
- Di Luca, M.; Baker, M.; Corradetti, R.; Kettenmann, H.; Mendlewicz, J.; Olesen, J.; Ragan, I.; Westphal, M. Consensus Document on European Brain Research. Eur. J. Neurosci. 2011, 33, 768–818. [Google Scholar] [CrossRef] [Green Version]
- Pangalos, M.N.; Schechter, L.E.; Hurko, O. Drug Development for CNS Disorders: Strategies for Balancing Risk and Reducing Attrition. Nat. Rev. Drug Discov. 2007, 6, 521–532. [Google Scholar] [CrossRef]
- Hay, M.; Thomas, D.W.; Craighead, J.L.; Economides, C.; Rosenthal, J. Clinical Development Success Rates for Investigational Drugs. Nat. Biotechnol. 2014, 32. [Google Scholar] [CrossRef]
- Zhou, S.; Johnson, R. Pharmaceutical Probability of Success; Alacrita: London, UK, 2019. [Google Scholar]
- Henderson, J.T.; Piquette-Miller, M. Blood-Brain Barrier: An Impediment to Neuropharmaceuticals. Clin. Pharmacol. Ther. 2015, 97, 308–313. [Google Scholar] [CrossRef] [PubMed]
- Rahman, N.A.; Rasil, A.N.H.M.; Meyding-Lamade, U.; Craemer, E.M.; Diah, S.; Tuah, A.A.; Muharram, S.H. Immortalized Endothelial Cell Lines for in Vitro Blood–Brain Barrier Models: A Systematic Review. Brain Res. 2016, 1642, 532–545. [Google Scholar] [CrossRef]
- Davies, P.F. Flow-Mediated Endothelial Mechanotransduction. Physiol. Rev. 1995, 75, 519–560. [Google Scholar] [CrossRef]
- Akimoto, S.; Mitsumata, M.; Sasaguri, T.; Yoshida, Y. Laminar Shear Stress Inhibits Vascular Endothelial Cell Proliferation by Inducing Cyclin-Dependent Kinase Inhibitor P21Sdi1/Cip1/Waf1. Circ. Res. 2000, 86, 185–190. [Google Scholar] [CrossRef] [Green Version]
- Garcia-Polite, F.; Martorell, J.; del Rey-Puech, P.; Melgar-Lesmes, P.; O’Brien, C.C.; Roquer, J.; Ois, A.; Principe, A.; Edelman, E.R.; Balcells, M. Pulsatility and High Shear Stress Deteriorate Barrier Phenotype in Brain Microvascular Endothelium. J. Cereb. Blood Flow Metab. 2017, 37, 2614–2625. [Google Scholar] [CrossRef] [PubMed] [Green Version]
- Wang, X.; Xu, B.; Xiang, M.; Yang, X.; Liu, Y.; Liu, X.; Shen, Y. Advances on Fluid Shear Stress Regulating Blood-Brain Barrier. Microvasc. Res. 2020, 128, 103930. [Google Scholar] [CrossRef] [PubMed]
- Koutsiaris, A.G.; Tachmitzi, S.V.; Batis, N.; Kotoula, M.G.; Karabatsas, C.H.; Tsironi, E.; Chatzoulis, D.Z. Volume Flow and Wall Shear Stress Quantification in the Human Conjunctival Capillaries and Post-Capillary Venules In Vivo. Biorheology 2007, 44, 375–386. [Google Scholar] [PubMed]
- Wong, A.D.; Ye, M.; Levy, A.F.; Rothstein, J.D.; Bergles, D.E.; Searson, P.C. The Blood-Brain Barrier: An Engineering Perspective. Front. Neuroeng. 2013, 6, 7. [Google Scholar] [CrossRef] [PubMed] [Green Version]
- Mairey, E.; Genovesio, A.; Donnadieu, E.; Bernard, C.; Jaubert, F.; Pinard, E.; Seylaz, J.; Olivo-Marin, J.-C.; Nassif, X.; Duménil, G. Cerebral Microcirculation Shear Stress Levels Determine Neisseria Meningitidis Attachment Sites along the Blood–Brain Barrier. J. Exp. Med. 2006, 203, 1939–1950. [Google Scholar] [CrossRef] [PubMed] [Green Version]
- Weksler, B.; Romero, I.A.; Couraud, P.-O. The HCMEC/D3 Cell Line as a Model of the Human Blood Brain Barrier. Fluids Barriers CNS 2013, 10, 16. [Google Scholar] [CrossRef] [PubMed] [Green Version]
- Dauchy, S.; Miller, F.; Couraud, P.-O.; Weaver, R.J.; Weksler, B.; Romero, I.-A.; Scherrmann, J.-M.; de Waziers, I.; Declèves, X. Expression and Transcriptional Regulation of ABC Transporters and Cytochromes P450 in HCMEC/D3 Human Cerebral Microvascular Endothelial Cells. Biochem. Pharmacol. 2009, 77, 897–909. [Google Scholar] [CrossRef] [Green Version]
- Cecchelli, R.; Dehouck, B.; Descamps, L.; Fenart, L.; Buée-Scherrer, V.; Duhem, C.; Lundquist, S.; Rentfel, M.; Torpier, G.; Dehouck, M.P. In Vitro Model for Evaluating Drug Transport across the Blood–Brain Barrier. Adv. Drug Deliv. Rev. 1999, 36, 165–178. [Google Scholar] [CrossRef]
- Zhao, W.; Han, L.; Bae, Y.; Manickam, D.S. Lucifer Yellow—A Robust Paracellular Permeability Marker in a Cell Model of the Human Blood-Brain Barrier. J. Vis. Exp. 2019, e58900. [Google Scholar] [CrossRef]
- Wu, W.I.; Rezai, P.; Hsu, H.H.; Selvaganapathy, P.R. Materials and methods for the microfabrication of microfluidic biomedical devices. In Microfluidic Devices for Biomedical Applications; Elsevier: Amsterdam, The Netherlands, 2013. [Google Scholar]
- Matellan, C.; del Río Hernández, A.E. Cost-Effective Rapid Prototyping and Assembly of Poly(Methyl Methacrylate) Microfluidic Devices. Sci. Rep. 2018, 8, 6971. [Google Scholar] [CrossRef] [Green Version]
- Eigenmann, D.E.; Xue, G.; Kim, K.S.; Moses, A.V.; Hamburger, M.; Oufir, M. Comparative Study of Four Immortalized Human Brain Capillary Endothelial Cell Lines, HCMEC/D3, HBMEC, TY10, and BB19, and Optimization of Culture Conditions, for an in Vitro Blood–Brain Barrier Model for Drug Permeability Studies. Fluids Barriers CNS 2013, 10, 33. [Google Scholar] [CrossRef] [Green Version]
- Chung, B.J.; Robertson, A.M.; Peters, D.G. The Numerical Design of a Parallel Plate Flow Chamber for Investigation of Endothelial Cell Response to Shear Stress. Comput. Struct. 2003, 81, 535–546. [Google Scholar] [CrossRef]
- Son, Y. Determination of Shear Viscosity and Shear Rate from Pressure Drop and Flow Rate Relationship in a Rectangular Channel. Polymer 2007, 48, 632–637. [Google Scholar] [CrossRef]
- Young, E.W.K.; Beebe, D.J. Fundamentals of Microfluidic Cell Culture in Controlled Microenvironments. Chem. Soc. Rev. 2010, 39, 1036–1048. [Google Scholar] [CrossRef] [PubMed]
- Bakker, D.P.; van der Plaats, A.; Verkerke, G.J.; Busscher, H.J.; van der Mei, H.C. Comparison of Velocity Profiles for Different Flow Chamber Designs Used in Studies of Microbial Adhesion to Surfaces. Appl. Environ. Microbiol. 2003, 69, 6280–6287. [Google Scholar] [CrossRef] [Green Version]
- Papaioannou, T.G.; Stefanadis, C. Vascular Wall Shear Stress: Basic Principles and Methods. Hell. J. Cardiol. 2005, 46, 9–15. [Google Scholar]
- Cornish, R.J. Flow in a Pipe of Rectangular Cross-Section. Proc. R. Soc. Lond. Ser. A Math. Phys. Sci. 1928, 120, 691–700. [Google Scholar]
- Cornford, E.M.; Hyman, S.; Cornford, M.E.; Landaw, E.M.; Delgado-Escueta, A.V. Interictal Seizure Resections Show Two Configurations of Endothelial Glut1 Glucose Transporter in the Human Blood–Brain Barrier. J. Cereb. Blood Flow Metab. 1998, 18, 26–42. [Google Scholar] [CrossRef] [Green Version]
- McCormick, S.M.; Seil, J.T.; Smith, D.S.; Tan, F.; Loth, F. Transitional Flow in a Cylindrical Flow Chamber for Studies at the Cellular Level. Cardiovasc. Eng. Technol. 2012, 3, 439–449. [Google Scholar] [CrossRef] [Green Version]
- Shao, X.; Gao, D.; Chen, Y.; Jin, F.; Hu, G.; Jiang, Y.; Liu, H. Development of a Blood-Brain Barrier Model in a Membrane-Based Microchip for Characterization of Drug Permeability and Cytotoxicity for Drug Screening. Anal. Chim. Acta 2016, 934, 186–193. [Google Scholar] [CrossRef]
- Zakharova, M.; Palma do Carmo, M.A.; van der Helm, M.W.; Le-The, H.; de Graaf, M.N.S.; Orlova, V.; van den Berg, A.; van der Meer, A.D.; Broersen, K.; Segerink, L.I. Multiplexed Blood–Brain Barrier Organ-on-Chip. Lab Chip 2020, 20, 3132–3143. [Google Scholar] [CrossRef]
- Sellgren, K.L.; Hawkins, B.T.; Grego, S. An Optically Transparent Membrane Supports Shear Stress Studies in a Three-Dimensional Microfluidic Neurovascular Unit Model. Biomicrofluidics 2015, 9, 061102. [Google Scholar] [CrossRef] [Green Version]
- Maoz, B.M.; Herland, A.; FitzGerald, E.A.; Grevesse, T.; Vidoudez, C.; Pacheco, A.R.; Sheehy, S.P.; Park, T.-E.; Dauth, S.; Mannix, R.; et al. A Linked Organ-on-Chip Model of the Human Neurovascular Unit Reveals the Metabolic Coupling of Endothelial and Neuronal Cells. Nat. Biotechnol. 2018, 36, 865–874. [Google Scholar] [CrossRef] [PubMed]
- Griep, L.M.; Wolbers, F.; de Wagenaar, B.; ter Braak, P.M.; Weksler, B.B.; Romero, I.A.; Couraud, P.O.; Vermes, I.; van der Meer, A.D.; van den Berg, A. BBB on CHIP: Microfluidic Platform to Mechanically and Biochemically Modulate Blood-Brain Barrier Function. Biomed. Microdevices 2013, 15, 145–150. [Google Scholar] [CrossRef]
- Ahn, S.I.; Sei, Y.J.; Park, H.-J.; Kim, J.; Ryu, Y.; Choi, J.J.; Sung, H.-J.; MacDonald, T.J.; Levey, A.I.; Kim, Y. Microengineered Human Blood–Brain Barrier Platform for Understanding Nanoparticle Transport Mechanisms. Nat. Commun. 2020, 11, 175. [Google Scholar] [CrossRef]
- Xu, H.; Li, Z.; Yu, Y.; Sizdahkhani, S.; Ho, W.S.; Yin, F.; Wang, L.; Zhu, G.; Zhang, M.; Jiang, L.; et al. A Dynamic in Vivo-like Organotypic Blood-Brain Barrier Model to Probe Metastatic Brain Tumors. Sci. Rep. 2016, 6, 36670. [Google Scholar] [CrossRef] [Green Version]
- Park, T.-E.; Mustafaoglu, N.; Herland, A.; Hasselkus, R.; Mannix, R.; FitzGerald, E.A.; Prantil-Baun, R.; Watters, A.; Henry, O.; Benz, M.; et al. Hypoxia-Enhanced Blood-Brain Barrier Chip Recapitulates Human Barrier Function and Shuttling of Drugs and Antibodies. Nat. Commun. 2019, 10, 2621. [Google Scholar] [CrossRef] [PubMed]
- Walter, F.R.; Valkai, S.; Kincses, A.; Petneházi, A.; Czeller, T.; Veszelka, S.; Ormos, P.; Deli, M.A.; Dér, A. A Versatile Lab-on-a-Chip Tool for Modeling Biological Barriers. Sens. Actuators B Chem. 2016, 222, 1209–1219. [Google Scholar] [CrossRef] [Green Version]
- Adriani, G.; Ma, D.; Pavesi, A.; Kamm, R.D.; Goh, E.L.K. A 3D Neurovascular Microfluidic Model Consisting of Neurons, Astrocytes and Cerebral Endothelial Cells as a Blood-Brain Barrier. Lab Chip 2017, 17, 448–459. [Google Scholar] [CrossRef] [PubMed]
- Brown, T.D.; Nowak, M.; Bayles, A.V.; Prabhakarpandian, B.; Karande, P.; Lahann, J.; Helgeson, M.E.; Mitragotri, S. A Microfluidic Model of Human Brain (ΜHuB) for Assessment of Blood Brain Barrier. Bioeng. Transl. Med. 2019, 4, e10126. [Google Scholar] [CrossRef] [Green Version]
- Wong, A.K.; LLanos, P.; Boroda, N.; Rosenberg, S.R.; Rabbany, S.Y. A Parallel-Plate Flow Chamber for Mechanical Characterization of Endothelial Cells Exposed to Laminar Shear Stress. Cell. Mol. Bioeng. 2016, 9, 127–138. [Google Scholar] [CrossRef]
- Moya, M.; Triplett, M.; Simon, M.; Alvarado, J.; Booth, R.; Osburn, J.; Soscia, D.; Qian, F.; Fischer, N.; Kulp, K.; et al. A Reconfigurable in Vitro Model for Studying the Blood Brain Barrier. Ann. Biomed. Eng. 2019, 48, 780–793. [Google Scholar] [CrossRef]
- Weksler, B.B.; Subileau, E.A.; Perrière, N.; Charneau, P.; Holloway, K.; Leveque, M.; Tricoire-Leignel, H.; Nicotra, A.; Bourdoulous, S.; Turowski, P.; et al. Blood-brain Barrier-specific Properties of a Human Adult Brain Endothelial Cell Line. FASEB J. 2005, 19, 1872–1874. [Google Scholar] [CrossRef] [PubMed]
- Urich, E.; Lazic, S.E.; Molnos, J.; Wells, I.; Freskgård, P.O. Transcriptional Profiling of Human Brain Endothelial Cells Reveals Key Properties Crucial for Predictive in Vitro Blood-Brain Barrier Models. PLoS ONE 2012, 7, e38149. [Google Scholar] [CrossRef] [PubMed] [Green Version]
- Liebner, S.; Corada, M.; Bangsow, T.; Babbage, J.; Taddei, A.; Czupalla, C.J.; Reis, M.; Felici, A.; Wolburg, H.; Fruttiger, M.; et al. Wnt/β-Catenin Signaling Controls Development of the Blood–Brain Barrier. J. Cell Biol. 2008, 183, 409–417. [Google Scholar] [CrossRef] [PubMed] [Green Version]
- Laksitorini, M.D.; Yathindranath, V.; Xiong, W.; Hombach-Klonisch, S.; Miller, D.W. Modulation of Wnt/β-Catenin Signaling Promotes Blood-Brain Barrier Phenotype in Cultured Brain Endothelial Cells. Sci. Rep. 2019, 9, 19718. [Google Scholar] [CrossRef] [Green Version]
- Reinitz, A.; DeStefano, J.; Ye, M.; Wong, A.D.; Searson, P.C. Human Brain Microvascular Endothelial Cells Resist Elongation Due to Shear Stress. Microvasc. Res. 2015, 99, 8–18. [Google Scholar] [CrossRef] [Green Version]
- Jiang, L.; Li, S.; Zheng, J.; Li, Y.; Huang, H. Recent Progress in Microfluidic Models of the Blood-Brain Barrier. Micromachines 2019, 10, 375. [Google Scholar] [CrossRef] [Green Version]
- Elbakary, B.; Badhan, R.K.S. A Dynamic Perfusion Based Blood-Brain Barrier Model for Cytotoxicity Testing and Drug Permeation. Sci. Rep. 2020, 10, 3788. [Google Scholar] [CrossRef] [Green Version]
- Edington, C.D.; Chen, W.L.K.; Geishecker, E.; Kassis, T.; Soenksen, L.R.; Bhushan, B.M.; Freake, D.; Kirschner, J.; Maass, C.; Tsamandouras, N.; et al. Interconnected Microphysiological Systems for Quantitative Biology and Pharmacology Studies. Sci. Rep. 2018, 8, 3788. [Google Scholar] [CrossRef] [Green Version]
- Davies, A.E.; Williams, R.L.; Lugano, G.; Pop, S.R.; Kearns, V.R. In Vitro and Computational Modelling of Drug Delivery across the Outer Blood–Retinal Barrier. Interface Focus 2020, 10, 20190132. [Google Scholar] [CrossRef] [PubMed]
- Wevers, N.R.; Kasi, D.G.; Gray, T.; Wilschut, K.J.; Smith, B.; Vught, R.; Shimizu, F.; Sano, Y.; Kanda, T.; Marsh, G.; et al. A Perfused Human Blood-Brain Barrier on-a-Chip for High-Throughput Assessment of Barrier Function and Antibody Transport. Fluids Barriers CNS 2018, 15, 23. [Google Scholar] [CrossRef] [Green Version]
- Bang, S.; Lee, S.-R.; Ko, J.; Son, K.; Tahk, D.; Ahn, J.; Im, C.; Jeon, N.L. A Low Permeability Microfluidic Blood-Brain Barrier Platform with Direct Contact between Perfusable Vascular Network and Astrocytes. Sci. Rep. 2017, 7, 8083. [Google Scholar] [CrossRef] [PubMed]
- Booth, R.; Kim, H. Permeability Analysis of Neuroactive Drugs Through a Dynamic Microfluidic In Vitro Blood–Brain Barrier Model. Ann. Biomed. Eng. 2014, 42, 2379–2391. [Google Scholar] [CrossRef]
- Wang, Y.I.; Abaci, H.E.; Shuler, M.L. Microfluidic Blood-Brain Barrier Model Provides In Vivo-Like Barrier Properties for Drug Permeability Screening. Biotechnol. Bioeng 2017, 114, 184–194. [Google Scholar] [CrossRef]
- Van der Helm, M.W.; van der Meer, A.D.; Eijkel, J.C.T.; van den Berg, A.; Segerink, L.I. Microfluidic Organ-on-Chip Technology for Blood-Brain Barrier Research. Tissue Barriers 2016, 4, e1142493. [Google Scholar] [CrossRef] [PubMed] [Green Version]
- Deosarkar, S.P.; Prabhakarpandian, B.; Wang, B.; Sheffield, J.B.; Krynska, B.; Kiani, M.F. A Novel Dynamic Neonatal Blood-Brain Barrier on a Chip. PLoS ONE 2015, 10, e0142725. [Google Scholar] [CrossRef] [Green Version]
- Obermeier, B.; Daneman, R.; Ransohoff, R.M. Development, Maintenance and Disruption of the Blood-Brain Barrier. Nat. Med. 2013, 19, e0142725. [Google Scholar] [CrossRef]
- Pekny, M.; Stanness, K.A.; Eliasson, C.; Betsholtz, C.; Janigro, D. Impaired Induction of Blood-Brain Barrier Properties in Aortic Endothelial Cells by Astrocytes from GFAB-Deficient Mice. Glia 1998, 22, 390–400. [Google Scholar] [CrossRef]
- Abbott, N.J.; Rönnbäck, L.; Hansson, E. Astrocyte–Endothelial Interactions at the Blood–Brain Barrier. Nat. Rev. Neurosci. 2006, 7, 41–53. [Google Scholar] [CrossRef]
- Cucullo, L.; Couraud, P.-O.; Weksler, B.; Romero, I.-A.; Hossain, M.; Rapp, E.; Janigro, D. Immortalized Human Brain Endothelial Cells and Flow-Based Vascular Modeling: A Marriage of Convenience for Rational Neurovascular Studies. J. Cereb. Blood Flow Metab. 2008, 28, 312–328. [Google Scholar] [CrossRef] [PubMed] [Green Version]
- Janigro, D.; West, G.A.; Nguyen, T.S.; Winn, H.R. Regulation of Blood-Brain Barrier Endothelial Cells by Nitric Oxide. Circ. Res. 1994, 75, 528–538. [Google Scholar] [CrossRef] [Green Version]
- Thiel, V.E.; Audus, K.L. Nitric Oxide and Blood–Brain Barrier Integrity. Antioxid. Redox Signal. 2001, 3, 273–278. [Google Scholar] [CrossRef] [PubMed]
- Olivera, G.C.; Ren, X.; Vodnala, S.K.; Lu, J.; Coppo, L.; Leepiyasakulchai, C.; Holmgren, A.; Kristensson, K.; Rottenberg, M.E. Nitric Oxide Protects against Infection-Induced Neuroinflammation by Preserving the Stability of the Blood-Brain Barrier. PLoS Pathog. 2016, 12, e1005442. [Google Scholar] [CrossRef] [PubMed] [Green Version]


| Effective Culture Volumes and Times: | ||||
|---|---|---|---|---|
| Material for Culture | Cell Seeding Surface | Volume | Medium Height | Interval between Two Medium Changes |
| cm² | mL | cm | Hours | |
| T75 Flask | 75 | 15 * | 0.2 | 96 |
| T25 Flask | 25 | 5 * | 0.2 | 96 |
| Barrier device with h = 0.6 mm | 3.26 | 0.196 | 0.06 | 29 |
| Barrier device with h = 0.5 mm | 3.26 | 0.163 | 0.05 | 24 |
| Barrier device with h = 0.3 mm | 3.26 | 0.098 | 0.03 | 14 |
| Culture Condition | Recovery (%) | Papp (10−6 cm·s−1) |
|---|---|---|
| Cells in static culture | 87.3 0.36 | 14.2 0.66 |
| Cells in dynamic culture | 86.6 2.99 | 10.2 1.11 * |
Publisher’s Note: MDPI stays neutral with regard to jurisdictional claims in published maps and institutional affiliations. |
© 2021 by the authors. Licensee MDPI, Basel, Switzerland. This article is an open access article distributed under the terms and conditions of the Creative Commons Attribution (CC BY) license (https://creativecommons.org/licenses/by/4.0/).
Share and Cite
Choublier, N.; Müller, Y.; Gomez Baisac, L.; Laedermann, J.; de Rham, C.; Declèves, X.; Roux, A. Blood–Brain Barrier Dynamic Device with Uniform Shear Stress Distribution for Microscopy and Permeability Measurements. Appl. Sci. 2021, 11, 5584. https://doi.org/10.3390/app11125584
Choublier N, Müller Y, Gomez Baisac L, Laedermann J, de Rham C, Declèves X, Roux A. Blood–Brain Barrier Dynamic Device with Uniform Shear Stress Distribution for Microscopy and Permeability Measurements. Applied Sciences. 2021; 11(12):5584. https://doi.org/10.3390/app11125584
Chicago/Turabian StyleChoublier, Nina, Yoann Müller, Loris Gomez Baisac, Jeremy Laedermann, Casimir de Rham, Xavier Declèves, and Adrien Roux. 2021. "Blood–Brain Barrier Dynamic Device with Uniform Shear Stress Distribution for Microscopy and Permeability Measurements" Applied Sciences 11, no. 12: 5584. https://doi.org/10.3390/app11125584