Article

Identification of Abnormal Proteins in Plasma from Gout Patients by LC-MS/MS

1
NHC Key Laboratory of Hormones and Development, Tianjin Key Laboratory of Metabolic Diseases, Chu Hsien-I Memorial Hospital & Tianjin Institute of Endocrinology, Tianjin Medical University, Tianjin 300134, China
2
The Province and Ministry Co-Sponsored Collaborative Innovation Center for Medical Epigenetics, Tianjin Key Laboratory of Medical Epigenetics, Key Laboratory of Immune Microenvironment and Disease (Ministry of Education), Tianjin Key Laboratory of Cellular Homeostasis and Diseases, Department of Biochemistry and Molecular Biology, Tianjin Medical University, Tianjin 300070, China
*
Authors to whom correspondence should be addressed.
Separations 2021, 8(6), 85; https://doi.org/10.3390/separations8060085
Submission received: 11 May 2021 / Revised: 4 June 2021 / Accepted: 6 June 2021 / Published: 16 June 2021
(This article belongs to the Collection State of the Art in Separation Science)

Abstract

:
A high level of uric acid may cause hyperuricemia, which further develops into gout, eventually leading to chronic kidney disease. However, the pathogenic mechanism remains largely unknown. To investigate the cause and block the transformation of hyperuricemia to related diseases, it is important to discover the alterations in protein levels between gout patients and non-gout individuals. To date, human blood plasma is still the predominant matrices for clinical analysis. Due to the high abundance, the proteins of plasma samples have strong shielding effects on low abundance proteins, thus, the information on low abundance protein expression is always masked, while the low abundance proteins of human plasma are often of great significance for the diagnosis and treatment of diseases. Therefore, it is very important to separate and analyze the plasma proteins. High-performance liquid chromatography (LC) tandem mass spectrometry (MS)-based proteomics has been developed as a powerful tool to investigate changes in the human plasma proteome. Here, we used LC-MS/MS to detect the differential proteins in the plasmas from simple gout patients, gout with kidney damage patients, and non-gout individuals. We identified 32 obviously differential proteins between non-gout and gout subjects and 10 differential proteins between simple gout and gout with kidney damage patients. These differential proteins were further analyzed to characterize their localization and functions. Additionally, the correlation analysis showed multiple relationships between the abnormal plasma proteins and clinical biochemical indexes, particularly for the immune-inflammatory response proteins. Furthermore, inflammation factors gelsolin (GSN) were confirmed. Our results offer a view of plasma proteins for studying biomarkers of gout patients.

1. Introduction

Uric acid, a weak diprotic acid, is the terminal product of purine metabolism in humans [1]. Hyperuricemia, a high level of serum uric acid, is known to cause significant health problems associated with urate crystal deposition. Emerging evidence indicates that hyperuricemia is an independent risk factor for chronic kidney disease (CKD) [2,3]. Meanwhile, persistent hyperuricemia is an important factor in the development of gout, with about 5 to 12% of hyperuricemia developing into gout. It is often stated that the prevalence of hyperuricemia and gout has increased in recent years [4,5,6]. The prevalence of gout and hyperuricemia has increased in developed countries over the past two decades and research into the area has become progressively more active. According to a 2014 study, the adjusted prevalence of hyperuricemia among Chinese adults in 2009–2010 was about 8.4–13.3% [7]. The prevalence of gout ranged from 1 to 4% worldwide and incidence ranged from about 0.1 to 0.3% [8], while the prevalence rate of gout in China is 1–3%. Many epidemiological studies have shown that hyperuricemia and gout are associated with the development of hypertension, cardiovascular disease, chronic kidney disease, and so on [2]. Therefore, it is particularly important to find the cause and block the transformation of hyperuricemia into related diseases.
As the basic executor of life activities, proteins drive various physiological or pathological processes. As one of the largest subgroups of the human proteome, plasma proteomics has attracted more and more attention. To date, human blood plasma is still the predominant matrices for clinical analysis as they are easily accessible and clearly reflect an individual’s metabolism, better than serum, thus, it is crucial to profile the differential plasma proteins between gout patients and non-gout individuals to understand the molecular mechanism of gout occurrence and development. Due to their high abundance, proteins in plasma samples have strong shielding effects on low abundance proteins, thus, the information on low abundance protein expression is always masked. However, the low abundance proteins of human plasma are often of great significance for the diagnosis and treatment of diseases. Therefore, it is very important to separate and enrich the low abundance proteins and remove the high abundance proteins from the plasma. HPLC-MS has been developed as a powerful tool to investigate changes in the human plasma proteome because this holistic approach can, in principle, yield specific and quantitative information on all proteins in an unbiased way [9]. This proteomic workflow allows the streamlined analysis of hundreds of plasma proteins from a single drop of blood.
The profile of plasma proteins can provide quantitative information on the majority of the classical, functional plasma proteins, and thus we speculated that the metabolic status of individuals during gout would be reflected by their plasma proteomes. Herein we selected 16 plasma samples of gout patients (8 cases of gout alone and 8 cases of gout with renal injury) and 8 cases of non-gout individuals for proteomic analysis. The biological significance of abnormal proteins was further analyzed by combining them with clinical syndromes and biochemical indicators. This allowed us to analyze the global changes related to gout processes in the plasma proteome.

2. Materials and Methods
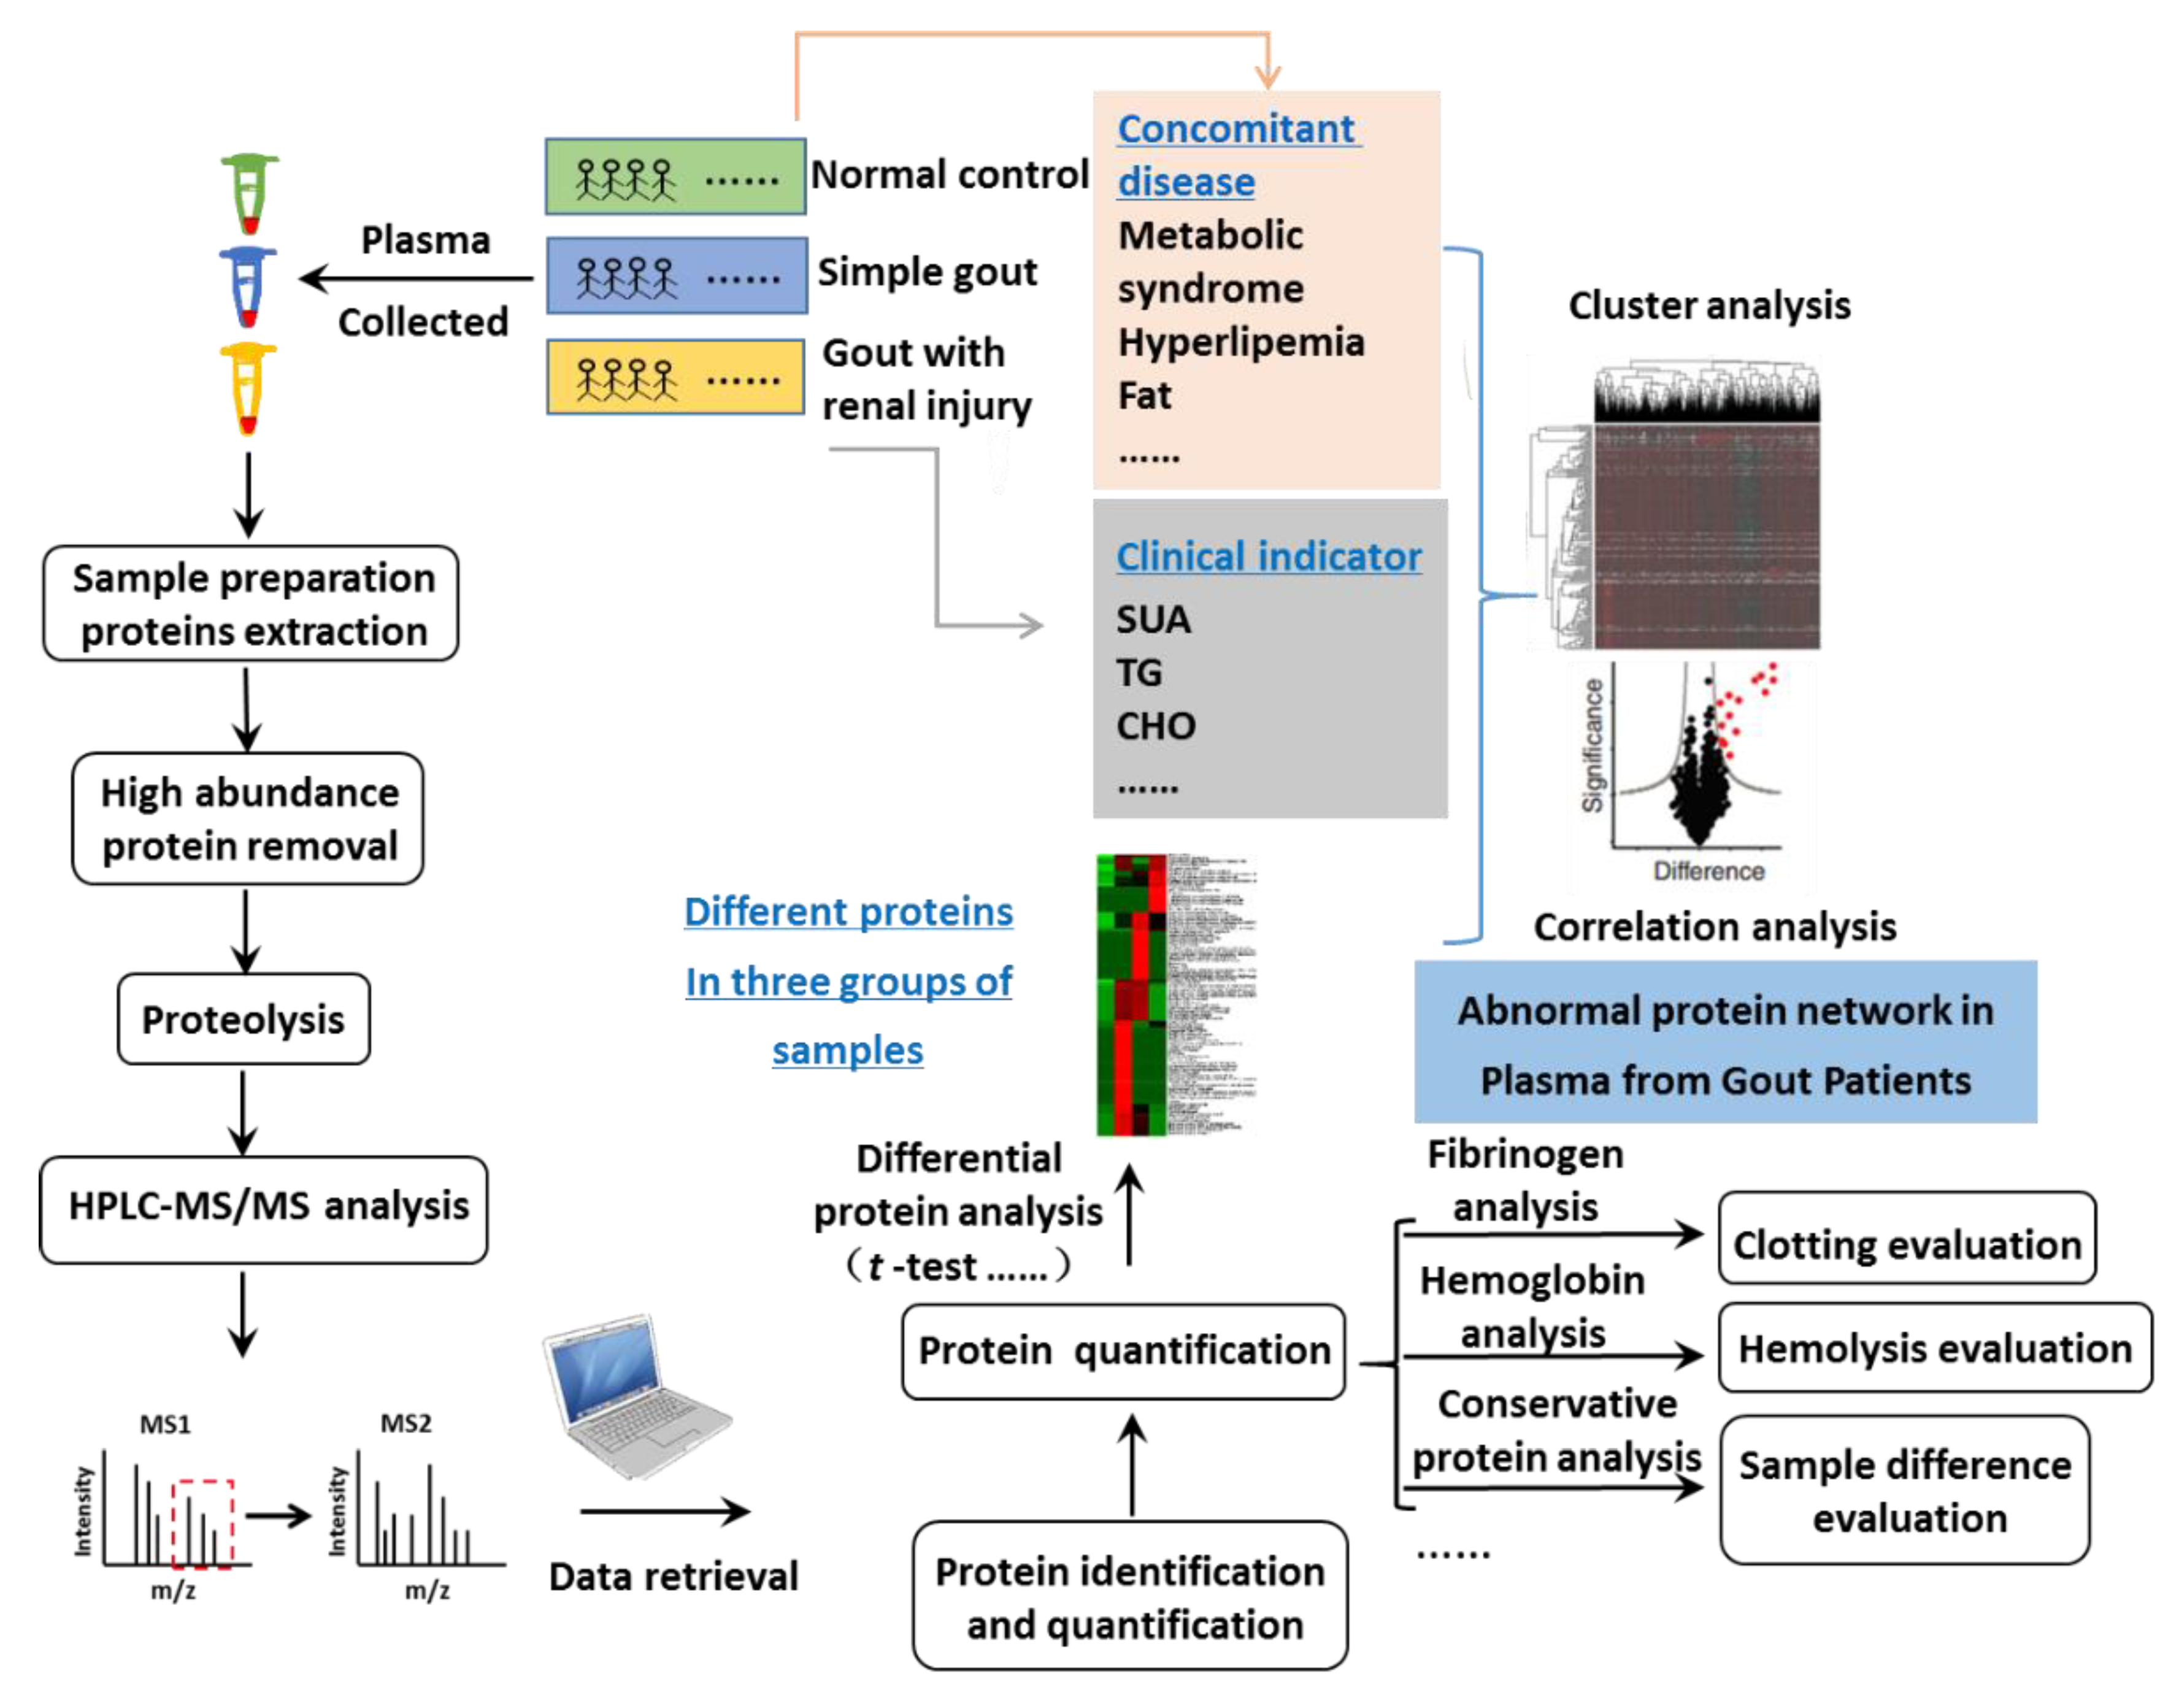
2.1. Study Design

Sixteen patients with primary gout (non-acute stage) were collected in 2017 from the Gout Department of Tianjin Medical University Metabolic Diseases Hospital, including 8 male gout patients (G) and 8 male gout patients combined with renal injury (GN). At the same time, 8 samples from male health examinations in the center acted as a normal control group (NC); all of them had no history of gout, hyperuricemia, and kidney disease.
The diagnostic criteria for gout are based on the 2015 ACR/EULAR gout classification criteria. Participation in the investigation was voluntary.

2.2. Methods

2.2.1. The Plasma Sample Collection and Highly Abundant Protein Depletion

The fasted overnight blood samples were collected from 8 non-gout subjects as the normal control group (NC), 8 male gout patients alone (G), and 8 male gout patients combined with renal injury (GN). Then the collected blood samples were centrifuged for 10 min at 4 °C at 2500 rpm, and the upper plasma samples were stored at −80 °C.
For LC-MS/MS analysis, the highly abundant proteins of plasma were depleted using an Albumin/IgG removal column (Merck, Germany) according to the manufacturer’s protocol. Briefly, 35 μL plasma mixed with 315 μL Binding Buffer was loaded into the activated columns, then we collected the effluent from the column as the plasma sample removed the highly abundant proteins.

2.2.2. Plasma Protein Sample Preparation

The plasma protein concentration was determined by the BCA method (Thermo Fisher Scientific, Waltham, MA, USA), Each plasma sample (about 100 μg) was dried and then the proteins were dissolved in 30 μL 50 mM NH4HCO3. After 20 min of denaturing on ice, the samples were diluted by 150 μL 50 mM NH4HCO3. Next, tryptic digestion (Promega, Madison, WI, USA) with 1: 50 (w:w) enzyme to substrate ratio was carried out at 37 °C, overnight. We then added 0.9 μL 1M dithiothreitol solution into the resulting peptides and the mixture was incubated at 56 °C for 1 h. After cooling to room temperature, the peptides were alkylated by 5.4 μL 500 mM iodoacetamide in a dark room for 45 min. After 5.4 μL 500 mM cysteine was added into the peptide mixture for 30 min, the trypsin with 1:100 (w:w) enzyme to substrate ratio was added and incubated for 4 h. The digestion was terminated by adding 10 μL 10% (v/v) trifluoroacetic acid (TFA) and the portion of resulting peptides (about 2 μg) were dried, and cleaned with U-C18 ZipTips (Millipore Corp.) according to the manufacturer’s instructions. Briefly, the column was first activated with 100% acetonitrile, transited with 50% acetonitrile, and balanced with 0.1% TFA. Then, the sample was loaded and the column was desalted with 0.1% TFA. Next the column was eluted with 50% acetonitrile, and finally, the elution was dried for nano-HPLC/mass spectrometric analysis.

2.2.3. LC-MS/MS Analysis

Analysis was performed in triplicate. Each sample of peptides was reconstituted in 7 µL of HPLC buffer A (0.1% (v/v) formic acid in water), and 5 µL was injected into a Nano-LC system (EASY-nLC 1000, Thermo Fisher Scientific, Waltham, MA, USA). Each sample was separated by a C18 column (50 μm inner-diameter × 15 cm, 2 μm C18) with a 120 min HPLC-gradient (linear gradient from 2 to 35% HPLC buffer B (0.1% formic acid in acetonitrile) for 110 min, and then to 90% buffer B for 10 min). The separation was carried out at 19 °C and the HPLC elution was electrosprayed directly into an Orbitrap Q-Exactive mass spectrometer (Thermo Fisher Scientific, Waltham, MA, USA). The source spray voltage was set at 1.8 kV and the capillary temperature was set at 320 °C. The mass spectrometric analysis was carried out in a data-dependent mode with an automatic switch between a full MS scan and an MS/MS scan in the orbitrap. For the full MS survey scan, the automatic gain control (AGC) target was 3 × 10⁶ scan range was from 350 to 1750 with a resolution of 70,000. The 15 most intense peaks with charge state 2 and above were selected for fragmentation by higher-energy collision dissociation (HCD) with a normalized collision energy of 27%. The MS2 spectra were acquired with 17,500 resolution. The exclusion duration for the data-dependant scan was 30 s, the repeat count was 2.

2.2.4. Database Searching and Bioinformatics Analysis

Data analysis: The resulting MS/MS data were searched against UniProt database using Maxquant software (V1.5.5) with an overall false discovery rate (FDR) for peptides of less than 1%. Peptide sequences were searched using trypsin specificity and allowing a maximum of two missed cleavages. Label-free protein quantification (LFQ).
Bioinformatics analysis: Categorical annotation was supplied in the form of gene ontology (GO) biological process (BP) and cellular component (CC). The distribution of different proteins in metabolic pathways by Kyoto Encyclopedia of Genes and Genomes (KEGG) Pathway. Protein–protein interactions were performed by STRING.

2.2.5. Validation of Identified Proteins by ELISA

Plasma samples from the normal control group, gout alone, and gout with renal injury were tested using Human GS (Gelsolin) ELISA kit (Elabscience Biotechnology Co., Ltd., Wuhan, China). The ELISA protocols provided by the manufacturers were strictly followed. For the ELISA, the plasma samples (diluted 1:4) were placed in wells coated with a GS antigen and incubated for 1.5 h at 37 °C. After a wash to eliminate the non-associated components, an anti-GS/peroxidase conjugate was added, and the plates were incubated for 1 h at 37 °C. Following the addition of the stop solution, the optical density was measured at 450 nm using a multimode reader (Thermo, USA).

2.2.6. Statistical Analysis

All data were expressed as mean ± S.D. Statistical analyses were performed using t-test of two independent samples with the measurement data. And p < 0.05 was considered statistically significant.

3. Results

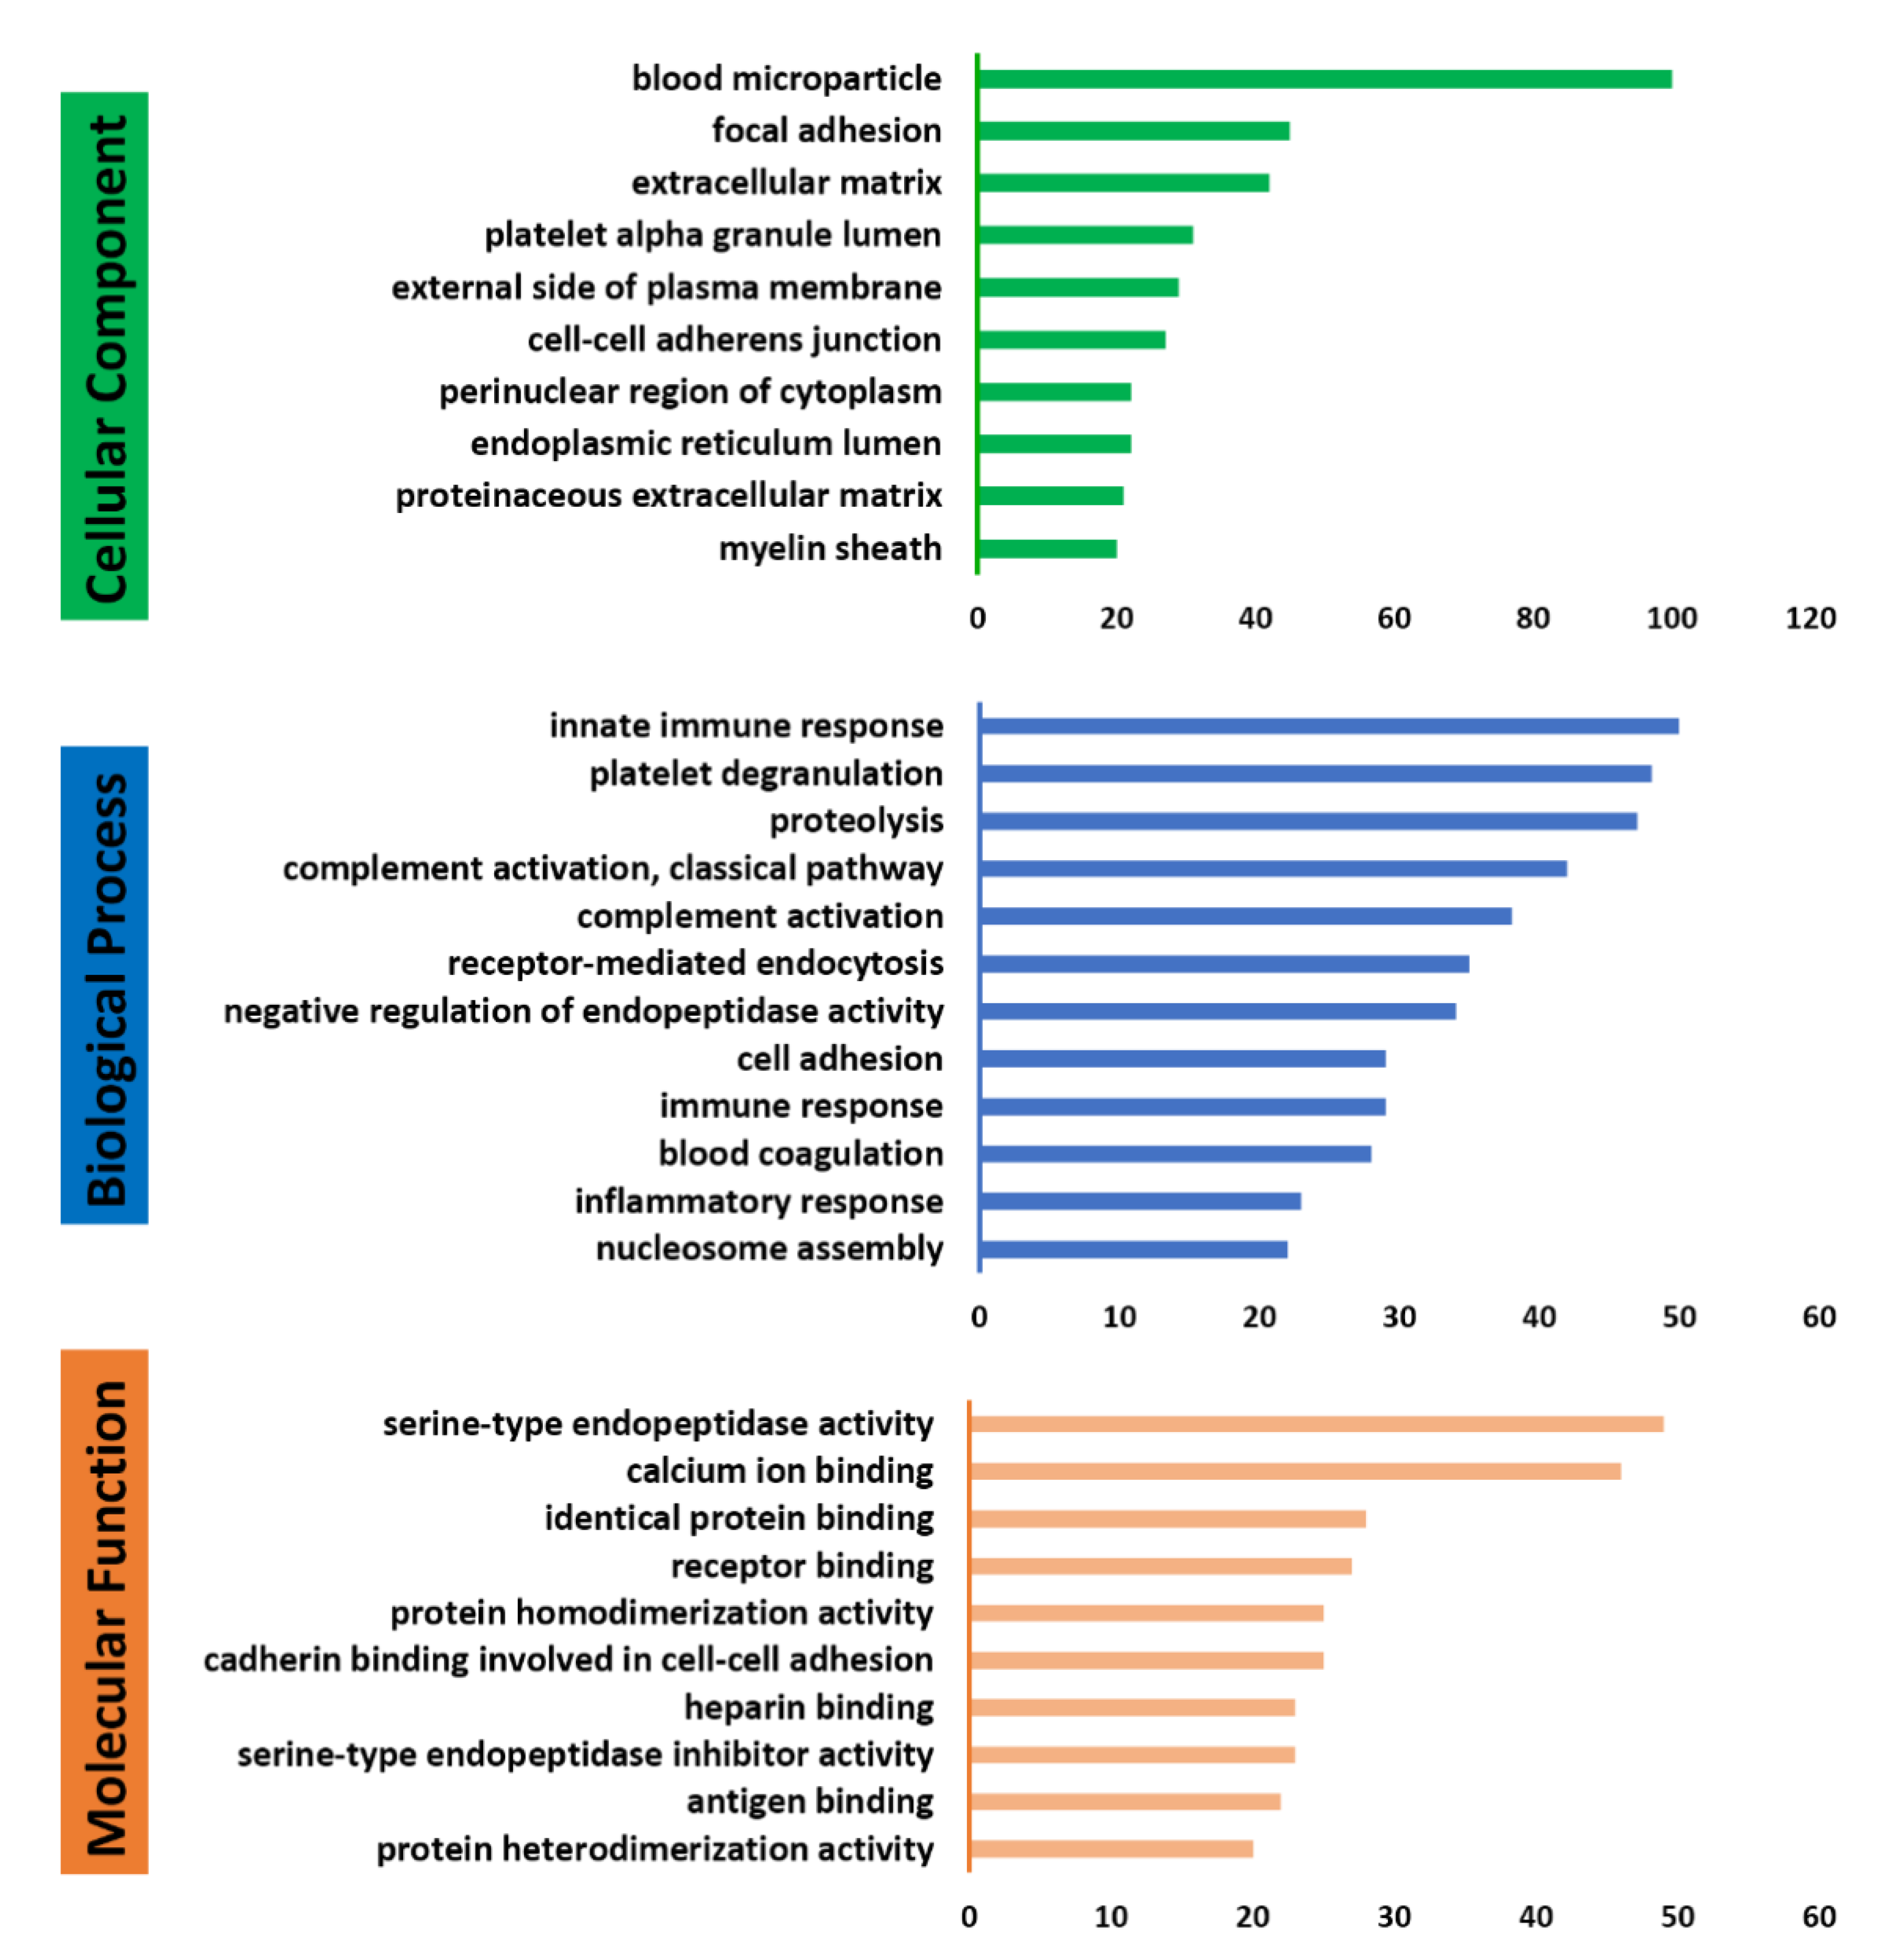
3.1. Profile of Plasma Proteomes in Gout Study

To obtain the profile of proteins in the gout study, we took plasma samples from 16 patients with gout (including 8 patients with gout alone and 8 patients with gout accompanied by renal injury) and from 8 normal people, and thus the formed three groups of samples. The basic clinical data from gout patients was collected to analyze the relationship between differential proteins and gout pathology, as shown in Table 1 and Table 2. To achieve the depth analysis of proteomes, we performed the deletion of the abundant plasma proteins by using Albumin/IgG removal column separation. The purified proteins were subjected to in-solution tryptic digestion, subsequently resulting peptides were separated and analyzed by LC-MS/MS. The raw data was further analyzed using Maxquant software and bioinformatics tools (Figure 1).
To obtain accurate quantification, we analyzed triplicates of 24 plasma samples. Finally, 314 proteins were identified in the normal control group, 303 proteins were identified in the gout group, 283 proteins were identified in the gout with kidney injury group; 369 proteins (subtracting contaminants such as keratins) were identified in three groups. These proteins were mainly located in blood particles, adhesive plaques, extracellular matrix, etc., and participated in innate immune response, platelet degranulation, protein hydrolysis, and the classical activation pathway of complement (Figure 2).
On the basis of quantitative proteomics, our measurements contained much important information about the samples. For instance, we use fibrinogen, which has a coagulation function, as the basis for the evaluation of coagulation. Of the 24 plasma samples we measured, there was no significant difference in fibrinogen FGA, FGB, and FGG in 24 individuals (Figure 3A). To see if the sample had hemolytic events, we used high abundance hemoglobin as the evaluation index. There was no significant increase in the expression of hemoglobin HBA1, HBB, HBD, and CA1 in the 24 individuals, as shown in Figure 3B. These results suggest that there was no obvious coagulation and hemolysis in these samples and excellent sample handling procedures throughout the study.

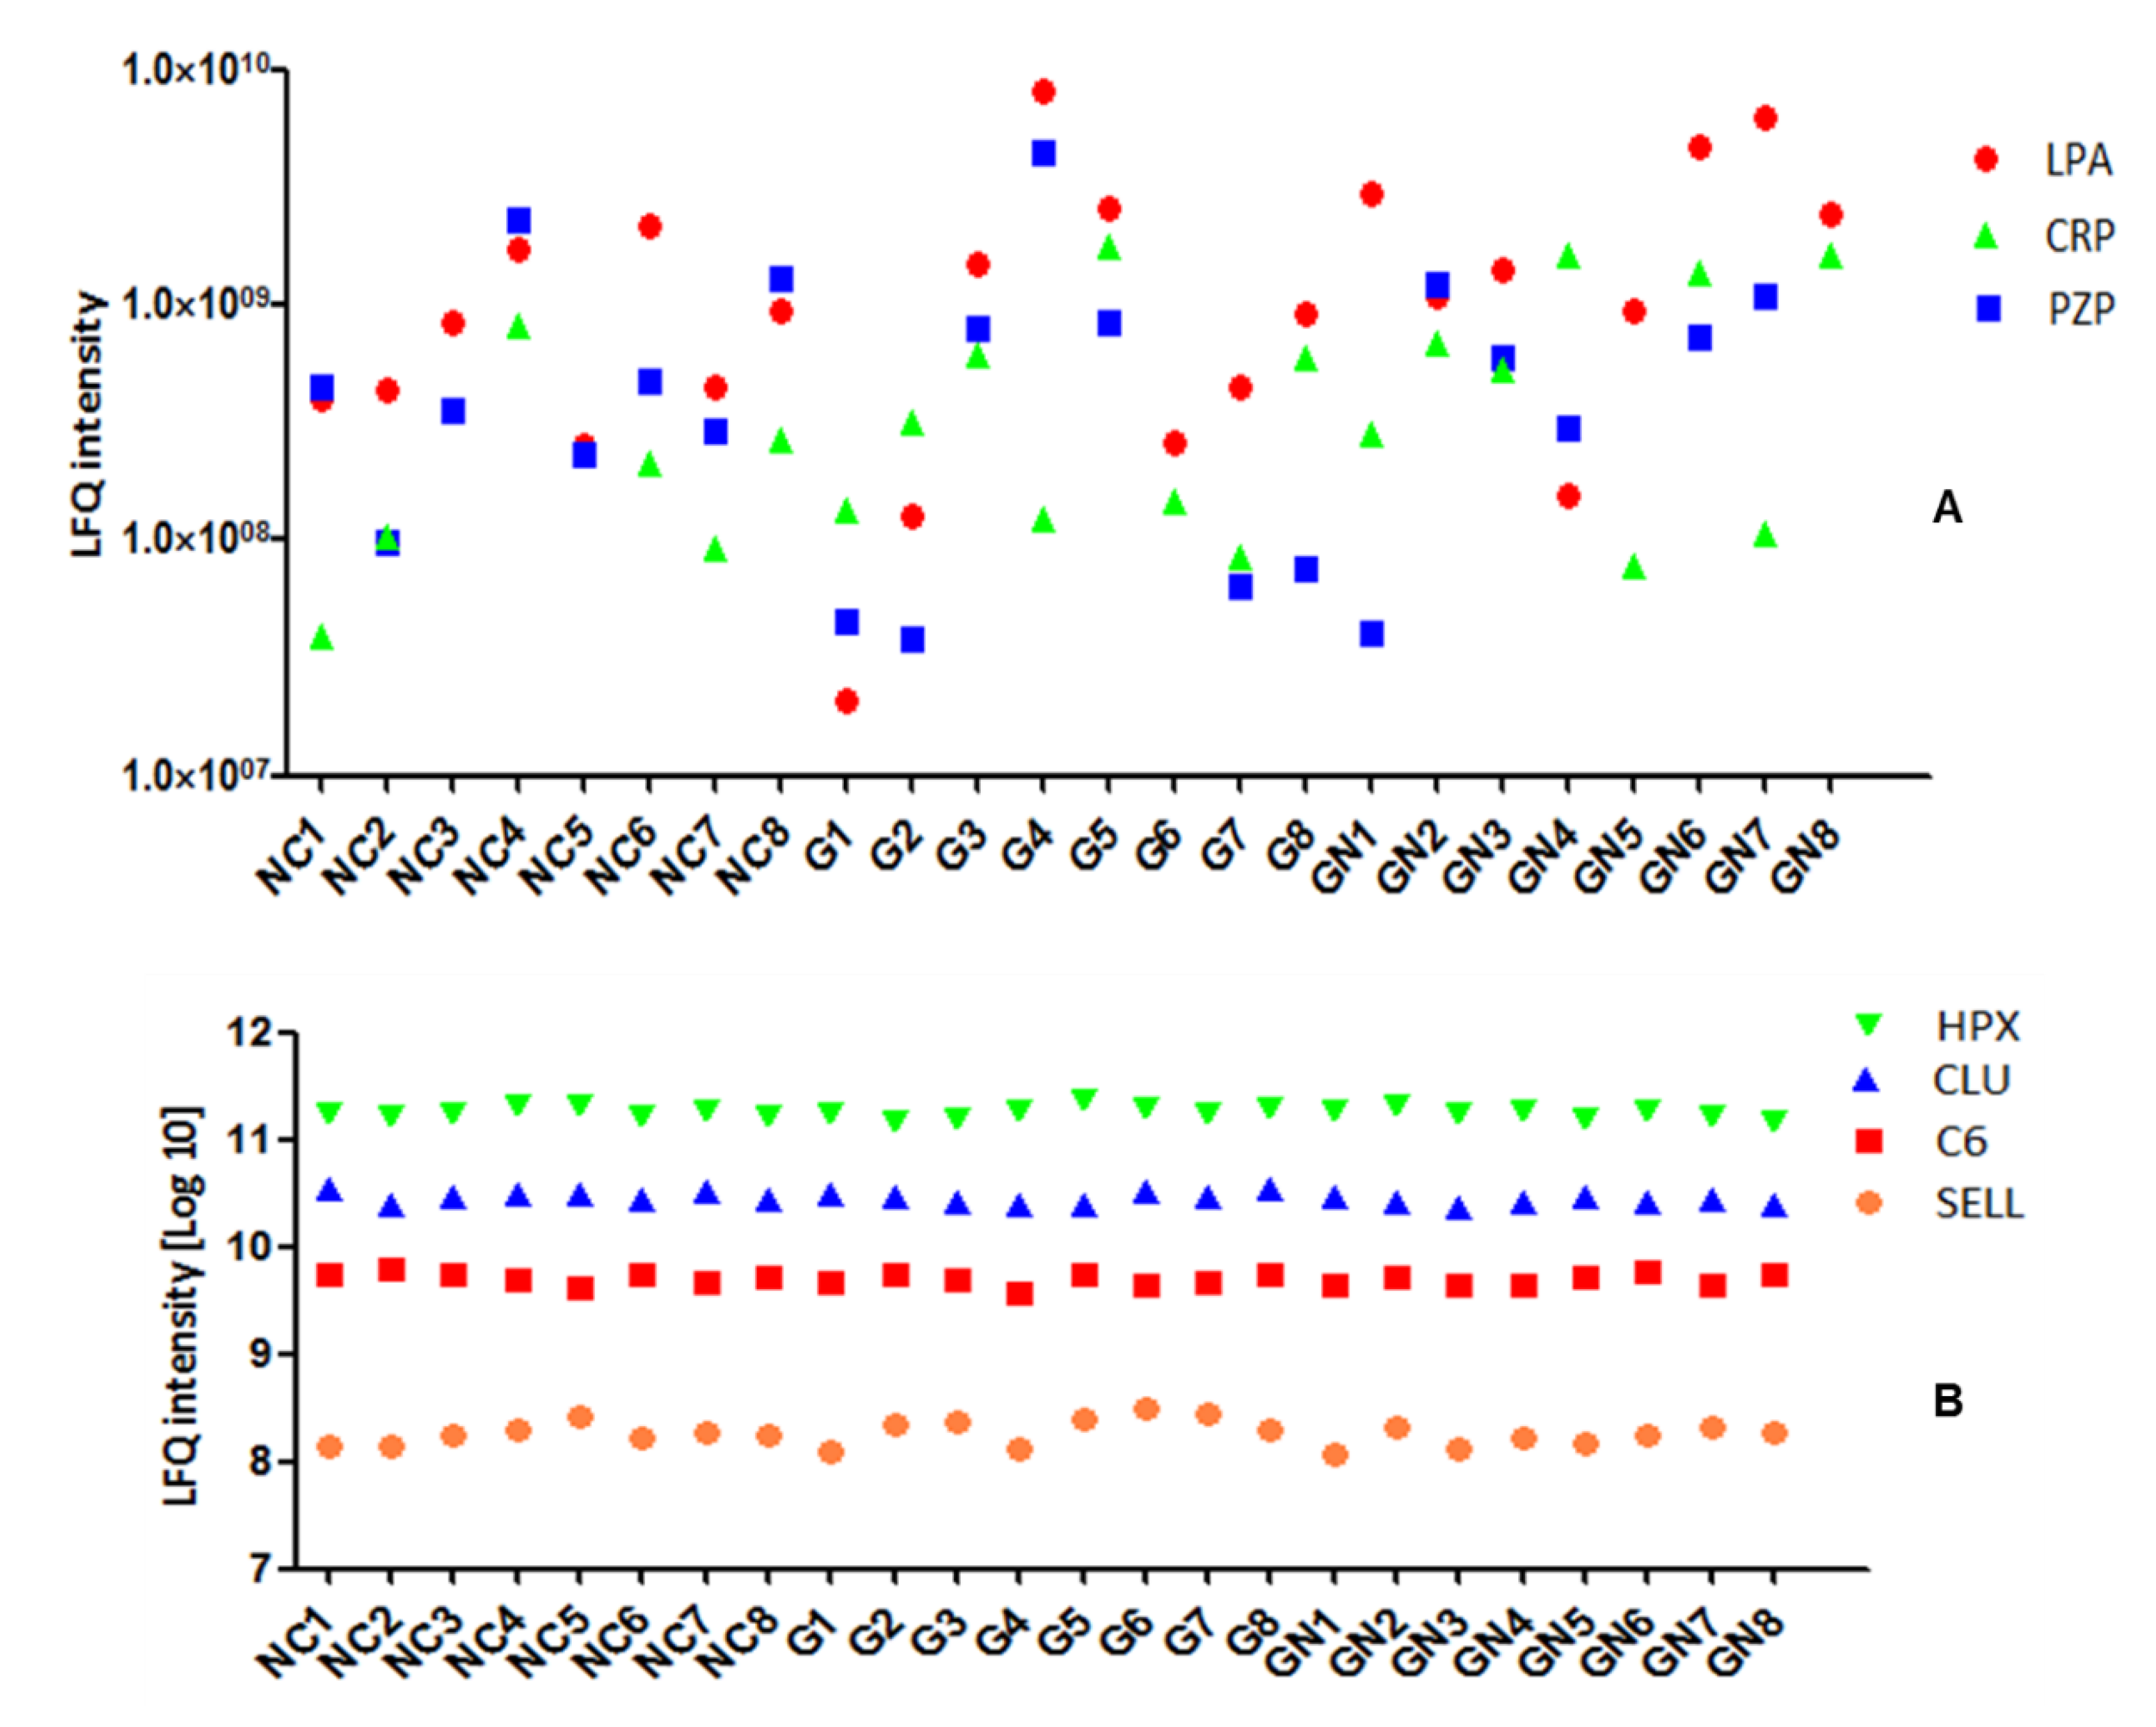
3.2. Plasma Protein Levels Are Individual-Specific

Overall, protein levels tended to vary considerably between participants; it is believed to one of the main problems in proteomics analysis. In our analysis, lipoprotein(a) (LPA), C-reactive (CRP), and pregnancy zone protein (PZP) were 10 times higher in some individuals compared to others (Figure 4A). A total of 83 proteins were detected in a single individual. The differences among some proteins are very low, such as hemoglobin binding protein (HPX), complement factor C6, cluster protein (CLU), and L-selectin (SELL), which showed that biology attributes of samples were highly conserved (Figure 4B).

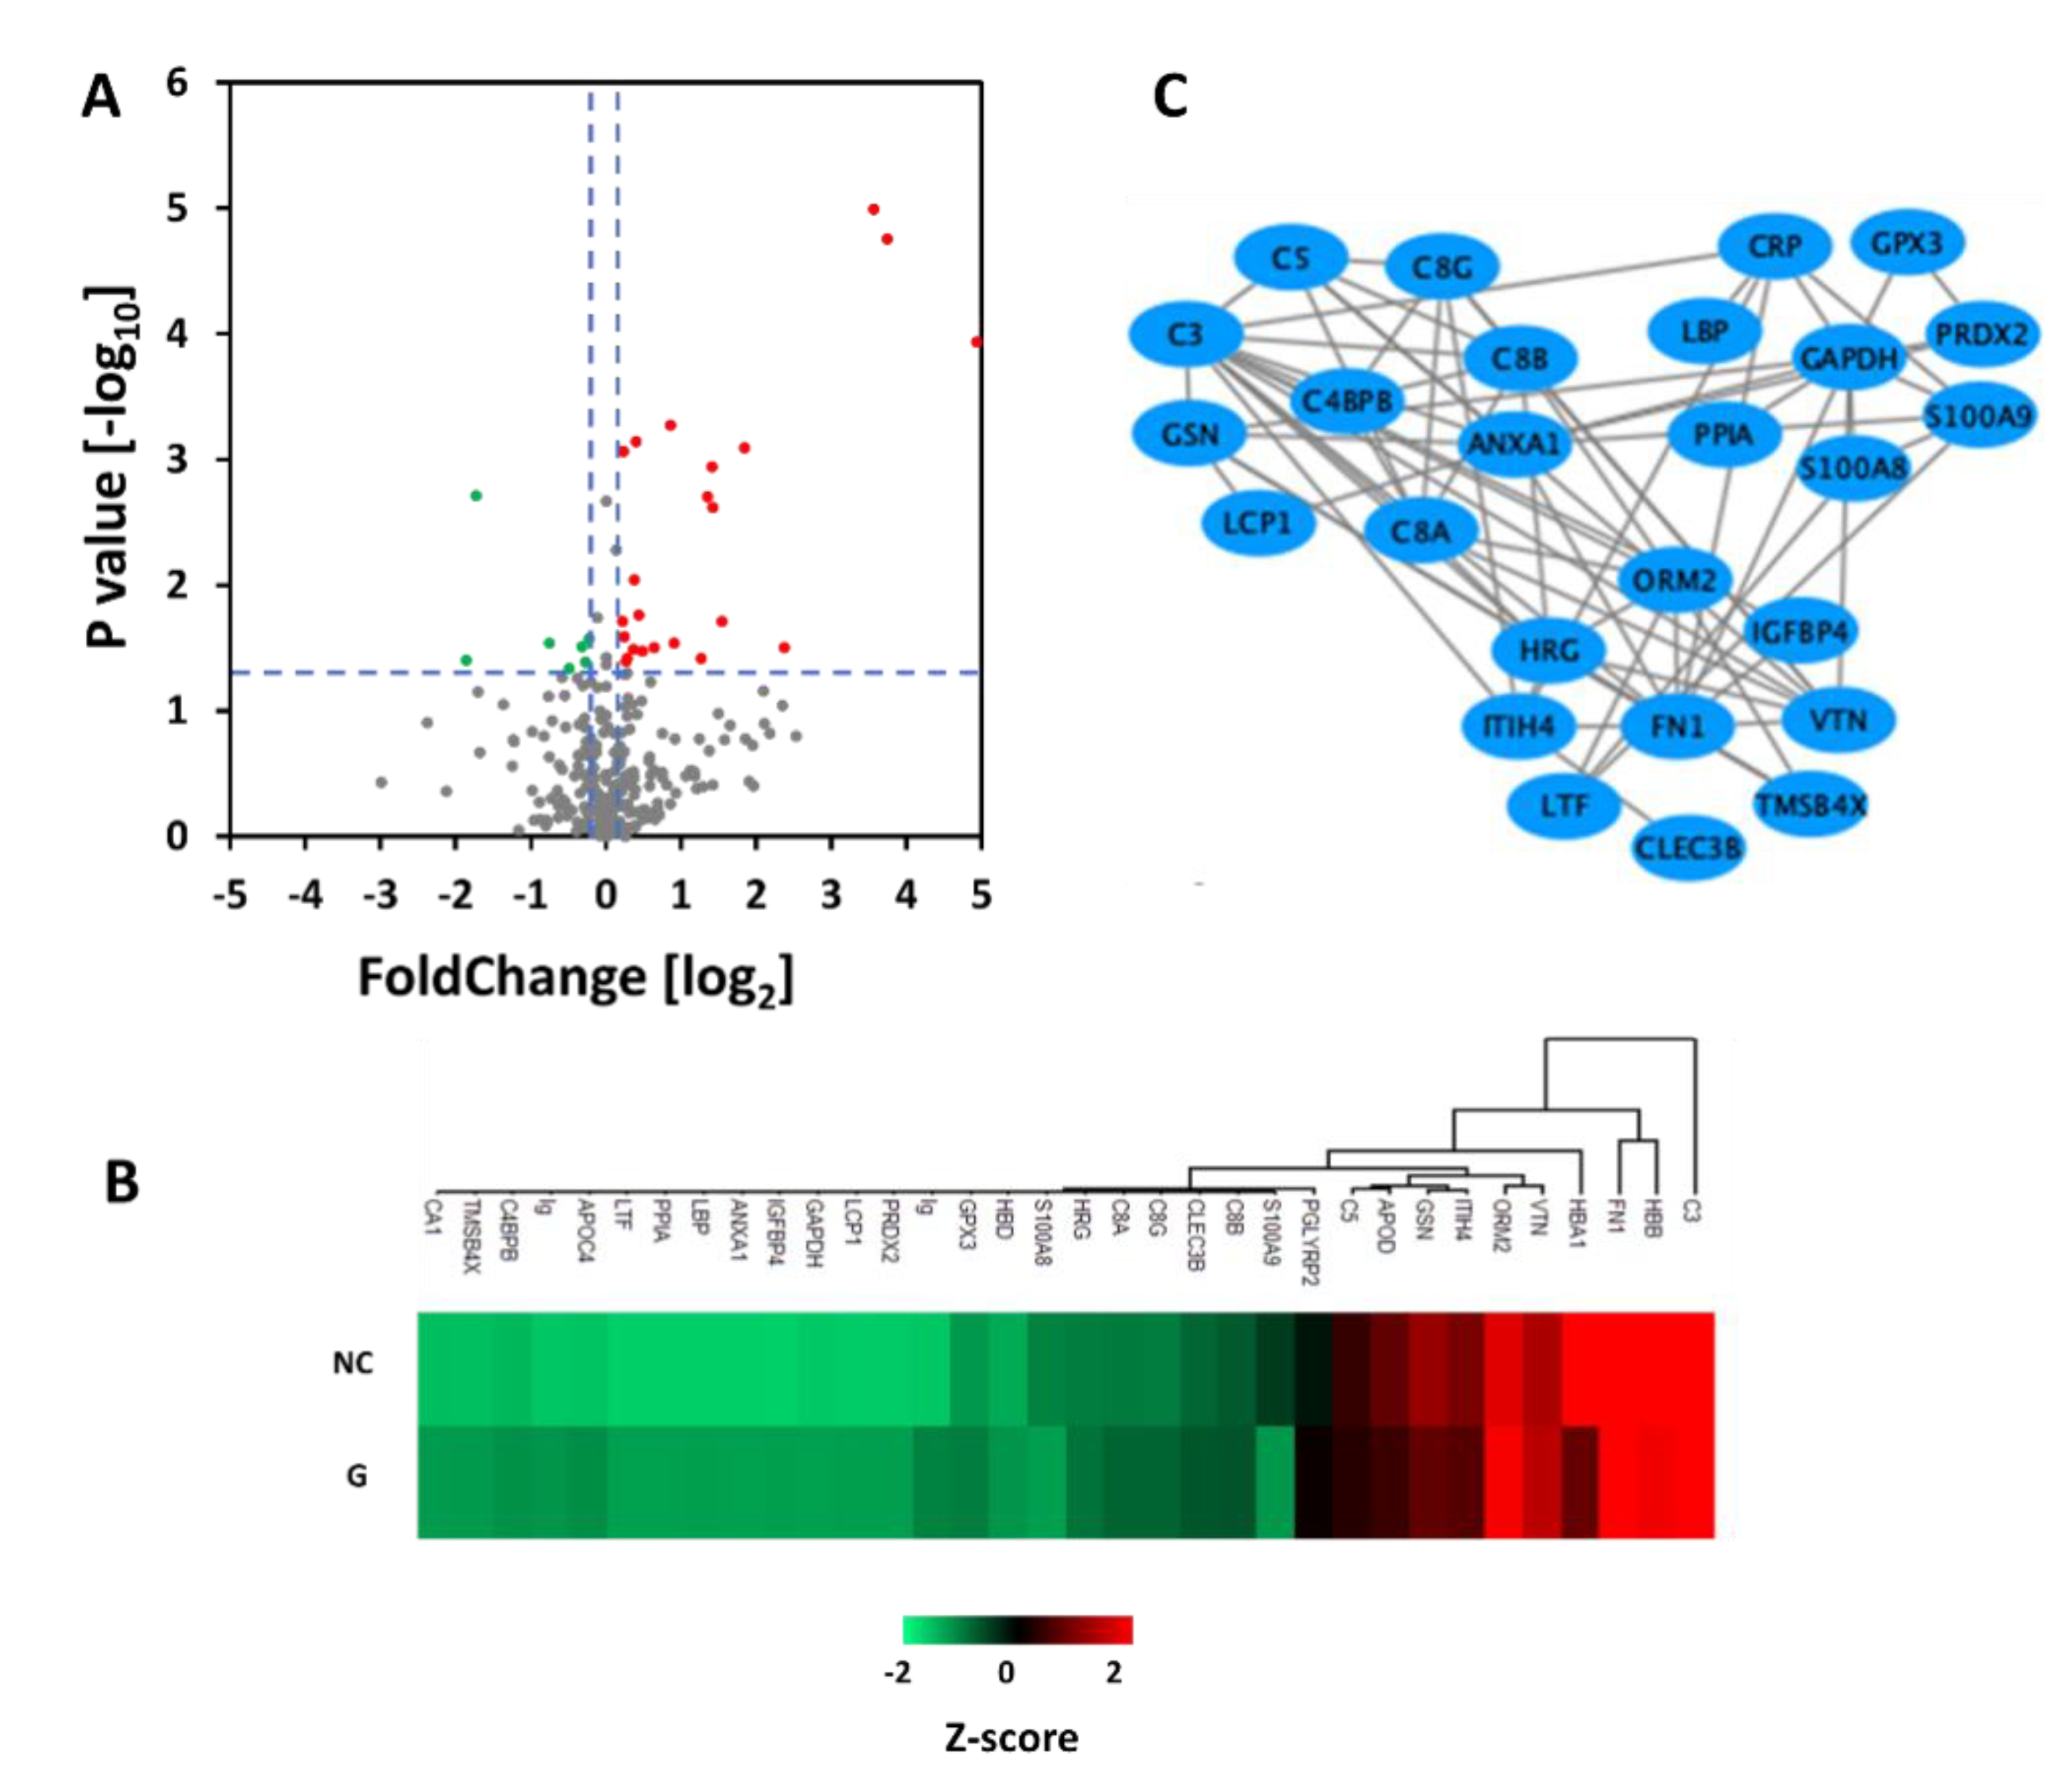
3.3. Comparison of Proteins in Plasma between Normal Control Group and Gout Group

To study the abnormal proteins in plasma from gout patients, we compared plasma proteins between the normal control group and gout patient group. Two independent sample t-test methods were used (p < 0.05), and thus 32 differential proteins were identified (Table 3). Compared with the control group, the gout patient group had a comprehensive effect on the blood plasma proteome profile, with 22 decreased and 10 increased protein levels (Figure 5A). According to their function, these proteins were clustered into five groups (Figure 5B). Group 1 comprised of glycolipid proteins and cellular activity proteins. They were mainly apolipoproteins (APOC4, APOD) and GAPDH, VTN, GSN, FN1, and TMSB4X. Group 2 comprised of the complement (C3, C4BPB, C5, C8B, C8A, and C8G). Group 3 comprised of enzymes (LTF, CA1, PPIAP, and GLYRP2). Group 4 comprised of oxidative damage and inflammatory markers (S100A8, S100A9, PRDX2, ORM2, GPX3, CRP, and ANXA1). Group 5 comprised of other functional proteins (ITIH4, IGFBP4, CLEC3B, LBP, Ig, and LCP1). The interaction networks analysis further showed that the 32 differential proteins wre closely related (Figure 5C).

3.4. Comparison of Proteins in Plasma between Gout and Gout with Renal Injury

To further explore the functional effect of plasma proteins on gout development, among the gout patients, we compared plasma proteins between patients with gout alone and patients with renal injury. Using two independent samples t-test method (p < 0.05), we found 10 differential proteins (Table 4). The results show that the expressions of plasma complement C4A, C4B, and SERPINF1 in patients with gout accompanied by renal injury are significantly increased than those of patients with gout alone.

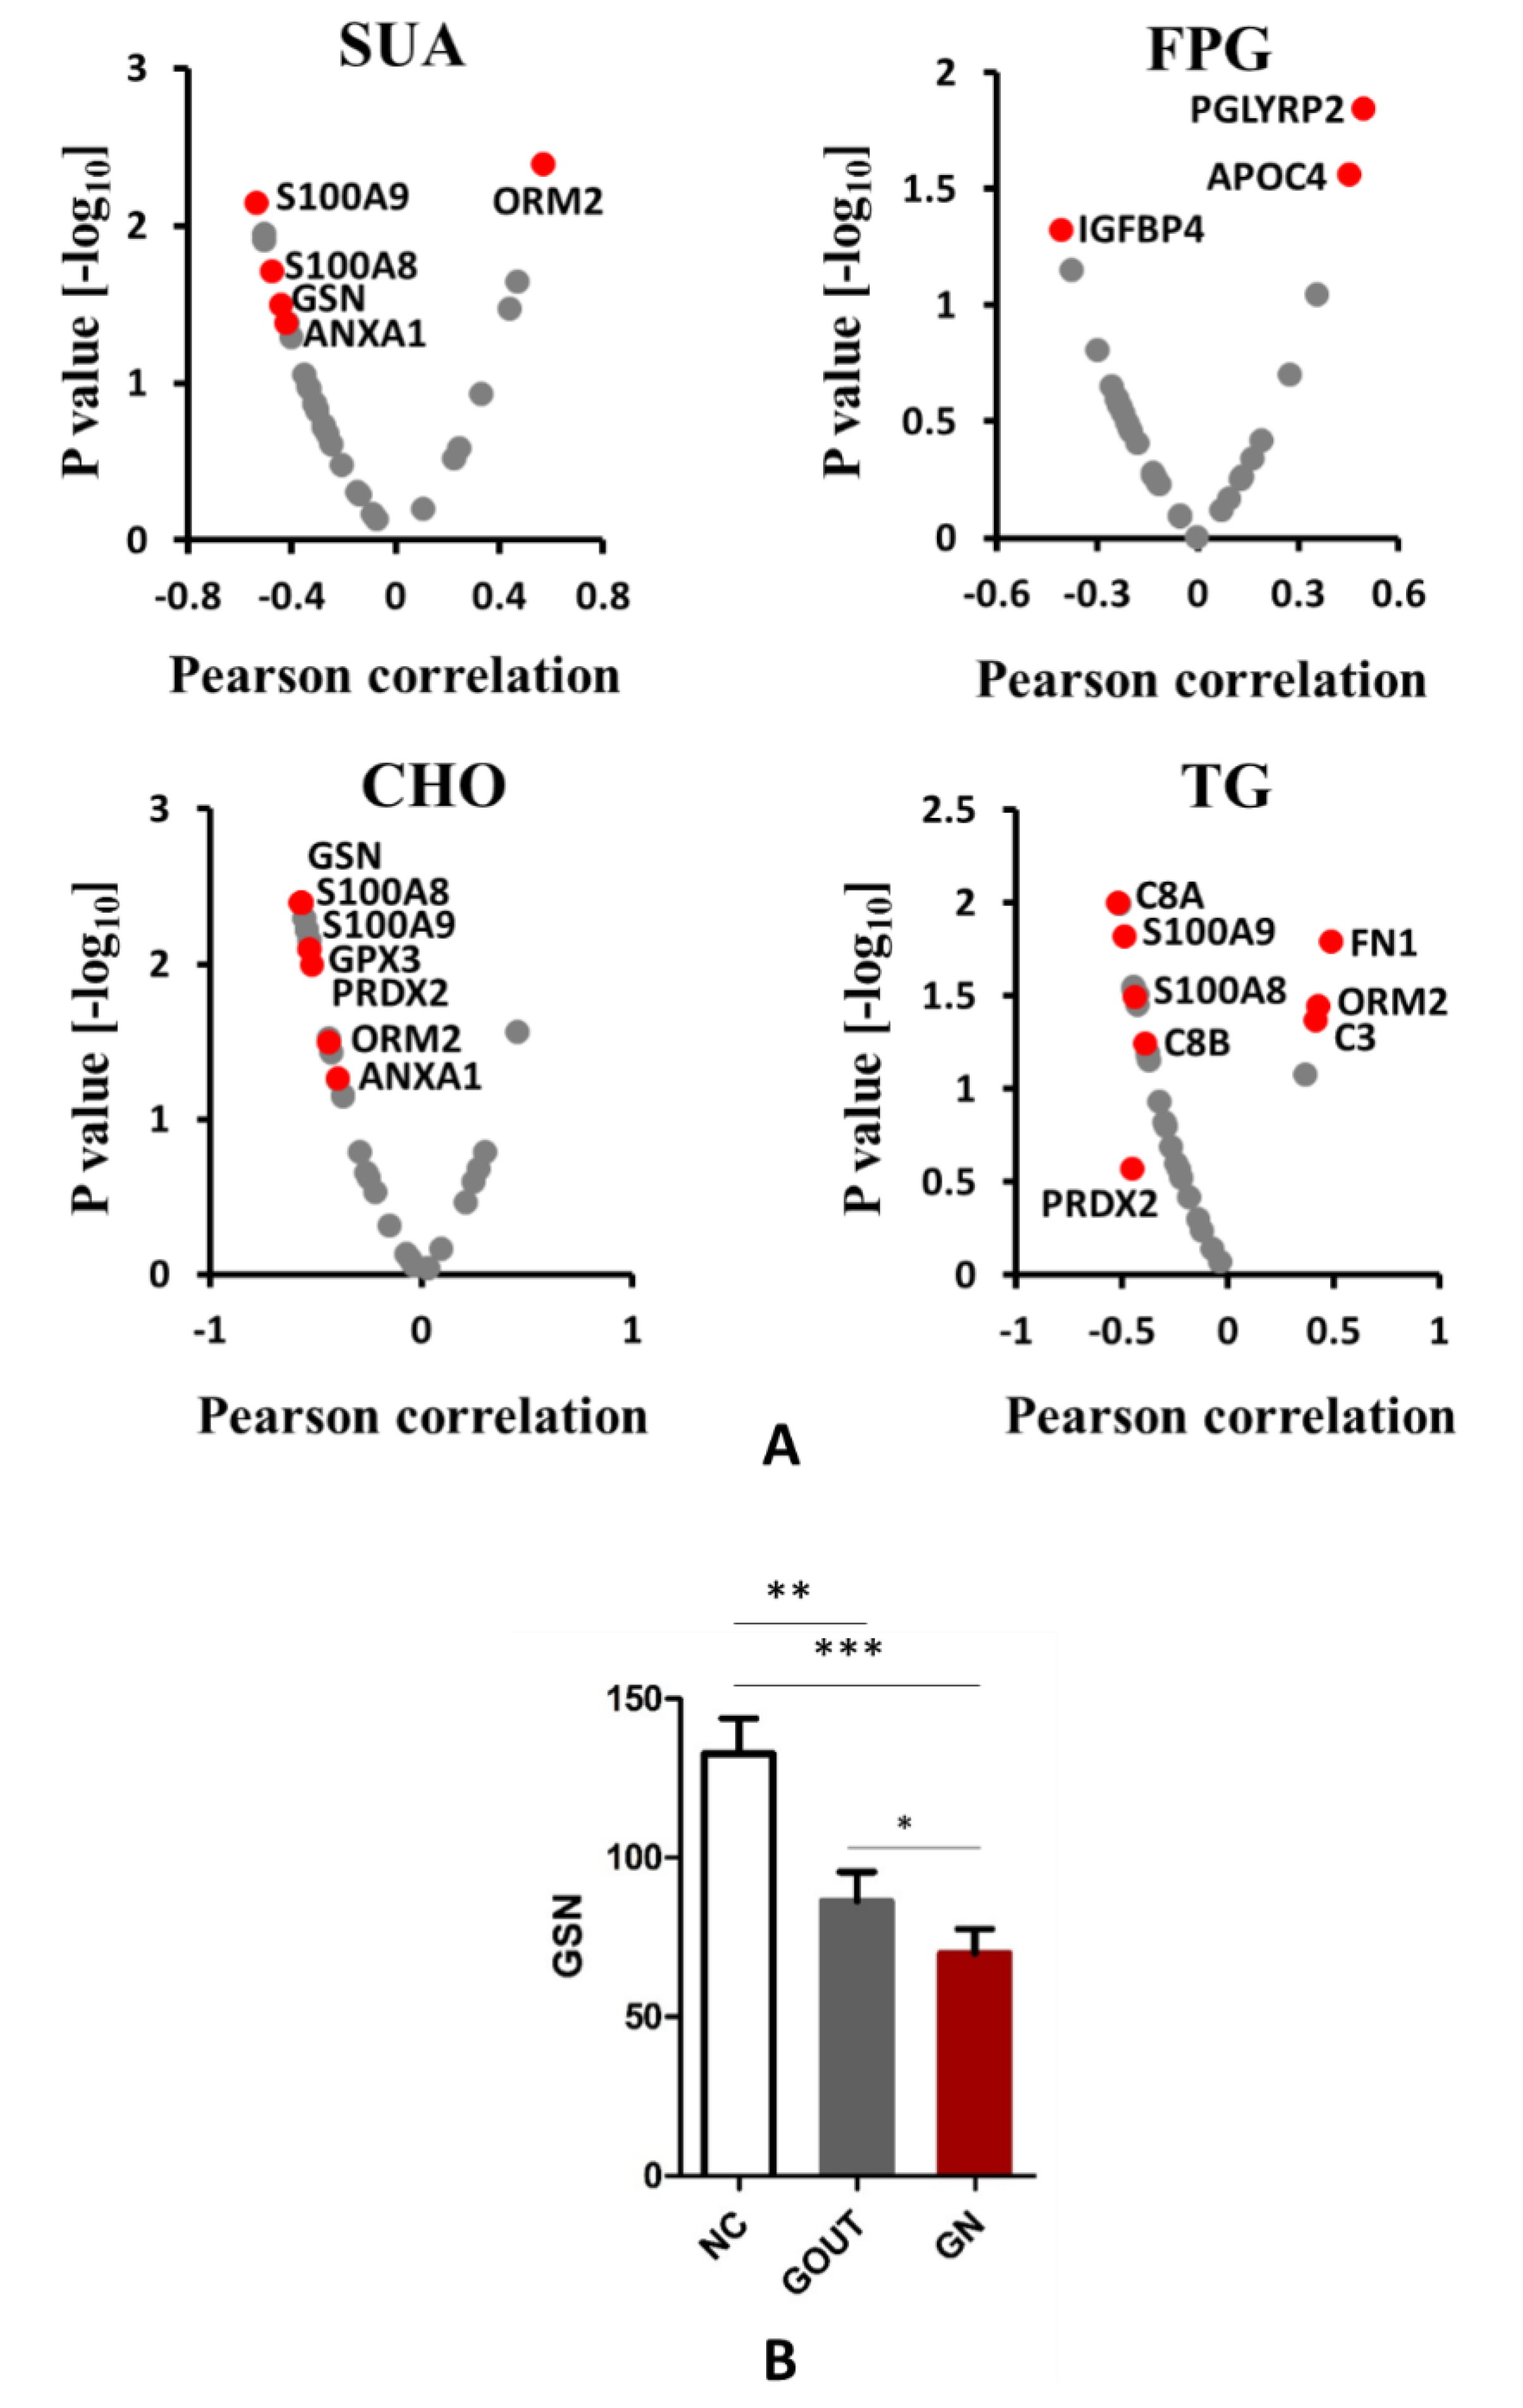
3.5. The Relationship between Plasma Protein and Clinical Biochemical Indexes

Next, the quantified plasma proteins were correlated with classical laboratory parameters, including serum uric acid (SUA), eGFR, Cr, BUN, FPG, BMI, CHO, TG, and ALT. Remarkably, of all proteins in our data, the five proteins most significantly correlating with SUA were inflammation factors Gelsolin (GSN), S100A8, S100A9, ORM2, and ANXA1. For each, the p-value was lower than 0.05 and Pearson correlation coefficients ranged from 0.4 to 0.6. GSN, S100A8, S100A9, and ANXA1 were negatively correlated with serum uric acid. Secondly, the proteins significantly related to CHO were CRP, GSN, S100A8, S100A9, ORM2, ANXA1, PRDX2, and GPX3. Pearson’s correlation coefficient was 0.4–0.7. Thirdly, the proteins significantly related to TG were S100A8, S100A9, ORM2, PRDX2, C3, C8A, C8B, and FN1. Pearson’s correlation coefficient was 0.3−0.6 (Figure 6A). These data showed the functional abnormal proteins of gout plasma and thus indicated potential markers of plasma for clinical analysis.

3.6. Validation of GSN in Individual Subjects

To validate the accuracy of our LC-MS/MS results, a key protein, GSN, was selected for further study by ELISA. Consistent with the results of the data in the Table 3 and Figure 6A, the protein level of GSN was significantly downregulated in the gout groups compared with the normal control group (Figure 6B).

4. Discussion

Clinical analysis of blood is the most widespread diagnostic procedure in medicine [10]. As one of the largest subgroups of the human proteome, plasma proteomics has attracted more and more attention. LC-MS/MS has become a powerful technique in biological research, which will make the study of proteomics in-depth.
There are many kinds of proteins in human plasma, which not only contain a lot of albumin and immunoglobulin, but also contain some low concentration proteins. Because of the existence of high abundance proteins (especially albumin) in plasma samples, they have a strong shielding effect on the separation and analysis of low abundance proteins derived from tissue protein release and cell destruction. While the identification of some low-concentration proteins is also of important biological significance. In our experiment, we removed the albumin high abundance protein from the plasma and laid a good foundation for follow-up experiments. On the basis of qualitative and quantitative analysis of proteomics, our measurements contained additional information. We analyzed and determined the coagulation and hemolysis events of blood samples, so as to ensure reasonable sample treatment and reliable test analysis results.
In the course of human evolution, uric acid becomes the terminal product of purine metabolism in the human body due to the mutation of the uric acid gene. In normal people, the majority of uric acid exists in the form of urate. If the body produces too much uric acid or excretes too little, it will lead to hyperuricemia. At present, the prevalence of hyperuricemia is increasing. According to a 2014 study, the adjusted prevalence of hyperuricemia among Chinese adults in 2009–2010 was 8.4–13.3% [6]. For every 60 umol/L increase in uric acid, the risk of kidney disease increased by 7 or 11% [11]. Hyperuricemia is the most important biochemical basis of gout. Recently, with the increase of social affluence and the change of diet structure, gout has become popular all over the world; the prevalence rate of gout in China is 1–3%. Gout can be characterized by gouty arthritis, gouty stones, urinary acid kidney stones, and gouty nephropathy. About one-third of patients with primary hyperuricemia and gout have renal complications. At present, there are few studies on the pathogenesis of renal disease caused by urate crystals. Although many factors related to gout have been identified, the overall mechanism of gout is extremely complicated, so specific causes of gout are still unclear. In the past few years, proteomics techniques based on mass spectrometry have made significant advances [12] and studies at the proteome level will help us to better understand the changes in the mechanisms associated with gout. Based on this, it is very important to study the difference of plasma proteins in patients with gout and even patients with gout nephropathy by using the protein identification technique of mass spectrometry, so as to explore the possible pathogenesis of gout.
In this experiment, we integrated the techniques of high abundance protein removal and proteomics analysis, combined with bioinformatics and statistical tools, developed a plasma proteome analysis strategy. Seventy-two plasma proteomes were successfully measured from 24 individuals to reveal the changes of plasma proteins in patients with gout. The proteome covers deeper—about 300 proteins per individual—and covers many clinically related proteins and inflammatory markers, as well as many other functional proteins, meeting the qualitative and quantitative requirements of plasma proteins.
Uric acid has been shown to be involved in oxidative stress through two mechanisms: NADPH oxidase activation and NO bioavailability reduction. In cells, elevated serum uric acid leads to oxidative stress, which in turn leads to the release of inflammatory factors and the activation of inflammatory pathways. In our study, 32 proteins and 10 proteins were identified differentially expressed in the normal control group and gout group, and gout and gout with renal injury, respectively. It was found that many proteins in patients with gout were changed, including complement, markers of inflammatory damage, etc., and even some proteins related to the severity of the disease were also changed, such as the up-regulation of CRP and down-regulation of Gelsolin (GSN), etc., indicating increased oxidative stress and systemic inflammatory response in patients with gout.
In addition, plasma proteins were associated with clinical biochemical markers for further study. We found that many inflammatory factors are significantly correlated with SUA, such as GSN, S100A8, S100A9, ORM2, and ANXA1.
GSN, an 80–85 kDa calcium-dependent multifunctional actin-binding protein, is a protein of the gelsolin superfamily encoded on human chromosome 9 [13,14,15]. GSN has three known isoforms, cytoplasmic GSN (cGSN), plasma GSN (pGSN), and gelsolin-3. pGSN is the extracellular isoform and is an abundant protein in plasma and plasma gelsolin is the main scavenger system for the toxic effects of actin filaments. Many factors, including pH, calcium levels, phosphoinositides concentration, and temperature regulate the gelsolin action [16]. A major proportion of pGSN is secreted by smooth, skeletal, and cardiac muscle cells. pGSN, composed of about 800 amino acids, is highly identical in all elements, including the structure and function among mammals. The circulating concentration of pGSN in human plasma varies from 200–300 mg/L and has been shown to exhibit a half-life of 2–3 days in humans [17].
Gelsolin is involved in the immune response and is considered an anti-inflammatory modulator. Plasma gelsolin can trigger an anti-inflammatory response by binding to the pro-inflammatory mediators; it also improves macrophages’ functions via activating the nitric oxide synthase. The depletion of gelsolin causes damage in the immune cells with subsequent inflammatory mediator release. Plasma gelsolin levels’ reduction was first detected in tissues damaged by trauma. Then, for GSN, it was established that the level of pGSN declines in a variety of ailments such as inflammation, type 2 diabetes, trauma, sepsis, rheumatoid arthritis, and multiple sclerosis, fibroblasts, and smooth and skeletal muscle cells [16,17,18,19]. In CKD, low pGSN levels are detectable in hemodialysed blood. This reduction is explained by many theories, such as “lower production, redistribution to the inflammation site, combined with other plasma proteins, or higher degradation” [15]. Indeed, there is a robust correlation between how much pGSN levels decrease and the probability of mortality [20]. Many studies have shown that reduced GSN levels can predict the severity of the disease and supplementing exogenous recombinant human gelsolin alleviated distress symptoms in many disease conditions [16]. The administration of recombinant plasma gelsolin to animal models reduced the inflammatory reaction [15]. This raised the question as to whether circulating pGSN levels can serve as a biomarker since pGSN levels correlate negatively with the degree of systemic inflammation and muscle wasting. However, the change of gelsolin in gout patients is still unclear. In our study, the serum uric acid level of patients with gout was significantly higher than that of the normal control group, and the serum uric acid level of patients with gout with renal injury was higher than that of patients with gout alone (although the difference did not reach statistical significance); the GSN level of gout patients was lower than that of the normal control group, ELISA further confirmed that the level of GSN gradually decreased with the normal control group, gout patients and gout patients with renal injury. It is suggested that the severity of the disease and the occurrence of complications may play a warning role. Thus, this work preliminarily investigated the change of gelsolin in gout patients. Our findings support further investigation of pGSN as an adjunctive therapy for gout.

5. Conclusions

In this study, we identified the profile of gout plasma proteome using label-free quantitative proteomics based on HPLC-MS/MS, and found 32 significantly differential proteins in the gout group, as well as 10 proteins linked with kidney damage. These abnormal proteins were characterized to biological functions by the biological tool. Further, the correlation analysis showed that five inflammatory factors (GSN, S100A8, S100A9, ORM2, and ANXA1) had a significant correlation with SUA, and GSN was further validated in clinical samples. These results suggest that hyperuricemia can induce oxidative stress and inflammatory reaction in the cells of patients with gout by promoting oxidation. Our result provides promising candidates for a biomarker for gout.

Author Contributions

L.S. and K.Z. conceived and designed the experiments. L.S. and H.D. performed the experiments. L.S., Z.G., G.Z., and K.Z. analyzed the data. L.S. and K.Z. wrote and critically revised the manuscript. All authors have read and agreed to the published version of the manuscript.

Funding

This research was supported by funding from the National Natural Science Foundation of China to K.Z. (21874100 and 22074103) and to G.Z. (21904097), Tianjin Municipal Science and Technology Commission to K.Z. (19JCZDJC35000) and the Talent Excellence Program from Tianjin Medical University to K.Z.

Institutional Review Board Statement

The study was conducted according to the guidelines of the Declaration of Helsinki, and approved by the Ethical Committee in Tianjin Institute of Endocrinology (reference number: DXBYYhMEC2018-19).

Data Availability Statement

Data are available from the authors upon the reasonable request.

Acknowledgments

We would like to thank Bei Sun (Tianjin Medical University Chu Hsien-I Memorial Hospital & Tianjin Institute of Endocrinology) for support in ELISA analysis.

Conflicts of Interest

The authors declare no conflict of interest.

References

  1. C’abau, G.; Crisan, T.O.; Kluck, V.; Popp, R.A.; Joosten, L.A.B. Urate-induced immune programming: Consequences for gouty arthritis and hyperuricemia. Immunol. Rev. 2020, 294, 92–105. [Google Scholar] [CrossRef] [Green Version]
  2. Kuriyama, S. Dotinurad: A novel selective urate reabsorption inhibitor as a future therapeutic option for hyperuricemia. Clin Exp. Nephrol. 2020, 24, 1–5. [Google Scholar] [CrossRef] [PubMed] [Green Version]
  3. Kim, S.; Chang, Y.; Yun, K.E.; Jung, H.S.; Lee, S.J.; Shin, H.; Ryu, S. Development of Nephrolithiasis in Asymptomatic Hyperuricemia: A Cohort Study. Am. J. Kidney Dis. 2017, 70, 173–181. [Google Scholar] [CrossRef] [PubMed]
  4. Benn, C.L.; Dua, P.; Gurrell, R.; Loudon, P.; Pike, A.; Storer, R.I.; Vangjeli, C. Physiology of Hyperuricemia and Urate-Lowering Treatments. Front. Med. Lausanne 2018, 5. [Google Scholar] [CrossRef] [PubMed] [Green Version]
  5. Mena-Sanchez, G.; Babio, N.; Becerra-Tomas, N.; Martinez-Gonzalez, M.A.; Diaz-Lopez, A.; Corella, D.; Zomeno, M.D.; Romaguera, D.; Vioque, J.; Alonso-Gomez, A.M.; et al. Association between dairy product consumption and hyperuricemia in an elderly population with metabolic syndrome. Nutr. Metab. Cardiovas 2020, 30, 214–222. [Google Scholar] [CrossRef] [PubMed]
  6. Punzi, L.; Scanu, A.; Galozzi, P.; Luisetto, R.; Spinella, P.; Scire, C.A.; Oliviero, F. One year in review 2020: Gout. Clin. Exp. Rheumatol. 2020, 38, 807–821. [Google Scholar] [PubMed]
  7. Liu, H.; Zhang, X.M.; Wang, Y.L.; Liu, B.C. Prevalence of hyperuricemia among Chinese adults: A national cross-sectional survey using multistage, stratified sampling. J. Nephrol 2014, 27, 653–658. [Google Scholar] [CrossRef] [PubMed]
  8. Singh, J.A.; Gaffo, A. Gout epidemiology and comorbidities. Semin. Arthritis Rheu 2020, 50, S11–S16. [Google Scholar] [CrossRef] [PubMed]
  9. Geyer, P.E.; Albrechtsen, N.J.W.; Tyanova, S.; Grassl, N.; Iepsen, E.W.; Lundgren, J.; Madsbad, S.; Holst, J.J.; Torekov, S.S.; Mann, M. Proteomics reveals the effects of sustained weight loss on the human plasma proteome. Mol. Syst. Biol. 2016, 12. [Google Scholar] [CrossRef] [PubMed]
  10. Geyer, P.E.; Holdt, L.M.; Teupser, D.; Mann, M. Revisiting biomarker discovery by plasma proteomics. Mol. Syst. Biol. 2017, 13. [Google Scholar] [CrossRef] [PubMed]
  11. Weiner, D.E.; Tighiouart, H.; Elsayed, E.F.; Griffith, J.L.; Salem, D.N.; Levey, A.S. Uric acid and incident kidney disease in the community. J. Am. Soc. Nephrol. 2008, 19, 1204–1211. [Google Scholar] [CrossRef] [PubMed] [Green Version]
  12. Geyer, P.E.; Kulak, N.A.; Pichler, G.; Holdt, L.M.; Teupser, D.; Mann, M. Plasma Proteome Profiling to Assess Human Health and Disease. Cell Syst. 2016, 2, 185–195. [Google Scholar] [CrossRef] [PubMed] [Green Version]
  13. Martinez-Aguilar, M.M.; Aparicio-Bautista, D.I.; Ramirez-Salazar, E.G.; Reyes-Grajeda, J.P.; De la Cruz-Montoya, A.H.; Antuna-Puente, B.; Hidalgo-Bravo, A.; Rivera-Paredez, B.; Ramirez-Palacios, P.; Quiterio, M.; et al. Serum Proteomic Analysis Reveals Vitamin D-Binding Protein (VDBP) as a Potential Biomarker for Low Bone Mineral Density in Mexican Postmenopausal Women. Nutrients 2019, 11, 2853. [Google Scholar] [CrossRef] [PubMed] [Green Version]
  14. Asare-Werehene, M.; Nakka, K.; Reunov, A.; Chiu, C.T.; Lee, W.T.; Abedini, M.R.; Wang, P.W.; Shieh, D.B.; Dilworth, F.J.; Carmona, E.; et al. The exosome-mediated autocrine and paracrine actions of plasma gelsolin in ovarian cancer chemoresistance. Oncogene 2020, 39, 1600–1616. [Google Scholar] [CrossRef] [PubMed] [Green Version]
  15. Esawy, M.M.; Makram, W.K.; Albalat, W.; Shabana, M.A. Plasma gelsolin levels in patients with psoriatic arthritis: A possible novel marker. Clin. Rheumatol. 2020, 39, 1881–1888. [Google Scholar] [CrossRef] [PubMed]
  16. Vaid, B.; Chopra, B.S.; Raut, S.; Sagar, A.; Badmalia, M.D.; Ashish; Khatri, N. Antioxidant and Wound Healing Property of Gelsolin in 3T3-L1 Cells. Oxid. Med. Cell. Longev. 2020, 2020, 4045365. [Google Scholar] [CrossRef] [PubMed]
  17. Gupta, A.K.; Chopra, B.S.; Vaid, B.; Sagar, A.; Raut, S.; Badmalia, M.D.; Ashish; Khatri, N. Protective effects of gelsolin in acute pulmonary thromboembolism and thrombosis in the carotid artery of mice. PLoS ONE 2019, 14, e0215717. [Google Scholar] [CrossRef] [PubMed]
  18. Asare-Werehene, M.; Communal, L.; Carmona, E.; Le, T.; Provencher, D.; Mes-Masson, A.M.; Tsang, B.K. Pre-operative Circulating Plasma Gelsolin Predicts Residual Disease and Detects Early Stage Ovarian Cancer. Sci. Rep. 2019, 9, 13924. [Google Scholar] [CrossRef] [PubMed] [Green Version]
  19. Feldt, J.; Schicht, M.; Garreis, F.; Welss, J.; Schneider, U.W.; Paulsen, F. Structure, regulation and related diseases of the actin-binding protein gelsolin. Expert Rev. Mol. Med. 2019, 20, e7. [Google Scholar] [CrossRef] [PubMed]
  20. Yang, Z.P.; Bedugnis, A.; Levinson, S.; DiNubile, M.; Stossel, T.; Lu, Q.; Kobzik, L. Delayed Administration of Recombinant Plasma Gelsolin Improves Survival in a Murine Model of Penicillin-Susceptible and Penicillin-Resistant Pneumococcal Pneumonia. J. Infect. Dis. 2019, 220, 1498–1502. [Google Scholar] [CrossRef] [PubMed]
Figure 1. Study design and workflow. The study cohort consisted of 24 individuals. Triplicates of 24 plasma samples resulted in 72 plasma proteomes. The LC-MS/MS data, which we analyzed by MaxQuant.
Separations 08 00085 g001
Figure 2. Among the 24 plasma samples, analysis of the biological process, molecular function, and cellular component of plasma differential proteins.
Separations 08 00085 g002
Figure 3. Among the 24 plasma samples, we measured the evaluation of plasma coagulation and hemolysis events. (A) Analysis of protein abundance of FGA, FGB, and FGG in 24 plasma samples. (B) Analysis of protein abundance of HBA1, HBB, and HBD in 24 plasma samples.
Separations 08 00085 g003
Figure 4. Individual differences in plasma protein levels among the 24 plasma samples. (A) Analysis of protein abundance of LPA, CRP, and PZP in 24 plasma samples. (B) Analysis of protein abundance of SELL, C6, CLU, and HPX in 24 plasma samples.
Separations 08 00085 g004
Figure 5. Comparison of differential proteins between the normal control group and gout group among the 24 plasma samples. (A) Volcanic diagram analysis of differential protein between the normal control group and gout group. (B) Cluster analysis of 32 differentially expressed proteins in plasma of patients with the normal control group and gout group. (C) Network correlation analysis of 32 differentially expressed proteins in plasma of patients with the normal control group and gout group.
Separations 08 00085 g005
Figure 6. (A) Correlation between abnormal plasma proteins and clinical biochemical index in patients with gout. (B) ELISA confirmation of protein GSN between the normal control group and gout groups. Data were expressed as the mean using GraphPad Prism. * p < 0.05, ** p < 0.01, *** p < 0.0001.
Separations 08 00085 g006
Table 1. Comparison of clinical data between the control group and gout group ( x ¯ ± s).
Clinical DataNormal ControlGouttp
Numbers816--
Age57.63 ± 1.1955.88 ± 6.830.9950.334
BMI (kg/m2)24.74 ± 2.5028.08 ± 4.86−1.8150.083
SBP (mmHg)121.88 ± 14.05135.31 ± 21.01−1.6270.118
DBP (mmHg)71.13 ± 14.5987.31 ± 14.02 *−2.6310.015
SUA (umol/L)328.50 ± 47.91497.98 ± 126.85 **−4.7140.000
Scr (umol/L)88.00 ± 5.8397.94 ± 22.45−1.6630.113
BUN (mmol/L)6.33 ± 1.275.88 ± 1.480.7280.474
eGFR (ml/min)100.73 ± 7.7995.65 ± 23.490.7840.442
TG (mmol/L)1.02 ± 0.382.83 ± 1.65 **−4.1780.001
CHO (mmol/L)4.50 ± 0.655.55 ± 0.71 **−3.5100.002
ALT (IU/L)18.38 ± 3.7027.85 ± 7.92 **−3.1880.004
FPG (mmol/L)5.10 ± 0.305.29 ± 0.86−0.7710.450
Compared with the normal control group, * p < 0.05, ** p < 0.01. The parameters include: BMI (body mass index), SBP (systolic blood pressure), DBP (diatolic blood pressure), SUA (serum uric acid), Scr (serum creatintine), BUN (blood urea nitrogen), eGFR (estimated glomerular filtration rate), TG (triglyceride), CHO (cholesterol), ALT (alanine aminotransferase), and FPG (fasting plasma glucose).
Table 2. Comparison of clinical data between gout alone and gout with renal injury ( x ¯ ± s).
Clinical DataGGNtp
Numbers88--
Age57.50 ± 6.7254.25 ± 6.980.9480.359
Course14.38 ± 7.8010.00 ± 6.321.2320.238
BMI (kg/m2)25.98 ± 2.5330.19 ± 5.84−1.8720.082
SBP (mmHg)131.88 ± 27.50138.75 ± 12.75−0.6410.536
DBP (mmHg)83.13 ± 17.5191.50 ± 8.65−1.2130.245
SUA (umol/L)491.4 ± 151.1504.56 ± 107.47−0.2010.844
Scr (umol/L)78.76 ± 8.22117.13 ± 13.09 **−7.0200.000
BUN (mmol/L)5.07 ± 0.996.69 ± 1.47 *−2.580.022
eGFR(ml/min)116.30 ± 11.2374.99 ± 9.01 **8.1160.000
TG (mmol/L)3.46 ± 1.932.20 ± 1.101.5930.133
CHO (mmol/L)5.40 ± 0.575.71 ± 0.84−0.8510.409
ALT (IU/L)24.99 ± 4.4030.71 ± 9.81−1.5060.154
AST (IU/L)24.49 ± 5.9725.34 ± 7.90−0.2430.812
FPG (mmol/L)5.04 ± 0.755.53 ± 0.95−1.1540.268
HOMA-IR2.30 ± 0.493.84 ± 1.38 *−2.9550.016
Compared with gout alone (G), * p < 0.05, ** p < 0.01. The parameters include: BMI (body mass index), SBP (systolic blood pressure), DBP (diatolic blood pressure), SUA (serum uric acid), Scr (serum creatintine), BUN (blood urea nitrogen), eGFR (estimated glomerular filtration rate), TG (triglyceride), CHO (cholesterol), ALT (alanine aminotransferase), AST (aspartate aminotransferase), FPG (fasting plasma glucose), HOMA-IR (homeostasis model assessment-insulin resistance).
Table 3. Differential proteins in the normal control group and gout group.
Majority Protein IDsProtein NamesGene Namestp
P00915Carbonic anhydrase 1CA12.4670.037
P01024Complement C3C3−2.5220.019
P01031Complement C5C52.5560.018
P0DP04Ig heavy chain V-III region DOB −2.2010.039
P02741C-reactive proteinCRP−2.4070.025
P02751FibronectinFN1−2.1110.046
P02788LactotransferrinLTF2.5220.019
P04004VitronectinVTN−2.8300.010
P04083Annexin A1ANXA12.4030.047
P04196Histidine-rich glycoproteinHRG2.2980.031
P04406Glyceraldehyde-3-phosphate dehydrogenaseGAPDH5.4620.000
P05090Apolipoprotein DAPOD2.8600.009
P05109Protein S100-A8S100A83.2410.014
P05452TetranectinCLEC3B2.1740.041
P06396GelsolinGSN2.2770.033
P06702Protein S100-A9S100A94.0030.005
P07357Complement component C8 alpha chainC8A2.0800.049
P07358Complement component C8 beta chainC8B3.9240.001
P07360Complement component C8 gamma chainC8G2.3890.026
P13796Plastin-2LCP14.0470.001
P18428Lipopolysaccharide-binding proteinLBP2.3330.029
P19652Alpha-1-acid glycoprotein 2ORM2−2.3710.027
P20851C4b-binding protein beta chainC4BPB2.2630.034
P22352Glutathione peroxidase 3GPX32.5680.018
P22692Insulin-like growth factor-binding protein 4IGFBP4−2.1830.040
P32119Peroxiredoxin-2PRDX23.0610.015
P55056Apolipoprotein C-IVAPOC4−2.9720.007
P62328Thymosin beta-4TMSB4X2.2040.038
P62937Peptidyl-prolyl cis-trans isomerase APPIA2.2950.032
P80748Ig lambda chain V-III region LOI −3.5140.002
Q14624Inter-alpha-trypsin inhibitor heavy chain H4ITIH43.8510.001
Q96PD5N-acetylmuramoyl-L-alanine amidasePGLYRP2−2.3070.031
Table 4. Differential proteins in simple gout group and gout with renal injury group.
Majority Protein IDsProtein NamesGene Namestp
A0A0B4J1U7IgIGHV6-12.7350.023
A0A0C4DH67IgIGKV1-82.9870.013
P01833Polymeric immunoglobulin receptorPIGR2.4650.039
P02656Apolipoprotein C-IIIAPOC32.1570.049
P05155Plasma protease C1 inhibitorSERPING1−2.4000.031
P05546Heparin cofactor 2SERPIND12.6120.021
P0C0L4Complement C4-AC4A−3.0910.008
P0C0L5Complement C4-BC4B−2.4500.028
P36955Pigment epithelium-derived factorSERPINF1−2.5650.022
Q92954Proteoglycan 4PRG42.6670.018
Publisher’s Note: MDPI stays neutral with regard to jurisdictional claims in published maps and institutional affiliations.

