Abstract
Collision welding is a joining technology that is based on the high-speed collision and the resulting plastic deformation of at least one joining partner. The ability to form a high-strength substance-to-substance bond between joining partners of dissimilar metals allows us to design a new generation of joints. However, the occurrence of process-specific phenomena during the high-speed collision, such as a so-called jet or wave formation in the interface, complicates the prediction of bond formation and the resulting bond properties. In this paper, the collision welding of aluminum and copper was investigated at the lower limits of the process. The experiments were performed on a model test rig and observed by high-speed imaging to determine the welding window, which was compared to the ones of similar material parings from former investigation. This allowed to deepen the understanding of the decisive mechanisms at the welding window boundaries. Furthermore, an optical and a scanning electron microscope with energy dispersive X-ray analysis were used to analyze the weld interface. The results showed the important and to date neglected role of the jet and/or the cloud of particles to extract energy from the collision zone, allowing bond formation without melting and intermetallic phases.
1. Introduction
Mitigating climate change with all its consequences requires in comprehensive strategy. This includes a massive reduction in CO2 emission by the manufacturing industry and its products. One factor to reach this goal is consistent lightweight design. In this context, new joining techniques play an important role by enabling the high-strength joints of multi-material assemblies.
A promising, environmentally friendly joining technology is electromagnetic pulse welding (EMPW), which belongs to the group of collision welding processes, such as explosive welding or foil actuator vaporization [1]. All of these welding techniques are based on the collision of two joining partners, often referred to as moving flyer and stationary target, at high relative velocity (called impact velocity ) and a certain collision angle [2]. During the oblique collision, a collision front moves along the colliding surfaces, which is often described by the collision point velocity . Due to the high impact velocities around 200 m s−1 to 600 m s−1, extreme conditions occur in the collision front resulting in strain rates of up to 106 s−1 and compressive stresses of several GPa [3]. This leads to the formation of a metal stream by the near-surface layers, called jet, which is pushed ahead the collision front. Furthermore, brittle layers of oxides and other surface contaminations are spalled from the strongly deformed surfaces and form a dispersed cloud of particles (CoP) ahead of the collision front [4]. Both phenomena can interact with each other, with the colliding surfaces and also with the ambient gas in the welding gap by entrapment and the stored thermal and chemical energy, as discussed in the literature [5,6,7,8,9]. This interaction determines the possible joining mechanism (solid-state, solid–liquid coexisting state or liquid-state bonding) and depends not only on the selected material and geometry of the joining partners, but on the collision kinetics, which are often described by welding windows [9,10]. As EMPW is a highly transient process, the collision kinetics change continuously. Therefore, it is challenging to predict the weld formation, especially when dissimilar metals have to be joined.
A prominent dissimilar material combination for EMPW is aluminum (Al) and copper (Cu), as it is of high importance for e-mobility. Therefore, several studies have been conducted on this topic in recent years. It was focused on how different process parameters influence the formation of the weld interface with interdiffusion layers, intermetallic layers and resulting defects [11,12,13,14,15] and how these parameters can be optimized to obtain high-quality welds in terms of mechanical and electrical properties [16,17,18,19].
However, none of this research addressed bond formation close to the lower limit of the welding process, which could provide a deeper understanding of the mechanisms involved due to the higher sensitivity to the process parameters. Therefore, in this paper, a welding window for aluminum and copper bonds is determined based on previous studies for the same material combination of aluminum [20] and copper in [21] on a model test rig for comparable low-impact energies. The following questions are addressed:
- At which process parameters can Al–Cu-joints be formed and how do the welding window boundaries differ compared to those of similar material combinations?
- How does the weld interface develop as a function of the process parameters?
2. Materials and Methods
2.1. Series of Experiments
The experiments of the presented study were performed on a model test rig, see Section 2.2. The samples used were made by laser cutting from sheets of aluminum (EN AW-1050A Hx4, thickness: 2 mm) and copper (Cu EPT, thickness: 1 mm), see material data in Table 1.

Table 1.
Used material data of aluminum EN-AW1050A and copper Cu-ETP.
For the main study with Al as the pre-bent flyer and Cu as the target, the impact velocity was set in a range of 205 m s−1 to 262 m s−1 to cover the experimental region of similar material combinations. At each impact velocity, the collision angle was varied (max. spread: 2° to 20°) to determine the weldable region. In a complementary series, flyer and target material were changed for selected impact velocities ( 214, 234, 254 and 262 m s−1). Furthermore, another complementary study of similar combinations of Al and Cu at three impact velocities ( 214, 234 and 262 m s−1) was performed and compared with the welding window determination in [20,21] to verify whether the modification of the model test rig, described below, influences the bond formation process.
2.2. Model Test Rig and Process Observation
The model test rig, developed at the PtU, Darmstadt, Germany, allowed the collision welding process to be investigated with constant and precisely adjustable process parameters using a purely mechanical concept. Figure 1a shows its main components: two rotors turning synchronously, each with mounted joining partner samples (colliding area: length × width: 12 mm × 12 mm). One of the samples was pre-bent to set the collision angle , as can be seen in Figure 1b. Each sample was accelerated to half the desired impact velocity and collided exactly in the center between the two turning points of the rotors. Since the final impact velocity could not be reached within one revolution, the rotors had to accelerate with an offset. In a former setup, the offset was realized by a phase offset of 45°, which was compensated to initiate the collision [20,23]. After the collision, the samples are torn off at a predetermined breaking point because the rotors could not stop immediately. Due to the high dynamics during the compensation, the rotors and other turning components were geometrically optimized to reduce the mass inertia. Nevertheless, the concept was limited at an impact velocity of 262 m s−1. Furthermore, the rotors showed a shortened lifetime due to the occasional collision with the welded or non-welded samples after the actual welding process [20].
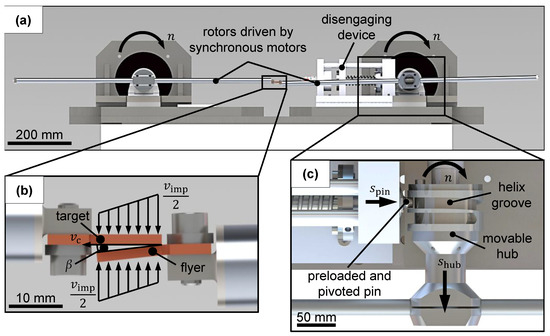
Figure 1.
The model test rig (a) consisted of two synchronous motor-driven rotors and a disengaging device. A sample (b) was attached to one end of each rotor, one of which is pre-bent to determine the collision angle. In the disengaging device a pivoted pin (c) is preloaded by an electric holding magnet. When the magnet is switched off, the pin engages the helix groove () and the entire rotor hub () is extended within one revolution.
Therefore, a new mechanism for initiating the collision process was developed. The necessary offset of the samples was provided by a movable rotor hub which allowed an axial shift of 15 mm in the direction of the drive shaft during rotor acceleration, as can be seen in Figure 1c. At the desired turning speed, a preloaded, pivoted pin is released and engaged in a helix groove on the hub. Due to the defined motion by the cam gear, the hub’s axial offset could be compensated up to impact velocities of 523 m s−1. Moreover, the rotors could be made of solid aluminum alloy to increase the service life.
The model test rig concept provided good process observability. Therefore, a high-speed process observation was implemented by an image intensifier camera hsfc pro (by PCO, Kelheim, Germany) with a macro lens (Milvus Makro 100 mm f2 by Zeiss, Oberkochen, Germany) and a CAVILUX Smart lightning laser (power: 400 and wavelength: 640 nm, by Cavitar, Tampere, Finland). To determine the collision angle , a MATLAB script (version: 2018b, MathWorks, Natick, Massachusetts, MA, USA) with edge detection was applied to the high-speed images. More detailed information about the observation and image processing methods can be found in [9,20,21].
2.3. Analysis of the Weld Interface
The influence of the process parameters on the weld interface was determined in two different ways. First, the length of the welded interface was measured in the welding direction in the middle of the welded sample with an optical microscope (Smartzoom 5 by Zeiss, Oberkochen, Germany) and related to the length of the overlapped samples for a variation of impact velocity and collision angle.
Furthermore, the weld interface characteristics at three different sets of process parameters were analyzed using cross-sections. Due to the small thickness of the weld interface zone, the cross-sectional plane was tilted by 80° along the welding direction vector to increase the occurring interlayer. Hence, a perspective distortion had to be considered in the following. The sections were examined with the optical microscope and with a scanning electron microscope (SEM) with energy-dispersive X-ray spectroscopy (EDX) (Mira by Tescan, Brno, Czech Republic).
3. Results
3.1. Welding Windows
In this section, the welding windows for the different series of experiments are presented. The examined welding windows of Al–Al and Cu–Cu are shown in Figure 2, whereas the examined welding windows of Al as flyer and Cu as target (a) and of Cu as flyer and Al as target (b) are shown in Figure 3. An experiment was defined as bonded, when the two joining partners could not be manually separated.
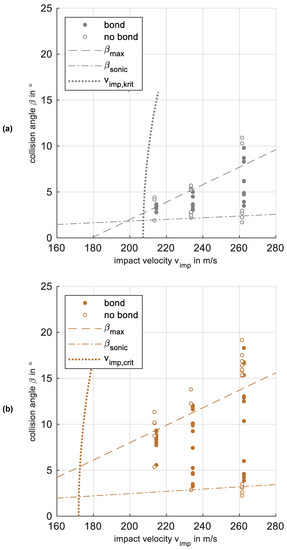
Figure 2.
The resulting welding windows for similar combinations of Al–Al (a) and Cu–Cu (b). To improve the visibility of the data points, welded experiments are plotted with +0.5 m s−1, non-welded with −0.5 m s−1. is the minimal impact velocity calculated by Equation (2). The subsonic boundary angle represents the surpassing of the speed of sound in the material by the collision point velocity. The upper collision angle boundary was obtained from the previous welding window investigation [21].

Figure 3.
The welding windows of Al as flyer and Cu as target (a) and of Cu as flyer and Al as target (b). To improve the visibility of the data points, welded experiments are plotted with +0.5 m s−1, non-welded with −0.5 m s−1. The determined boundaries of the welding windows of Al–Al (gray) and Cu–Cu (orange) were added, as can be seen in Figure 2. The upper collision angle boundary of Al–Cu (black) was linear approximated as those of the similar material combinations. The minimal impact velocity of Al–Cu (black) was calculated with Equation (2) and the corresponding mean values of ultimate tensile strength and density of both materials, as can be seen in Section 4.
In order to analyze the results, the following boundaries known from the literature were added to the welding windows. The minimum impact velocity to form a bond is described as surpassing the dynamic elastic limit in the near-surface layers, due to the local pressure from the impact [24]. In this region, metal behaves like a fluid and can form a jet [25,26]. An approximation of the minimal impact velocity normal to the flyer surface can be calculated by an empirical expression of the ultimate tensile strength and the material density [27]:
As the controlled impact velocity at the test rig (see Figure 1b) is normal to the target surface, the equation was supplemented by the trigonometric relationship:
On the other hand, no jet can be formed, when the collision point velocity exceeds the speed of sound of the material [25,26]. The resulting was done by Equation (A1) and plotted as the dash dotted line in the welding windows. The dashed line represents the determined upper collision angle boundaries from experiments at a former setup with the same materials [20,21], as can be seen in the welding windows in the Appendix B. The corresponding empirical equations of the boundaries are listed in Appendix A. Both material combinations deviated at higher impact velocities to larger collision angles and showed no clear transition for copper. A closer look at the bonded area at the joints of these experiments revealed that only small regions were welded, which could also be considered as (almost) not welded.
Regarding the mixed material combination, the minimal collision angles for experiments with a bond were mainly larger than the calculated supersonic limits of both similar material combinations, see Figure 3a. The upper boundary could be linearly approximated with a similar gradient to the former determined values of Al–Al and Cu–Cu, while its ordinate intercept was located between the ones of the similar combinations, as can be seen in Appendix A. Due to the mixed material combination, no minimal impact velocity could be calculated by Equation (2). The complementary series with a changed flyer (Cu) and target (Al) did not show a significant difference considering the determined boundaries, as can be seen in Figure 3b.
3.2. Formation of the Weld Interface
Figure 4 shows the size distribution of the bond formation across the welding window. The variation of the impact velocity (a) exhibited that large areal welded joints could be obtained even for low-impact velocities. Considering the results for different collision angles (b), a plateau of at least 80% welded interface was formed almost over the whole weldable region at an impact velocity of 262 m s−1. Furthermore, a sharp transition with only small formed welds towards the upper and lower boundary was visible.
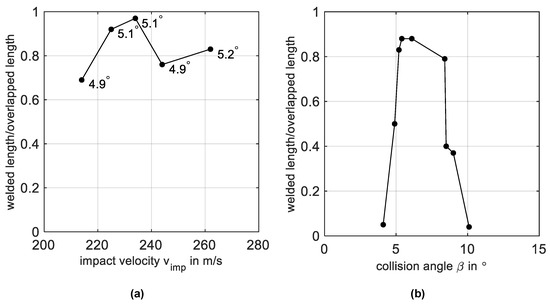
Figure 4.
The ratio of welded to overlapped length of the samples for different impact velocities at a constant collision angle of approximately 5.0 m s−1 (a) and for different collision angles at a constant impact velocity of 262 m s−1 (b).
Regarding the microstructure of the weld, the micro sections revealed that the weld interface strongly differs depending on combination of the process parameters, even if one of them was kept constant, as can be seen in Figure 5. The weld interface of (a) (4.9° at 214 m s−1) was quite steady over the whole length with small and short waves. No transition layer was visible, even by this tilted preparation of the cross-section, as can be seen in Section 2.3. This was confirmed by EDX-analysis, which showed a distinct transition of element distribution at a representative location of the weld interface, as can be seen in Figure 6a.
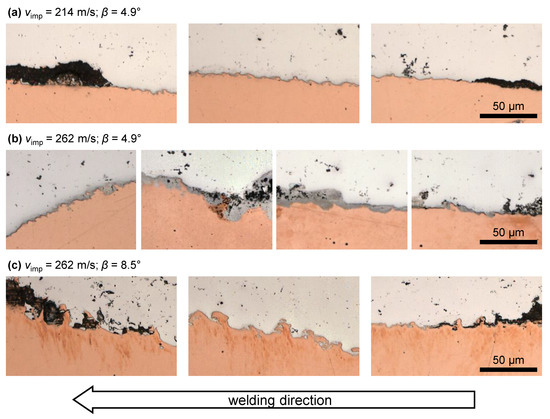
Figure 5.
Cross-sections of the weld interface at three different parameter sets. The optical microscopy images show the initiation and the end of the welds and for (a,c) the middle of the weld interface. The sample in (b) was largely not welded but exhibited two welded areas in the second and fourth quarters of the section, the beginnings and ends of which are shown.
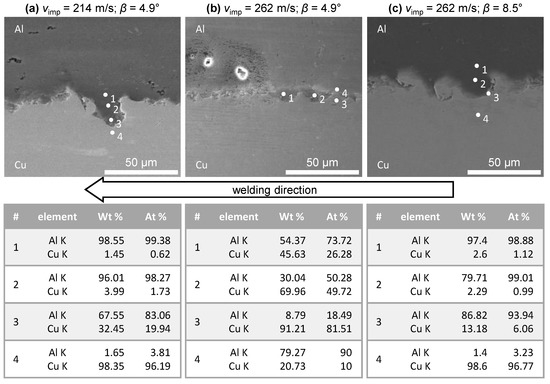
Figure 6.
SEM images with EDX analysis at prominent locations of the cross-sections shown in Figure 5.
In contrast, at the same angle but at a higher impact velocity (262 m s−1), the interface exhibited two welded regions separated by a porous and rough non-welded region, as can be seen in Figure 5b. The first welded part showed a thick interlayer with different islands of element distribution, as can be seen in Figure 6b. Such layers were also found by other research groups for this material combination and were identified as intermetallic phases, formed by local melting [28,29]. In the following, the interlayer of the second welded region thinned out more and more until it was barely visible and faded out at the end of the samples.
When the collision angle was increased to 8.5°, another unsteady type of weld interface occurred, as can be seen in Figure 5c. While at the beginning, the interface was similar to (a), it developed large waves with typical vortices and detachments. These waves continued even after the end of the weld, and particles of the mating material adhered to the surfaces as if it had first been welded and then separated. However, along the whole weld interface, no thick interlayer was visible or detected by the EDX.
No residue resulting from jet formation was visible at any of the weld interfaces, possibly due to the limited magnification of the optical microscopy. Moreover, no inclusion of the CoP could be detected by EDX search for oxides, although some of the pores in the interfaces might suggest this, as shown in [12].
4. Discussion
Before discussing the boundaries of the process windows below, it is worth taking a closer look at the size distribution of the weld interface and the definition of bond formation. As shown in Figure 4, the size of the weld interface varied across the welding window and dropped from a plateau to almost zero—close to the collision angle boundaries. This is in good agreement with the former investigation for the similar material combinations [9,30]. Joints in this region may not be relevant for industrial application. However, the definition of a joint in Section 3.1 was chosen to consider the range of process parameters which physically enables bond formation and to investigate the influencing phenomena. In this context, the comparison of the welding windows of Al–Cu joints with the similar material combinations of Al–Al and Cu–Cu reveals a related trend with respect to the lower and upper collision angle boundaries, as can be seen in Figure 2 and Figure 3.
In previous research, the upper collision angle boundary of the welding window has been related to the collision kinetics and the mechanical properties of the materials, the relationship of which influences the formation of a jet in terms of a dense metal stream [9,21]. The jet formation depends on the local surpassing of the dynamic elastic limit of the material by high pressures at the collision zone [24]. The local pressure conditions can be related to the momentum and the collision angle. The momentum depends on the total impact velocity and the inertia of the colliding joining partners. In this context, it is plausible that the upper boundary of the dissimilar combination is located between the two of the similar combinations, which is also visible in the comparison of the ratios of the momentum and the upper boundary angles for Al–Al/Cu–Cu and Al–Cu/Cu–Cu, as can be seen in Table 2.
Table 2.
Ratios of the momentum and upper boundary angle of Al–Al and Al–Cu related to Cu–Cu. The calculation of the momentum is listed at Appendix C. The upper boundary angle was calculated by the equations in Appendix A.
In this context, a different behavior of jet formation could be expected in the experiments with changed flyer and target due to the reversed inertia in the asymmetric collision setup and assuming that the flyer undergoes most of the plastic deformation. However, no significant deviation of the upper collision boundary was exhibited. An explanation for this could be the results by Kakizaki et al. because they showed by numerical simulation that for dissimilar material combinations with large density difference, such as Al and Cu, the jet was not formed from the flyer material, but was mainly composed of the lower density material [31].
In previous studies, the minimum impact velocity to initiate bond formation for Al–Al was experimentally determined as 205 m s−1, which is close to the intersection of the upper boundary line (Equation (A2)) and the supersonic boundary curve (Equation (A1)), see Figure A1a and [20,21]. Furthermore, the empirical approximation for the minimum impact velocity by Wittman (Equation (1)) is close to this value, calculated as approximately 207 m s−1. The minimal impact velocities for Cu–Cu and Al–Cu have not yet been determined experimentally. Both can be estimated by the experimental results as described above. However, for Cu–Cu, the values of the intersections of the upper collision boundary line with the supersonic boundary curve (132 m s−1) and the empirical approximation for the minimum impact velocity by Wittman (172 m s−1) diverge. Thus, experimental verification is needed. For the dissimilar material combination Al–Cu, the intersection of the upper collision angle boundary and the minimal weldable collision angle boundary, which is higher than the supersonic limit of both materials and will be discussed below, occurs at about 185 m s−1. Wittman’s approach is not defined for a dissimilar material combination, but using the corresponding mean values of ultimate tensile strength and density of both materials delivers a suitable measure with 181 m s−1. However, this extended approximation has to be validated for other material combinations.
As for the lower collision angle boundary of the dissimilar material combination, the supersonic boundary was not responsible for the failed bond formation. However, previous studies revealed that the CoP, which is pushed ahead in the joining gap by the collision front, may prevent bond formation at small collision angles. In fact, the high roughness of the colliding surfaces can cause the CoP to be trapped by the collision front, inhibiting the particles from contacting the virgin base material [21,30,32]. However, since the EDX analysis did not detect any oxides, this is not the reason in the present study. However, the formation of large intermetallic phases at the weld interface in Figure 5b and the porous structure indicate excessive melting, which partially prevented bond formation. Recently, a correlation between the extent of the emitted light of the CoP and the temperature in the joining gap was shown [8]. Comparing the conditions in the welding gap close to the lower collision angle boundary, the CoP at the Cu–Cu and the Al–Cu configuration emitted a bright glow, which is not visible for Al–Al at the high-speed images, see Figure 7. The total kinetic energy of the experiments with Cu is higher due to the higher accelerated mass and it can be assumed that higher temperatures were reached in the collision zone for both Cu–Cu and Al–Cu. As the melting temperature of Al is distinctly lower than for Cu, the melting of Al can be expected in the latter configuration. Due to the mechanical concept of the model test rig, an estimation of the temperatures at the weld interface is possible. The following simplifications are assumed:
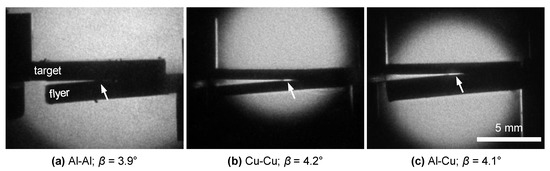
Figure 7.
High-speed imaging series of the collision with different material parings at a similar progression point of the collision: Al–Al (a); Cu–Cu (b); Al–Cu (c). All experiments were driven at 262 m s−1 and closely above the lower collision angle boundary of Cu–Cu and Al–Cu. The exposure time was 20 ns for all experiments. The arrows indicate the CoP.
- The energy input to the welding process is the sum of the kinetic energies of the joining partners, which is partially stored as potential energy in the material during plastic deformation (about 10–15%) [7]. The remaining amount is transformed to heat, which is conservatively estimated with 80% in the following calculations.
- This heat is concentrated in the near-surface layers under adiabatic conditions, where the majority of the plastic strain occurs [33].
Based on these assumptions and adapting the equation of heat transfer, the following equation allows to analytically calculate the thickness of a melted layer:
where l is the length and w is the width of the samples, is the melting temperature of Cu, and is the specific heat capacities and and the densities of Al and Cu. Inserting the corresponding values predicted a melted layer of 9.3 μm for an impact velocity of 214 m s−1 and a melted layer of 13.6 μm continuous thickness over the whole weld interface for 262 m s−1.
However, even in the cross-section in Figure 5b, no continuous melted layer of these thicknesses was visible. These findings are in good agreement with the literature [11,12,13,14,15,16,33]. Li et al. described the formation of intermediate zones, especially waves and vortices, by local melting due to local plastic deformation causing high shear instabilities and an adjacent inter-diffusion layer of 70 nm thickness, formed below the melting point of aluminum combined with ultrahigh heating and cooling rates of about 1013 K s−1 [14,15]. However, these cited values are from simulations and experiments with process parameters (600 m s−1, 20°) much higher than those used in the present paper. In another study of this group, the development of the microstructure at the weld interface during EMPW was investigated. For this purpose, the weld interface was divided into different zones by its appearance and in dependence on the collision angle and impact velocity [33]. One region was formed without any trace of melting, although the determined minimal impact velocity was higher than 300 m s−1. Consequently, a considerable amount of energy must be extracted from the weld interface.
Lysak et al. deduced an energy balance for explosive welding, where an energy loss is defined by the kinetic and thermal energy of the jet [34]:
where is the mass of the jet, is the velocity of the jet, is the temperature of the jet and c is the specific heat capacity of the jet material. However, their calculated contribution to the stored energy in the jet was negligible compared to the large amount of energy induced by the detonation. In contrast, the energy input at the model test rig and also at the EMPW is much lower, which is why the energy loss of the jet could have a greater impact and explain the lower temperature in the collision zone. Since no residuals of the jet in the form of a solid stream could be detected in the cross-section, the CoP, that accumulates during the collision process, see Figure 8, can largely remove heat from the collision front.
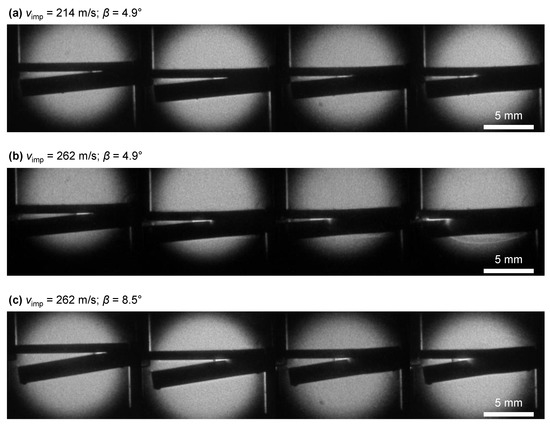
Figure 8.
High-speed imaging of three different process parameter sets. The exposure time was 20 ns for all experiments.
Hence, the temperature of the combined mass stream consisting of the jet and/or the CoP can be estimated by rearranging Equation (4) and making the subsequent further assumptions:
- The mass stream must extract at least enough heat from the collision zone so that the melting temperature of Al () is not reached at the interface. The volume of the adiabatic region is estimated as 12 mm · 12 mm · 10 μm, where it is assumed to be symmetric around the interface for both joining partners. The thickness of adiabatic heating is chosen as 10 μm, which is in accordance with the findings of [33]. This assumption results in a heat input to the interface of:Considering the micro-sections in Figure 5, the actual thickness of the adiabatic region might be smaller, which is why even more energy would have to be extracted by the jet and/or the CoP.
- As mentioned before, it is assumed that 80% of the kinetic energy is transformed into heat. Together with the previous estimation, the total energy of the CoP and/or the jet is:
- In previous studies, no loss of mass during the welding of Cu–Cu could be detected by a scale with a resolution of , [21]. This determines the maximum total mass of the jet and the CoP () for the calculation.
- The velocity of the CoP is presumed to be the velocity of the jet and can be calculated by its progression in the high-speed images in Figure 8 and the frame delay, as can be seen in Table 3.
Table 3. The velocity of the CoP at different impact velocities and collision angles . It was calculated by the averaged progression of pikes of the CoP between two sequenced high-speed images with a frame delay in Figure 8.
- Most of the mass stream mainly consists of material with lower density (in this case Al) which is predicted by various simulations in the literature [24,31]. Therefore, the specific heat capacity of Al is used for the calculation of the temperature of the CoP and/or jet.
All these estimations lead from Equation (4) to the following equation for the temperature of CoP and/or the jet:
Inserting the determined and assumed values delivers the results for the two configurations without melting in the weld interface in Table 4. The temperature for configuration 262 m s−1 and 4.9° was not calculated as melting largely occurred along the interface, which does not allow us to estimate the maximal temperature at the weld interface.
Table 4.
The temperature of the CoP and/or jet at different impact velocities and collision angles calculated by Equation (7).
It has to be stated that the calculation above neglects the interaction of the CoP and/or the jet with the ambient medium in the closing gap which may also be heated by the high compression rate. Furthermore, some parts of the CoP and/or the jet may interfere with the surfaces in front of the collision zone which may return heat in the collision zone. However, both interactions are also dependent on the process parameters’ collision angle and impact velocity. Regarding the assumptions and simplifications above, the actual temperatures might be even higher. Nevertheless, the determined value for 262 m s−1 corresponds to the regime studied earlier for the CoP at an EMPW configuration of Al and steel, which provided a temperature of 5600 K at a maximal impact velocity of 245 m s−1 [8]. As the temperature was measured by the light emission of the process glare, it can be considered as an average of the temperature development during the unsteady process. In this context, the approach above seems to be a promising extension for the energy balance in collision welding.
5. Conclusions
The following conclusions concerning the welding window boundaries of Al–Cu can be drawn by the findings of the present paper:
- The boundaries of the welding window for the dissimilar material combination largely correspond to those of the welding windows of Al–Al and Cu–Cu.
- The upper boundary of the collision angle of Al–Cu is between the boundaries of the similar material configurations with a ratio that can be related to the total momentum of the collision. However, no dependence of the boundary on the configuration of switched flyer and target material (Cu–Al) was found. A different behavior is expected for a collision weld setup with a moving flyer and stationary target due to different collision kinetics.
- The critical impact velocity of Al–Cu for the initiation of bond formation shows a dependence on the intersection of the upper and lower collision angle boundaries, like the similar material configurations. The modified empirical approximation by Wittman can also be applied for Al–Cu, whose universal applicability has to be validated for other dissimilar material combinations.
- The lower collision angle boundary for Al–Cu is higher than the supersonic limits of both materials and is subject to a different mechanism. The presented findings indicated that excessive melting of Al prevented bond formation at small collision angles due to the higher energy input compared to the configuration of Al–Al.
- Therefore, the energy extraction by the CoP and/or the jet from the collision zone is crucial for prevailing mechanisms in low-energy collision welding. If too much energy remains as heat in the collision zone, melting will occur and influence the weld interface formation or even prevent permanent bonding. In the future, the adjustment of the parameters will be further investigated in order to define the transition region for melting in the weld interface in dependence on the process and material parameters. This will allow for the more precise prediction of high-strength joints between dissimilar materials without the negative influence of excessive brittle intermetallic phases.
Author Contributions
Conceptualization: P.G. and B.N.; methodology, design of experiments, investigation, data analysis and data curation: B.N.; visualization and writing—original draft preparation, B.N.; writing—review and editing: P.G.; resources, funding acquisition, project administration and supervision: P.G. All authors have read and agreed to the published version of the manuscript.
Funding
The results have been generated within the framework of the research project “Investigation of the formation mechanisms of the bonding zone in collision welding” (GR 1818/49-3) which was part of priority program 1640 “joining by plastic deformation” gratefully funded by the German research foundation (DFG).
Data Availability Statement
Data sharing not applicable.
Acknowledgments
The experiments for the determination of the welding window of Al and Cu were conducted by Kumaran Sutharsan during their Bachelor Thesis under the supervision by Benedikt Niessen. The approach of the heat dissipation in the jet and/or the CoP was initiated during fruitful discussions with Eugen Schumacher from the Department for Cutting and Joining Manufacturing Processes at the University of Kassel. The authors greatly appreciate the effort of Claudia Wasmund and Petra Neuhäusel, Department of Physical Metallurgy at TU Darmstadt, for the sample preparation and SEM and EDX analysis. Furthermore, we would like to acknowledge the help of Stephan Ditscher of Baumüller who supported the programming of the electronic control system of the test rig. Last but not least, we thank Daniel Martin for the review of the calculations and the proofreading of the manuscript and Aaron Zotz and Faraz Mehmood for their support during experiments and analysis.
Conflicts of Interest
The authors declare no conflict of interest.
Abbreviations
The following abbreviations are used in this manuscript:
| Al | aluminum EN-AW1050A |
| CoP | cloud of particles |
| Cu | copper Cu-ETP |
| EDX | energy-dispersive X-ray spectroscopy |
| EMPW | electromagnetic pulse welding |
| PtU | Institute for Production Engineering and Forming Machines |
| SEM | scanning electron microscope |
Appendix A. Material Data and Equations for the Calculation of the Boundaries of the Determined Welding Windows
Appendix A.1. Lower Collision Angle Boundary by the Supersonic Limit
The supersonic limit is reached, when the collision point velocity reaches the speed of sound of the material . The corresponding boundary angle is calculated by the trigonometric relationship from Figure 1b.
Appendix A.2. Upper Boundary Collision Angle
Aluminum–Aluminum
Copper–Copper
Aluminum–Copper
Appendix B. Complementary Welding Windows

Figure A1.
The welding windows for similar combinations of Al–Al (a) from [20] and Cu–Cu (b) from [21]. To improve the visibility of the data points, welded experiments are plotted with + 0.5 m s−1, non-welded with −0.5 m s−1. is the minimal impact velocity calculated by Equation 2. The subsonic boundary angle represents the surpassing of the speed of sound in the material by the collision point velocity. The upper collision angle boundaries were linear approximated.
Appendix C. Calculation of the Momentum
References
- Kapil, A.; Sharma, A. Magnetic pulse welding: An efficient and environmentally friendly multi-material joining technique. J. Clean. Prod. 2015, 100, 35–58. [Google Scholar] [CrossRef]
- Carpenter, S.H.; Wittman, R.H. Explosion Welding. Annu. Rev. Mater. Sci. 1975, 5, 177–199. [Google Scholar] [CrossRef]
- Stern, A.; Shribman, V.; Ben-Artzy, A.; Aizenshtein, M. Interface Phenomena and Bonding Mechanism in Magnetic Pulse Welding. J. Mater. Eng. Perform. 2014, 23, 3449–3458. [Google Scholar] [CrossRef]
- Deribas, A.A.; Zakharenko, I.D. Surface effects with oblique collisions between metallic plates. Combust. Explos. Shock Waves 1974, 10, 358–367. [Google Scholar] [CrossRef]
- Khaustov, S.V.; Kuz’min, S.V.; Lysak, V.I.; Pai, V.V. Thermal processes in explosive welding. Combust. Explos. Shock Waves 2014, 50, 732–738. [Google Scholar] [CrossRef]
- Koschlig, M.; Raabe, D.; Veehmayer, M. Production of Steel-Light Metal Compounds with Explosive Metal Cladding. In Proceedings of the 3rd International Conference on High Speed Forming, Dortmund, Germany, 11–12 March 2008; Institut für Umformtechnik-Technische Universität Dortmund: Dortmund, Germany, 2008. [Google Scholar] [CrossRef]
- Pabst, C. Ursachen, Beeinflussung, Auswirkungen Sowie Quantifizierung der Temperaturentwicklung in der Fügezone beim Kolisionsschweißen; Vol. Band 119, Berichte aus Produktion und Umformtechnik; Shaker Verlag: Düren, Germany, 2019. [Google Scholar]
- Bellmann, J.; Lueg-Althoff, J.; Niessen, B.; Böhme, M.; Schumacher, E.; Beyer, E.; Leyens, C.; Tekkaya, A.E.; Groche, P.; Wagner, M.F.X.; et al. Particle Ejection by Jetting and Related Effects in Impact Welding Processes. Metals 2020, 10, 1108. [Google Scholar] [CrossRef]
- Niessen, B.; Schumacher, E.; Lueg-Althoff, J.; Bellmann, J.; Böhme, M.; Böhm, S.; Tekkaya, A.E.; Beyer, E.; Leyens, C.; Wagner, M.F.X.; et al. Interface Formation during Collision Welding of Aluminum. Metals 2020, 10, 1202. [Google Scholar] [CrossRef]
- Cui, J.; Ye, L.; Zhu, C.; Geng, H.; Li, G. Mechanical and Microstructure Investigations on Magnetic Pulse Welded Dissimilar AA3003-TC4 Joints. J. Mater. Eng. Perform. 2020, 212, 8. [Google Scholar] [CrossRef]
- Raoelison, R.N.; Sapanathan, T.; Buiron, N.; Rachik, M. Magnetic pulse welding of Al/Al and Al/Cu metal pairs: Consequences of the dissimilar combination on the interfacial behavior during the welding process. J. Manuf. Process. 2015, 20, 112–127. [Google Scholar] [CrossRef]
- Ayaz, M.; Khandaei, M.; Vahidshad, Y. Evaluating the Electromagnetic Welding Parameters for Improving the Mechanical Properties of Al–Cu Joint. Arab. J. Sci. Eng. 2020. [Google Scholar] [CrossRef]
- Pourabbas, M.; Abdollah-zadeh, A.; Sarvari, M.; Movassagh-Alanagh, F.; Pouranvari, M. Role of collision angle during dissimilar Al/Cu magnetic pulse welding. Sci. Technol. Weld. Join. 2020, 25, 549–555. [Google Scholar] [CrossRef]
- Li, J.S.; Raoelison, R.N.; Sapanathan, T.; Hou, Y.L.; Rachik, M. Interface evolution during magnetic pulse welding under extremely high strain rate collision: Mechanisms, thermomechanical kinetics and consequences. Acta Mater. 2020. [Google Scholar] [CrossRef]
- Li, J.S.; Raoelison, R.N.; Sapanathan, T.; Zhang, Z.; Chen, X.G.; Marceau, D.; Hou, Y.L.; Rachik, M. An anomalous wave formation at the Al/Cu interface during magnetic pulse welding. Appl. Phys. Lett. 2020, 116, 161601. [Google Scholar] [CrossRef]
- Kwee, I.; Psyk, V.; Faes, K. Effect of the Welding Parameters on the Structural and Mechanical Properties of Aluminium and Copper Sheet Joints by Electromagnetic Pulse Welding. World J. Eng. Technol. 2016, 04, 538–561. [Google Scholar] [CrossRef]
- Psyk, V.; Scheffler, C.; Linnemann, M.; Landgrebe, D. Process analysis for magnetic pulse welding of similar and dissimilar material sheet metal joints. Procedia Eng. 2017, 207, 353–358. [Google Scholar] [CrossRef]
- Psyk, V.; Linnemann, M.; Scheffler, C. Experimental and numerical analysis of incremental magnetic pulse welding of dissimilar sheet metals. Manuf. Rev. 2019, 6, 7. [Google Scholar] [CrossRef]
- Psyk, V.; Hofer, C.; Faes, K.; Scheffler, C.; Scherleitner, E. Testing of magnetic pulse welded joints – Destructive and non-destructive methods. In Proceedings of the 22nd International ESAFORM Conference on Material Forming, Gasteiz, Spain, 8–10 May 2019; Galdos, L., Ed.; AIP Conference Proceedings. AIP Publishing LLC: Melville, NY, USA, 2019; p. 050010. [Google Scholar] [CrossRef]
- Groche, P.; Becker, M.; Pabst, C. Process window acquisition for impact welding processes. Mater. Des. 2017, 118, 286–293. [Google Scholar] [CrossRef]
- Groche, P.; Niessen, B.; Pabst, C. Process boundaries of collision welding at low energies. Mater. Werkst. 2019, 50, 940–948. [Google Scholar] [CrossRef]
- Bargel, H.J.; Schulze, G. (Eds.) Werkstoffkunde: Mit 85 Tabellen; VDI-Buch, Springer: Berlin, Germany, 2005. [Google Scholar]
- Groche, P.; Wagner, M.X.; Pabst, C.; Sharafiev, S. Development of a novel test rig to investigate the fundamentals of impact welding. J. Mater. Process. Technol. 2014, 214, 2009–2017. [Google Scholar] [CrossRef]
- Akbari Mousavi, A.A.; AL-Hassani, S.T.S. Numerical and experimental studies of the mechanism of the wavy interface formations in explosive/impact welding. J. Mech. Phys. Solids 2005, 53, 2501–2528. [Google Scholar] [CrossRef]
- Walsh, J.M.; Shreffler, R.G.; Willig, F.J. Limiting Conditions for Jet Formation in High Velocity Collisions. J. Appl. Phys. 1953, 24, 349–359. [Google Scholar] [CrossRef]
- Cowan, G.R.; Holtzman, A.H. Flow Configurations in Colliding Plates: Explosive Bonding. J. Appl. Phys. 1963, 34, 928–939. [Google Scholar] [CrossRef]
- Wittman, R.H. The influence of collision parameters of the strength and microstructure of an explosion welded aluminium alloy. In Proceedings of the 2nd International Symposium on Use of an Explosive Energy in Manufacturing Metallic Materials, Marianske Lazne, Czech Republic, 9–12 October 1973; pp. 153–168. [Google Scholar]
- Raoelison, R.N.; Racine, D.; Zhang, Z.; Buiron, N.; Marceau, D.; Rachik, M. Magnetic pulse welding: Interface of Al/Cu joint and investigation of intermetallic formation effect on the weld features. J. Manuf. Process. 2014, 16, 427–434. [Google Scholar] [CrossRef]
- Wang, K.; Shang, S.L.; Wang, Y.; Vivek, A.; Daehn, G.; Liu, Z.K.; Li, J. Unveiling non-equilibrium metallurgical phases in dissimilar Al-Cu joints processed by vaporizing foil actuator welding. Mater. Des. 2020, 186, 108306. [Google Scholar] [CrossRef]
- Niessen, B.; Groche, P. Weld interface characteristics of copper in collision welding. In Proceedings of the 22nd International ESAFORM Conference on Material Forming, Gasteiz, Spain, 8–10 May 2019; Galdos, L., Ed.; AIP Conference Proceedings. AIP Publishing LLC: Melville, NY, USA, 2019; p. 050018. [Google Scholar] [CrossRef]
- Kakizaki, S.; Watanabe, M.; Kumai, S. Simulation and Experimental Analysis of Metal Jet Emission and Weld Interface Morphology in Impact Welding. Mater. Trans. 2011, 52, 1003–1008. [Google Scholar] [CrossRef]
- Emadinia, O.; Ramalho, A.M.; de Oliveira, I.V.; Taber, G.A.; Reis, A. Influence of Surface Preparation on the Interface of Al-Cu Joints Produced by Magnetic Pulse Welding. Metals 2020, 10, 997. [Google Scholar] [CrossRef]
- Li, J.S.; Sapanathan, T.; Raoelison, R.N.; Hou, Y.L.; Simar, A.; Rachik, M. On the complete interface development of Al/Cu magnetic pulse welding via experimental characterizations and multiphysics numerical simulations. J. Mater. Process. Technol. 2021, 296, 117185. [Google Scholar] [CrossRef]
- Lysak, V.I.; Kuzmin, S.V. Energy balance during explosive welding. J. Mater. Process. Technol. 2015, 222, 356–364. [Google Scholar] [CrossRef]
Publisher’s Note: MDPI stays neutral with regard to jurisdictional claims in published maps and institutional affiliations. |
© 2021 by the authors. Licensee MDPI, Basel, Switzerland. This article is an open access article distributed under the terms and conditions of the Creative Commons Attribution (CC BY) license (https://creativecommons.org/licenses/by/4.0/).