Article

An Improved Methodology for Determination of Fluorine in Biological Samples Using High-Resolution Molecular Absorption Spectrometry via Gallium Fluorine Formation in a Graphite Furnace

Biological and Chemical Research Centre, Faculty of Chemistry, University of Warsaw, Żwirki i Wigury 101, 02-089 Warsaw, Poland
*
Author to whom correspondence should be addressed.
Appl. Sci. 2021, 11(12), 5493; https://doi.org/10.3390/app11125493
Submission received: 12 May 2021 / Revised: 8 June 2021 / Accepted: 12 June 2021 / Published: 14 June 2021
(This article belongs to the Special Issue Atomic Spectroscopy: Theories, Methods and Applications)

Abstract

:

Featured Application

Determination of trace amounts of fluorine in biological samples using high-resolution molecular absorption spectrometry via gallium fluorine formation in a graphite furnace.

Abstract

Nowadays growing attention is paid to the control of fluorine content in samples of biological origin as it is present in the form of various biologically active organic compounds. Due to the chemically-rich matrix of biological tissues, the determination of fluorine becomes a very difficult task. Furthermore, a required complex sample preparation procedure makes the determination of the low contents of F by ion chromatography UV-Vis or ion-selective electrodes not possible. High-resolution continuum source graphite furnace molecular absorption spectrometry (HR-CS GF MAS) seems to be the best option for this purpose due to its high robustness to matrix interferences, especially in the presence of carefully selected modifiers. In this work the possibility of quantitative F determination in water and animal tissues was examined by measuring the molecular absorption of gallium monofluoride (GaF) at 211.248 nm with the use of a commercially available HR-CS GF MAS system. Experimental conditions for the sensitive and precise determination of fluorine were optimized, including the time/temperature program as well as addition of gallium and modifier mixture in combined mode. Under these conditions the fluoride present in the sample was stabilized up to 600 °C, and the optimum vaporization temperature for GaF was 1540 °C. Palladium and zirconium deposited onto the graphite surface served as solid modifiers; sodium acetate and ruthenium modifiers were added directly to the sample. The limit of detection and the characteristic mass of the method were 0.43 μg/L and 8.7 pg, respectively. The proposed procedure was validated by the use of certified reference materials (CRMs) of lake water and animal tissue; the acceptable recovery was obtained, proving that it can be applied for samples with a similar matrix.

Graphical Abstract

1. Introduction

The interest in the determination of fluorine increased over decades, which is due to its significant role in environment as well as in biological system. Although not a first one, though interesting work was published in 1941 by the U.S. National Bureau of Standards [1] on the quantitative determination of fluorine in organic compounds. Since that time a large number of papers has been published on the analytical procedure used for the determination of fluorine. The application of commonly used optical spectroscopy (inductively coupled plasma optical emission spectrometry—ICP-OES; atomic absorption spectroscopy—AAS) is limited due to the resonance lines of the fluorine being below 100 nm [2], also a very high ionisation potential (17.42 eV) limits the use of both optical techniques but also inductively coupled plasma mass spectrometry (ICP-MS). In practice fluorine has been determined, e.g., by ion-selective electrodes (ISE) [3], ion chromatography (IC) with electrochemical conductivity detector [4], UV-VIS [5] or cavity ring-down spectroscopy (CRDS) coupled with helium microwave-induced plasma [6]. Nonetheless, these techniques do not fulfil the specific requirements to be applicable for fluorine determination in biological objects.
Another nonconventional technique that can be applied in F determination is molecular absorption spectrometry (MAS) with the use of high-resolution continuum source (HR-CS MAS), which performance can be increased in the presence of matrix modifiers, and also those with the ability to serve as pretreatment modifiers as it was proposed for GF AAS measurements [7,8,9,10,11]. Interestingly, this technique is still not sufficiently explored, yet remains important in the field of molecular spectrometry, providing a resolution (k/Dk) of 175,000 in a 0.3 nm−1 nm range, corresponding to a bandwidth of 1.6 pm per pixel at 200 nm to 6.4 pm at 800 nm [12]. Fluorine is the most studied element via HR-CS MAS with graphite furnace (GF) atomization, among all halogens. This is mostly due to the high sensitivity that is provided by a formation of monofluoride molecules with selected metals. The limit of detection (LOD) for most halogens is at the level of nanograms, while for F a picogram level was achieved. The selectivity of F determination is usually better than for other halogens, as it is known to create stronger bonds with metals [13]. Fluorine can form the following molecules that are stable in gaseous form: GaF [2,14], CaF [15,16], SrF [17,18] or AlF [19,20], which offer the possibility of generating specific monofluoride molecules for a given matrix. Although AlF, CaF and SrF are known to be more thermally stable [15,17,19] than GaF, the last one [14] has been shown to be preferred in fluorine determination by HR-CS GF MAS due to the better sensitivity with the support of tailored modifier compositions and robustness concerning interferences thanks to the high spectral resolution. The only requirement is that the F has to be accompanied by a complex mixture of modifiers for the best performance.
Among the main applications of HR-CS GF MAS for F determination, the analyses of water [17], soil [21], coal [22], milk [16], baby food [23], flour [24], tea [15], fish and seafood [25], eye shadow [26] and etching solutions from the photovoltaic industry [20] can be mentioned. In most of these applications Ca was used as a molecule-forming agent and only in some cases were Al or Sr also applied. The samples were placed in the furnace without any treatment or only after a dilution with water. The molecular absorbance of GaF can also be applied for analysis of F in samples with relatively high fluorine content (e.g., toothpaste [27], novel fluorinated biological and environmental compounds [28,29], drug candidates [30]), as well as in samples with only trace amounts of F, such as drinking, mineral and river water [2,31,32] or cancer cells containing a fluorinated drug [33]). Nevertheless, most of these procedures have issues such as the need for sample pretreatment by using high-performance liquid chromatography (HPLC) coupled off-line to HR-CS GF MAS or troublesome automated sampling of insignificant amounts of a biological sample (e.g., animal tissue). The first attempt at fluorine quantification in liver tissues from rats treated with fluorinated drugs was described in our previous work [34]. To the best of our knowledge, this was the first attempt to apply HR-CS GF MAS for analysis of F in samples of animal origin after acid digestion.
The aim of this work is to design and validate the improved analytical protocol for determination of the total content of fluorine in selected biological tissues directly after acid digestion via monitoring of GaF molecules intended for trace amounts of F in samples.

2. Materials and Methods

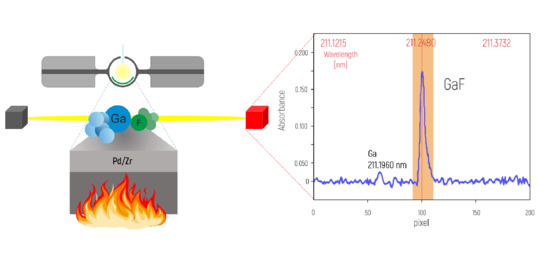
2.1. Instrumentation and Operating Conditions

A high-resolution continuum source atomic absorption spectrometer ContrAA 700 (Analytik Jena, Jena, Germany) with a transversely heated graphite tube atomizer was used for the measurement of total fluorine. The developed procedure applies the generation of gallium monofluoride (GaF) followed by monitoring of its molecular absorption [2]. The instrument is equipped with a 300 W xenon short-arc lamp (XBO 301, GLE, Dortmund, Germany) operating in a hot-spot mode as a continuous radiation source for the wavelength range from 185 nm–900 nm, high resolution double monochromator consisting of a prism for pre-dispersion, an echelle monochromator and a charge-coupled device (CCD) array detector. All measurements were performed using pyrolytically coated graphite tubes with integrated PIN-platform (Analytik Jena); the molecular absorption of gallium mono-fluoride (GaF) was measured at 211.248 nm, within the spectral range 211.1215 nm and 211.3732 nm. The optimized graphite furnace temperature/time program used for fluorine total content determination is shown in Table 1. More details are provided in Section 3.1.

2.2. Reagents and Solutions

Analytical reagent grade chemicals were used (Merck, Darmstadt, Germany; EMD Millipore, Darmstadt, Germany). Fluoride standard solution traceable to a standard reference material (SRM) from the National Institute of Standards and Technology (NIST, Gaithersburg, MD, USA) NaF in H₂O (1000 mg/L F) was purchased from Merck. Certified Reference Materials (CRM) were used: bovine liver tissue NIST 1577c (NIST); MODAS-5 cod tissue (Consortium MODAS, Warsaw, Poland); CRANBERRY-05 lake water; ONTARIO-12 lake water (Environment and Climate Change Canada, Ottawa, ON, Canada). Analytical grade nitric acid, 65% (EMD Millipore) was used for sample digestion. Samples and standards were diluted with deionized water obtained by a Milli-Q System (18.2 MΩ cm; EMD Millipore). Palladium nitrate (2% Pd in 5% HNO3, SPC Science, Ottawa, ON, Canada), zirconium ICP standard (ZrCl4 in 7% HCl, 1000 mg/L Zr, Merck), ruthenium (1000 mg/L Ru in 20% HCl, VHG Labs, USA) solutions and sodium acetate trihydrate (Avantor™ Performance Materials Poland S.A., Gliwice, Poland) were used for preparation of modifiers solutions. Gallium(III) nitrate hydrate (99.9%, Merck, Darmstadt, Germany) was used as molecule-forming agent.

2.3. Sample Preparation

A microwave system UltraWAVE (Milestone, Sorisole, Italy) was used for the digestion of biological CRMs for the determination of total content of fluorine. The digestion of around 300 mg of samples (bovine liver or cod tissues) in concentrated nitric acid was performed under the following program: 20 min up to 220 °C and 15 min at 220 °C. In order to protect the graphite surface, the cooled digests were slightly diluted with water to a final concentration of HNO3 of around 20%, still exhibiting low pH below 2.

3. Results and Discussion

3.1. Method Development

In the case of HR-CS MAS the method development covers the optimization of temperatures of main processes, e.g., the process of thermal deposition of modifiers, then thermal pretreatment of the sample as such, and finally the formation of di-molecules containing fluorine. The conditions for pyrolysis of the sample and for the process of GaF formation as well as its vaporization are crucial, as they affect the sensitivity of the determination of fluorine. The initial experimental conditions were adopted from [27], but as they did not provide the expected sensitivity and precision of results, the careful optimization of all parameters were carried out. Then the selection of the wavelength range for the monitoring of molecular absorption signal for GaF as well as its closed surrounding leaded to the range between 211.1215 nm and 211.3732 nm, which is very close to values published in recent paper (e.g., 211.1230 nm–211.3718 nm [35]). The selected range cover also the atomic line of Ga (211.196 nm) [33], which ensure the monitoring of the presence of gallium atoms in gaseous phase.

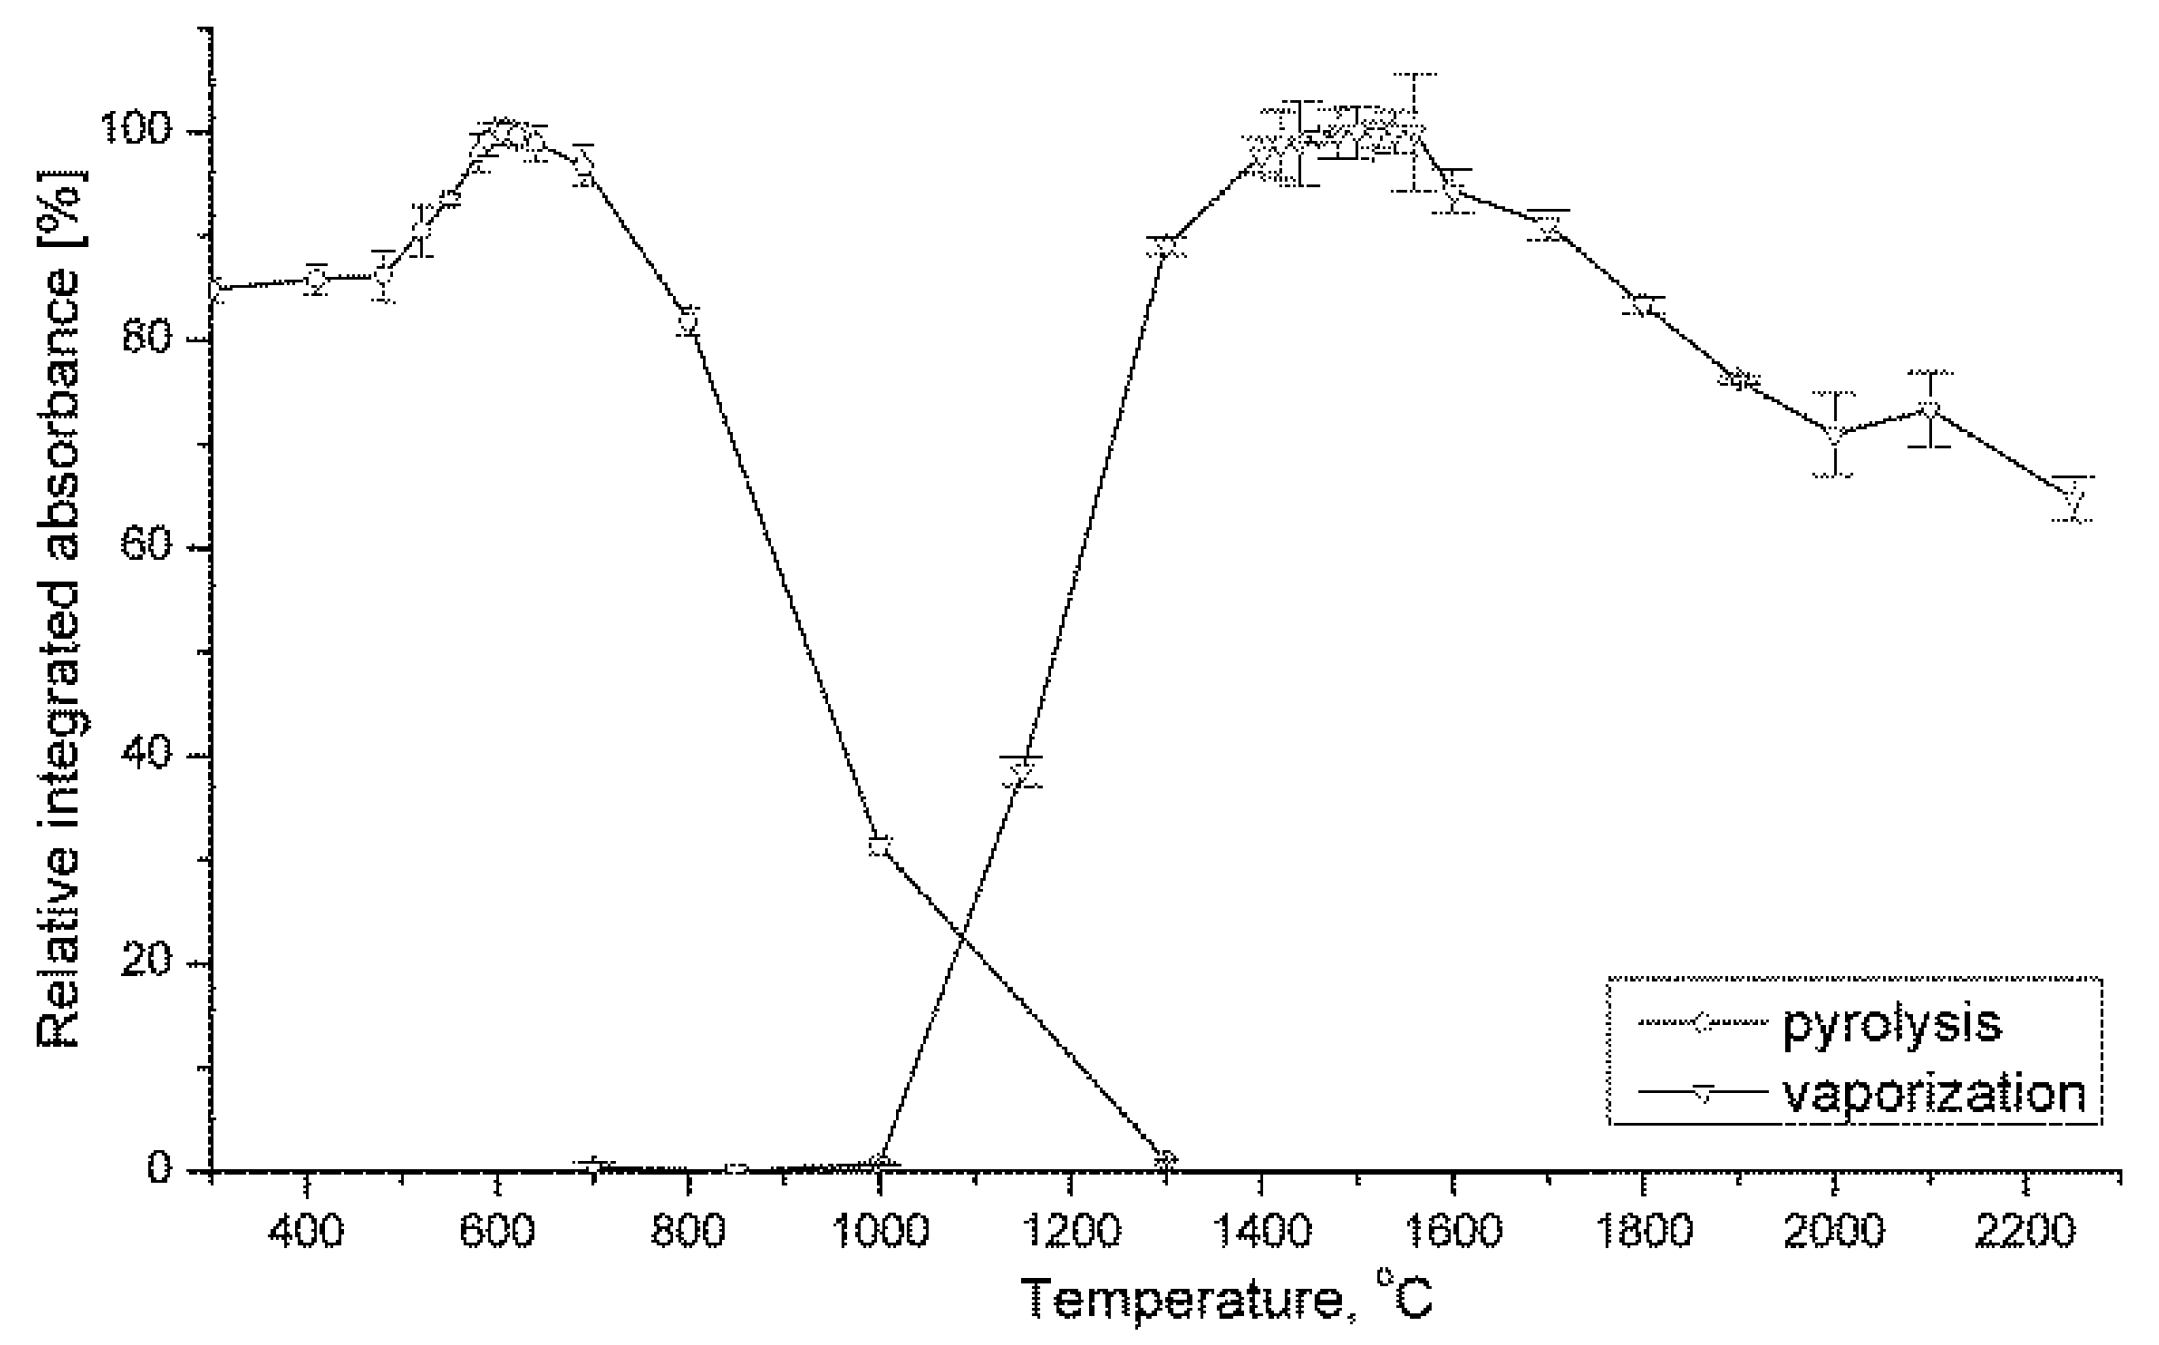
3.1.1. Pyrolysis and Vaporization Conditions

The pyrolysis and vaporization curve for an aqueous solution of NaF (20 µL of the 100 µg/L solution) are given in Figure 1. Interestingly, changing the pyrolysis temperature, integrated absorbance increased for about 15% within the range from 300 °C to 580 °C, then a narrow range between 580 °C and 640 °C with a plateau was observed. After that a typical dropdown of the integrated absorbance was noticed and a complete analyte loss at 1300 °C.
A pyrolysis temperature of 600 °C was chosen as an optimum for all further experiments. Comparing to previous reports, where 500 °C [14,30,31,36] and 550 °C [2,27,28,29] were applied, selected conditions assure more efficient removal of volatile matrix components. Indeed, even higher pyrolysis temperature was reported (700 °C [33]) with the mixture of zirconium and calcium as chemical modifiers. Despite reaching a higher pyrolysis temperature, it is worth to notice possible interferences of CaF on the GaF, thus this option was withdrawn from further consideration.
Changing the vaporization temperature, the appearance of gallium monofluoride in gaseous phase can be registered above 1000 °C. Then the integrated absorbance increases rapidly between 1000 °C–1400 °C reaching the plateau within 1400 °C–1600 °C. The further increase of vaporization temperature leads to a consistent absorbance decrease that refers to an analyte loss caused most probably by thermal decomposition of GaF, as it occurs in the case of CaF [21]. More detailed measurements were carried out within the plateau range to establish conditions assuring best sensitivity accompanied with the best precision of measurements, expressed as lowest relative standard deviation. The optimum temperature for GaF vaporization turned out to be 1540 °C and as it is consistent with those previously reported [2,27,31,36], it was used in all further investigations.

3.1.2. Effect of Pd/Zr Modifier

Indirect measurement of F in a form of GaF molecule requires the application of palladium as a modifier to enhance the efficiency of the transformation into GaF, to avoid the low-temperature fluorine losses, mainly in the form of volatile HF, and to obtain a sharp molecular absorption signal [2]. Additional use of Zr was also proposed, which usually results in a considerable increase in sensitivity [14]; moreover is known to support suppression of phosphorus monoxide formation (PO) [37]. An attempt was made to use a mixture of Pd/Zr as a modifier, thermally pretreated before each sample injection; mainly to find out the optimum modifier masses in order to achieve the best performance in respect to the sensitivity.
For this purpose different amounts of the mixture of Pd/Zr were deposited onto the graphite furnace in order to find optimal amount and still to compare with values reported by Gleisner et al. [2] (m0, 5 µg of Pd and 0.1 µg of Zr). It turned out that the application of 1.5 times higher masses of modifiers than previously reported values results in an increase in sensitivity of about 10% (Figure 2). However, further addition of higher masses of Pd/Zr modifier led to a gradual and considerable decrease in signal intensity. The addition of 7.5 µg of Pd and 0.15 µg of Zr was considered as the best option and was used in all further investigations.

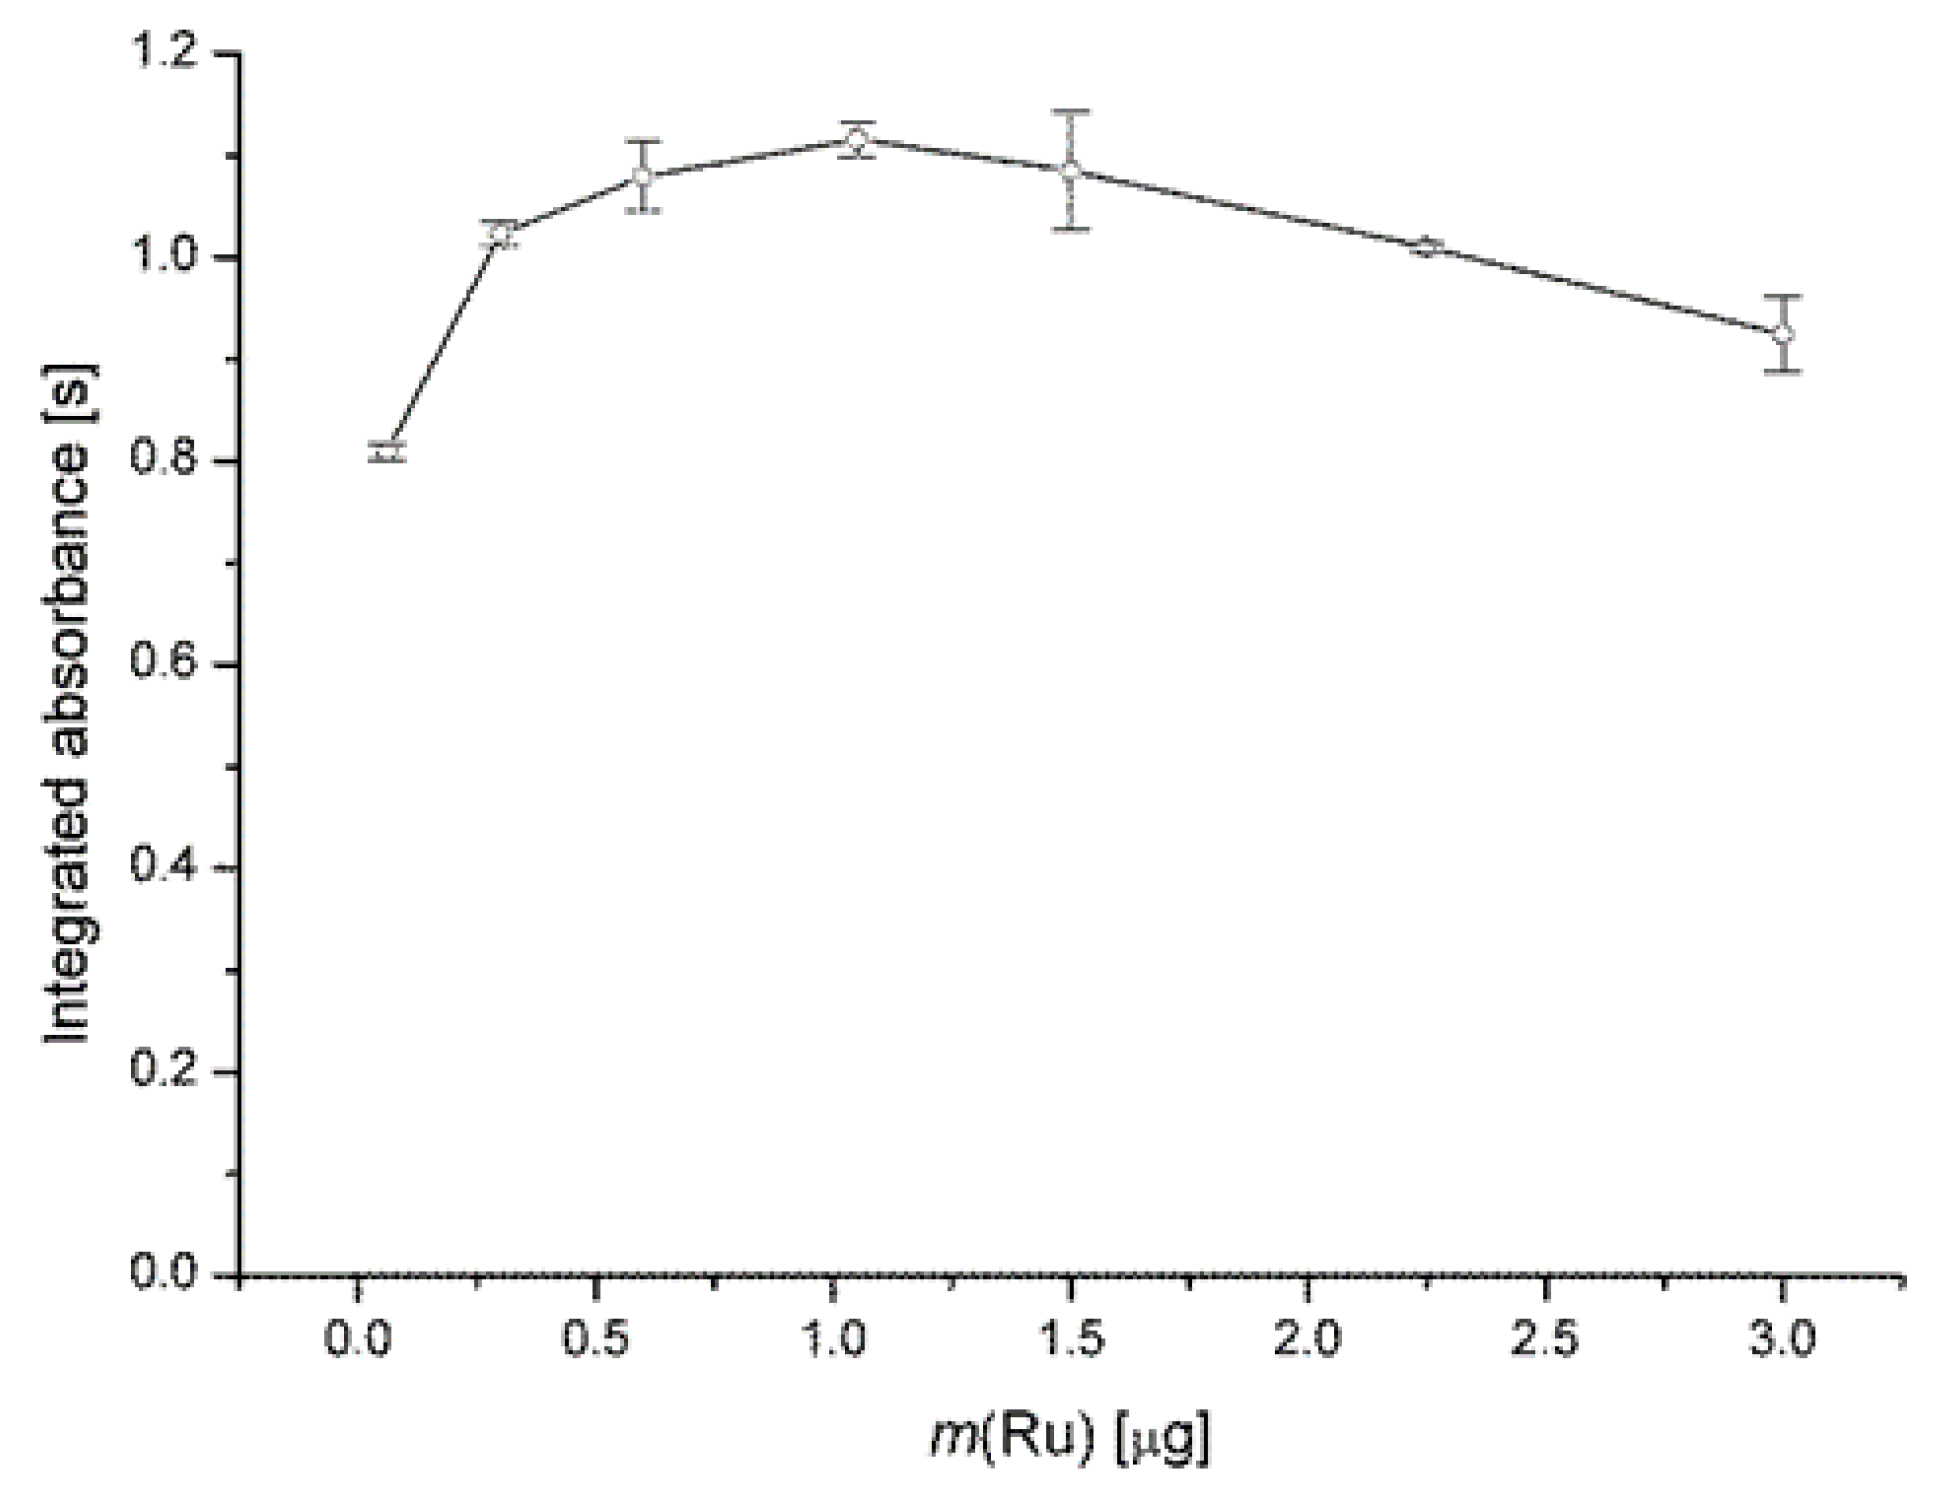
3.1.3. Effect of Ru(III) Modifier

It is also know that some transition metals, such as ruthenium, can significantly enhance the formation of GaF by reducing the interfering formation of GaO, which usually results in further sensitivity increase [2]. In our approach, instead of Ru(III) nitrosyl nitrate [2], the solution of RuCl3 in HCl was used and the mass of modifier was optimized versus the intensity of GaF signal. The results shown in Figure 3 indicate that the optimum mass of ruthenium introduced in a form of RuCl3 in 20% HCl is around 1 µg. Thus with the applied time/temperature program for graphite furnace, the amount of 3 µg of Ru recommended in literature [2,34] is not necessary for the best sensitivity.

3.1.4. Optimization of the Amount of Gallium

The last step of the optimization process was the search for the highest yield of GaF molecules formation by adding increasing amounts of gallium(III) nitrite monohydrate as a molecule-forming agent. For this purpose, we used the combined mode of the application of gallium as molecule forming agent solution, meaning that part of gallium was deposited on the surface of graphite along with the Pd/Zr modifier (step 1–5 in Table 1), and part of gallium was added directly to the sample, then introduced together at step 7 (Table 1).
In order to optimize the amount of gallium introduced in both modes, firstly different masses, up to 600 µg of Ga, were deposited onto the graphite surface, when 20 µg of Ga were still added with the sample as in our previous work [34]. The results show that the integrated absorbance grows as the amount of Ga grows (Figure 4), indicating that the formation of GaF is correlated with the mass of Ga deposited on the graphite. A value of 500 µg Ga(III) (25 µL of the 20 g/L solution) was selected for further investigation due to the following technical limitations: (1) it is not recommended to inject more than 50 µL of all solutions into the graphite tube with integrated PIN platform; (2) the solutions of Ga(NO3)3 become turbid at the Ga(III) concentration higher than 25 g/L.
The alternative option is the addition of gallium(III) nitrite monohydrate solution into the furnace together with the sample solution. In this work we use the combined mode of the use of gallium, as to support the GaF formation on two levels, deposited on the graphite surface and being present in the solutions. Two amounts of Ga (60 µg and 800 µg) were selected for the evaluation of the performance of gallium as GaF molecular formation agent.
According to Figure 5, samples with a low amount of Ga used for pretreatment have usually 20–30% lower light absorbance than those from the second set with a high mass of Ga even at high contents of Ga taken together with the sample directly before the measurement. In order to obtain much more robust results and higher signal intensity it is recommended to introduce higher masses of Ga during thermal pretreatment than together with the sample.
Figure 6 shows an example of the time-resolved molecular absorbance spectrum in the wavelength range of 211.1215 nm–211.3732 nm obtained during the analysis of F in the form of GaF under different conditions. A sharp absorption band from gallium monofluoride with a spectral width of around 8 pm is situated in the middle of the analyzed spectral range. A signal that appears afterwards and at lower wavelength comes from Ga atoms [38] due to their presence in the entire system [33]. Some other signals from Ga atoms may be expected in the target spectral range, but they are significantly smaller, than the one that can be seen on Figure 6, thus can be neglected. The application of the proposed modifiers set suppresses this signal, so it does not interfere with the band of GaF. As it can be seen at Figure 6, no other signals of interferences can be found in the studied spectral range. In particular, the signal from phosphorus monoxide could originating from the biological matrix, but it is not observed (Figure 6D). The signal at 211.248 nm is proportional to the amounts of gallium. It is essentially important that plots on Figure 6C,D for water and bovine liver digest, respectively, are very similar, which means that the possible matrix effects are limited.

3.2. Method Validation

Validation covers the entire analytical procedure, including biological sample preparation (acid digestion) as well as instrumental parameters (time/temperature program, reagents amount, wavelength) that provided the highest signal response from GaF. The selected reagent concentrations and volumes are listed in Table 2, together with their mode of application.
Sodium acetate was used as to create a buffer and prevent losses of fluorine in the form of HF during the drying and pyrolysis stages. The improved procedure, which includes the process of acid digestion, allows for the determination of fluorine in samples at low pH values of their solutions (up to C(H+) = 7 mol/L), which is unique and advantageous in the context of the analysis of biological samples. Notably, fluorine determination independent of its solution pH is inaccessible by the widely used ISE method.
The equation for quantification of F taken from the calibration curve was y = 0.102x + 0.1302, where x—the concentration of fluorine; y—integrated absorbance. The coefficient of determination (R2) and the characteristic mass (m0) of the reported method were 0.9992 and 8.7 pg of F, respectively. The calculated LOD of the method was constituted on the basis of three times the standard deviation of 10 repetitive blank measurements (using all the reagents listed in Table 2 and replacing the sample with deionized water) divided by the slope of the calibration curve. Thus, the LOD for 20 μL of sample volume was 0.43 μg/L of F and 8.5 pg of absolute F, respectively. This is comparable with other reports that applied HR-CS GF MAS with GaF formation (4 pg–33 pg of absolute F [2,14,27,28,30,33]). It is worth mentioning that such a low LOD cannot be reached using other molecule-forming agents (Ca, Sr or Al) [15,17,19]. The linear range of calibration was found for F concentrations to be 2.0 µg/L–2000 µg/L (40 pg–40 ng of F).
In order to check the robustness of the proposed procedure to potential matrix effects, first a digest of biological CRM (NIST 1577c or MODAS-5) was added directly into the furnace. The concentration of F was below the limit of detection, so its content in CRMs could be neglected. Then the same set of samples was spiked with a known amount of F standard before acid digestion and they were analyzed according to the proposed procedure. In addition, the samples with high fluorine content were measured in different dilutions and selected results were compared with the fluorine reference values for available water CRMs. An acceptable recovery factor (93–106%) confirmed the negligible influence of matrix components on the determination of fluorine in biological samples (Table 3). This proves that the improved procedure allows for the determination of fluorine in samples at low pH values of their solutions after calibration against aqueous standard solutions.

4. Conclusions

An improved analytical procedure has been developed and validated for the determination of trace amount of fluorine in biological samples using the molecular absorption of the GaF molecule. Modifiers and molecule-forming agents were applied in combined mode, both via thermal deposition in graphite furnace and addition to the sample. Thus, the calibration against aqueous standard solutions was possible. By using the complex matrix mixture, it was possible to enhance the pyrolysis temperature, which provides more efficient removal of matrix components. The commonly used ruthenium(III) nitrosyl nitrate was substituted by RuCl3 in 20% HCl. The sensitivity and the limit of detection obtained are comparable with other reports that applied HR-CS GF MAS, including the one developed in our laboratory. The validated analytical protocol allows to determine low amount of fluorine directly after acid digestion of biological samples, which was impossible using other methods.

Author Contributions

Conceptualization, E.B.; methodology, A.G., A.T., A.R. and E.B., software, A.G. and A.T.; validation A.G., A.T. and A.R.; formal analysis, A.G. and A.T.; investigation, A.G., A.T., A.R. and E.B.; resources, A.T. and E.B.; data curation, A.G. and A.T.; writing—original draft preparation, A.G., A.T., A.R. and E.B.; writing—review and editing, A.G., A.T., A.R. and E.B.; visualization, A.G. and A.T. and supervision, E.B. All authors have read and agreed to the published version of the manuscript.

Funding

This research received no external funding.

Institutional Review Board Statement

Not applicable.

Informed Consent Statement

Not applicable.

Data Availability Statement

The data presented in this study are available on request from the corresponding author. The data are not publicly available due to department requirements.

Acknowledgments

The study was carried out at the Biological and Chemical Research Centre, University of Warsaw established within the project co-financed by European Union from the European Regional Development Fund under the Operational Programme Innovative Economy 2007–2013. The study was financed by “Excellence Initiative—Research University (2020–2026)” under the programme of the Ministry of Science and Higher Education of Poland.

Conflicts of Interest

The authors declare no conflict of interest.

References

  1. Brauns, D.H. Quantitative determination of fluorine in organic compounds. J. Res. Natl. Bur. Stand. (1934) 1941, 27, 105. [Google Scholar] [CrossRef]
  2. Gleisner, H.; Welz, B.; Einax, J.W. Optimization of fluorine determination via the molecular absorption of gallium mono-fluoride in a graphite furnace using a high-resolution continuum source spectrometer. Spectrochim. Acta Part B At. Spectrosc. 2010, 65, 864–869. [Google Scholar] [CrossRef]
  3. Borjigin, S.; Ashimura, Y.; Yoshioka, T.; Mizoguchi, T. Determination of Fluoride Using Ion-selective Electrodes in the Presence of Aluminum. Anal. Sci. 2009, 25, 1437–1443. [Google Scholar] [CrossRef] [Green Version]
  4. Hang, Y.-P.; Liu, J.-M. Determination of fluoride by an ion chromatography system using the preconcentration on nanometer-size zirconia. J. Anal. Chem. 2007, 62, 583–587. [Google Scholar] [CrossRef]
  5. Barghouthi, Z.; Amereih, S. Spectrophotometric Determination of Fluoride in Groundwater Using Resorcin Blue Complexes. Am. J. Anal. Chem. 2012, 03, 651–655. [Google Scholar] [CrossRef] [Green Version]
  6. Stacewicz, T.; Bulska, E.; Ruszczyńska, A. Cavity Ring-Down Spectroscopy coupled with helium microwave-induced plasma for fluorine detection. Spectrochim. Acta Part B At. Spectrosc. 2010, 65, 306–310. [Google Scholar] [CrossRef]
  7. Bulska, E.; Jȩdral, W. Application of palladium- and rhodium-plating of the graphite furnace in electrothermal atomic absorption spectrometry. J. Anal. At. Spectrom. 1995, 10, 49–53. [Google Scholar] [CrossRef]
  8. Bulska, E.; Kandler, W.; Hulanicki, A. Noble metals as permanent modifiers for the determination of mercury by electrothermal atomic absorption spectrometry. Spectrochim. Acta Part B At. Spectrosc. 1996, 51, 1263–1270. [Google Scholar] [CrossRef]
  9. Bulska, E. Modifiers in Graphite Furnace Atomic Absorption Spectrometry-Mechanisms and Applications. Encycl. Anal. Chem. 2009, 1–11. [Google Scholar] [CrossRef]
  10. Wojciechowski, M.; Piaścik, M.; Bulska, E. Noble metal modifiers for antimony determination by graphite furnace atomic absorption spectrometry in biological samples. J. Anal. At. Spectrom. 2001, 16, 99–101. [Google Scholar] [CrossRef]
  11. Ortner, H.M.; Bulska, E.; Rohr, U.; Schlemmer, G.; Weinbruch, S.; Welz, B. Modifiers and coatings in graphite furnace atomic absorption spectrometry-Mechanisms of action (A tutorial review). Spectrochim. Acta Part B At. Spectrosc. 2002, 57, 1835–1853. [Google Scholar] [CrossRef]
  12. Welz, B.; Morés, S.; Carasek, E.; Vale, M.G.R.; Okruss, M.; Becker-Ross, H. High-resolution continuum source atomic and molecular absorption spectrometry-A review. Appl. Spectrosc. Rev. 2010, 45, 327–354. [Google Scholar] [CrossRef]
  13. Resano, M.; Flórez, M.R.; García-Ruiz, E. Progress in the determination of metalloids and non-metals by means of high-resolution continuum source atomic or molecular absorption spectrometry. A critical review. Anal. Bioanal. Chem. 2014, 406, 2239–2259. [Google Scholar] [CrossRef]
  14. Heitmann, U.; Becker-Ross, H.; Florek, S.; Huang, M.D.; Okruss, M. Determination of non-metals via molecular absorption using high-resolution continuum source absorption spectrometry and graphite furnace atomization. J. Anal. At. Spectrom. 2006, 21, 1314–1320. [Google Scholar] [CrossRef]
  15. Morés, S.; Monteiro, G.C.; Santos, F.D.S.; Carasek, E.; Welz, B. Determination of fluorine in tea using high-resolution molecular absorption spectrometry with electrothermal vaporization of the calcium mono-fluoride CaF. Talanta 2011, 85, 2681–2685. [Google Scholar] [CrossRef] [Green Version]
  16. Ozbek, N.; Akman, S. Determination of fluorine in milk samples via calcium-monofluoride by electrothermal molecular absorption spectrometry. Food Chem. 2013, 138, 650–654. [Google Scholar] [CrossRef] [PubMed]
  17. Ozbek, N.; Akman, S. Method development for the determination of fluorine in water samples via the molecular absorption of strontium monofluoride formed in an electrothermal atomizer. Spectrochim. Acta Part B At. Spectrosc. 2012, 69, 32–37. [Google Scholar] [CrossRef]
  18. Ozbek, N.; Akman, S. Molecule Formation Mechanisms of Strontium Mono Fluoride in High-Resolution Continuum Source Electrothermal Atomic Absorption Spectrometry. Anal. Sci. 2013, 29, 741–746. [Google Scholar] [CrossRef] [Green Version]
  19. Aramendía, M.; Flórez, M.R.; Piette, M.; Vanhaecke, F.; Resano, M. Al determination in whole blood samples as AlF via high-resolution continuum source graphite furnace molecular absorption spectrometry: Potential application to forensic diagnosis of drowning. J. Anal. At. Spectrom. 2011, 26, 1964–1973. [Google Scholar] [CrossRef]
  20. Bücker, S.; Acker, J. Spectrometric analysis of process etching solutions of the photovoltaic industry-Determination of HNO3, HF, and H2SiF 6 using high-resolution continuum source absorption spectrometry of diatomic molecules and atoms. Talanta 2012, 94, 335–341. [Google Scholar] [CrossRef]
  21. Boschetti, W.; Dessuy, M.B.; Pizzato, A.H.; Vale, M.G.R. New analytical method for total fluorine determination in soil samples using high-resolution continuum source graphite furnace molecular absorption spectrometry. Microchem. J. 2017, 130, 276–280. [Google Scholar] [CrossRef]
  22. Machado, P.M.; Morés, S.; Pereira, É.R.; Welz, B.; Carasek, E.; De Andrade, J.B. Fluorine determination in coal using high-resolution graphite furnace molecular absorption spectrometry and direct solid sample analysis. Spectrochim. Acta Part B At. Spectrosc. 2015, 105, 18–24. [Google Scholar] [CrossRef]
  23. Ozbek, N.; Akman, S. Solid sampling determination of total fluorine in baby food samples by high-resolution continuum source graphite furnace molecular absorption spectrometry. Food Chem. 2016, 211, 180–184. [Google Scholar] [CrossRef]
  24. Ozbek, N.; Akman, S. Optimization and Application of a Slurry Sampling Method for the Determination of Total Fluorine in Flour Using a High-Resolution Continuum Source Graphite Furnace Molecular Absorption Spectrometer. Food Anal. Methods 2016, 9, 2925–2932. [Google Scholar] [CrossRef]
  25. Ozbek, N.; Akman, S. Application of Solid Sampling for the Determination of Total Fluorine in Fish and Seafood by High-Resolution Continuum Source Graphite Furnace Molecular Absorption Spectrometry. Anal. Lett. 2018, 51, 2776–2789. [Google Scholar] [CrossRef]
  26. Borges, A.R.; Duarte, Á.T.; da Potes, M.L.; Silva, M.M.; Vale, M.G.R.; Welz, B. Fluorine in eye shadow: Development of method using high-resolution continuum source graphite furnace molecular absorption spectrometry via calcium mono-fluoride with direct solid sample introduction. Microchem. J. 2016, 124, 410–415. [Google Scholar] [CrossRef]
  27. Gleisner, H.; Einax, J.W.; Morés, S.; Welz, B.; Carasek, E. A fast and accurate method for the determination of total and soluble fluorine in toothpaste using high-resolution graphite furnace molecular absorption spectrometry and its comparison with established techniques. J. Pharm. Biomed. Anal. 2011, 54, 1040–1046. [Google Scholar] [CrossRef] [PubMed]
  28. Qin, Z.; McNee, D.; Gleisner, H.; Raab, A.; Kyeremeh, K.; Jaspars, M.; Krupp, E.; Deng, H.; Feldmann, J. Fluorine speciation analysis using reverse phase liquid chromatography coupled off-line to continuum source molecular absorption spectrometry (CS-MAS): Identification and quantification of novel fluorinated organic compounds in environmental and biologica. Anal. Chem. 2012, 84, 6213–6219. [Google Scholar] [CrossRef]
  29. Qin, Z.; Raab, A.; Krupp, E.; Deng, H.; Feldmann, J. Mining complex bacteria media for all fluorinated compounds made possible by using HPLC coupled parallel to fluorine-specific and molecular specific detection. J. Anal. At. Spectrom. 2013, 28, 877. [Google Scholar] [CrossRef]
  30. Würtenberger, I.; Gust, R. A highly sensitive method for in vitro testing of fluorinated drug candidates using high-resolution continuum source molecular absorption spectrometry (HR-CS MAS). Anal. Bioanal. Chem. 2014, 406, 3431–3442. [Google Scholar] [CrossRef]
  31. Metzger, M.; Ley, P.; Sturm, M.; Meermann, B. Screening method for extractable organically bound fluorine (EOF) in river water samples by means of high-resolution–continuum source graphite furnace molecular absorption spectrometry (HR-CS GF MAS). Anal. Bioanal. Chem. 2019, 411, 4647–4660. [Google Scholar] [CrossRef]
  32. Gehrenkemper, L.; Simon, F.; Roesch, P.; Fischer, E.; von der Au, M.; Pfeifer, J.; Cossmer, A.; Wittwer, P.; Vogel, C.; Simon, F.G.; et al. Determination of organically bound fluorine sum parameters in river water samples—comparison of combustion ion chromatography (CIC) and high resolution-continuum source-graphite furnace molecular absorption spectrometry (HR-CS-GFMAS). Anal. Bioanal. Chem. 2021, 413, 103–115. [Google Scholar] [CrossRef] [PubMed]
  33. Krüger, M.; Huang, M.-D.; Becker-Roß, H.; Florek, S.; Ott, I.; Gust, R. Quantification of the fluorine containing drug 5-fluorouracil in cancer cells by GaF molecular absorption via high-resolution continuum source molecular absorption spectrometry. Spectrochim. Acta Part B At. Spectrosc. 2012, 69, 50–55. [Google Scholar] [CrossRef]
  34. Gawor, A.; Konopka, A.; Ruszczyńska, A.; Pączek, L.; Gajewski, Z.; Bulska, E. Molecular absorption and mass spectrometry for complementary analytical study of fluorinated drugs in animal organisms. J. Anal. At. Spectrom. 2020, 35, 1840–1847. [Google Scholar] [CrossRef]
  35. Kowalewska, Z.; Brzezińska, K.; Zieliński, J.; Pilarczyk, J. Method development for determination of organic fluorine in gasoline and its components using high-resolution continuum source flame molecular absorption spectrometry with gallium fluoride as a target molecule. Talanta 2021, 227, 122205. [Google Scholar] [CrossRef]
  36. Ley, P.; Sturm, M.; Ternes, T.A.; Meermann, B. High-resolution continuum source graphite furnace molecular absorption spectrometry compared with ion chromatography for quantitative determination of dissolved fluoride in river water samples. Anal. Bioanal. Chem. 2017, 409, 6949–6958. [Google Scholar] [CrossRef] [PubMed]
  37. Huang, M.D.; Becker-Ross, H.; Florek, S.; Heitmann, U.; Okruss, M. The influence of calcium and magnesium on the phosphorus monoxide molecular absorption signal in the determination of phosphorus using a continuum source absorption spectrometer and an air-acetylene flame. J. Anal. At. Spectrom. 2006, 21, 346–349. [Google Scholar] [CrossRef]
  38. Shirai, T.; Reader, J.; Kramida, A.E.; Sugar, J. Spectral Data for Gallium: Ga I through Ga XXXI. J. Phys. Chem. Ref. Data 2007, 36, 509–615. [Google Scholar] [CrossRef]
Figure 1. Dependence of GaF molecule relative absorbance at 211.248 nm on vaporization temperature (Tvapor.) (Tpyrol. = 550 °C) and pyrolysis temperature (Tpyrol.) (Tvapor. = 1540 °C); m(Pd) = 5.0 µg; m(Zr) = 0.1 µg; m(Ru) = 3.0 µg; C(Gapretr.) = 50 µg; m(Gasol.) = 20 µg; m(CH3COONa) = 5.0 µg.
Applsci 11 05493 g001
Figure 2. Dependence of GaF molecule absorbance at 211.248 nm on the relative mass of palladium/zirconium modifier used for furnace pretreatment; Tpyrol. = 600 °C; Tvapor. = 1540 °C; mo(Pd) = 5.0 µg; mo(Zr) = 0.1 µg [2]; m(Ru) = 3.0 µg; C(Gapretr.) = 50 µg; m(Gasol.) = 20 µg; m(CH3COONa) = 5.0 µg.
Applsci 11 05493 g002
Figure 3. Dependence of GaF molecule absorbance at 211.248 nm on the mass of ruthenium in the modifier solution; Tpyrol. = 600 °C; Tvapor. = 1540 °C; m(Pd) = 7.5 µg; m(Zr) = 0.15 µg; C(Gapretr.) = 50 µg; m(Gasol.) = 20 µg; m(CH3COONa) = 5.0 µg.
Applsci 11 05493 g003
Figure 4. Dependence of GaF molecule absorbance at 211.248 nm on Ga mass added for furnace pretreatment; Tpyrol. = 600 °C; Tvapor. = 1540 °C; m(Pd) = 7.5 µg; m(Zr) = 0.15 µg; m(Ru) = 1.0 µg; m(Gasol.) = 20 µg; m(CH3COONa) = 5.0 µg.
Applsci 11 05493 g004
Figure 5. Dependence of GaF molecule absorbance at 211.248 nm on Ga mass added to the sample solution after furnace pretreatment with 60 µg (A) and 800 µg (B) of Ga; Tpyrol. = 600 °C; Tvapor. = 1540 °C; m(Pd) = 7.5 µg; m(Zr) = 0.15 µg; m(Ru) = 1.0 µg; m(CH3COONa) = 5.0 µg.
Applsci 11 05493 g005
Figure 6. Time- and wavelength-resolved absorbance spectrum during the analysis of F (NaF SRM) in a form of GaF (pixels correspond to the wavelength range between 211.1215 nm and 211.3732 nm) without modifiers (A) 1 ng F in water, and with modifiers: (B) 0.2 ng F in water; (C) 1 ng F in water; (D) 1 ng F added to bovine liver matrix. Modifiers: m(Pd) = 7.5 µg; m(Zr) = 0.15 µg; m(Ru) = 1.0 µg; m(Gapretr.) = 500 µg; m(Gasol.) = 20 µg; m(CH3COONa) = 5.0 µg.
Applsci 11 05493 g006
Table 1. Graphite furnace temperature/time program for Pd/Zr modifier and Ga deposition on graphite furnace (steps 1–5); addition of sodium acetate and ruthenium modifier (step 6). Sample thermal pretreatment (steps 7 to 10) and GaF molecules evaporation (step 11).
StepProcessTemperature
[°C ]
Ramp
[°C/s]
Hold
[s]
1Drying I8072
2Drying II951020
3Drying III1202010
4Drying IV35020010
5Pretreatment110030010
6Cooling70--20
7Sample injection70--
8Drying1052030
9Pyrolysis60055010
10Auto Zero600-5
11Vaporization154015407
12Clean24505004
Table 2. Concentrations and volumes of the modifier solutions and the Ga reagent used for thermal pretreatment and injection together with the sample.
Mode
of Application
ComponentsConcentrationVolume [µL]
Thermal depositionPd + Zr0.15% m/v Pd, 30 mg/L Zr5
Thermal depositionGa in HNO320 g/L25
Added with the sampleRu in HCl0.2 g/L Ru5
Added with the sampleGa in HNO32 g/L10
Added with the sampleCH3COONa1 g/L5
Added in step 7sample or standardvariable20
Table 3. Recovery factors for the determination of fluorine in certified reference material of waters and spiked experiment in selected biological certified reference material.
CRMOriginCertified/Added F Content [µg/L]Found F Content [µg/L]Recovery Factor [%]
CRANBERRY-05lake water70 ± 2672 ± 2103
ONTARIO-12lake water114 ± 24106 ± 193
NIST 1577cbovine liver25 126.4 ± 0.3106
NIST 1577cbovine liver50 150.0 ± 1.1100
MODAS-5cod tissue25 125.7 ± 0.7103
MODAS-5cod tissue50 149.7 ± 1.099
1 according to the spike of the fluoride standard solution.
Publisher’s Note: MDPI stays neutral with regard to jurisdictional claims in published maps and institutional affiliations.

