Abstract
Hypertension has become the greatest risk factor for death in elderly populations. As factors influencing cardiovascular disease, indoor environmental parameters pose potential risks for older adults. In this study, elderly residents in Dalian (Liaoning Province, China) urban dwellings were selected as the research subjects, and the environmental parameters of the dwellings’ main activity rooms and the blood pressure parameters of the older adults were measured. Based on the Long Short-Term Memory (LSTM) deep learning algorithm and Bayesian fitting method, a hypertension disease model was established using the long-term environmental parameters to predict the hypertension risk of older adults in their building’s environment. The results showed that temperature, humidity, and some air quality parameters had an impact on blood pressure under single environmental factor, and the comprehensive environmental risks of high systolic blood pressure, high diastolic blood pressure, and high blood pressure were 16.44%, 0%, and 16.44% for the male elderly and 14.11%, 7.14%, and 17.55% for the female elderly, respectively. By comparing the results for the blood pressure measurement and prediction, it can be observed that the risk error of hypertension obtained by the algorithm maintains the variables’ relationship, and the result of the algorithm is reliable in this period. This technology can provide a basis for measuring environmental parameters and will be conducive to the development of an ecological smart building environment.
1. Introduction
With the development of urbanization, developed countries experienced a population demographic transformation, and the percentage of older adults increased. It is estimated that by 2035, the number of elderly people and the level of aging in the world will be 392 million and 30.5%, respectively, thus making the world a severely aging society [1]. According to data released by the National Bureau of Statistics of China, by the end of 2019, the population over 60 years old accounted for 18.1% of the total, and the population over 65 years old accounted for 12.6% [2]. The American Society of Heating, Refrigerating and Air-Conditioning Engineers (ASHRAE) standard mentions that the indoor environment will affect human health, and the environment is related to physical health conditions [3]. It is mentioned in some papers that, due to harsh indoor environments or environmental pollution, people may become susceptible to related diseases and building syndromes [4,5]. Compared to other people, the elderly have longer indoor activity times, so studying the correlation between the health of the elderly and the indoor environment is of great significance [6]. By 2015, it was the case that nearly half of the world’s elderly people eventually died due to cardiovascular diseases [7]. Compared with other seasons, the incidence of cardiovascular diseases reaches a peak in winter [8]. Studies have shown that temperature difference will affect the morbidity and mortality of cardiovascular diseases [9,10], and cardiovascular diseases are related to air pollution [11,12]. As one of the key determinants of cardiovascular disease, blood pressure has a high predictive value [13] for the elderly; it is more necessary to control systolic blood pressure than diastolic blood pressure [14]. Controlling systolic blood pressure can prevent the risk of cerebrovascular disease and stroke; thus, it is the main target in the effort to improve the prognosis of elderly patients [15]. It is unreasonable to control indoor parameters only to align with building environmental standards. On the one hand, standards are formulated based on the needs of young people; on the other hand, differences in personal physique cannot be ignored [16]. In order to deal with the most relevant problems in the area of environment and health, the three core concepts of the “Healthy China” strategy—”Great Health”, “All-round”, and “Great Environment”—put forward new development goals for intelligent and healthy old-age care [17].
Some scholars proposed Ambient Assisted Living (AAL) technology very early, and some studies have shown that the application of a deep learning model to an AAL service can greatly improve the accuracy and reliability of life records [18,19]. The deep learning algorithm extracts data from Internet of Things (IoT) device sensors in the deployment environment. The algorithm uses advanced methods to greatly improve the performance of existing machine learning technologies and develops rapidly in the fields of biological data and health information [20,21]. Deep learning algorithms can extract feature information from human physiological parameters for pattern recognition and health assessment [22,23]. Some scholars have systematically studied the application of deep learning algorithms in the automatic diagnosis of a series of diabetic diseases. The model used neural networks based on data expansion and data correction technology, covering a variety of physiological parameters of the human body and proving its ability to predict diseases [24,25,26]. The following methods are used to measure and estimate blood pressure: Combining the classical pulse width evaluation model and neural network model to estimate blood pressure [27], blood pressure can be reconstructed using noninvasive ambulatory blood pressure estimation based on photoplethysmography (PPG) signals, and blood pressure training and prediction can be carried out by LSTM [28]. A hybrid deep learning neural network framework based on convolutional neural network (CNN) and LSTM can be used to predict the time series data in electronic health records [29]. In the field of clinical cardiology, one study has shown that deep learning algorithms clearly outperform clinicians in predicting prognosis and future events in patients with pulmonary hypertension [30]. With the development of IoT technology, IoT will gradually become the basis of home appliances [31]. To sum up, many artificial intelligence diagnostic algorithms have been developed to detect diseases, but their prediction accuracy for hypertension is lower. In addition, the prediction of blood pressure parameters ignores the interference of external factors, and indoor environment IoT products do not pay attention to dynamic changes in human health.
At present, the research on indoor air quality is mainly carried out concerning two aspects: evaluation and management [32]. Elderly people are very interested in using visualization technology to monitor their long-term health trends [33]. In this study, we carried out continuous environmental measurements and blood pressure parameter tests in the morning and evening for urban residential buildings in Dalian and prepared to build an Internet of Things data platform and mobile app in the future. The research objectives of this paper are: (1) Monitor indoor temperature, humidity, formaldehyde, carbon dioxide, Total Volatile Organic Compounds (TVOC), and PM2.5 using the standard for indoor environment evaluation; (2) Analyze the impact of single environmental factor on the blood pressure risk of the elderly; (3) Establish a multi-environmental parameter to characterize the risk of hypertension in the elderly, using the LSTM deep learning algorithm and Bayesian fitting, and evaluate the accuracy of the model by comparing it with a previous probability distribution of blood pressure.
2. Materials and Methods
2.1. Measurement Objects
In the early stage, we conducted a survey using a questionnaire. The contents of the questionnaire included questions about the residential environment, thermal insulation form of envelope, type of floor decorations present, personal thermal comfort of residents, living and eating habits, etc. We sent out 50 questionnaires in the urban area of Dalian (Liaoning Province, China) in order to understand the habits and housing conditions of elderly residents. As IoT devices require good network conditions, this study conducted an actual measurement on a household in the urban area of Dalian. The dates were from 18 December 2018 to 30 January 2019 (the heating season). There were two elderly people in the household: a 69-year-old male with no cardiovascular disease and a 66-year-old female with arrhythmia and high cholesterol but no high blood pressure. According to the preliminary questionnaire survey, the living room, study room, and master bedroom were the main activity spaces. The residential area for the elderly in China is mostly between 60 and 120 m2, with one bedroom or more [34], so the area and room type of this house has met the requirements.
2.2. Measurement Method
According to the requirements of the Code for Indoor Environmental Pollution Control of Civil Building Engineering (GB 50325-2010) [35], the area of each room was less than 50 m2, and the number of detection points in each room was 1. The distance between the field test point and the inner wall was more than 0.5 m, the height from the floor was 0.8 m, and the vents were avoided. In this study, the environmental parameter acquisition instrument was the Hike-b6a IOT (produced by Beijing Hike Zhidong Technology Development Co., Ltd. Beijing, China), which was placed in three rooms for 24 h of operation. In order to measure the microenvironment around the human body, the instrument was placed in positions where the elderly residents would typically stay for a long time, such as the bedside table in the bedroom, the tea table in the living room, and the study desk in the study room, while avoiding direct sunlight. At the same time, we properly handled the power cord and plug-in of the instrument to ensure that the elderly residents could walk around easily and that their indoor activities would be safe. The acquisition parameters included indoor temperature, humidity, CO2, TVOC, formaldehyde, PM2.5 (PM2.5 accuracy is ±15%, formaldehyde accuracy is ±0.03 mg/m3, CO2 accuracy is ±40 ppm, TVOC accuracy is ±0.03 mg/ m3, temperature accuracy is 2 °C, humidity accuracy is 5% RH). Data can be uploaded to the cloud platform through WiFi. In order to record the indoor activities of the elderly subjected, we asked them to fill in a record form whenever they left and entered the house. Although it was not convenient for the two elderly people to go downstairs due to their physical mobility issues, leading to them engaging in few outdoor activities, we still excluded the parameters of indoor environment when they were outdoors. The physiological parameters were measured by the Life Sense i5 IOT blood pressure instrument (produced by Guangdong Lexin Medical Electronics Co., Ltd. Zhongshan, China), which had an accuracy of ±3 mmHg. The instrument could measure blood pressure and heart rate. According to the Chinese Elderly Hypertension Management Guidelines 2019 [36], blood pressure monitoring is mainly carried out before going to bed and in the early morning after waking up. In this study, we measured it twice a day and took the average twice every time to eliminate error. Daily morning measurements were taken within an hour of waking up, after urination and before breakfast. Bedtime measurements were taken more than 30 min after the bath. When the men measured, they pressed the blue button; when women measured, they pressed the red button. Two elderly people helped each other to put on the equipment and perform the tests. According to the cloud data and the previous questionnaire survey, we were able to obtain the daily rest time of the two elderly people. We called half an hour in advance to remind the two elderly people to take the blood pressure measurement. The device could be connected to the Internet, and the data could be uploaded to the Lexin data platform. The layout of the room and the schematic diagram of the room where the equipment was placed are shown in Figure 1.
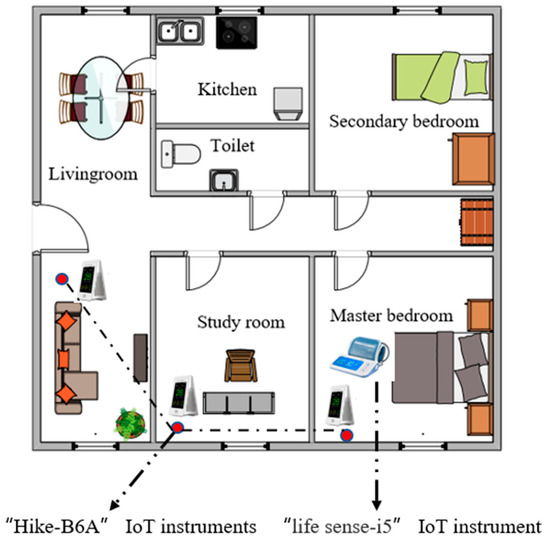
Figure 1.
Locations of the IoT instruments in the rooms.
After obtaining the parameters, a single-factor environmental factor analysis was conducted to explore the relationship between potential independent variables and dependent variables. The core idea of the model is the combination of Bayesian fitting and LSTM deep learning to estimate the blood pressure of elderly people under the influence of their environment. A variable relationship between indoor environment and blood pressure was established, and a model for estimating the influence of the indoor environment on blood pressure on a long time scale was developed. Bayesian fitting was used to explore the impact of the environment on blood pressure risk. Data collection and future application ideas are shown in Figure 2.
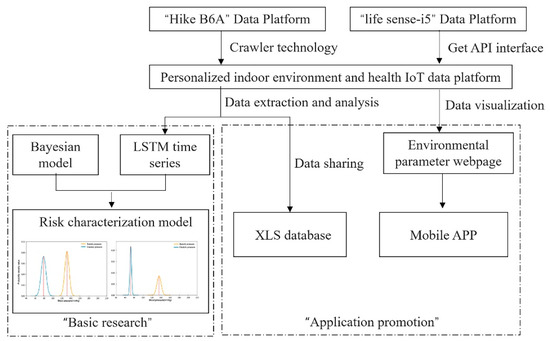
Figure 2.
Implementation method of the indoor environment and health IoT system.
2.3. Deep Learning Algorithm and Parameter Setting
LSTM is a type of RNN (recurrent neural network) with a time memory. The core idea is to save important information and delete irrelevant information The basic structure of the LSTM is shown in Figure 3. We analyzed the internal structure of the sequence index position of the LSTM model at time t: the multi-dimensional independent variable enters the unit cell through the input gate at time t, denoted as (cell state). The forgetting gate controls whether the upper layer of the fine hidden cell structure is forgotten and with what probability, as well as whether the memory data are retained. Finally, the output gate signal controls whether the output presents ; and are the coefficient and bias of linear relationship; represents the probability of forgetting the previous hidden cell state, as shown in Formula (1):
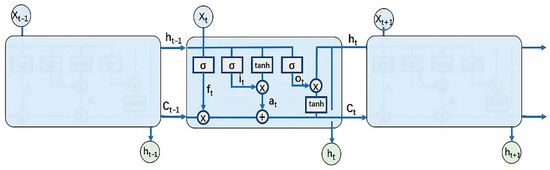
Figure 3.
LSTM network structure.
The first part of the input gate uses sigmoid to activate the function, and the output is the combination of and the tanh-activated function . The cell state consists of two parts: the first part is the product of and the output of the forgetting gate, and the second part is the product of and of the input gate. The mathematical expressions are shown in (2) to (4).
The output gate consists of two parts: the hidden state of the previous sequence and of the previous sequence generate under the action of the σ function. The other part is composed of and the activation function tanh, as shown in mathematical Formulas (5) and (6):
The weight matrix W and offset vector b variables are the hyperparameters of LSTM; the samples are brought into the model and the gradient descent method is used to update the W and b values to minimize the loss function. At this time, the result value can be predicted based on the multidimensional sequence variables.
Due to the time series characteristics of the indoor environmental parameters, time is a key variable that cannot be ignored when studying the long-term correlation between the indoor environment and blood pressure. Therefore, the LSTM model was used to establish the correlation estimation model, and the environmental and blood pressure parameters were used as input variables in the LSTM network structure. At the same time, considering the influence of multiple behavioral factors such as diet and medication behavior on blood pressure [37], the morning measurement was carried out within one hour after waking up, and the bedtime measurement was carried out more than 30 min after bathing and before going to bed. According to the daily routine of the two elderly people, the whole day was divided into two periods: 9 a.m. to 8 p.m., and 9 p.m. to 8 a.m. the next day. Taking the 12 h environmental data as the input sequence, the model corresponding to blood pressure was established. The indoor environmental parameters of the different units were dimensionless, and some or all of the units of the equations involving physical quantities were removed to simplify the calculation. Please refer to “Building Ventilation Effect Evaluation and Evaluation Standard” (JGJ/T 309-2013) [38] and “Indoor Air Quality Standard” (GB/T18883-2002) [39]. The standard value and characteristic value are shown in Table 1.

Table 1.
Characteristic values of the indoor environmental parameters.
According to Formula (7), indoor environmental parameters are dimensionless. is the average value of six indoor environmental parameters in three rooms, with a total of 18 independent variable dimensions:
The adjustment of the hyperparameters is very important for training neural networks. The setting of the learning rate will affect the fluctuation of the curve and the duration of the training process. We repeatedly adjusted the learning rate during the training process. In most studies, there are no consistent choices of optimizer. The Adam optimizer is widely used, so we used this optimizer. We judged the training result of this model by looking at the training curve, and the loss value was steadily decreasing. Considering that the fitting effect of the training set would affect the generalization ability of the test set, once the test error stopped falling or the error started to increase, we chose to stop training. The hyperparameter settings are shown in Table 2.
Table 2.
Hyperparameters of the LSTM model.
2.4. Blood Pressure Probability Model Combined with Bayesian Algorithm
According to the error data of the regression prediction model, the Bayesian fitting of blood pressure prediction can be carried out [40]. Parameter estimation plays an important role in the intelligent analysis of big data, and it is also an important basic guarantee for a machine learning algorithm [41]. In addition, parameter estimation also plays an important role in other fields, such as cell metabolism parameters and biochemical reaction kinetics parameters estimation in the field of biology [42,43,44], the field of energy [45,46], the field of signal processing [47,48,49], the field of computational mathematics [50], etc. The reliability and accuracy of the parameter estimation were shown to be good. Based on the calculation of the linear deviation of normal distribution parameters and the determination of the maximum similarity value of the parameters, the Bayesian function was used to realize the parameter estimation. The characteristics of the error curve and the error between the predicted value and true value were taken as the standard deviation of the normal distribution of the blood pressure probability density curve.
For , j = 1 for male, and j = 2 for female; for , i = 1 represents systolic blood pressure, and i = 2 represents diastolic blood pressure.
According to the classification and definition of the blood pressure level, a systolic blood pressure over 140 mmHg or a diastolic blood pressure over 90 mmHg can be defined as hypertension [51]. Therefore, the probability of elderly people suffering from hypertension is shown in Formula (9).
3. Results and Discussion
3.1. Indoor Environmental Quality Evaluation
During the actual measurement period, the lowest temperature in the living room was 21 °C, the highest temperature was 26 °C, and the average temperature was 23.2 °C. According to the “Indoor Air Quality Standard” (GB/T 18883-2002), the winter indoor heating temperature standard is 16–24 °C (each picture uses a red line to indicate the standard range); thus, the living room exceeded the standard required temperature 11.7% of the time. The lowest temperature recorded in the study was 16 °C, the highest temperature was 27 °C, the average temperature was 23.0 °C, and the temperature exceeded the standard requirement 7.7% of the time. The lowest temperature recorded in the bedroom was 19 °C, the highest temperature was 30 °C, the average temperature was 26.0 °C, and the temperature exceeded the standard requirement 70.1% of the time. The parameter image of each room is shown in Figure 4.
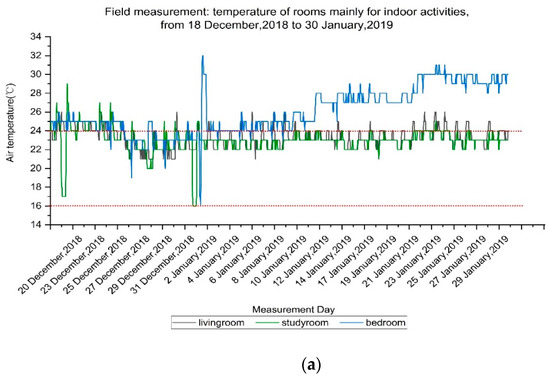
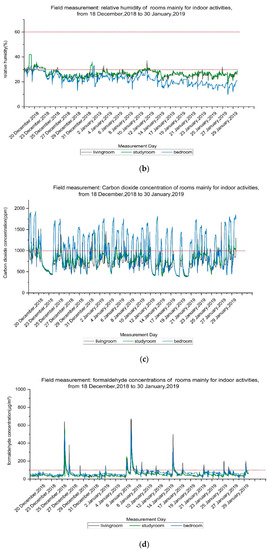
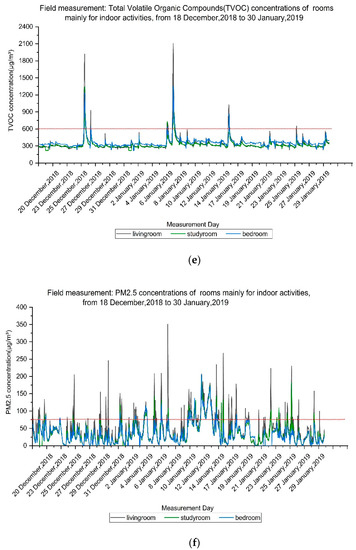
Figure 4.
Field measurement (18 December 2018 to 30 January 2019): (a) temperature of the main indoor activity rooms; (b) relative humidity of the main indoor activity rooms; (c) carbon dioxide concentrations of the main indoor activity rooms; (d) formaldehyde concentrations of the main indoor activity rooms; (e) total volatile organic compound (TVOC) concentrations of the main indoor activity rooms; (f) PM2.5 concentrations of the main indoor activity rooms.
A list of the indoor environment parameters of different rooms, including the highest value, lowest value, average value, and noncompliance ratio, is shown in Table 3. The noncompliance rate is listed in the last column to represent the proportion that does not meet the standard range for indoor environmental parameters.
Table 3.
Indoor environment of different rooms.
The results show that many aspects have a certain impact on indoor air quality. For example, indoor air environmental parameters will be affected by residents’ activities. For example, through the previous questionnaire survey, we found that residents would turn on the ventilator when they use the kitchen and bathroom for ventilation, and they would open the window every day for regular ventilation when the weather is sunny. In addition, the room temperature and humidity will be affected by cooking behavior and the internal factors of residential central heating, as well as external sunshine and other factors. The maximum temperature of all rooms was at about 2 p.m., and the minimum temperature almost appeared in the early morning, which was consistent with the trend of outdoor temperature. The average relative humidity could not reach the lower limit of 30%, which may be related to the low air humidity in winter. Because the doors and windows were closed to keep the indoor air warm in winter, CO2 was significantly affected by people’s behavior and activities, especially in bedrooms, where it was concentrated at 0–8 a.m., when people were asleep; increased CO2 concentrations make people indoors drowsy [52]. As the living room is the main space for leisure and entertainment and connected with the kitchen, it is easy for it to be affected by cooking activities, so the peak concentrations of formaldehyde, TVOC, and PM2.5 all appeared in the living room, which was consistent with the peak concentration mentioned in other literature and related to specific family activities (such as cooking or leisure) [53]. According to The Standard of the Measurement and Evaluation for Efficiency of Building Ventilation (JGJ/T 309-2013) of the People’s Republic of China. The concentration limit of PM2.5 was 75 μg/m3, which fluctuated violently and exceeded 75 μg/m3 frequently. The concentration of PM2.5 in the daytime was higher than that in the evening. The concentration of PM2.5 increased significantly at 7:00–9:00, 13:00–15:00, and 22:00, which may have been caused by the activities of the elderly, but the interval mean value was lower than the limit of 75 μg/m3. The TVOC and indoor formaldehyde pollution were not serious.
3.2. Correlation between Single Indoor Environmental Parameter and Blood Pressure of the Elderly
In order to explore the correlation between the indoor environment and the blood pressure of the elderly, we used SPSS 22.0 to calculate the nonparametric correlation coefficients, as shown in Table 4. The marks are determined by the p values threshold, and the values in the table are the Spearman correlation coefficients. Since blood pressure data were collected twice a day, respectively before going to bed at night and after getting up in the morning, the indoor environment data within 1 h of blood pressure measurement were used in the correlation analysis.
Table 4.
Correlation analysis of indoor environment and blood pressure.
It can be seen from the results that the temperature of each room had an extremely significant correlation with the systolic blood pressure (p < 0.01), and had a correlation with part of the diastolic blood pressure. Between 16.0 and 32.0 °C, temperature and blood pressure showed a negative correlation. The relative humidity and systolic blood pressure of the living room and the study room were also correlated, and in the relative humidity range: 10–42%, the relative humidity was negatively correlated with blood pressure. Among the air pollutants measured, formaldehyde, TVOC and PM2.5 were found to be related to changes in blood pressure.
3.3. Blood Pressure Error Curve and Probability Prediction Model
The proportion of each element of the input sequence in the model was calculated by LSTM input layer parameters. The calculation results are shown in Table 5, reflecting the weight distribution of data at different times in the input.
Table 5.
Weight ratios at different time points.
It was mentioned in the deep learning algorithm and parameter settings that according to the daily lives of the two elderly people, the whole day was divided into two periods: 9 a.m. to 8 p.m. and 9 p.m. to 8 a.m. the next day. For each segment of 12 h, using 12 h environmental data as the input sequence, a model corresponding to blood pressure was established. Time point 12 was the latest time point for estimating blood pressure. According to Table 5, the weight ratio of systolic and diastolic blood pressure in males was 30.3% and 53.5%, while that in females was 16.6% and 36.5%. When measuring blood pressure, environmental data at time point 12 had the highest weight for blood pressure prediction, so the environmental time series data 1 h before measuring blood pressure was used to predict blood pressure. The least square errors of the four models of blood pressure and environment for the elderly reflect the magnitude of the prediction and actual errors. The results of the iteration are shown in Figure 5, Figure 6, Figure 7 and Figure 8 below. The horizontal axis is the number of iterations, the vertical axis is the root mean square error, and the gradient descent method shows the weights and deviations.
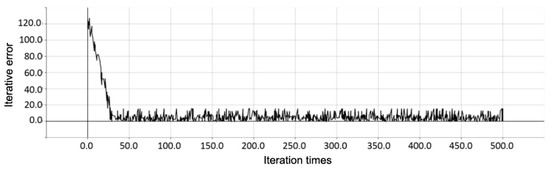
Figure 5.
Error curve of systolic blood pressure in the elderly man.
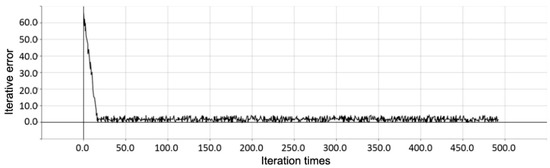
Figure 6.
Error curve of diastolic blood pressure in the elderly man.
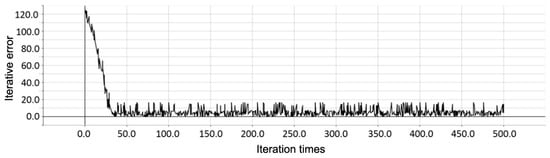
Figure 7.
Error curve of systolic blood pressure in the elderly woman.
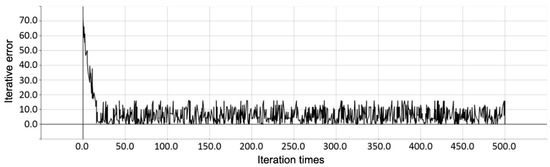
Figure 8.
Error curve of diastolic blood pressure in the elderly woman.
The average value of 50~500 steps of the least square error was selected as the Bayesian standard deviation. According to the bivariate correlation analysis, the Pearson correlation coefficient of diastolic blood pressure and systolic blood pressure in the elderly man was = 0.634, and it was = 0.768 for the elderly woman. According to Formula (8), a two-dimensional normal distribution can obtain the blood pressure probability density distribution function; according to Formula (9), to obtain the probability of suffering from hypertension, the LSTM model and blood pressure prediction and the risk of suffering from hypertension are shown in Table 6. Here, the single-factor judgement refers to the degree of risk described by only a single parameter, either systolic or diastolic blood pressure.
Table 6.
LSTM model and blood pressure prediction and risk of hypertension.
The prediction error of systolic and diastolic blood pressure of the female elderly individual is large, the blood pressure data distribution is scattered, the curve is flat, and both diastolic and systolic blood pressure are at risk of exceeding the standard blood pressure. The prediction error of the diastolic blood pressure of the male elderly individual is very small, and the curve is flat and concentrated around the mean value. The risk of hypertension of the diastolic blood pressure single factor is almost zero, the prediction error of the systolic blood pressure is large, the curve is flat, and the mean value is 135.24 mmHg, which is close to the high pressure limit of 140 mmHg, so the risk of hypertension is high. The above parameters were used to draw the normal distribution curve to predict the probability distribution of blood pressure. This is shown in Figure 9.
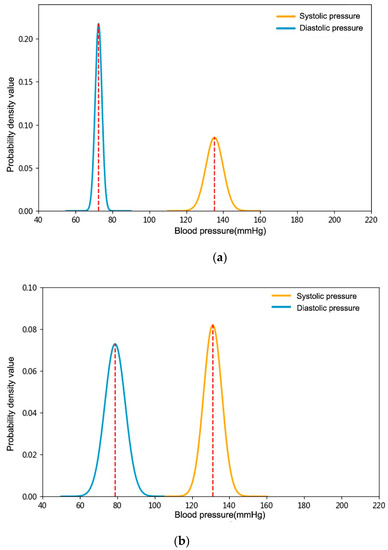
Figure 9.
Probability distribution of predicted blood pressure of the elderly: (a) male elderly; (b) female elderly.
3.4. Comparison of Predicted Blood Pressure and Pre-Blood Pressure Distribution
A deep learning algorithm is used to predict parameters through training data, provided that the most accurate ratio between training time and its reproducibility is the best value of the number of iterations [54]. Training samples are used to adjust the parameters in the training factors. When the number of training samples in the network structure is limited and the number of calculation factors increases, its generalization ability will become very poor [55]. Parameter settings produce different results to a certain extent; thus, we need to evaluate the results. In order to further test the accuracy of the probability distribution of blood pressure predicted by the deep learning algorithm, the frequency distribution statistics of the measured blood pressure values were analyzed. Although the time series were not comparable in the strict sense, considering the outdoor meteorological parameters and the subjects’ habitual activities, the residential parameters were in line with the objective variation law and the variation range was small; thus, they can be used to compare the accuracy of the model. The parameters of the Gaussian model and high-pressure risk are shown in Table 7 and Table 8.
Table 7.
Simulated Gaussian value of blood pressure curve of male elderly people.
Table 8.
Simulated Gaussian value of blood pressure curve of female elderly people.
Previous blood pressure measurements showed that the risk of single-factor hypertension of systolic blood pressure was 24.25%, the risk of diastolic blood pressure was 0%, and the risk of multi-factor hypertension was 24.25% in the male elderly; the risk of single-factor hypertension of systolic blood pressure was 18.38%, the risk of diastolic blood pressure was 7.09%, and the risk of multi-factor hypertension was 21.77% in the female elderly. For visualization, the distribution frequency of diastolic and systolic blood pressure of male and female elderly people was plotted according to the Gaussian value parameter of the nonlinear fitting curve, as shown in Figure 10.
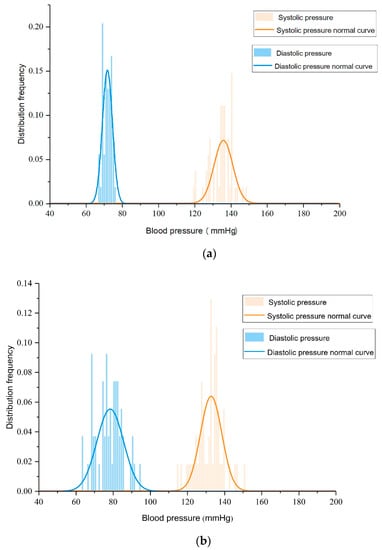
Figure 10.
The probability distribution of previous blood pressure in the elderly. (a) Male elderly; (b) female elderly.
It can be seen from the above two figures that the trend is consistent with the previous LSTM estimation model curve, indicating that the early blood pressure level has reference value for the later environmental effect on the human body. The previous characteristics also showed that the distribution of the systolic and diastolic blood pressure data of female elderly people was scattered, and that they were at risk of exceeding the standard blood pressure. The diastolic blood pressure of male elderly people was concentrated around the mean value, and the diastolic blood pressure almost did not exceed 90 mmHg, while the systolic blood pressure changed greatly around the mean value of 135.24 mmHg and the risk of hypertension was high.
4. Conclusions
In this paper, the indoor environmental parameters and blood pressure data collected from elderly people in a residence in Dalian city are used as training models, mathematical statistics analysis and deep learning prediction are carried out, and a probability density model of the impact of environmental parameters on blood pressure in the growth time scale is established. The following conclusions can be drawn from the prediction of blood pressure based on the average environmental data during the measurement period.
- (1)
- Many aspects can have certain impacts on indoor air quality, including internal factors; for example, cooking behavior, smoking, and central heating in the room, as well as external ones, such as weather conditions outside the building. Regular household activities and weather changes will result in similar daily changes in indoor environmental parameters and peak times.
- (2)
- Indoor environmental parameters may have potential effects on health. It is concluded that the influence of temperature and humidity on systolic blood pressure is significantly higher than that of diastolic blood pressure, and there was a correlation between some air quality parameters and blood pressure, such as formaldehyde, TVOC, and PM2.5. The effect of air quality on blood pressure risk is small, which may be related to the overall good air quality of the family.
- (3)
- The risk of systolic hypertension was higher than that of diastolic hypertension for both the two elderly, which is consistent with the fact mentioned in the introduction that controlling systolic blood pressure is more important. By comparing the blood pressure value predicted by the deep learning algorithm with previous blood pressure measurement results, it was found that for the male resident, the risk difference for systolic blood pressure was 7.81%, and the risk difference for diastolic blood pressure was the same. For the female one, the risk difference for systolic blood pressure was 4.27%, the risk difference for diastolic blood pressure was 0.05%, and the total risk difference was 4.22%. The algorithms used in this study follow the same trend in the relationship between variable sizes in the prediction. Although the time series used in these two methods are different, they are still reliable since the risk changes remain the same over a short period of time.
This study is a prediction of the hypertension risk of the elderly in the built environments by using deep learning algorithm. It was found that the environment may have potential influence for the elderly. In the future, we plan to test the reliability of the algorithm in clinical practice, continue our research idea, read relevant papers, and study the mechanisms of other diseases. If it has a good enough reliability, we will extend the algorithm to other disease diagnosis in the future.
Author Contributions
Conceptualization, R.Z.; methodology, R.Z. and Z.W.; software, R.Z. and Z.W.; validation, R.Z.; formal analysis, R.Z.; investigation, R.Z.; resources, R.Z.; data curation, R.Z. and Y.L.; writing—original draft preparation, R.Z.; writing—review and editing, R.Z. and X.C.; visualization, R.Z.; supervision, Y.L.; funding acquisition, Y.L. All authors have read and agreed to the published version of the manuscript.
Funding
This study was financially supported by the National Natural Science Foundation of China (No. 91743102, No. 51978121) and the Fundamental Research Funds for the Central Universities (DUT21JC22).
Institutional Review Board Statement
Not applicable.
Informed Consent Statement
Informed consent was obtained from all subjects involved in the study.
Data Availability Statement
The data presented in this study are available on request from the corresponding author.
Conflicts of Interest
The authors declare no conflict of interest.
References
- UN, Department of Economic and Social Affairs, Population Division. World Population Prospects. 2019. Available online: https://population.un.org/wpp/ (accessed on 17 June 2019).
- Stats.Gov. Statistical Bulletin of the People’s Republic of China on National Economic and Social Development in 2019. Available online: http://www.stats.gov.cn/tjsj/zxfb/202002/t20200228_1728913.html (accessed on 28 February 2020).
- American Society of Heating, Refrigerating and Air Conditioning Engineers, Inc. ASHRAE Handbook of Fundamentals; ASHRAE: Peachtree Corners, GA, USA, 2017. [Google Scholar]
- Hansen, W. The IAQ challenge to facility management: Healthy buildings through affordable indoor air quality programmes. Facilities 1995, 13, 12–20. [Google Scholar] [CrossRef]
- Brooks, B.O.; Utter, G.M.; Debroy, J.A.; Schimke, R.D. Indoor Air Pollution: An Edifice Complex. J. Toxicol. Clin. Toxicol. 1991, 29, 315–374. [Google Scholar] [CrossRef]
- Lv, Y.; Wang, Z.M.; Chen, B. A review of the Relationship between Indoor Air Environment and Cardiovascular and Cerebrovascular Disease in the Elderly. Build. Sci. 2018, 34, 124–130. (In Chinese) [Google Scholar] [CrossRef]
- WHO. World Health Statistics 2016, Monitoring Health for the SDGs, Sustainable Development Goals[M]; World Health Organization: Geneva, Switzerland, 2016. [Google Scholar]
- Chen, Y.; Zhang, H.B.; Yoshino, H.; Xie, J.C.; Yanagi, U.; Hasegawa, K.; Kagi, N.; Goto, T.; Zhang, Q.Y.; Zhang, J.F. Winter indoor environment of elderly households: A case of rural regions in northeast and southeast China. Build. Environ. 2019, 165, 106388. [Google Scholar] [CrossRef]
- Xiong, J.; Lian, Z.W.; Zhang, H.B.; Yoshino, H. Correlation between health discomforts and temperature steps in winter of China. Build. Environ. 2017, 114, 387–396. [Google Scholar] [CrossRef]
- Xiong, J.; Lian, Z.W.; Zhang, H.B. Physiological response to typical temperature step-changes in winter of China. Energy Build. 2017, 138, 687–694. [Google Scholar] [CrossRef]
- Saeki, K.; Obayashi, K.; Iwamoto, J.; Tone, N.; Okamoto, N.; Tomioka, K.; Kurumatani, N. Stronger association of indoor temperature than outdoor temperature with blood pressure in colder months. J. Hypertens. 2014, 32, 1582–1589. [Google Scholar] [CrossRef]
- Wang, D.Z.; Jiang, G.H.; Gu, Q.; Zhang, H.; Xu, Z.L.; Song, G.D.; Zhang, Y.; Shen, C.F. A Time-series Study for Acute Effect of Air Pollution on Mortality in Patients with Cardio-cerebral Vascular Disease in Tianjin City. Chin. Circ. J. 2014, 29, 453–457. (In Chinese) [Google Scholar] [CrossRef]
- Nuotio, J.; Suvila, K.; Cheng, S.S.; Langén, V.; Niiranen, T. Longitudinal blood pressure patterns and cardiovascular disease risk. Ann. Med. 2020, 52, 43–54. [Google Scholar] [CrossRef]
- Basile, J.N. The Importance of Systolic Blood Pressure Control and Cardiovascular Disease Prevention. Curr. Treat. Options Cardiovasc. Med. 2003, 5, 271–277. [Google Scholar] [CrossRef]
- Widimsky, J. The role of arterial hypertension in the primary prevention of stroke. Cor Vasa 2016, 58, e279–e286. [Google Scholar] [CrossRef]
- Wang, Z.; Yu, H.; Luo, M.H.; Wang, Z.; Zhang, H.; Jiao, Y. Predicting older people’s thermal sensation in building environment through a machine learning approach: Modelling, interpretation, and application. Build. Environ. 2019, 161, 106231. [Google Scholar] [CrossRef]
- Lei, X.K.; Wang, J. Intelligent Healthy Old-age Care in the Background of “Healthy China”: Strategic Objectives and System Construction Implementation Path. J. Northwest Univ. Philos. Soc. Sci. Ed. 2020, 50, 131–139. (In Chinese) [Google Scholar] [CrossRef]
- Climent-Pérez, P.; Spinsante, S.; Mihailidis, A.; Florez-Revuelta, F. A review on video-based active and assisted living technologies for automated lifelogging. Expert Syst. Appl. 2020, 139, 112847. [Google Scholar] [CrossRef]
- Li, H.; Ota, K.; Dong, M.X. Learning IoT in Edge: Deep Learning for the Internet of Things with Edge Computing. IEEE Netw. 2018, 32, 96–101. [Google Scholar] [CrossRef]
- Mahmud, M.; Kaiser, M.S.; Hussain, A.; Vassanelli, S. Applications of Deep Learning and Reinforcement Learning to Biological Data. IEEE Trans. Neural Netw. Learn. Syst. 2018, 29, 2063–2079. [Google Scholar] [CrossRef]
- Kim, J.; Hong, J.; Park, H. Prospects of deep learning for medical imaging. J. Biomed. Health Inform. 2018, 2, 37–52. [Google Scholar] [CrossRef]
- Miller, D.; Ward, A.; Bambos, N. Automatic Sleep Arousal Identification From Physiological Waveforms Using Deep Learning. In Proceedings of the 2018 Computing in Cardiology Conference, Maastricht, The Netherlands, 23–26 September 2018. [Google Scholar] [CrossRef]
- Zhang, L.Y.; Cai, X.F. Research on human health Status assessment system of pulse data collection and analysis before and after exercise. J. Infect. Public Health 2020, 13, 1495–1500. [Google Scholar] [CrossRef] [PubMed]
- Liu, Y.L.; Zhang, Q.; Zhao, G.; Qu, Z.G.; Liu, G.H.; Liu, Z.; An, Y. Detecting Diseases by Human-Physiological-Parameter-Based Deep Learning. IEEE Access 2019, 7, 22002–22010. [Google Scholar] [CrossRef]
- Zhang, Q.; Liu, Y.L.; Liu, G.H.; Zhao, G.; Qu, Z.G.; Yang, W.M. An automatic diagnostic system based on deep learning, to diagnose hyperlipidemia. Diabetes Metab. Syndr. Obes. Targets Ther. 2019, 12, 637–645. [Google Scholar] [CrossRef]
- Liu, Y.L.; Zhang, Q.; Zhao, G.; Liu, G.H.; Liu, Z. Deep Learning-Based Method of Diagnosing Hyperlipidemia and Providing Diagnostic Markers Automatically. Diabetes Metab. Syndr. Obes. Targets Ther. 2020, 13, 679–691. [Google Scholar] [CrossRef]
- Bychkov, D.; Turkki, R.; Haglund, C.; Linder, N.; Lundin, J. Deep learning for tissue microarray image-based outcome prediction in patients with colorectal cancer. In Proceedings of the Medical Imaging 2016: Digital Pathology, San Diego, CA, USA, 2–3 March 2016. [Google Scholar] [CrossRef]
- Li, P.; Liu, M.; Zhang, X.; Hu, X.H.; Pang, B.; Yao, Z.L.; Chen, H.D. Novel wavelet neural network algorithm for continuous and noninvasive dynamic estimation of blood pressure from photoplethysmography. Sci. China Inf. Sci. 2016, 59, 042405. [Google Scholar] [CrossRef]
- Liang, M.; Mo, Y.C.; Lin, D.; Lu, Q.; Li, N.N. Disease Prediction Models Based on Hybrid Deep Learning Strategy. Artif. Intell. Robot. Res. 2020, 9, 16–23. (In Chinese) [Google Scholar] [CrossRef]
- Dawes, T.J.W.; de Marvao, A.; Shi, W.; Fletcher, T.; Watson, G.M.J.; Wharton, J.; Rhodes, C.J.; Howard, L.S.G.E.; Gibbs, J.S.R.; Rueckert, D.; et al. Machine learning of three-dimensional right ventricular motion enables outcome prediction in pulmonary hypertension: A cardiac MR imaging study. Radiology 2017, 283, 381–390. [Google Scholar] [CrossRef] [PubMed]
- Mao, M.Y.; Jiang, Y.H.; Chen, Z.C. The Design of Household Appliances Controller in Smart Home. Appl. Mech. Mater. 2012, 250, 1214–1218. [Google Scholar] [CrossRef]
- Chen, X.Y.; Li, F.; Liu, C.Y.; Yang, J.; Zhang, J.D.; Peng, C.L. Monitoring, Human Health Risk Assessment and Optimized Management for Typical Pollutants in Indoor Air from Random Families of University Staff, Wuhan City, China. Sustainability 2017, 9, 1115. [Google Scholar] [CrossRef]
- Le, T.; Reeder, B.; Yoo, D.; Aziz, R.; Thompson, H.J.; Demiris, G. An Evaluation of Wellness Assessment Visualizations for Older Adults. Telemed. E-Health 2015, 21, 9–15. [Google Scholar] [CrossRef]
- Cui, X. Research on the design of aging housing. Pop. Lit. Art 2019, 20, 138–139. (In Chinese) [Google Scholar] [CrossRef]
- Ministry of Housing and Urban-Rural Development of the People’s Republic of China. Code for Indoor Environmental Pollution Control of Civil Building Engineering (GB50325-2010). Available online: http://www.jianbiaoku.com/webarbs/book/105/873747.shtml (accessed on 18 August 2019).
- Li, J.; Fan, L.; Hua, Q.; Cai, J.; Chen, L.Y.; Chen, W.W.; Chen, X.P.; Guo, Y.F.; He, Q.; Hu, Y.X.; et al. Chinese Elderly Hypertension Management Guidelines 2019. Chin. J. Hypertens. 2019, 27, 111–135. (In Chinese) [Google Scholar] [CrossRef]
- Li, J.Z.; Zhuang, Q.S.; Qian, H.Y.; Chen, W.; Zhao, H.Y. Effect of depression and anxiety on blood pressure variability in the elderly patients with hypertension. Pract. Geriatr. 2011, 25, 396–399. (In Chinese) [Google Scholar] [CrossRef]
- Ministry of Housing and Urban-Rural Development of the People’s Republic of China. The Standard of the Measurement and Evaluation for Efficiency of Building Ventilaiton. (JGJ/T 309-2013). Available online: https://max.book118.com/html/2018/0409/160834491.shtm (accessed on 9 April 2018).
- Ministry of Ecology and Environment of the People’s Republic of China. Indoor Air Quality Standard (GB/T 18883-2002). Available online: http://www.mee.gov.cn/ywgz/fgbz/bz/bzwb/dqhjbh/dqhjzlbz/200303/t20030301_67375.shtml (accessed on 1 March 2003).
- Birkes, D.; Dodge, Y. Bayesian Regression Analysis. In Book Statistical Methods for Fuzzy Data, 1st ed; Reinhard, V., Ed.; John Wiley and Sons, Ltd.: Hoboken, NJ, USA, 2010; pp. 141–144. Available online: https://onlinelibrary.wiley.com/doi/pdf/10.1002/9780470974414 (accessed on 30 November 2010).
- Shi, H.Y.; Xiao, Z.Q.; Tian, X.D. Exploration of Machine Learning Techniques in Emulating a Coupled Soil Canopy Atmosphere Radiative Transfer Model for Multi-Parameter Estimation from Satellite Observations. IEEE Trans. Geosci. Remote Sens. 2019, 57, 8522–8533. [Google Scholar] [CrossRef]
- Spolaor, S.; Tangherloni, A.; Rundo, L.; Nobile, M.S.; Cazzaniga, P. Reboot strategies in particle swarm optimization and their impact on parameter estimation of biochemical systems. In Proceedings of the 2017 IEEE Conference on Computational Intelligence in Bioinformatics and Computational Biology (CIBCB), Manchester, UK, 23–25 August 2017; pp. 1–8. [Google Scholar] [CrossRef]
- Rodriguez-Fernandez, M.; Egea, J.A.; Banga, J.R. Novel metaheuristic for parameter estimation in nonlinear dynamic biological systems. BMC Bioinform. 2006, 7, 483. [Google Scholar] [CrossRef]
- Tangherloni, A.; Spolaor, S.; Cazzaniga, P.; Besozzi, D.; Rundo, L.; Mauri, G.; Nobile, M.S. Biochemical parameter estimation vs. benchmark functions: A comparative study of optimization performance and representation design. Appl. Soft Comput. 2019, 81, 105494. [Google Scholar] [CrossRef]
- Chen, X.; Xu, B.; Mei, C.L.; Ding, Y.H.; Li, K.J. Teaching–learning–based artificial bee colony for solar photovoltaic parameter estimation. Appl. Energy 2018, 212, 1578–1588. [Google Scholar] [CrossRef]
- Jordehi, A.R. Enhanced leader particle swarm optimisation (ELPSO): An efficient algorithm for parameter estimation of photovoltaic (PV) cells and modules. Sol. Energy 2018, 159, 78–87. [Google Scholar] [CrossRef]
- Xu, L.; Ding, F. Parameter estimation algorithms for dynamical response signals based on the multi-innovation theory and the hierarchical principle. IET Signal Process. 2017, 11, 228–237. [Google Scholar] [CrossRef]
- Xu, L.; Ding, F.; Gu, Y.; Alsaedi, A.; Hayat, T. A multi-innovation state and parameter estimation algorithm for a state space system with d-step state-delay. Signal Process. 2017, 140, 97–103. [Google Scholar] [CrossRef]
- Cai, M.; Yang, J. Parameter estimation of network signal normal distribution applied to carbonization depth in wireless networks. Eurasip J. Wirel. Commun. Netw. 2020, 2020, 86. [Google Scholar] [CrossRef]
- Li, C.P.; Hao, H.B. E-Bayesian Estimation and Hierarchical Bayesian Estimation of Poisson Distribution Parameter under Entropy Loss Function. IAENG Int. J. Appl. Math. 2019, 49, 369–374. [Google Scholar]
- Townsend, R.R. Can we justify goal blood pressure of <140/90 mm Hg in most hypertensives? Curr. Hypertens. Rep. 2005, 7, 257–264. [Google Scholar] [CrossRef]
- Snow, S.; Boyson, A.S.; Paas, K.H.; Gough, H.; King, M.-F.; Barlow, J.; Noakes, C.J.; Schraefel, M.C. Exploring the physiological, neurophysiological and cognitive performance effects of elevated carbon dioxide concentrations indoors. Build. Environ. 2019, 156, 243–252. [Google Scholar] [CrossRef]
- Fernández-Agüera, J.; Dominguez-Amarillo, S.; Fornaciari, M.; Orlandi, F. TVOCs and PM 2.5 in Naturally Ventilated Homes: Three Case Studies in a Mild Climate. Sustainability 2019, 11, 6225. [Google Scholar] [CrossRef]
- Balabin, R.M.; Safieva, R.Z.; Lomakina, E.I. Universal technique for optimization of neural network training parameters: Gasoline near infrared data example. Neural Comput. Appl. 2009, 18, 557–565. [Google Scholar] [CrossRef]
- Kuang, P.; Cao, W.N.; Wu, Q. Preview on structures and algorithms of deep learning. In Proceedings of the 2014 11th International Computer Conference on Wavelet Actiev Media Technology and Information Processing (ICCWAMTIP), Chengdu, China, 19–21 December 2014; pp. 176–179. [Google Scholar]
Publisher’s Note: MDPI stays neutral with regard to jurisdictional claims in published maps and institutional affiliations. |
© 2021 by the authors. Licensee MDPI, Basel, Switzerland. This article is an open access article distributed under the terms and conditions of the Creative Commons Attribution (CC BY) license (https://creativecommons.org/licenses/by/4.0/).