1. Introduction
The problem of assessing the quality of a rock mass has always been of interest to scientists all over the world. Many methods have been developed to describe the condition of the rock mass, both in terms of the conditions of maintaining underground workings and possible natural hazards. Progress in the field of technology allows the search for new techniques for the ongoing monitoring of rock mass, especially in the context of ensuring the stability of underground structures. Modern drilling machines allow the creation of large databases as part of routine technological operations.
In metal ore mines, the technological process is inherently associated with the production of a considerable number of boreholes, reaching even millions of pieces per year, which, from the point of view of monitoring requirements, is an extremely valuable and relatively cheap database.
From the point of view of the stability of underground structures, the most critical features of the rock mass are rock and rock mass strength as well as discontinuity surfaces (delaminations and crevices). While the methodology of strength tests is sufficiently mastered, the detection of discontinuities in real conditions is much more difficult and time-consuming. Currently, 2-D or 3-D scanning of the surface of boreholes or underground workings, geophysical methods, or an indirect method of analyzing and describing the condition of drill cores are used for this purpose. As a result, we have at our disposal relatively limited quantitative databases, which do not allow for a precise, comprehensive, and satisfactory depiction of the condition of the rock mass. The indicated factors encourage efforts to improve measurement methods. In this regard, modern drilling rigs used in mining excavations or tunnels can be used.
The performance of any underground workings must be based on the knowledge of many geomechanical properties of rocks and rock mass, examined in the laboratory and in situ in field conditions. While the methodology of laboratory tests is standardized and based on certain commonly used standards, field tests are still being improved and new solutions are sought.
The research presented in the article indicates two groups of currently used methods of in situ rock quality classification—geotechnical and technological methods. Briefly, recalling the most commonly used geotechnical methods, various technological research methods based on data obtained while drilling boreholes in a rock medium in an underground ore mine were analyzed in more detail.
An original measuring system was designed and built, which was installed on the Mine Master drilling and bolting rig, allowing for the taking of the kinematic characteristics of the drill rod movement. Then, a series of field tests were carried out in various geological conditions.
A simplified theoretical model of a single rock mass discontinuity (strata separation) was proposed, explaining the expected change (anomaly) in the characteristics when the drill rod passes through this critical place.
Then, using the Fourier transformation method, the obtained drilling characteristics were analyzed and an algorithm allowing for the detection of discontinuities was determined, which was additionally confirmed during observation with a borehole camera. For the specific conditions of the test site, a characteristic numerical value of the acceleration was determined, indicating that discontinuities were encountered.
The most important advantage and novelty of the method is the use of the kinematic parameter of motion resulting from its direct measurement in the critical area, instead of the indirect one based on e.g., oil pressure, torque, or forces, which require further, approximate calculations and many other parameters changing in relatively large ranges.
2. Rock Mass Quality Assessment Methods Used in Engineering Practice
2.1. Geotechnical Methods
Over many years, many qualitative indicators of rock mass and their classification have been developed. The best known methods are: Terzaghi’s [
1],
RQD (Rock Quality Designation) [
2], RMR (Rock Mass Rating) [
3],
Q (Rock Quality Index) [
4], MRMR [
5] and RMi [
6]. The aim of the authors of these classifications of rock mass was to create a tool allowing them to define and systematize certain procedures of recognizing the quality of a rock mass, primarily for supporting engineering designing. The
RQD index is defined by the formula [
2,
7], which is used in many different classification methods as a component, besides several others and which allows assigning a numerical value determining the quality of the rock mass:
where
l (>2
d) is the total cumulative length of the core sections longer than twice the core diameter, and l
c is the total length of the core borehole.
In addition to the above indices, the classification methods take into account, in a descriptive and rating manner, a number of parameters such as uniaxial compressive strength of rocks, fracture density and characteristics, the type of their surface, water inflow intensity, humidity, and other parameters that require time-consuming observations and measurements.
2.2. Technological Methods Based on the Borehole Drilling Process
The registration and analysis of the course of the characteristics of the drilling process in the rock mass is known in the bibliography as Monitoring Drilling (MWD), [
8,
9,
10,
11,
12,
13,
14]. The monitored parameters can be used to quickly search for roof delamination and other voids and gaps, which may be of key importance from the point of view of the safety of the pit operation [
15]. In addition, the same operating parameters of drilling machines can be used to assess the wear of drilling tools and optimize the drilling process itself.
Classification based on drilling parameters, using the SED indicator (specific energy of drilling), was developed and described in 1965, [
16]. The indicator itself was not used directly for classification, but allowed the unit energy of the mining characteristic for a specific type of rock to be determined. Early works on the development of the method [
12,
17], analyzed parameters such as torque, drill pressure, rotational speed of the drill head, and speed of drill process obtained while drilling boreholes for the anchor housing. The Teal’s index assumes that to cut a certain volume of the drilled rock, a specific energy must be supplied, depending both on the type of rock itself and the size of the obtained grains. The indicator consisted of two components—energy related to the static pressure of the drill and its rotational movement, [
18].
Interesting research on the relationship of UCS (uniaxial compressive strength) and mechanical specific energy while well drilling was examined with the use of statistical methods to increase the drilling efficiency, [
19].
Parameters such as sound intensity level (dB) or vibration level (Nm/s) were also used to recognize rock mass features [
13,
14,
20,
21,
22,
23,
24,
25], as well as the possibility of predicting the percentage of iron ore in the rock, based on the penetration rate and torque. Kahraman et al. attempted to correlate rock properties with drilling progress [
26], and showed the relationship between drilling penetration rate and rock resistance to uniaxial compression. A wide range of research on monitoring drilling parameters was also carried out in an opencast coal mine [
27]. They emphasized the importance of torque change as a function of the drilling process in soft and hard rocks. Similar relationships were theoretically described in the works [
28]. In the studies carried out in the iron ore opencast mine [
20,
21], the penetration coefficient was used together with the unit cutting energy to monitor the efficiency of the drilling process. The results of the MWD method were analyzed with the use of neural networks [
29,
30], as a basis for the classification of rock strength. In this case, the main goal was to develop a method of alerting the working drill operator to the risk of weakened rock layers. A project, in which a portable hydraulic bolting machine, properly instrumented, was used to classify the rock mass in coal mines, indicating some limitations related to the analysis of the SED index due to too many variables was presented in 2001, [
8,
9].
Similar assessments of the geological parameters of the excavation roof with the use of an instrumented bolting machine were shown in other studies [
31,
32]. It was estimated that because in the drilling process the total loss of energy provided by the torque and the pressure force ranges from 20% to 30%, it is therefore not possible to directly use the drilling parameters to assess the rock properties and they proposed a new parameter called drilling hardness, which would enable the detection of the boundaries between rock layers and the location of various discontinuities within the tested layer. Using a mathematical model, the blade geometry and tool wear were taken into account [
33]. The possibility of calculating the ratio of shear stress to normal during the drilling process was demonstrated in subsequent works [
34,
35].
The multilinear Levenberg–Marquardt regression methods was used for evaluation the MWD data for tunnel rock bolting issues, and its correspondence with Q-system classification results [
36]. They considered it as an unsatisfactory one, if applied alone, but this data may be more effectively used as a support tool for rock mass classification and rock support design, particularly for separation of fractured and unfractured rock masses that is related with rock support requirements.
The first research in Poland in the field of practical use of the analysis of drilling parameters to accurately determine the location of delaminations in the roof of the excavation was carried out [
37,
38,
39] in one of the copper-ore mines. On the basis of the field test cycles, an algorithm was developed that allowed them to determine the index depending on the penetration speed of the drill and the appropriate pressure values in the hydraulic system of the drilling rig. Although the research was preliminary, it was confirmed that the methodology used allows for a relatively accurate localization of delaminations in the roof of the excavation. A diagram showing the distribution of drilling speed variability, containing the values of defined indicators is shown in
Figure 1. The marked arrows and peaks (3, 6, 7, 8) indicate the locations of delamination, confirmed by inspection with a borehole camera.
The close relationship between the occurrence of voids and the oil pressure in the drill clamping mechanism was shown by the research in 2004, [
40]. It was shown that the moment the drill hit the void, it was accompanied by a clear pressure drop in the supply system.
3. Previous Experience in the Analysis of Borehole Drilling Process in the Rock Mass
The most frequently made boreholes in underground workings are boreholes necessary for the use of explosives as a mining technique, and in underground mining that is additional to the installation of an anchor support and strengthening of workings [
41]. Rotary-impact methods are used [
42,
43]. To ensure the proper course of the drilling process, several parameters are selected, the variability of which simultaneously characterizes this process, including, in particular, the number of revolutions during drilling and the pressure of the tool. The achieved feed speed is strictly dependent on the cohesion forces and friction of the traveled rock [
43,
44,
45,
46].
Various efficiency indicators are used to describe the drilling process, which allows the technology to be optimized by selecting the appropriate drilling speed, minimum tool wear, clamping force, rotational speed, impact energy, and other parameters.
The basic indicators describing the drilling process include mechanical, instantaneous, and average drilling speed and drilling progress per revolution, as well as energy consumption of the entire process. The indicators are determined for a given type of machine and constant and specific operating parameters, depending on the physical properties of the rock, its structure and texture, the method of drilling cutting, type of tool, and depth and direction of drilling.
During drilling, there is a continuous interaction between the tool blades and the exposed surface of the rock mass. The tool rotates in rotation, percussion, or rotary; percussion provides energy that leads to the destruction of the rock cohesion and the detachment of particles from the body. The process can be represented as overcoming some resistance from scale. This resistance depends on a number of physical and mechanical factors of the rock that build the rock mass, as well as the prevailing state of stress at the site of the work. In mining practice, it turns out that the operator’s experience is of great importance when conducting effective drilling. Incorrect selection of operating parameters affects premature tool wear, a decrease in drilling speed, and an increase in energy consumption of the process.
Research has shown that the recorded drilling parameters are significantly influenced by tool wear [
47]. After drilling a series of boreholes in soft (shale) and hard (sandstone) rocks and recording the pressure value in the system supplying the pressure of the drilling rig and in the hydraulic motor driving the drill, appropriate regularities were noticed. In rocks with higher strength, it was found that with each successive borehole, the pressure necessary to perform this work increased and clear wear of the tool was observed. This was also dependent on its rotational speed,
Figure 2. Along with the depth of the borehole itself, the drilling speed decreased and the energy consumption of the process increased.
4. A New Field Experimental Drilling in Underground Workings
Several thousands of kilometers of excavations in the underground mine are reinforced with different types of rock bolts. Rock bolting efficiency is a function of the rock bolt’s power to enforce the mechanical continuity of the rock. Sometimes within the range of the rock layers to be reinforced, particularly in the roof of the underground excavation, a single clear discontinuity may appear as a result of loading and intensive roof strata deformation. The location of the discontinuity is critical for the correct installation of the bolts that should be fixed above this small opening and tied back to the stable rock. Today, a borehole camera inspection procedure is used to look for such defects. However, this method is time-consuming, subjective (as depends on an observer), and, in particular, offers very limited data. The recently designed experiments based on the analysis of a borehole drilling characteristic, made in the excavation, allowed this kind of weakness of the rock structure, particularly in each borehole, to be recognized.
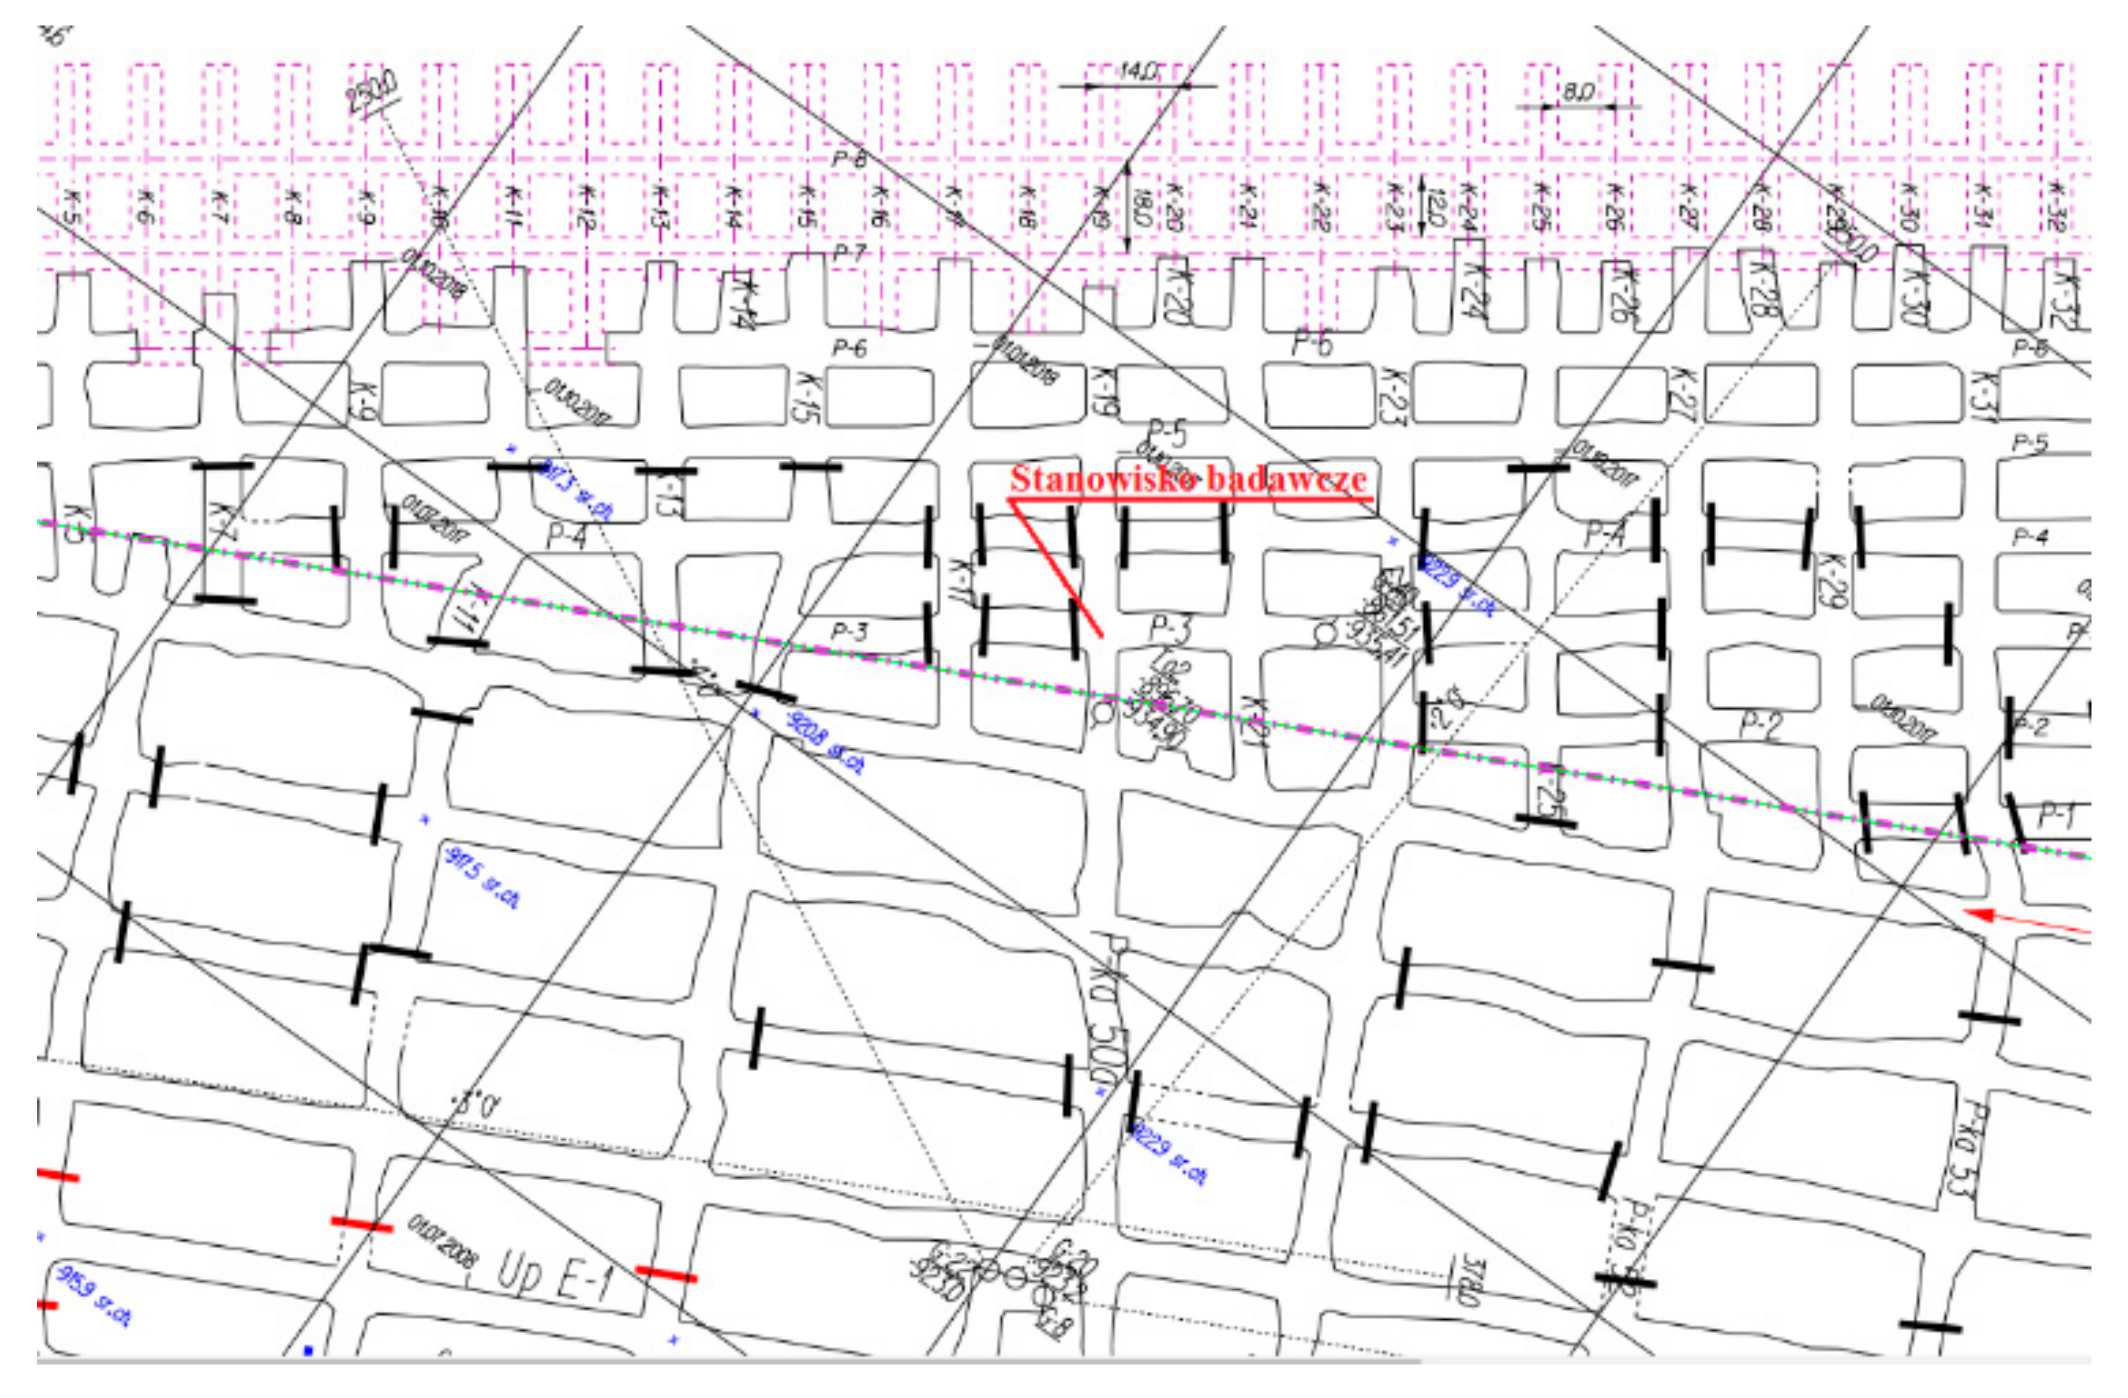
An example test stand is located in one of the mining divisions of the underground mine X, in the area of the room intersection,
Figure 3.
A total of 27 boreholes with diameters of Φ38 mm and lengths from 2.2 m to 7 m were drilled. All boreholes were drilled at a set rotational speed of 450 rpm and a clamping pressure of 100 or 50 bar [
48]. To minimize the impact of tool wear, drilling of each subsequent borehole was started immediately after inserting a new drill bit.
In each area at the drilling site, drill cores were collected and the strength parameters of the rocks were determined. After drilling, each borehole was examined with a borehole camera to verify any discontinuities.
The thickness of the Zechstein carbonate series in the part of the roof of the excavations, where the experiments were located, was on average about 10 m. In the roof of the excavation, within the interval 0–2 m above its height, the presence of calcareous dolomite with a distinct laminated structure highlighted by thin inserts of clay substance with a thickness of 1 to 5 mm was found. The thickness of individual laminations varied from 0.03 m to 0.80 m, with an average of 0.3 m. Moreover, there was anhydrite with fine clay and dolomite intergrowths. The average compressive strength of the roof rock was UCS = 70–156 MPa.
During the test drilling, the tool position change over time was recorded using the HighLine PRF08-E1AM0340 cord encoder. The location of the encoder mounted on the Roof Master 1.4 anchor is shown in Figures 6 and 7. The measurement was recorded with a frequency of 1 kHz.
Instrumented Drilling and Bolting Rig
The Roof Master 1.4 drilling and bolting rig consists of three basic units: chassis (1), body (2), and working unit (3),
Figure 4. The working unit consists of a telescopic boom and a JHFletcher drilling and anchoring turret equipped with a dry dust removal system. Drilling is performed with a rotary drill equipped with handles (KCV4 1 RUR, Φ25 mm or KCV3 1/12, Φ38) with Kennametal carbide tips.
Drilling parameters are controlled by a set of levers controlling the hydraulic valves. Monitoring results, i.e., the engine torque, pressure in the drill clamping system, and the power supply of the hydraulic motor are stored in the memory with every second sampling frequency. The torque value is calculated from the characteristics of the hydraulic motor as a function of the supply pressure. The pressures and torque are displayed on an ongoing basis on the operator’s screen,
Figure 5.
For the purposes of research, the machine was additionally equipped with a sensor of the current position of the tool during drilling, a cable encoder,
Figure 6 and
Figure 7 (Waloski, 2020).
During the tests, three basic parameters were recorded on a laptop computer. Two were related to the hydraulic system of the machine (pressure in the clamping system and the rotation of the rod—recorded every 1 s with an accuracy of 1 bar) and the third was related to the measurement of the tool position, using a cord encoder (with a resolution of 0.03 mm) with a frequency of 1 kHz.
5. The Concept of the Model of Rock Mass Discontinuity
Machine learning algorithms with the use of neural networks or fuzzy logic offer great theoretical possibilities in assessing the quality of the rock mass, but the developed algorithms could, in practice, only cope under similar geological conditions. Moreover, these algorithms cannot take into account the individual and subjective influence of the machine operator, eventually becoming ineffective.
The approach adopted by the authors is based on the analysis of the model consisting of elementary sections of the rock mass (blocks) in the area of the drilled borehole, in which a relatively small variation of characteristic parameters is assumed. Mass discontinuities or changes in structure are treated as local disturbances with a relatively small share. With this assumption, we can expect that with specific and determined parameters of the drilling rig (type of tool, method of drilling, cutting, clamping force, number of revolutions, etc.), the recorded parameters will be similar in terms of individual elementary blocks. In this case, when looking for a defect in the form of mass discontinuities (e.g., local rock stratification), a characteristic deviation from the mean value is sought. This approach allows you to free yourself from the influence of a number of unpredictable factors influencing the drilling process.
The graphically described concept of the model is shown in
Figure 7, where in the middle of a given rock type (S) there is a disturbance (W). It was assumed that the hole is drilled along the axis of the unit block passing through the rock-disturbance, and again the rock.
Under homogeneous conditions the drilling process is stable with a specific energy demand. When the drill encounters the disturbance zone, W, then a change in the energy consumption of the process occurs, and thus the speed of the process will change, which will be recorded as a peak.
The presented model is very simplified and assumes that the speed and acceleration of the linear movement of the drill rod at the point of encountering the individual discontinuity of the rock mass during drilling, due to the void (and lack of resistance) present here, will always be greater than when passing through the rock with resistance. As a result, during the analysis, there is no need to know parameters other than the kinematic parameters, which are measured directly in real time during drilling. By recognizing the characteristic anomaly (peak) in relation to the moving average value of accelerations during the variability of the characteristics, the required critical discontinuity is recognized.
6. Discussion of the Results of the Monitoring of the Experimental Drilling of Boreholes
The structural change of the rock mass may result from the formation of discontinuities in the form of delaminations, micro-caverns, or other types of void, in which the layers in the rock mass are separated. We can also consider the structure change to be the presence of inclusions in the form of various types of interlayer of the primary rock, for example, shale. When analyzing drilling parameters, the aim is to capture material discontinuities, i.e., a relatively small area in which the rock resistance to the tool does not exist. The speed of the blade movement depends on the resistance to movement associated with friction of the drill string in the borehole and the resistance associated with the design of the machine itself, as well as the capacity of the installed hydraulic bolt pump.
Drilling boreholes with a drilling rig requires successive adding of new rods as the length of the planned borehole increases.
Figure 8 shows examples of registers of successive displacements of the drill rod during drilling of the borehole, measured with a cord encoder as a function of time. The arrows mark the next drill rod.
By calculating the derivative of the path over time, the drilling speed curve is obtained. Due to the large number of samples during the measurement and to improve readability, the data was then resampled and smoothed. Sample data of the averaged linear drilling speed for the first rod after smoothing is shown in the diagram in
Figure 9, showing with arrows the places clearly different from the value of the moving average at a given drill position.
According to the model indicated earlier, it is assumed that drilling occurs in stable operating conditions (with constant pressure and speed), so the recorded change in drilling speed should result from some environmental defects (rock mass zone).
Drilling speed changes may also result from vibrations of the drilling rig, minor structural changes in the rock, friction of the drill string with the walls of the borehole, etc. We can observe them locally as vibrations around the average value or in the long-term as a constantly changing trend.
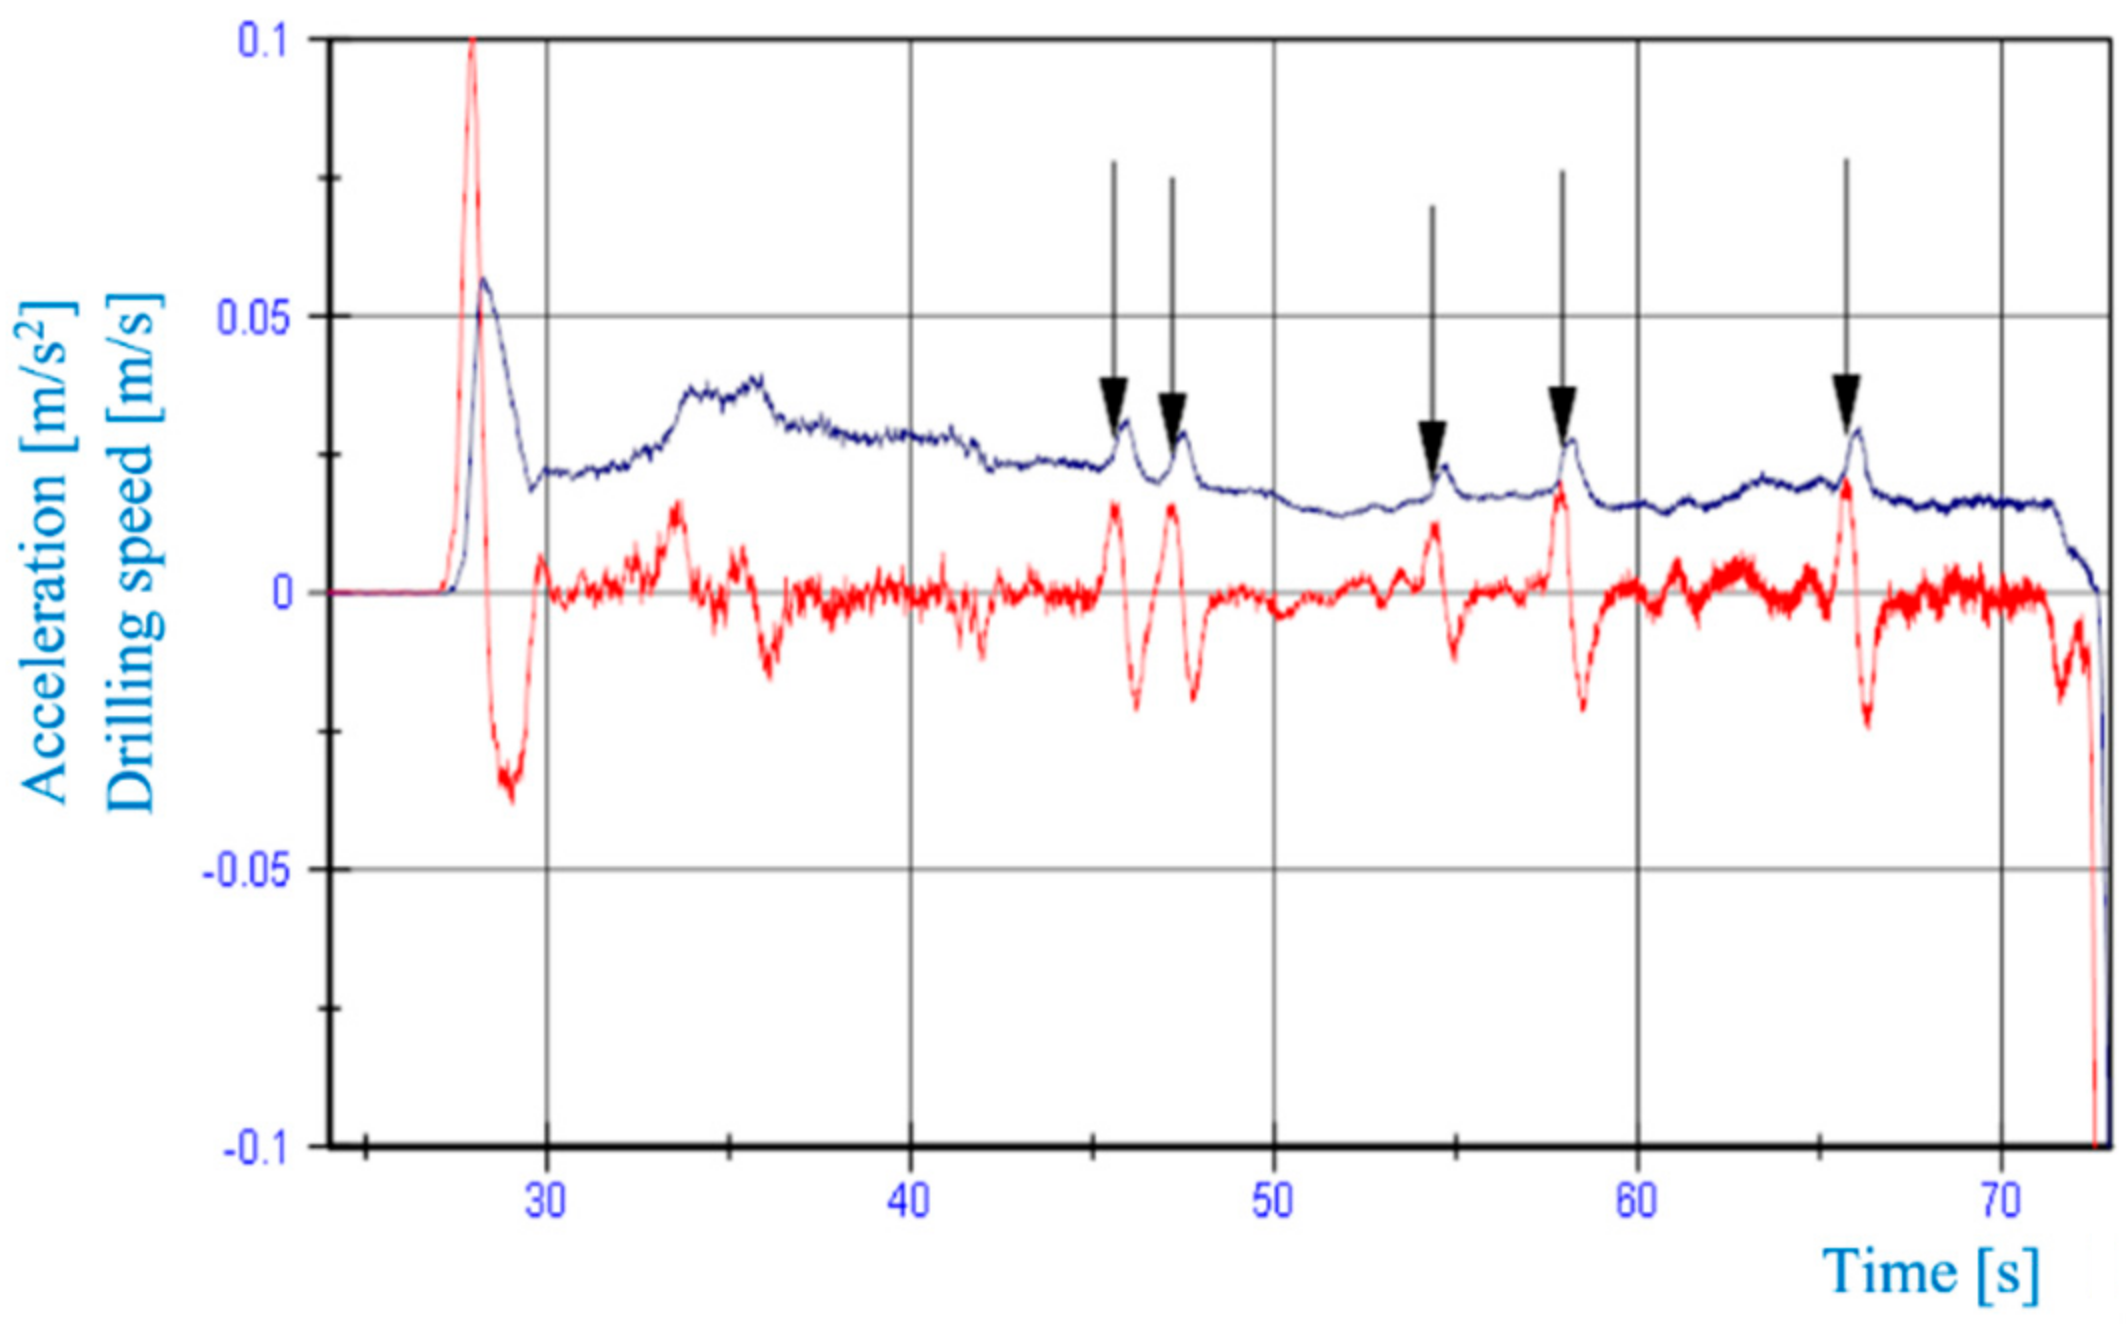
Drilling speeds and acceleration for the first rod of borehole number 6 are shown in
Figure 10.
In place of drilling speed changes, characteristic sine-like waveforms are visible, which are much larger than the surrounding background.
Figure 11 shows an example of the variability of the drilling speed of another borehole, No. 2, against the background of a moving average, where local deviations from the average values are clearly visible.
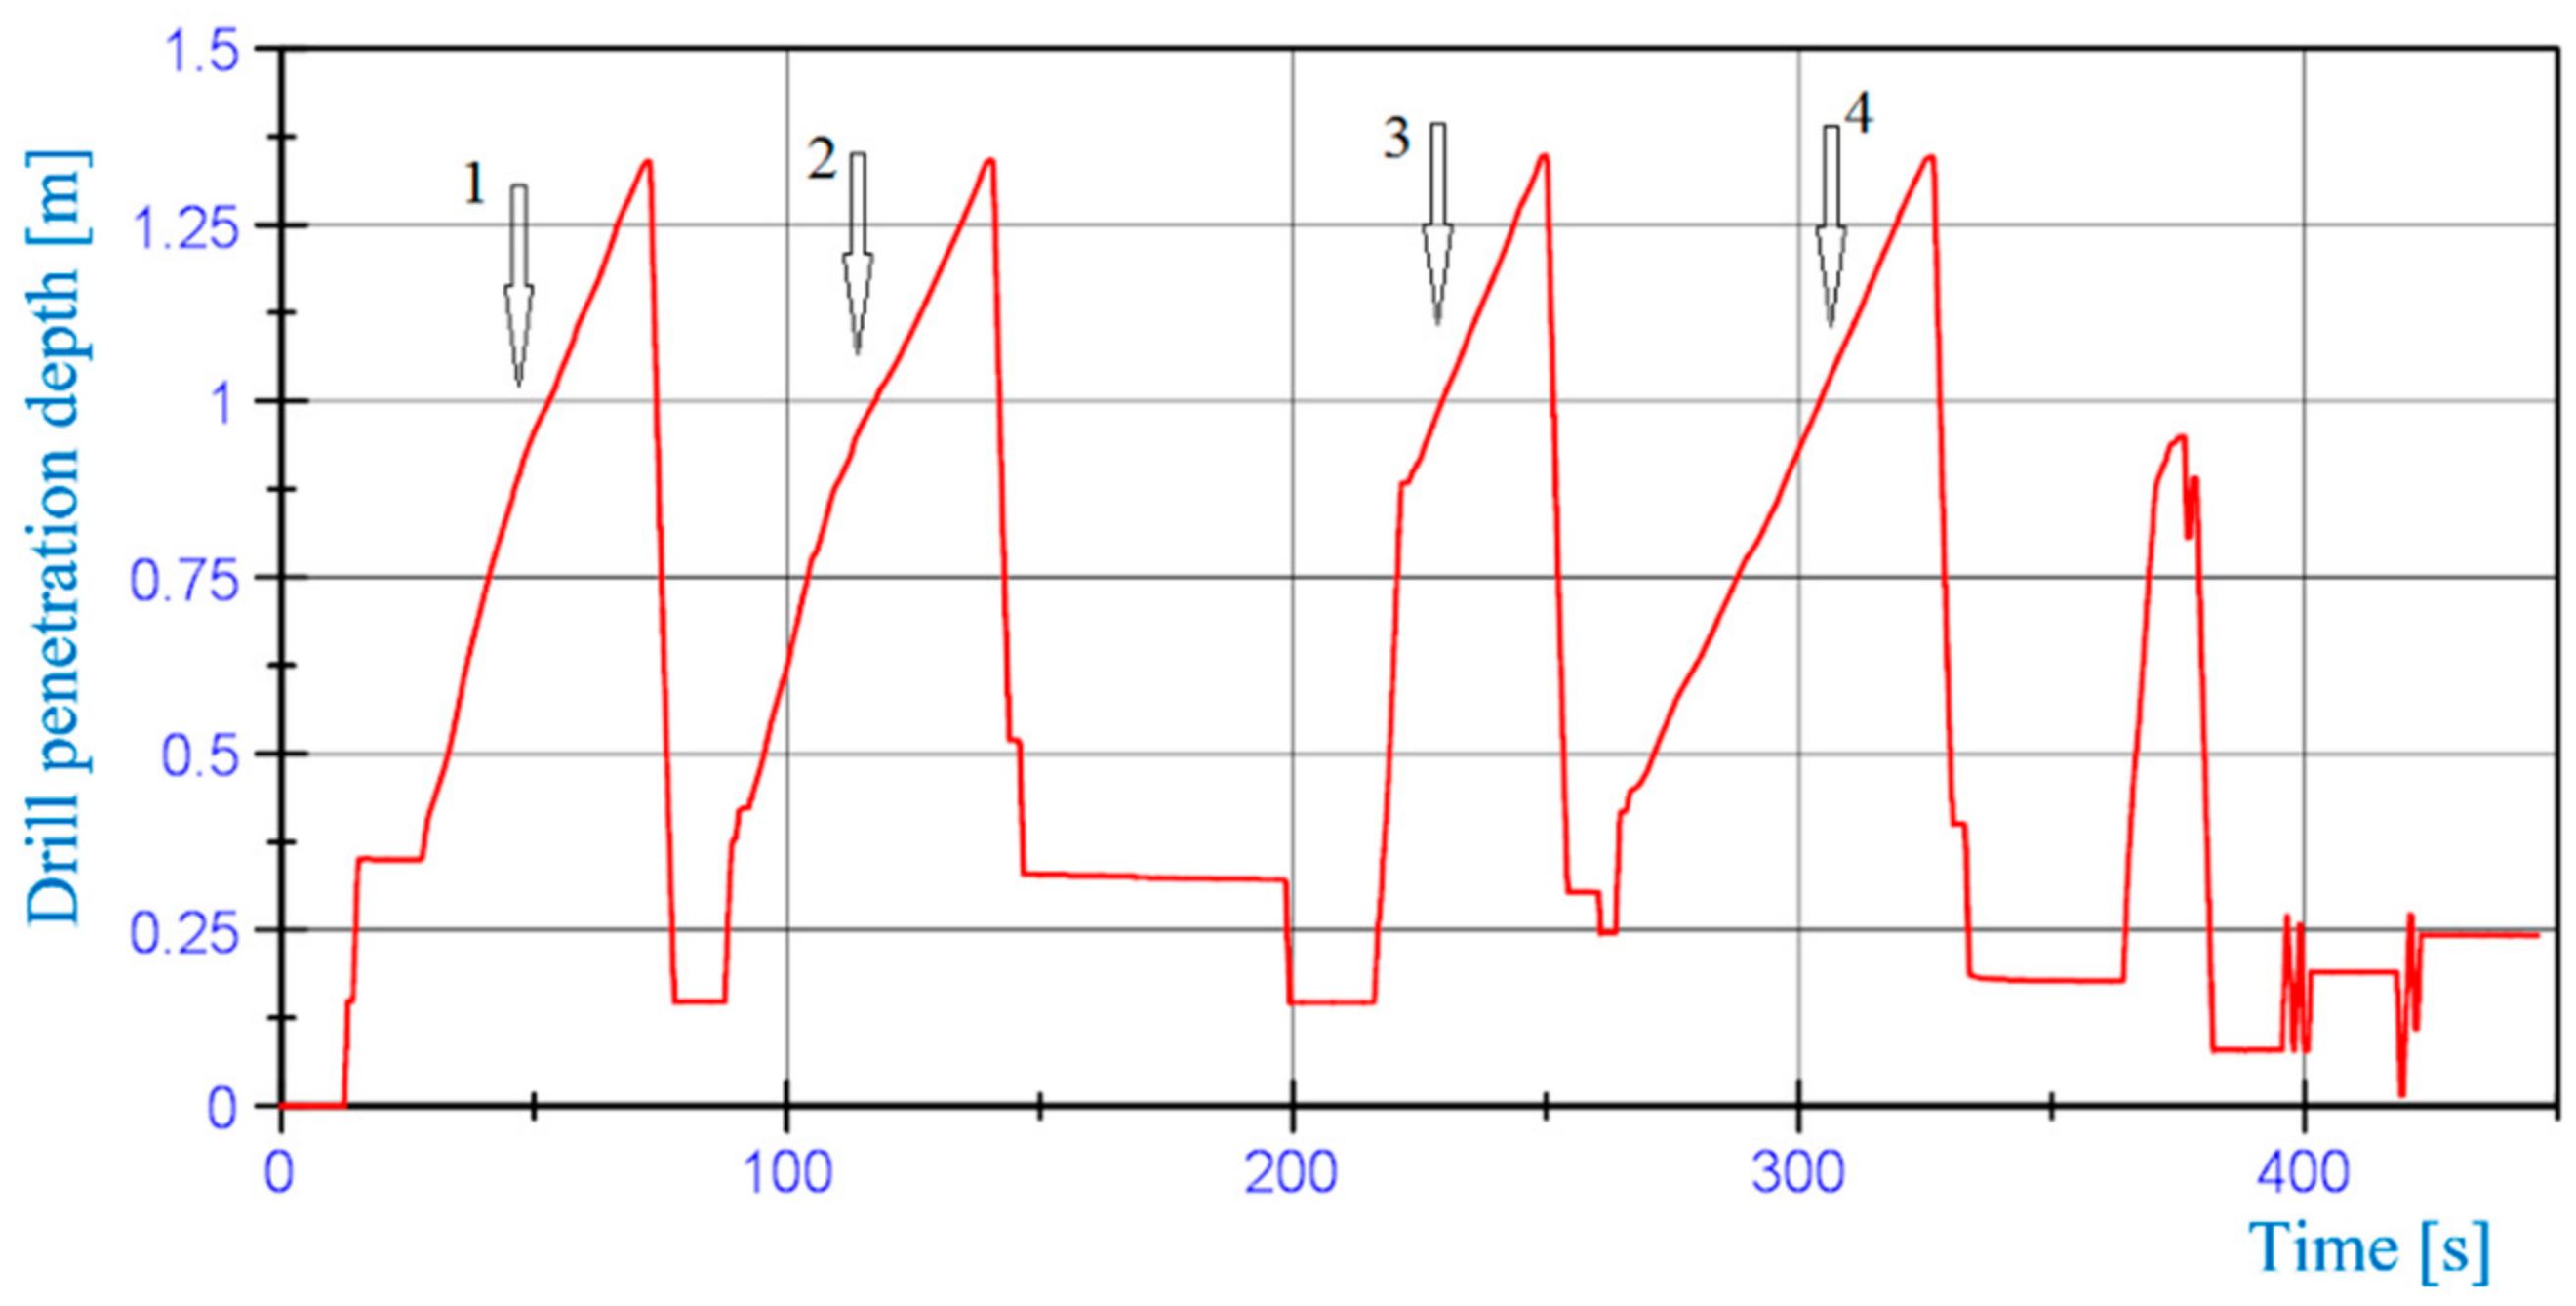
The course of the drilling process for an exemplary borehole is shown in
Figure 12. The consecutive rods are marked in blue. The arrows indicate the speeds in extreme positions for a given drill rod. At the start of drilling the first rod, the speed was 0.035 m/s; after about 1.2 m the speed decreased to 0.0192 m/s. At the end of the second rod, the drilling speed was only 0.008 m/s. Due to the low drilling speed (noticeably reduced compared to the beginning of the borehole), it was decided, after consultation with the operator, to replace the drill bit with a new one, which increased the speed (at the beginning of the third rod) to about 0.037 m/s. This result is consistent with the drilling speed at the start of the first drill pipe. This proves that the decrease in drilling speed was due to tool wear and not to a change in the susceptibility of the rock to the cutting process.
Observing the speed curve at the end of the first rod and the beginning of the second, as well as at the end of the third and the beginning of the fourth, a slight increase in speed is visible. Points located at the beginning and end of adjacent rods are located in the rock mass in close proximity, which allows us to assume that there is no significant change in rock properties between them that would affect the drilling process. Although in the case of the first station, the observed increase was small and small enough that it could be within the error limits (speed difference of 4% between the first and second rods of the well discussed), in the case of the remaining stations, the observed increase manifested itself with a much greater intensity, which allows the assumption that there is some regularity.
Probably the specific way feed applied in the Roof Master 1.4 machine is responsible for the increase in speed after each new rod is installed. The feed is carried out in two stages through the auxiliary cylinder and the main cylinder with a toothed wheel, which is connected to the machine guide by a chain link. This method of implementing the feed may cause a change in the clamping force when the feed is transferred from the auxiliary cylinder to the main cylinder.
It should be noted that the change in drilling speed due to tool wear varies depending on the location of the test stand. The observations of the drilling speed for the 3rd test stand are shown in
Figure 13. At the beginning of the work stage of each new rod, no reduction in speed was found, as was the case for the first test stand, although the mechanical parameters of the rocks for this stand were better than for the first stand.
The selected research stands differed from each other in terms of their location in relation to the exploitation front; the third one was the closest. As a result, the drillings were carried out in different states of the exploitation stresses of the rock mass. On this basis, it was found that the rate of tool wear depended not only on the mechanical properties of the rock itself, but also on the state of stress and the degree of stress in the rock mass.
6.1. Spectral Analysis with Fast Fourier Transform
The transformation of the signal from the time domain to the frequency domain is one of the basic tools in the analysis of processed signals and is also used in mining, e.g., for testing the structure of conveyor belts, [
49].
The characteristics of the signals recorded during the test drillings carried out in the roof of the excavations were analyzed with the National Instruments software. These signals were pre-smoothed with a 15-point “smooth” filter using a moving arithmetic average. On the basis of the smoothed path, the course of the drilling speed was calculated and used in the spectral analysis.
The frequency analysis is based on the assumption that each signal can be represented as sinusoidal components with a certain frequency and a certain amplitude. The decomposition of the primary signal is performed using the Fourier transform (2):
where
I is the imaginary unit (
i2 = −1).
Due to the fact that in measurement practice the data obtained is primarily discrete, it is necessary to define the Fourier transform for the discrete character of the signal by replacing the integral with the sum of the n-element sequences
xn.
Currently, to solve the above-mentioned discrete transform, FFT (fast Fourier transform) algorithms are used, which allow for more efficient calculation of the transform in relation to the classical approach.
Such analyzes were carried out for the results obtained from all test stands, but each borehole was not treated as a whole, but as sections corresponding to successive drill rods. Examples of frequency distributions are shown in graphs
Figure 14 and
Figure 15.
When analyzing the obtained data, it can be seen that the frequency distribution was similar for each rod. Frequencies up to 150 Hz dominated. However, the differences appear in the amplitude values of the component frequencies, but for the same frequency values.
6.2. Short-Term Fourier Transform
Analysis signals often change in time. The analysis of such a signal in the FFT method causes the loss of information regarding the change of the properties of the tested signal over time. To avoid this, a short-term Fourier transform STFT is used. This method consists in dividing the analyzed signal into equal time intervals, which are then subjected to spectral analysis. The result is presented as a spectrogram of the analyzed signal [
50,
51,
52]. The described method of data analysis is presented in the following record:
The h () function is a time window that moves along the signal’s timeline and cuts out portions of the x () function which are subjected to spectral analysis. The position of the function h () is determined by the variable t. As a result, a series of short-term Fourier transforms were created, used to build the spectrogram.
Each of the 27 boreholes was subjected to STFT analysis separately for each rod. To obtain the best adjustment of the method to the processed signal, various types of windows were used, such as rectangle, Hanning, Hamming, Blackman, FlatTop, Kaiser, Cos10Perc, Welch, Parzen, Bartlett, Vallee, Cauchy, Gauss, exponential, and Riemannm. In addition, different types of window widths were selected to obtain the optimal compromise between the resolution achieved in the time domain and the resolution in the frequency domain.
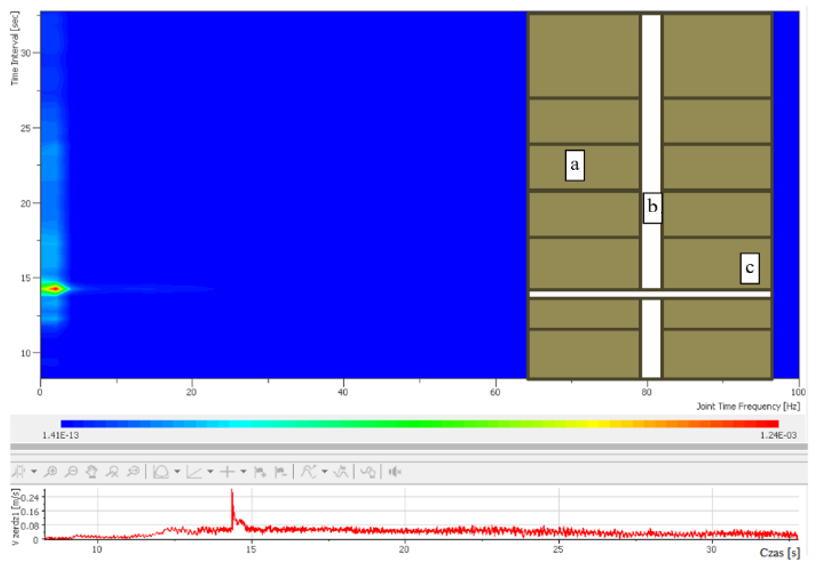
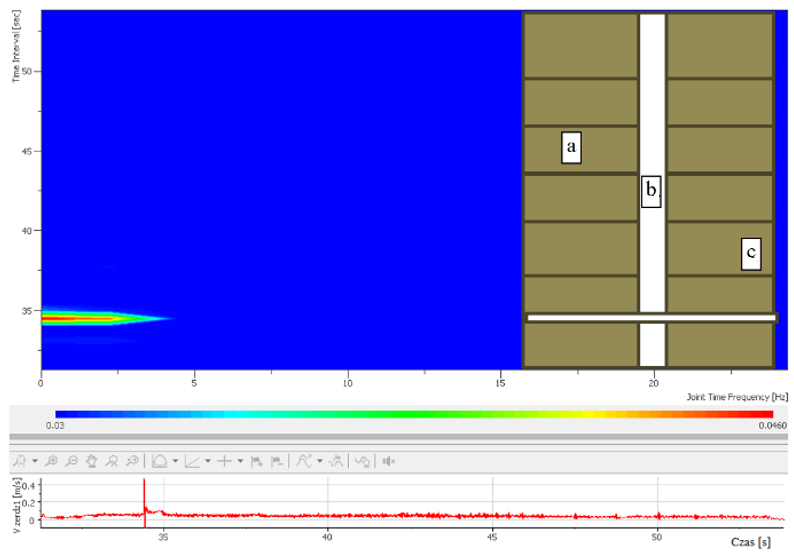
Figure 16 shows an example of a spectrogram for one of the boreholes of the third test stand. A Hanning window was used for the analysis, with the ship line set in the time domain at 50. After about 14 seconds, an increase in the signal amplitude and the appearance of additional frequencies in the range of 5 Hz ÷ 30 Hz and 40 Hz ÷ 60 Hz can be seen. This change occurred at a depth of about 0.18 m and corresponded to the discontinuity occurring in this place, confirmed by an endoscope. In the case of the remaining boreholes, at the point of delamination, an increase in the signal amplitude occurred, as in the discussed example, but not always accompanied by the appearance of additional frequencies in the band.
It has been found that when some types of windows are used, such as, for example, Hanning, Hamming, or Blackman, the presence of additional frequencies depends on the choice of the grid density in the time domain. During subsequent attempts to change the grid, it was found that, regardless of the type of window used, each time the amplitude increased in the frequency range up to about 5 Hz.
In a situation where there is a large difference in the amplitude value between the signal components, certain frequencies may be hidden or become less visible. To avoid this phenomenon, a logarithmic scale was also used in the analysis. An example of the application of such a scale for the discussed case is shown in
Figure 17.
The basic element of spectrum analysis is the way of presenting the signal amplitude in the time–frequency system. In the discussed example, peak amplitude values and mechanisms calculating the spectral power and spectral power density (WGM) were used. Moreover, in these cases, clear scratching of the places where disturbances related to the stratification of the rock mass occurred. The calculated spectrogram for WGM is shown in
Figure 18.
Figure 19,
Figure 20,
Figure 21,
Figure 22 and
Figure 23 show representative spectrograms developed according to the above assumptions for research wells. Each peak on the accompanying spectrogram corresponds to the location of the delamination of rocks as determined by inspection of the borehole.
In cases where the delamination was accompanied by the tool stoppage (or the stop was random and not related to the delamination), the signal spectrum showed bands related to maneuvering movements. If a speed jump was recorded before the delamination, the first visible line is related to the delamination, and the next to the machine maneuvering movements. Such a situation is presented in
Figure 20. The first stripe from the bottom corresponds to the delamination occurring at a depth of 0.18 m in borehole No. 9 (3rd test stand), the other two are the result of an attempt to free the crayon and continue drilling. The first band has a greater amplitude than the other two, but this event is not a regularity because there are events in which the bands associated with maneuvering movements have a greater amplitude than the band associated with the structural change in the rock mass. Therefore, the secondary fringes cannot be separated from the proper fringes based on the magnitude of the amplitude. A characteristic feature of the secondary fringes is that before their formation, the signal spectrum disappears, as opposed to the proper fringe.
The test drilling of the boreholes provided additional information enabling the future development of an algorithm for recognizing other features of discontinuities, causing characteristic changes in drilling speed and acceleration, such as, for example, filling with rock rubble or inclusion of other rocks. At the present stage of research, we can confirm that they are caused by abrupt displacements or a sudden stop of the drilling rig. More detailed research is underway.
6.3. Critical Delamination Index
The tests confirmed that during the drilling process, encountering a void or a fracture zone causes a characteristic change in the recording of the drilling rig’s operating parameters. When a void appears, the cutting resistance drops to the minimum value determined only by the frictional resistance both in the machine itself and the frictional resistance of the drill string in the rock mass. This causes the appearance of rapid accelerations that appear as peaks in the recorded signals. Of course, this is also accompanied by a change in the drilling speed, which also appears as a characteristic peak in the waveform. However, the drilling speed itself may change many times with the wear of the tool and with the appearance of a layer with different machinability. The speed change will also be noted then, but will occur over a longer period of time. From this point of view, the detection of delamination based on the change in the size of the drilling speed is also possible, but it must be subject to certain conditions. The analysis on the basis of the speed course should be performed for a certain (narrow) period (window). This approach basically comes down to looking at the rate of change of a function, i.e., the derivative of speed over time. Therefore, it is more advantageous to analyze the acceleration waveforms. The condition for the possible occurrence of the discontinuity zone is the occurrence of acceleration above a certain limit threshold, according to the condition: a ≥ ag, where a is the acceleration value of the tested signal and ag is the threshold value determined on the basis of the test drilling performed.
Under the conditions of the conducted experiments, the height of this threshold, expressed as the critical delamination index, was confirmed at the level of 0.46 m/s2. After conducting a series of tests and analyses, the method of signal processing and its parameters were selected. The value was given for the data after processing with the “smooth” filter (15-point smoothing for the basic course, 15-point smoothing for the speed course, and 50-point smoothing for the acceleration course). Depending on the method of smoothing with the “smooth” filter, the threshold value may change. The given value is valid for a specific location and if the method is widely used, it should be validated in advance on a larger population.
Another possible independent condition for the discontinuity zone to occur is the situation in which the tool stops and, consequently, the instantaneous zero speed of the recorded signal occurs.
For both the first condition and the second condition, recognition should be made for at least two or more boreholes near each other, so that by comparing the waveforms with one another, it is possible to eliminate peaks and stoppages that are not related to the occurrence of a potential discontinuity zone. This assumption assumes that the significant discontinuity zones affecting the stability of the excavation are extensive and should cover a larger part of the excavation than the point concentration for a single borehole. The original procedure for detecting discontinuity zones was developed for the Roof Master drilling and bolting rig, but it is also possible to adapt it to other types of rock bolters. As it results from the analysis of the bibliography, the acceleration has not been used so far to locate the delamination of the roof and assess its quality.
7. Conclusions
Effective stability of underground excavations by rock bolting requires knowledge not only of the typical geomechanical properties of the rock mass, but also of its structure, especially the existence and location of critical discontinuities that determine the required length of bolts. Making boreholes in the rock mass with instrumented drilling and bolting rigs allows recording and then analysis of the variability of kinematic parameters of drilling rod operation. On the basis of experiments carried out in an underground copper-ore mine, an original algorithm was established to identify an individual anomaly with the characteristics corresponding to the existence of a critical discontinuity of the roof layer of the excavation. In addition, it was found that:
The existing delamination or zones of cracks (discontinuities) in the roof of the excavation cause a noticeable change in drilling parameters (acceleration, speed);
The intensity of change is influenced by the tool wear, machine design, and human factors;
Tool blocking, overheating of the hydraulic oil, or clogging of the drill cutting removal system may be unfavorable phenomena that hinder the correct interpretation of the drilling process characteristics;
Precise location of discontinuity zones is possible with the use of the short-time Fourier transform (STFT), with the selection of appropriate parameters of the time window;
The FFT analysis showed the existence of a similar distribution in the frequency domain of the tested signal for all test stands;
For the proposed method of discontinuity detection to be effective, it must be validated in specific geological conditions;
The critical value of stratification of roof rock in the conditions of the conducted research is 0.46 (m/s2);
Monitoring of the rock mass during a typical implementation of the technology (without the need to interrupt it) creates an invaluable opportunity to mass collect objective data independent of the observer, which is significantly cheaper and facilitates research.


