4.1. Experimental Setup
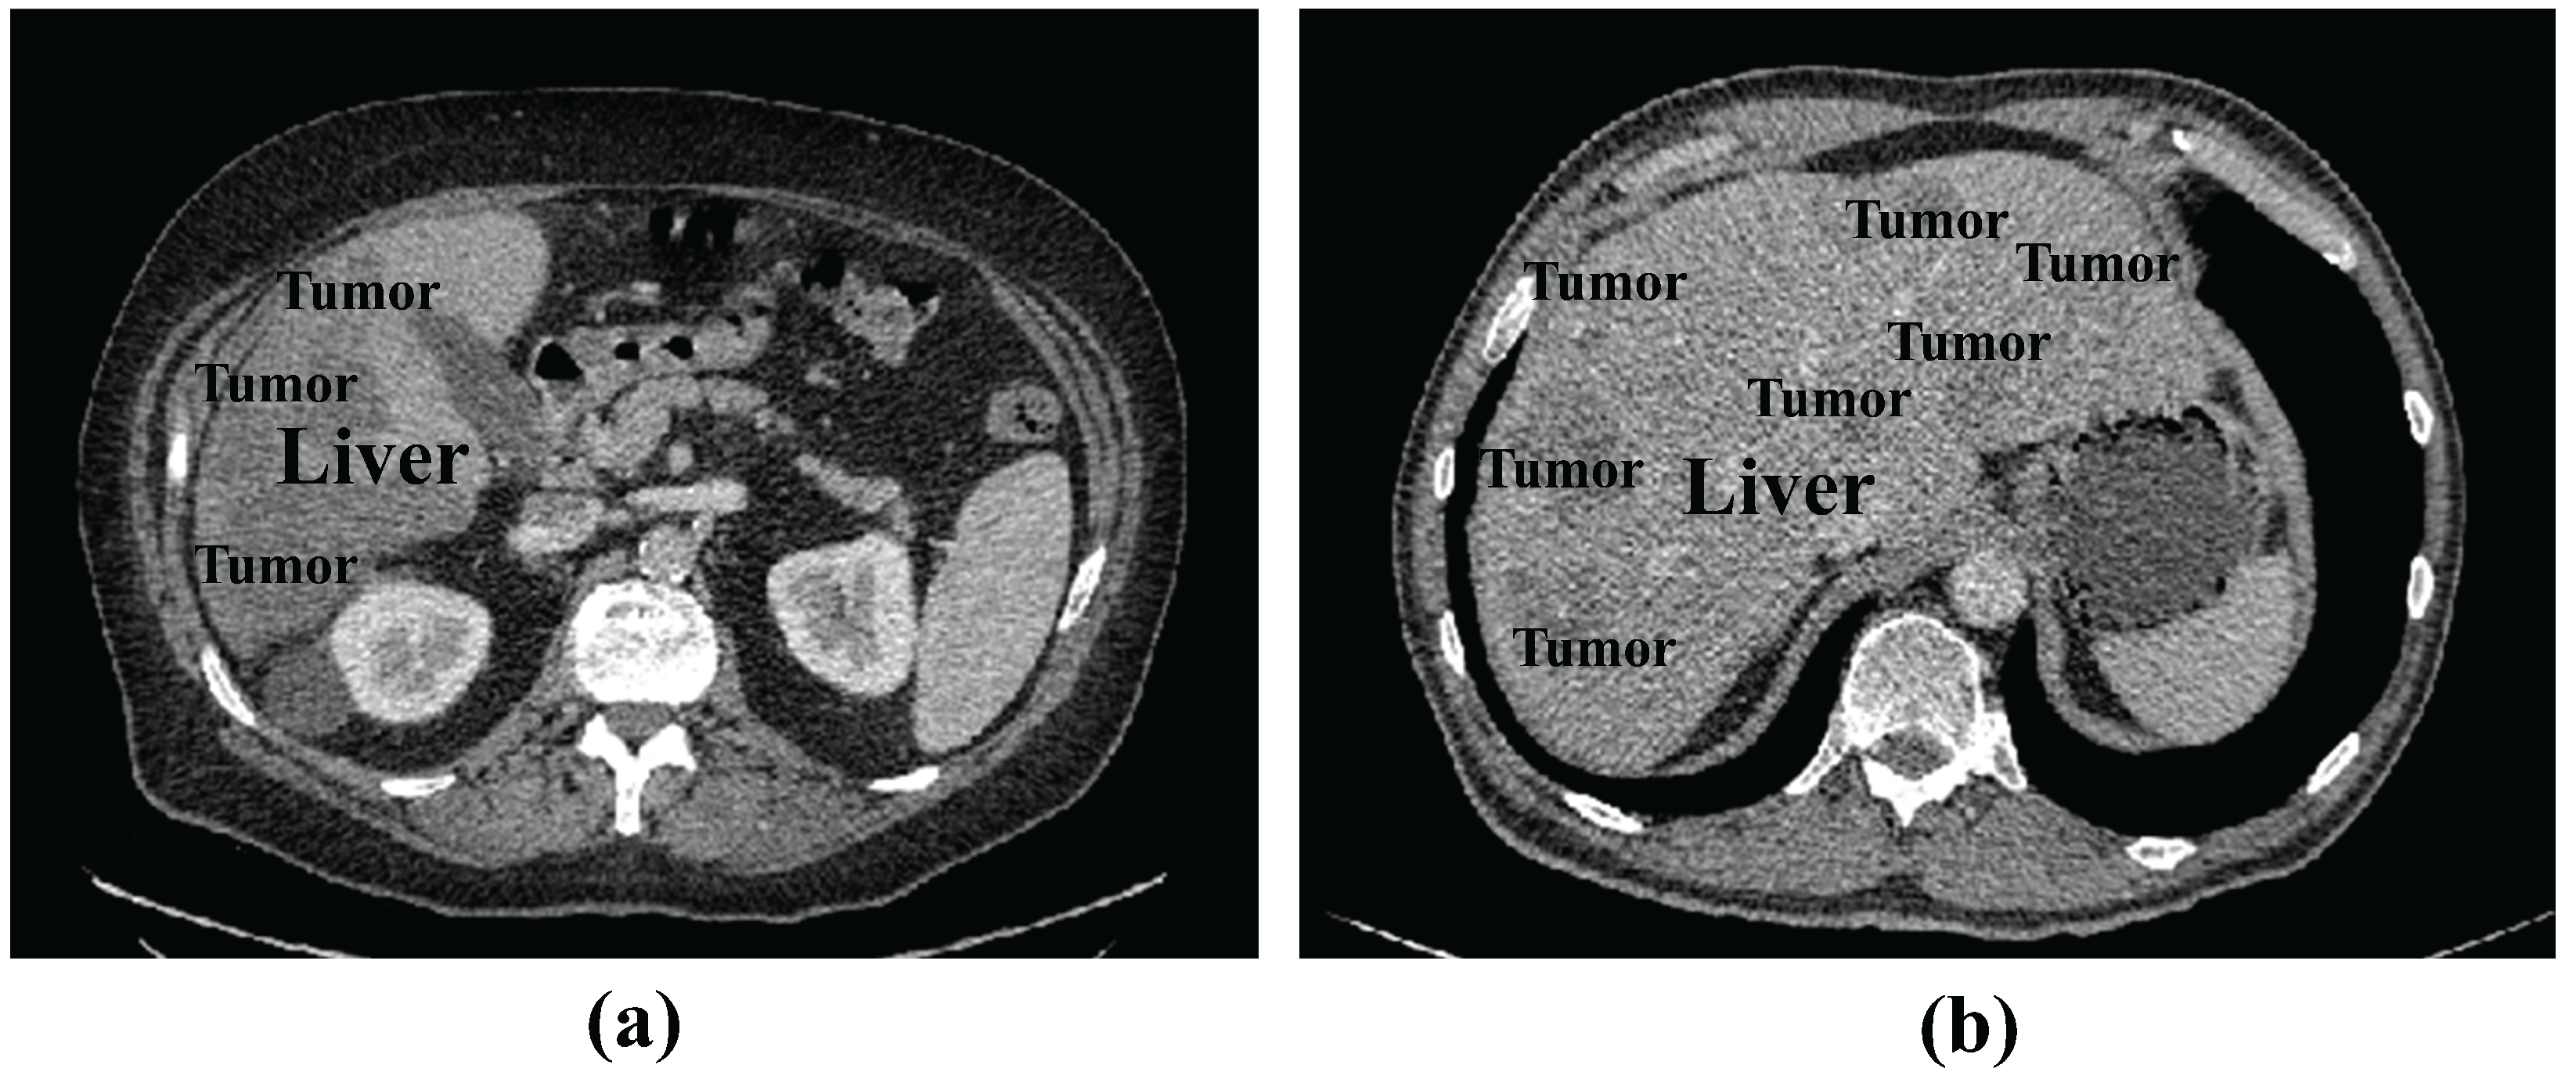
Dataset: We tested the proposed method using the publicly available LiTS17 dataset containing liver and tumor data. The LiTS17 dataset comprises 201 contrast-enhanced 3D abdominal CT scans, of which 131 cases are allocated for training and 70 cases for testing. For the training set, MICCAI provides manual annotations for liver and tumor regions created by experienced radiologists. The resolution of the dataset is 512 × 512 pixels, with pixel spacing ranging from 0.6 mm × 0.6 mm to 1.0 mm × 1.0 mm.
Since the test samples do not contain annotations, we used LiTS17 training samples for model training. We randomly divided the 131 samples of the LiTS17 training samples into training, validation, and test sets as an 8:2:2 ratio. To prevent overfitting, we implemented data augmentation strategies, including the random cropping of original images combined with vertical and horizontal flipping.
Evaluation Metrics: The commonly used evaluation metrics in medical image segmentation include Dice Coefficient (DPC), Volumetric Overlap Error (VOE), Relative Absolute Volume Difference (RAVD), Average Symmetric Surface Distance (ASSD), and Root Mean Square Symmetric Surface Distance (RMSD). Given the base truth value
A and prediction mask
B of the segmentation, DPC is formulated as Equation (
5).
The VOE and RAVD measure the overlap between two volumes, which are represented as Equations (
6) and (
7).
The ASSD and RMSD are applied to evaluate the segmentation boundary and quantify the difference in surface distance between two volumes. ASSD and RMSD can be defined as Equations (
8) and (
9).
where
and
denote the surface voxels of
A and
B, respectively;
is the shortest distance between a voxel
x and a set of boundary voxels
.
In the experimental results, we added up and down arrows next to the evaluation metrics, where the up arrow indicates that higher values of the evaluation metrics represent better segmentation results. The down arrow indicates that lower values represent superior outcome.
Experimental setting: In the training process, we use standard Adam to optimize the objective function. The learning rate was set as 0.003, with a batch size of 8 and 150 iterations. A random seed of 39 was applied. All experiments (including ours and the compared methods) were conducted on a computer equipped with a Nvidia Tesla V100-PCIE GPU and 16GB of RAM.
In the preprocessing stage, we first set the window and level to 40~400 and adjusted the HU value of CT range to [−200, 200]. Then, the image of 512 × 512 size was cropped to 448 × 448 size to remove some of the background. The histogram equalization was performed to enhance the contrast of the image, and then the image pixels were normalized to [0, 1]. Finally, since the model performs the task of liver tumor segmentation, we processed the slices during the training stage by removing the slices without tumors. For each slice, we took n consecutive slices centered on it as a group and saved them as an npy file as model input. The size of the npy file was (n, 448, 448).
4.2. Experimental Results
Number of input slices validation: To determine the appropriate number of input slices, we conducted comparative experiments with different input slice values for the 2.5D input.
Table 1 shows four different experiments using consecutive slice numbers
n 1, 3, 5, and 7 on the LiTS17 dataset. The following can be seen: (1) The best experimental results were obtained with an input of three consecutive slices. (2) Increasing the slice number beyond three provided no performance improvement, with a significant performance degradation observed when using seven slices. A possible explanation is that non-adjacent slices containing less relevant information might misguide the segmentation of the central slice. Furthermore, larger slice values increase computational costs. Based on these findings, the number of slices
n of three is the optimal configuration. Consequently, all subsequent experiments in this study utilize three input slices as the standard implementation.
Comparison with state-of-the-art methods: To evaluate the segmentation performance of the proposed RIS-UNet model, we conducted a comparative analysis with the state-of-the-art U-Net family and its variants, including the U-Net [
3], UNetPlusPlus [
4], AttentionU-Net [
5], RIU-Net [
43], AIM-UNet [
45], DAL-UNet [
46], and MAPFUNet [
47]. Among these, RIU-Net, AIM-UNet, MAPFUNet, and DAL-UNet are 2.5D models, and the rest are 2D models.
Table 2 lists the qualitative comparison results.
From
Table 2, the following can be seen: (1) When comparing the performance of 2.5D methods (including RIU-Net, MAPFUNet, DAL-UNet, AIM-UNet, and RIS-UNet) with conventional 2D methods (U-Net, U-NetPlusPlus, and AttentionU-Net), the experimental results demonstrate that the 2.5D strategies achieve significant performance improvements. (2) compared with the U-Net family and its variants, RIS-UNet performs better in segmentation performance. This indicates that the RIS-UNet model design based on U-Net is more effective. By introducing the Res-Inception-SE structure, the model can capture multi-scale feature information during the encoding and decoding stages, which further improves the model performance. (3) The analysis of (1) and (2) shows that our proposed multi-level method brings performance improvement at every level, further highlighting the superiority of this network in terms of segmentation accuracy and spatial overlap.
To further validate the efficacy of the 2.5D strategy, we incorporated the 2D, 2.5D, and 3D approaches into the U-Net family and its variants, and the results are shown in
Table 3 and
Table 4. The following can be seen: (1) All models with 2.5D inputs improve segmentation accuracy compared to their 2D inputs. In particular, for U-Net with the added attention mechanism, the 2.5D input brings a performance gain of 4.89%. (2) For the U-Net family, 3D inputs generally outperform all other input configurations in segmentation performance, but the training time for the 3D input is considerably higher. (3) For our model, the 3D input does not necessarily improve the DPC coefficients, but there is a large improvement in ASSD and RMSD. ASSD and RMSD are the key metrics indicating the coherence of segmentation results, and we hypothesize that this is due to the fact that 3D input enhances the coherence of segmentation but introduces a significant amount of redundant information in the slices, which affects the segmentation accuracy. (4) By comparing with RIU-Net, AIM-UNet, DAL-UNet, and MAPFUNet, which are specifically designed for liver tumor segmentation, RIS-UNet is more accurate in segmenting liver tumors. Overall, the 2.5D inputs for all models were more accurate than the segmentation of the 2D models, and no much decrease in accuracy than the 3d inputs, while substantially reducing training time.
In addition,
Figure 4 presents the segmentation results of RIS-UNet and the compared models on four clinical cases. The first two columns display original images and corresponding ground truth masks, followed by the segmentation results of different segmentation models.
It can be observed that the other network models encounter over-segmentation or under-segmentation problems. Specifically, the following can be observed: (1) In Case 3, while AttentionU-Net failed to detect small tumor regions, MAPFUNet, DAL-UNet, RIU-Net, AIM-UNet, UNetPlusPlus, and U-Net all managed to segment smaller tumors, but only partially detected them. In contrast, our RIS-UNet accurately identified all small tumors and achieved results that were more in line with the gold standard. (2) In both Case 1 and Case 2, the U-Net family and its variants incorrectly identified the background region as tumors, whereas the improved models based on U-Net all achieved relatively better segmentation. (3) Case 4 is a challenging case due to the tumor’s location at the liver border, where low contrast exists between the liver parenchyma and surrounding tissues. In this case, all models failed to achieve successful tumor segmentation: only partial tumor regions were identified, and some models (U-Net) completely missed the tumor. Compared to other models, our framework performed slightly better in segmentation in the failure cases. (4) When the RIS-UNet model is compared with the model without the RIS module (U-Net+2.5D), we find that the RIS-UNet model with the addition of the RIS module not only segments larger tumor regions more completely, but also detects smaller tumor regions effectively, and the boundary of the segmented lesion is relatively smooth. This indicates that, due to the use of the RIS module in combination with the residual module, multi-scale convolution, and SE module, the key channel feature information is effectively captured while expanding the receptive field, avoiding the information redundancy, effectively capturing small tumor features and improving the tumor detection accuracy. In addition, in comparison with the AIM-UNet model, which is specifically improved for the Inception structure, RIS-UNet also shows better performance, further proving the effectiveness of the RIS module. The above experimental results show that the outstanding performance of RIS-UNet in medical image segmentation tasks.
Table 5 shows the DPC coefficients, parameters, and operating memory during inference for different networks. We can see the following: (1) Adopting 2.5D inputs increases GPU memory requirements but improves segmentation performance compared to 2D input. (2) The proposed RIS-UNet network requires more configurable network parameters. However, such a cost is still reasonable considering the increase in model accuracy.
Analysis of the Res-Inception-SE module: To verify the effectiveness of the Res-Inception-SE module, We conducted experiments on the LiTS17 dataset by replacing the convolutional sequences in the proposed RIS-UNet model with Inception V1, Inception V2, Inception V3, and Inception V4, respectively. To ensure fairness, all the experimental settings are the same except that the convolutional sequences are different. The quantitative results are shown in
Table 6.
Table 6 shows that the model performance gradually improves with the upgrade of the Inception structure. Specifically, RIS-UNet achieves the best performance in all five metrics compared to other models.
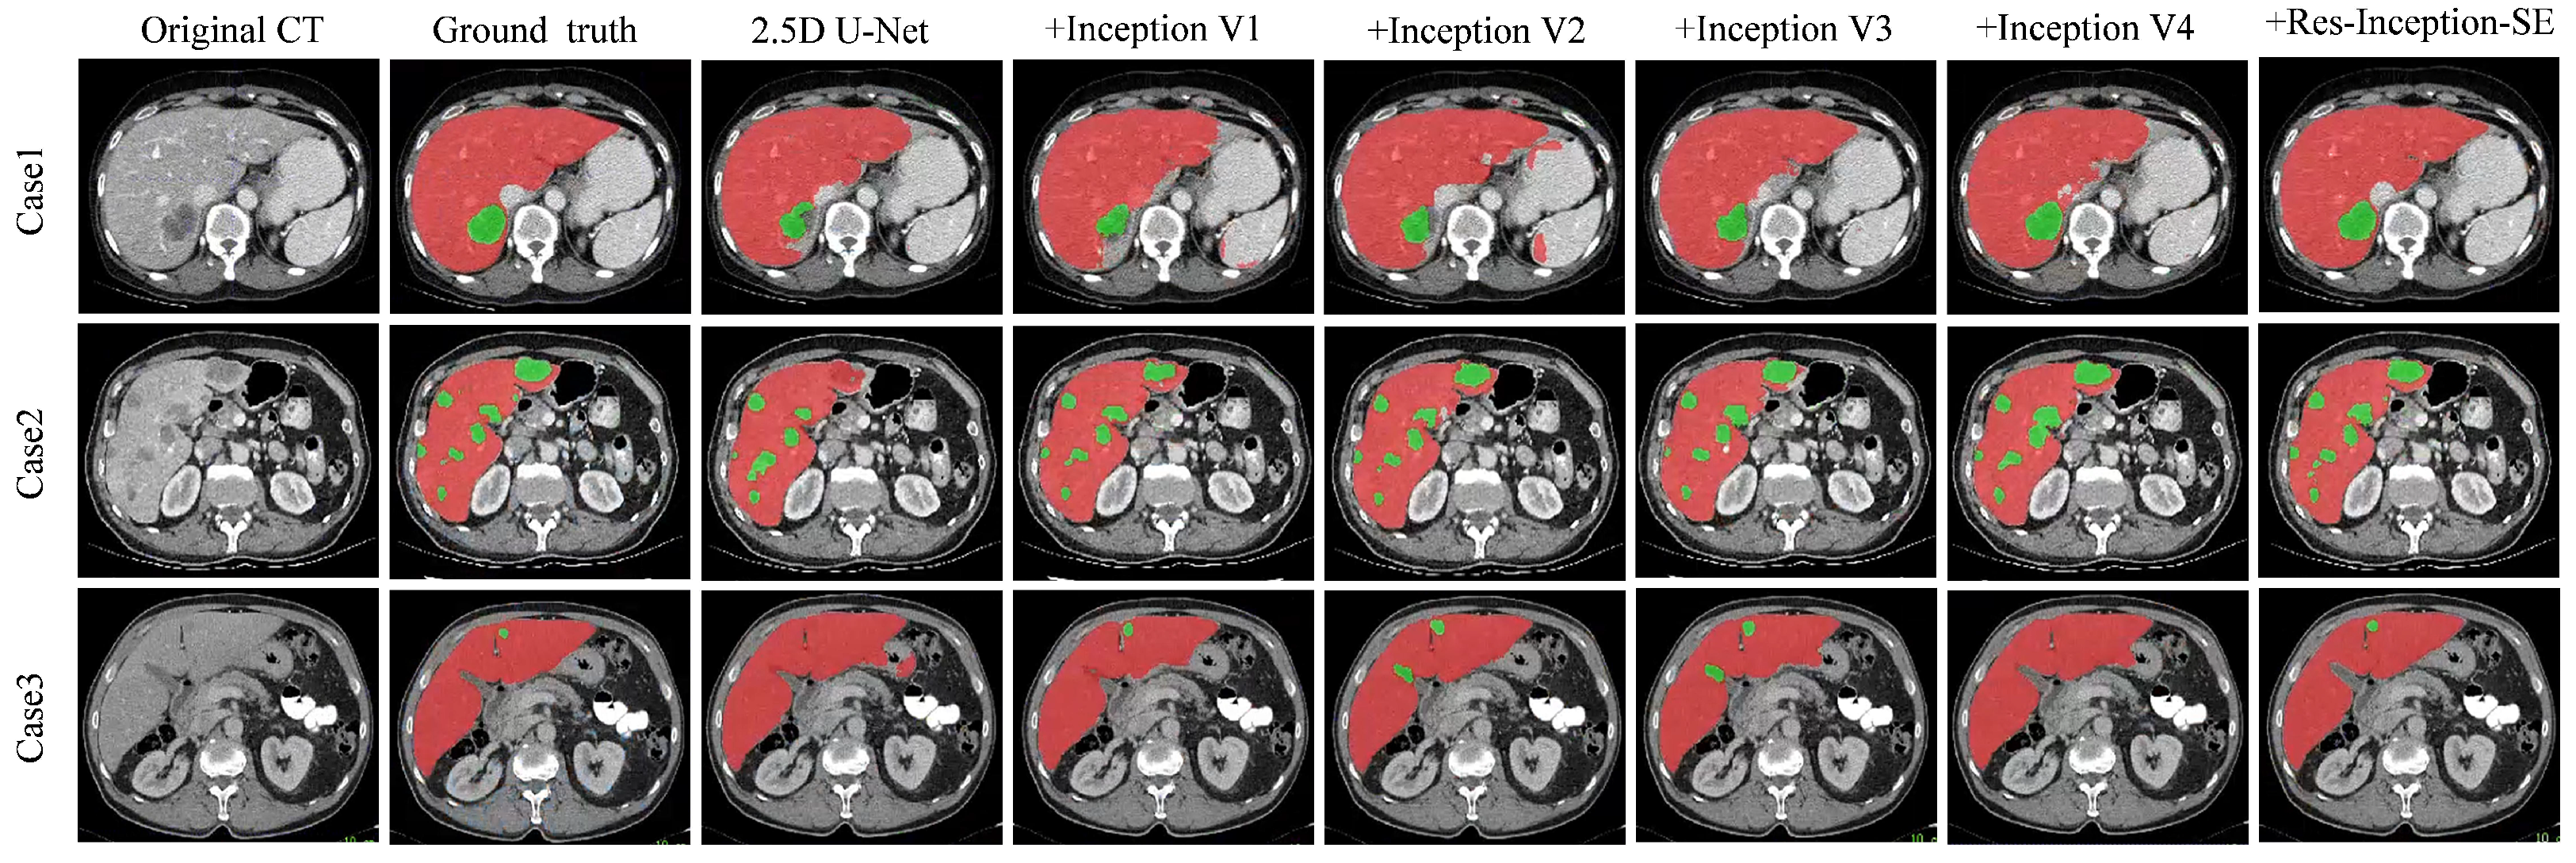
Figure 5 shows the visualization results of the experiment, which is a comparison experiment between our model and replacing the convolutional sequences with a different version of the Inception module. We selected three representative tumors for visualization and comparison: tumors located at the liver boundary, multiple tumors with different shape and location, and small tumors.
From
Figure 5, we can see the following: (1) When dealing with the tumor located at the liver boundary in Case 1, the models all show some under-segmentation/over-segmentation errors, and the segmentation results of our model (+Res-Inception-SE) as well as the model with Inception-v4 added are closer to the real boundary of the tumor. (2) The tumor locations in Case 2 are varied in size, and in addition to the large tumor in the upper right, Case 2 contains multiple tiny tumors. It can be seen that U-Net successfully segments some tiny tumors but fails to successfully identify the the large tumor in the upper right. In contrast, our model (+Res-Inception-SE) comprehensively identifies and segments all the tumors in the liver. (3) When dealing with small tumors, other models produced additional or missed small tumors, and even some models did not identify the small tumors. In contrast, our proposed method (+Res-Inception-SE) segmented the small tumor region with high accuracy. Overall, our model has more accurate boundary segmentation for large tumors and can also handle small tumors with diverse shapes and locations.
Ablation Experiments: To validate the effectiveness of our proposed RIS-UNet model, we performed ablation experiments on the LiTS17 dataset. Built upon the baseline U-Net architecture (Base), RIS-UNet combines the 2.5D method, SE block, Res-Inception-SE module, and the hybrid loss function. We progressively incorporated each component to evaluate their contributions to liver tumor segmentation, with experimental results detailed in
Table 7.
From
Table 7, the following can be seen: (1) The Base (U-Net) achieves a Dice coefficient of 66.05%. With the addition of the 2.5D method and the Res-Inception-SE (RIS) module, the Dice coefficient increases by 2.17% and 7.17%, respectively. When reaching its optimal configuration as the complete RIS-UNet, the model attains maximum segmentation performance with a Dice coefficient of 76.84%. These experimental findings show the effectiveness of these proposed modules and confirm the superior ability of RIS-UNet in segmenting the liver region. (2) Specifically, the comparison of the results of “Base+2.5D” and “RIS-UNet” (RIS-UNet is a RIS model added to the “base+2.5D” model), we can find that the performance of the model with the addition of the RIS module is greatly improved, with an increase of +7.62% in DPC, +8.69% in VOE, +11.74% in RAVD, +1.94% in ASSD, and +1.79% in RMSD. This significant advancement is due to the introduced attention mechanism and residual connections. The channel attention mechanism enables precise focus on crucial segmentation features, while the residual connections complement hierarchical detail outputs. These mechanisms improve segmentation accuracy and operational efficiency by collectively increasing the model’s ability to identify and extract essential information.


