1. Introduction
Continuous phase modulation (CPM) [
1] is widely used in applications where miniaturization is of interest or strict size weight and power (SWaP) constraints are dominant. Aeronautical telemetry is one such an application and the three CPM waveforms found in the IRIG-106 standard [
2] are the subject of study herein. The topic of forward error correction (FEC) codes for CPM has received regular attention over the years, e.g., [
3,
4,
5,
6,
7,
8,
9,
10]. Recently, in [
11,
12,
13,
14], a step-by-step and generally applicable procedure was developed for constructing capacity-approaching, protomatrix-based LDPC codes that can be matched to a desired CPM waveform. This development is significant for aeronautical telemetry because this design approach provides forward error correction solutions for two of the IRIG-106 CPM waveforms that were heretofore missing due to the generality of these waveforms.
In this paper, we build on the work in [
13,
14] by providing a solution to a key challenge faced by LDPC-based systems, which is that they must manage a large “peak to average” ratio when it comes to decoding iterations. The subject of LDPC decoder complexity reduction and iteration complexity has received a large amount of attention in the literature. In many studies, e.g., [
15,
16,
17] and the references therein, numerous alternatives to the standard belief propagation (BP) decoder are explored, some of which have convergence and iteration advantages relative to the BP decoder. Other studies have developed real-time parallelization architectures that are well-suited for certain hardware, such as FPGAs [
18] or GPUs [
19]. In this paper, our focus is on iteration scheduling and prioritization that can take place
external to a single LDPC iteration, thus any of the techniques just mentioned can be applied
internally if desired. In [
20], a dynamic iteration scheduling scheme similar to ours was introduced, although it ignored real-time considerations. We propose a flexible real-time decoder architecture whose complexity can be designed essentially to satisfy the average decoding requirements, which are relatively modest. We then introduce a design trade-off that allows a relatively large maximum number of global iterations to be achieved, when needed, in exchange for a fixed decoding latency.
We conduct a comprehensive study of the iteration statistics and frame error rate (FER) of the LDPC–CPM decoder, and we show how these statistics can be incorporated into a design procedure that accurately predicts FER performance as a function of maximum iterations. We confirm the accuracy of our approach with an in-depth design study of our real-time decoder architecture. Most importantly, our results demonstrate that our real-time decoder architecture can operate with modest complexity and with performance losses in the order of tenths of a dB.
The remainder of this paper is organized as follows. In
Section 2, we lay out the system model and provide reference FER performance results. In
Section 3, we highlight the essential differences between the recent LDPC–CPM schemes and traditional LDPC-based systems. In
Section 4, we provide an in-depth discussion of the iteration statistics of LDPC–CPM decoders. In
Section 5, we develop our real-time decoder architecture and we analyze its performance with a design study in
Section 6, and in
Section 7, we comment on the general applicability of our approach to LDPC-based systems. Finally, we offer concluding remarks in
Section 8.
3. Nonrecursive Transmitter and Receiver Model
In general, because CPMs are a family of nonlinear modulations with recursive memory, they must be treated separately from linear memoryless modulations, such as BPSK, QPSK, etc. However, for the important and special case of MSK-type CPMs, it is possible to take a nonrecursive viewpoint. A “precoder” (such as [
28], Equation (7)) can be applied to MSK-type waveforms to “undo” the inherent CPM recursion, and this results in OQPSK-like behavior. From an information-theoretic perspective, this nonrecursive formulation allows MSK-type waveforms to be paired with LDPC codes that were designed for BPSK [
5].
This special case was exploited a decade ago in [
8] to pair the AR4JA LDPC codes [
27] with ARTM1-NR, and this became the first-ever FEC solution adopted into the IRIG-106 standard [
2] for use in aeronautical telemetry. The transmitter and receiver models for this configuration are shown in
Figure 7, which we refer to as ARTM1-NR. The transmitter model for AR4JA–ARTM1-NR in
Figure 7a is identical to its recursive counterpart in
Figure 1 except for the fact that there is no interleaver, and the nonrecursive modulator is used. However, the receiver model for AR4JA–ARTM1-NR is quite different. Because the nonrecursive waveform does not yield an extrinsic information “gain”, it is not included in the iterative decoding loop in
Figure 7b. The sole purpose of the demodulator is to deliver a soft output (L-values) that can be used by the LDPC decoder without future updates (the soft output demodulator in
Figure 7b is identical to the CPM SISO demodulator in
Figure 3 aside from minor differences in the respective internal trellis diagrams and the elimination of the requirement to preserve
for future updates). Thus, the concept of global iterations is unnecessary, and the LDPC decoder iterates by itself up to a limit of
iterations (or fewer if the parity check passes).
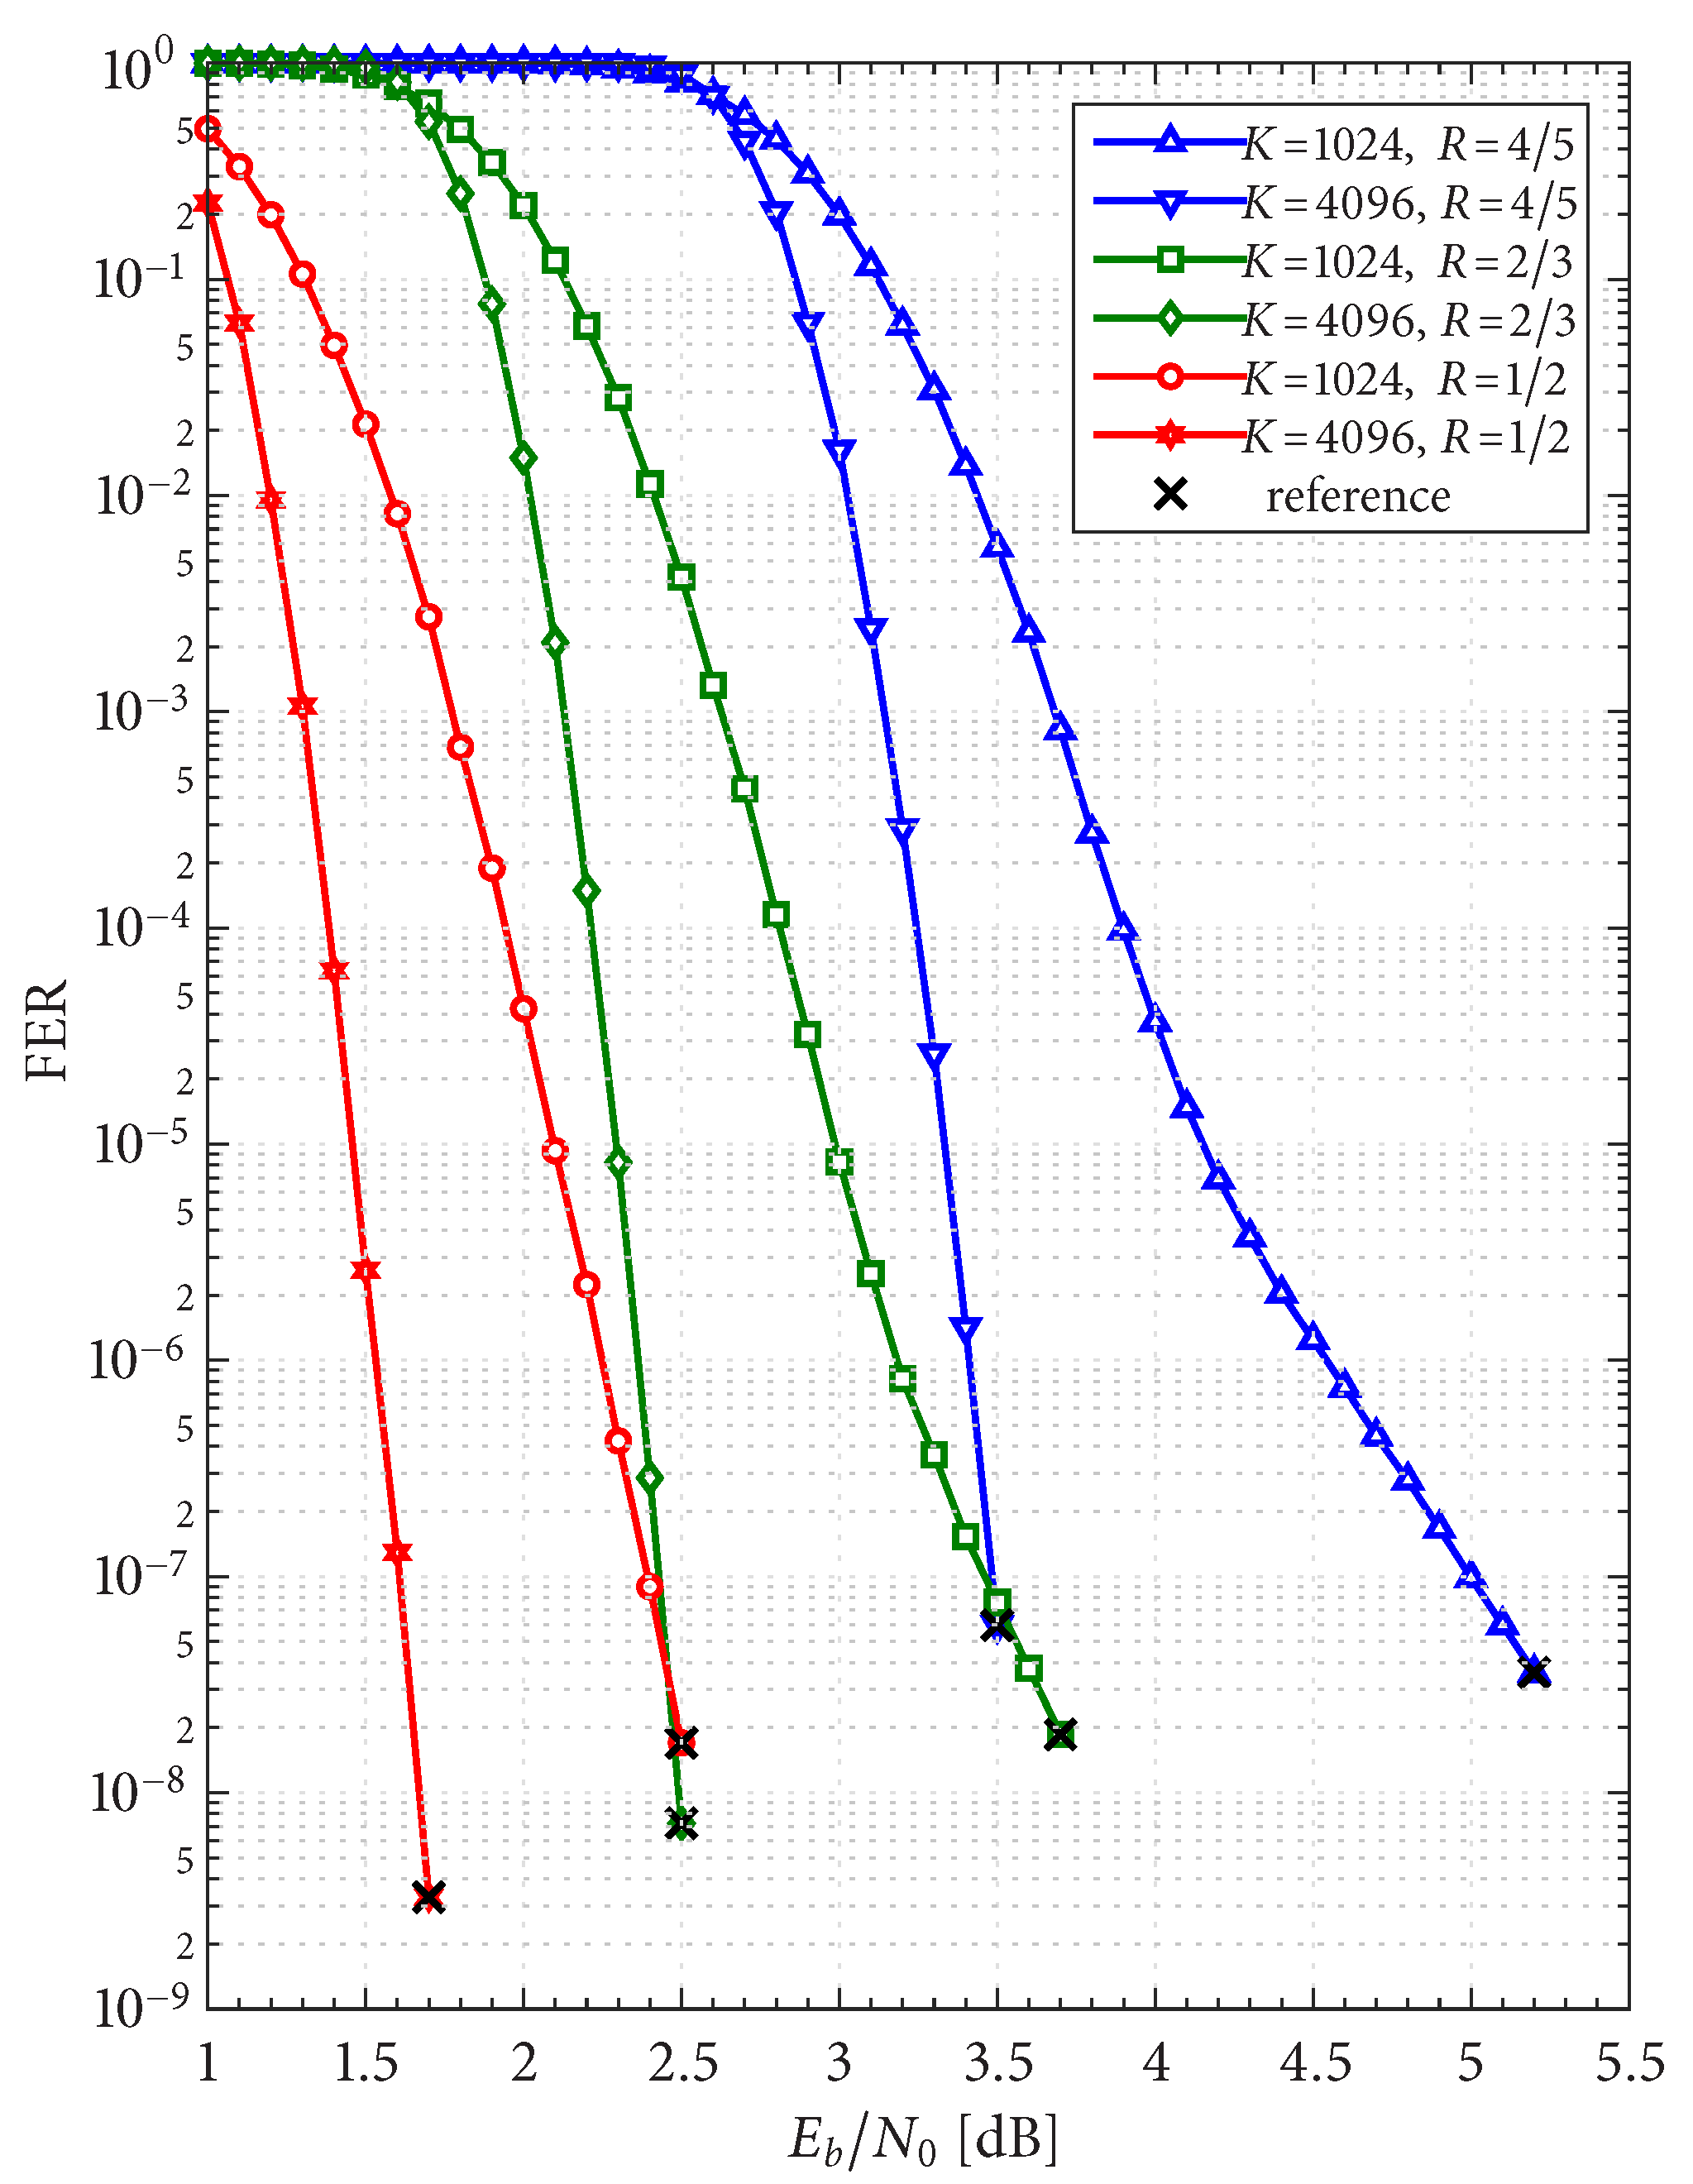
The FER performance of the six AR4JA–ARTM-NR configurations is shown in
Figure 8. While it is clear that the nonrecursive configurations (
Figure 8) outperform the recursive configurations (
Figure 5), as predicted by the analysis in [
5], such an approach does not exist for non-MSK-type CPMs like ARTM0 and ARTM1, which underscores the merits of the LDPC–CPM codes we are studying.
Like any other LDPC-based system, the AR4JA–ARTM1-NR configuration suffers from the large “peak to average” ratio problem. Our numerical results will show that the AR4JA–ARTM1-NR decoder in
Figure 7b typically requires more iterations than its LDPC-CPM counterparts, due to the fact that the LDPC decoder iterates by itself. However, the general behavior is the same, and thus it is compatible with the real-time decoder presented herein.
4. Characterization of the Iterative Behavior of the Receiver
As we have mentioned, LDPC decoders are known to have a high “peak to average” ratio when it comes to the number of iterations needed in order to pass the parity check, cf. e.g., [
26]. We have defined
above and we now define
as the average (i.e.,
expected) number of iterations needed to pass the parity check, which we will demonstrate shortly to be a function of
. We begin with an illustrative example.
Figure 9 shows a scenario where
is such that the parity check passes after a relatively small average of
global iterations. However, on rare occasions (two of which are shown in
Figure 9), a received code word requires a large number of global iterations, which we refer to as an “outlier”. At time index 0 in
Figure 9, the first outlier reaches
without the parity check passing, which results in a decoder failure (frame error). At time index 4 in
Figure 9, the second outlier eventually passes the parity check at an iteration count that is close to but less than
, which results in no frame error.
As
increases, outliers become increasingly rare; however, the difference between a harmless outlier and an error event is determined by the choice of
. Thus, the low-FER performance becomes surprisingly sensitive to the value of
. In
Figure 9, the FER would double if
were set to a slightly smaller value (a FER penalty of 2×), because both outliers would result in a decoder failure. We now develop a simple means of quantifying the FER penalty under the “what if” scenario of varying
. We begin by characterizing the behavior of
.
4.1. Average Global Iterations per Code Word
Figure 10 shows
for all 36 LDPC–CPM design configurations, plus the 6 AR4JA–ARTM1-NR configurations, which is demonstrated to decrease monotonically as
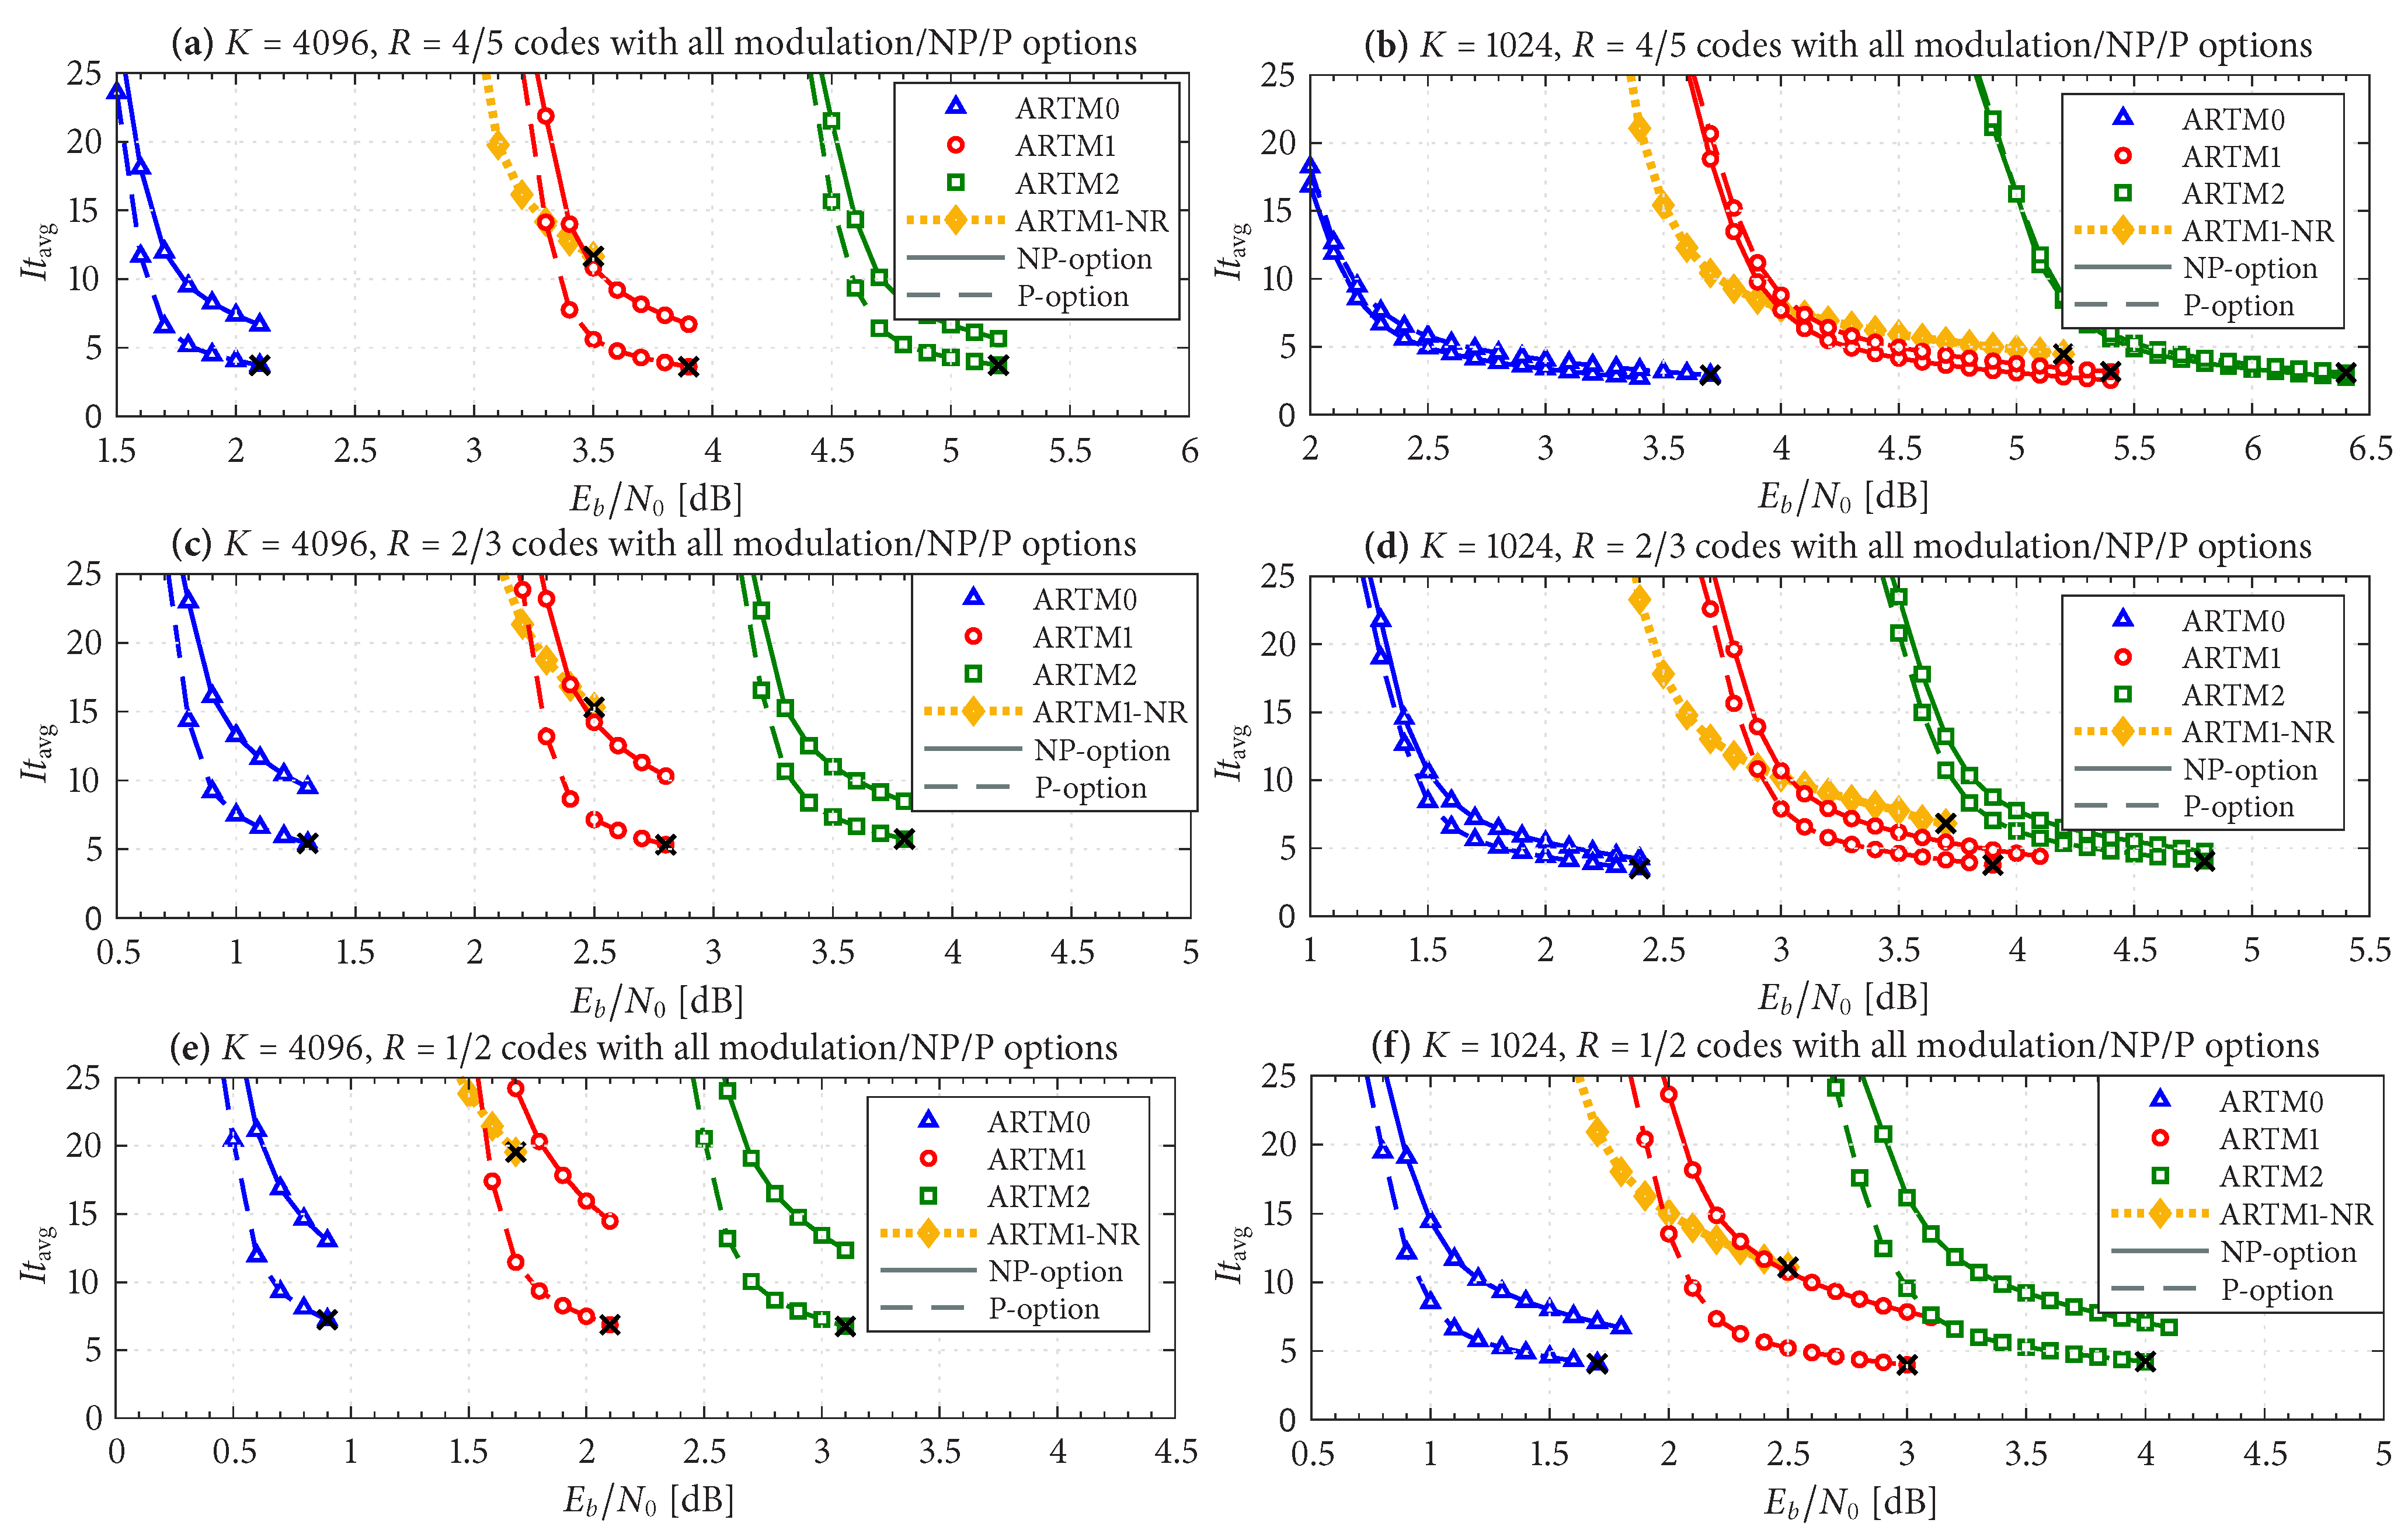
increases (i.e., as FER decreases). The curves are grouped according to block size and code rate, i.e., the
,
configurations of ARTM0, ARTM1, ARTM2, and ARTM1-NR are plotted together in
Figure 10a, and so forth. In each sub-figure, there is a side-by-side comparison of the NP/P options, where we see that using
(P option) can cut
by as much as a half. The motivation for grouping by block size and code rate is that the values of
are comparable across all three modulation types when the code rate, block size,
and (surprisingly) FER are held constant. For example, with the
,
codes [
Figure 10e] for ARTM0, ARTM1, and ARTM2, respectively, we observed
when operating with an FER in the order of
under the NP option. At this same FER operating point for the
,
codes [
Figure 10b], we observed
for the respective modulations under the NP option. In all cases, the ARTM1-NR configurations (orange curves) result in larger values of
, and in some cases, many times the respective P option (red curves).
4.2. Global Iteration Histogram, Shortened Histograms, and FER Penalty Factor
In order to characterize the “peak” iterations, we configure the receiver to maintain a histogram of the global iterations needed to pass the parity check, which is straightforward to implement. We denote this histogram as a length (
sequence of points where the final value (called the
endpoint) is
and the remaining values are
,
.
stores the frequency (i.e.,
count) of observed instances that needed exactly It global iterations to pass the parity check. It is understood that the endpoint,
, contains the frequency (count) of observed decoder failures (frame errors), i.e., instances where the parity check did not pass after
global iterations. The total number of code words observed is
which can be used to normalize the histogram, yielding an empirical PMF that, in turn, can be used to compute
(i.e., the expected value), and so forth. The FER is simply
. A long
reference histogram of length (
can be
shortened to a histogram (
in length, where
, simply by taking the points in the reference histogram that exceed
and
marginalizing them into the shortened endpoint:
The value of
is the same for the reference histogram and any shortened histogram derived from it. The shortened endpoint in (
5) can be viewed as a function (sequence) in its own right, with
serving as the independent variable in the range
; its shape is similar to a complementary cumulative distribution function (CCDF).
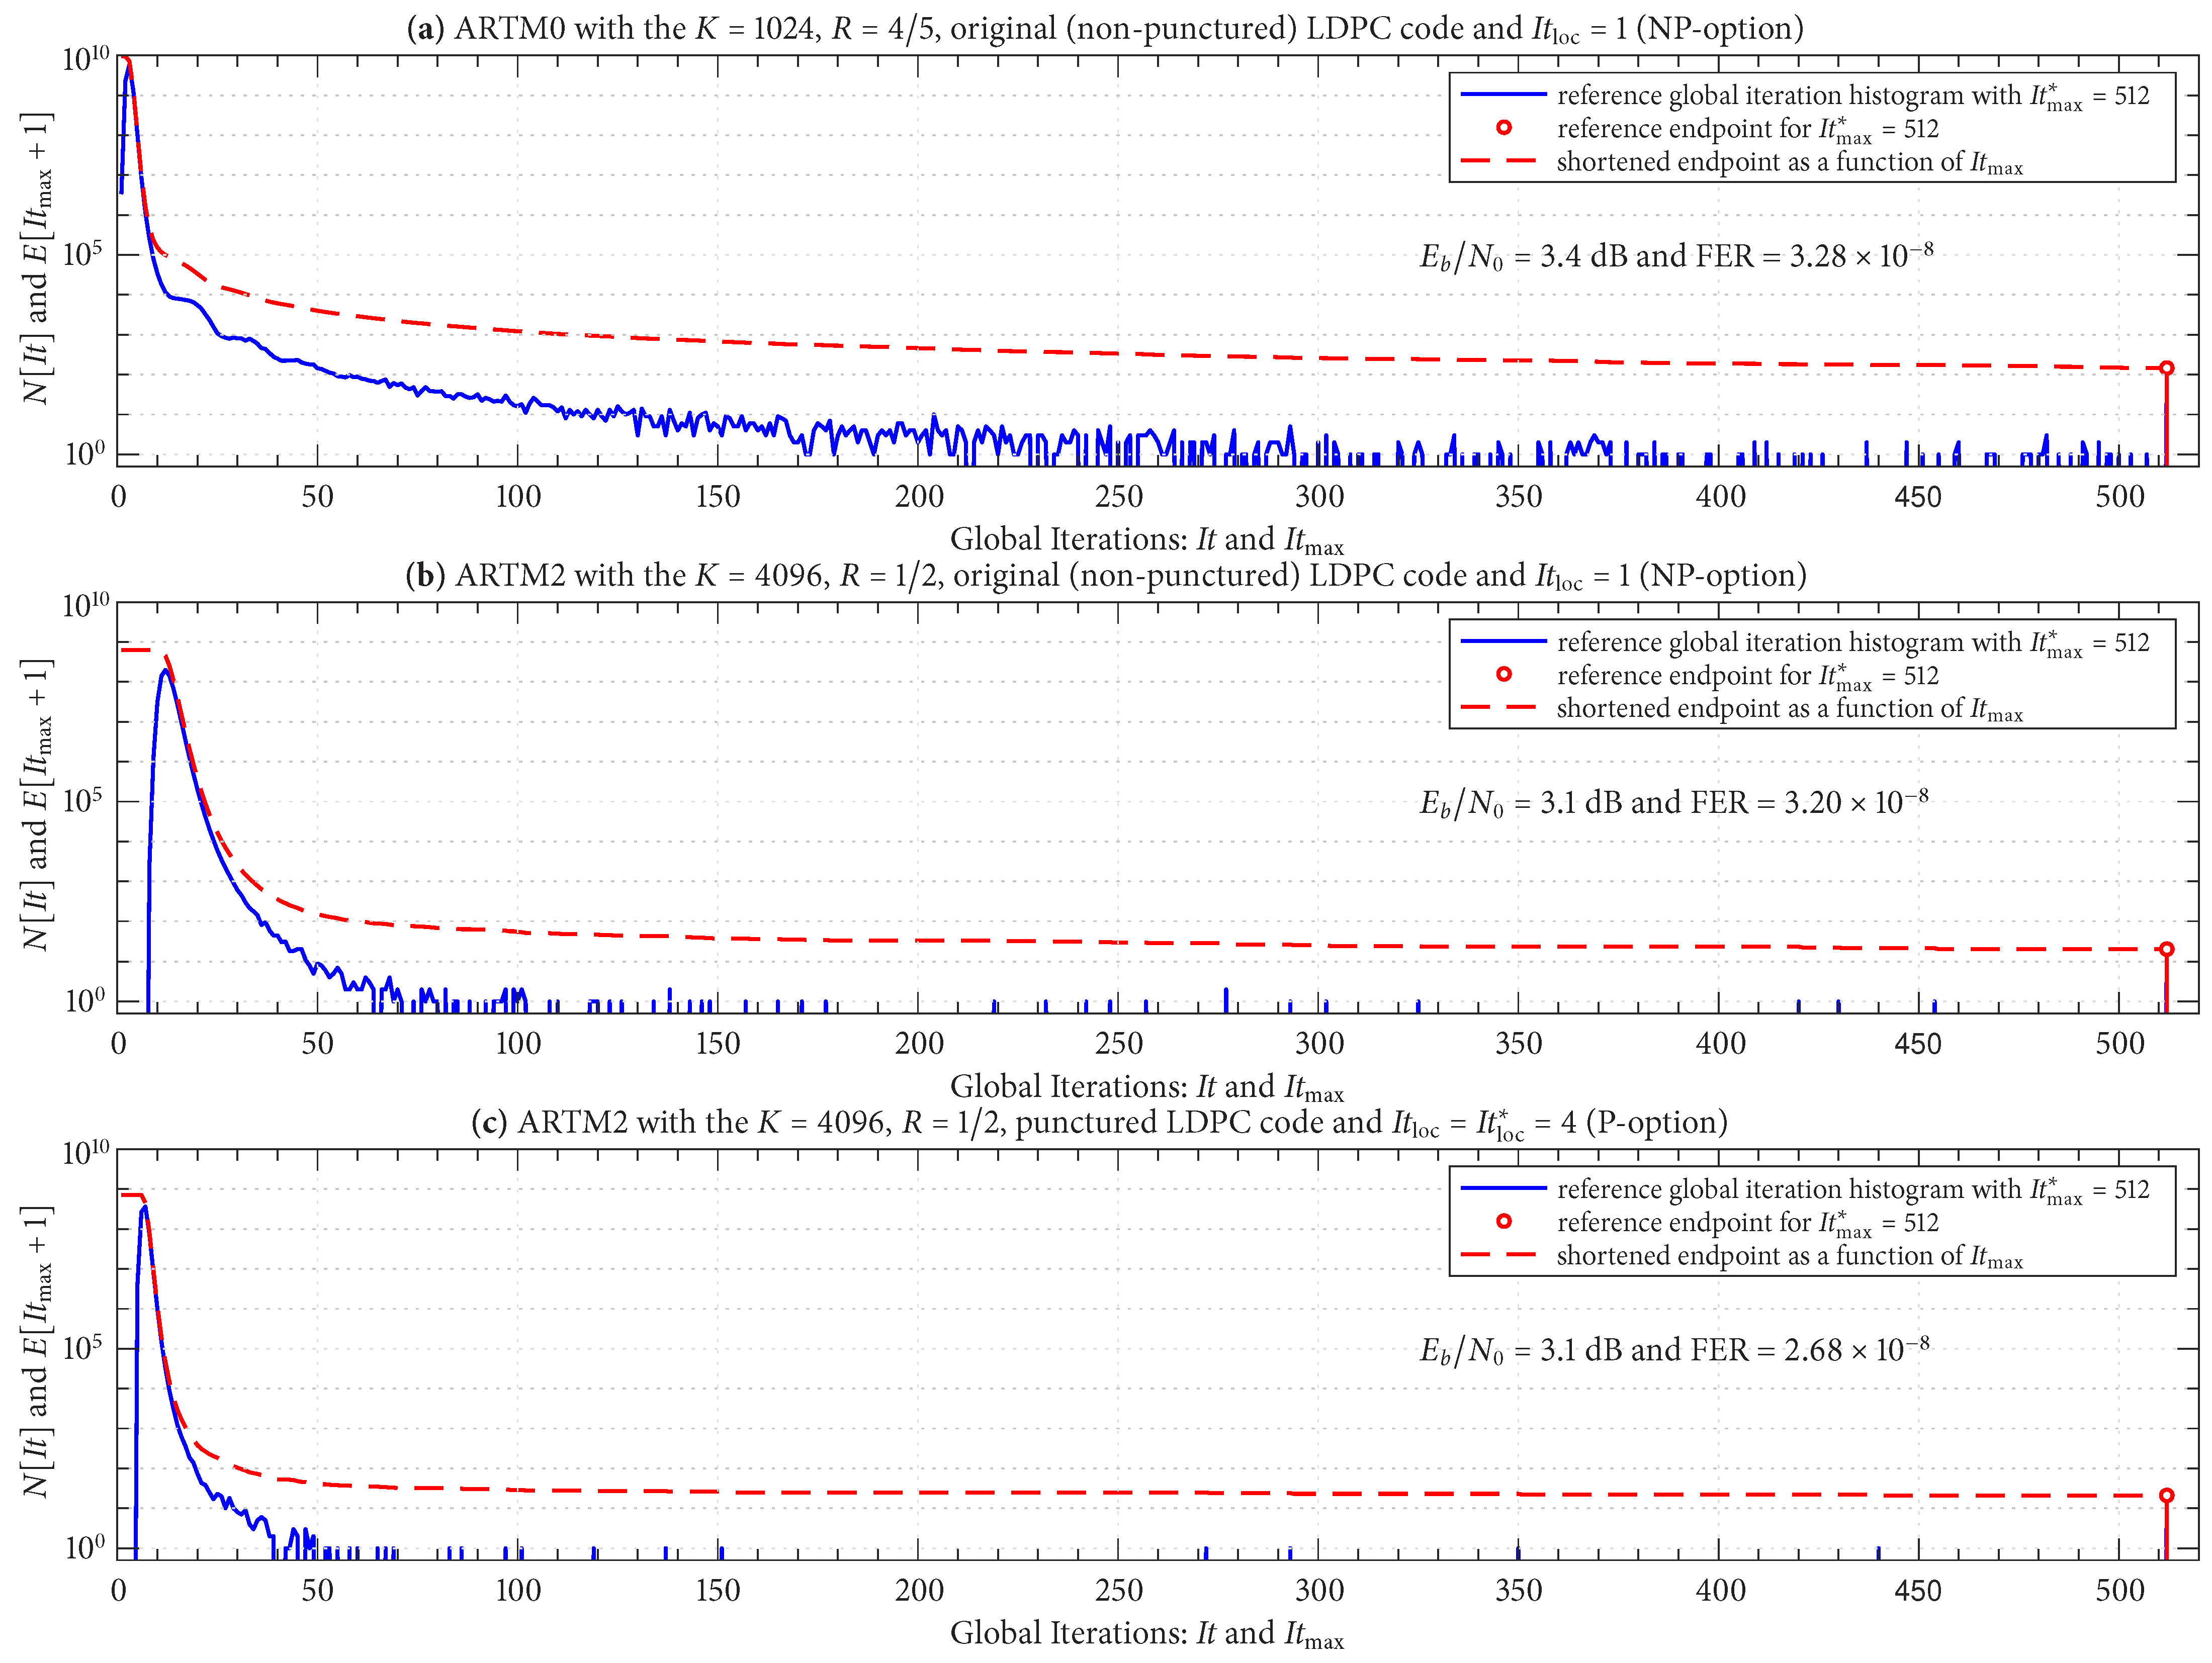
Figure 11 shows reference global iteration histograms (plotted on a log scale) for three LDPC–CPM configurations; the details of each configuration are listed in the title of each sub-figure. The
operating points are also stated and were chosen such that the FER is in the order of
using a reference value of
global iterations. The reference endpoints are shown as red “stems” at the far right (positioned at
). The log scale gives the reference endpoints a relatively noticeable amplitude; nevertheless, it is the case that
for each configuration is in the order of
.
Figure 11 also shows the shortened endpoint in (
5) as a function of
using a red line.
The configuration in
Figure 11a demonstrates that the histogram can have a heavy “upper tail”, which translates to a need for a relatively large
in such cases. The configurations in
Figure 11b,c are identical to each other, except (b) uses an original (non-punctured) code with
(NP option) and (c) uses a punctured code with
(P option). The impact of
is very noticeable in
Figure 11c and results in a distribution with a lower mean [confirmed by
Figure 10e], a lower variance, and an upper tail that is significantly less heavy.
Because this study entails 36 configurations, we consider
Figure 11 to be representative of general trends and omit repetitive results for the other configurations. However, as has already been foreshadowed by the discussion above, the red stems in
Figure 11 represent the FER of the given reference configuration (when normalized by
), and thus the red traces in
Figure 11 represent the variation (penalty) in FER that can be expected under the “what if” scenario of changing the value of
. We formalize this relationship by taking
(the FER as a function of
) and normalizing it by
(the reference FER):
which we refer to as the FER
penalty factor.
As with
, we group the curves for
according to block size and code rate (six groupings), with the FER operating in the order of
.
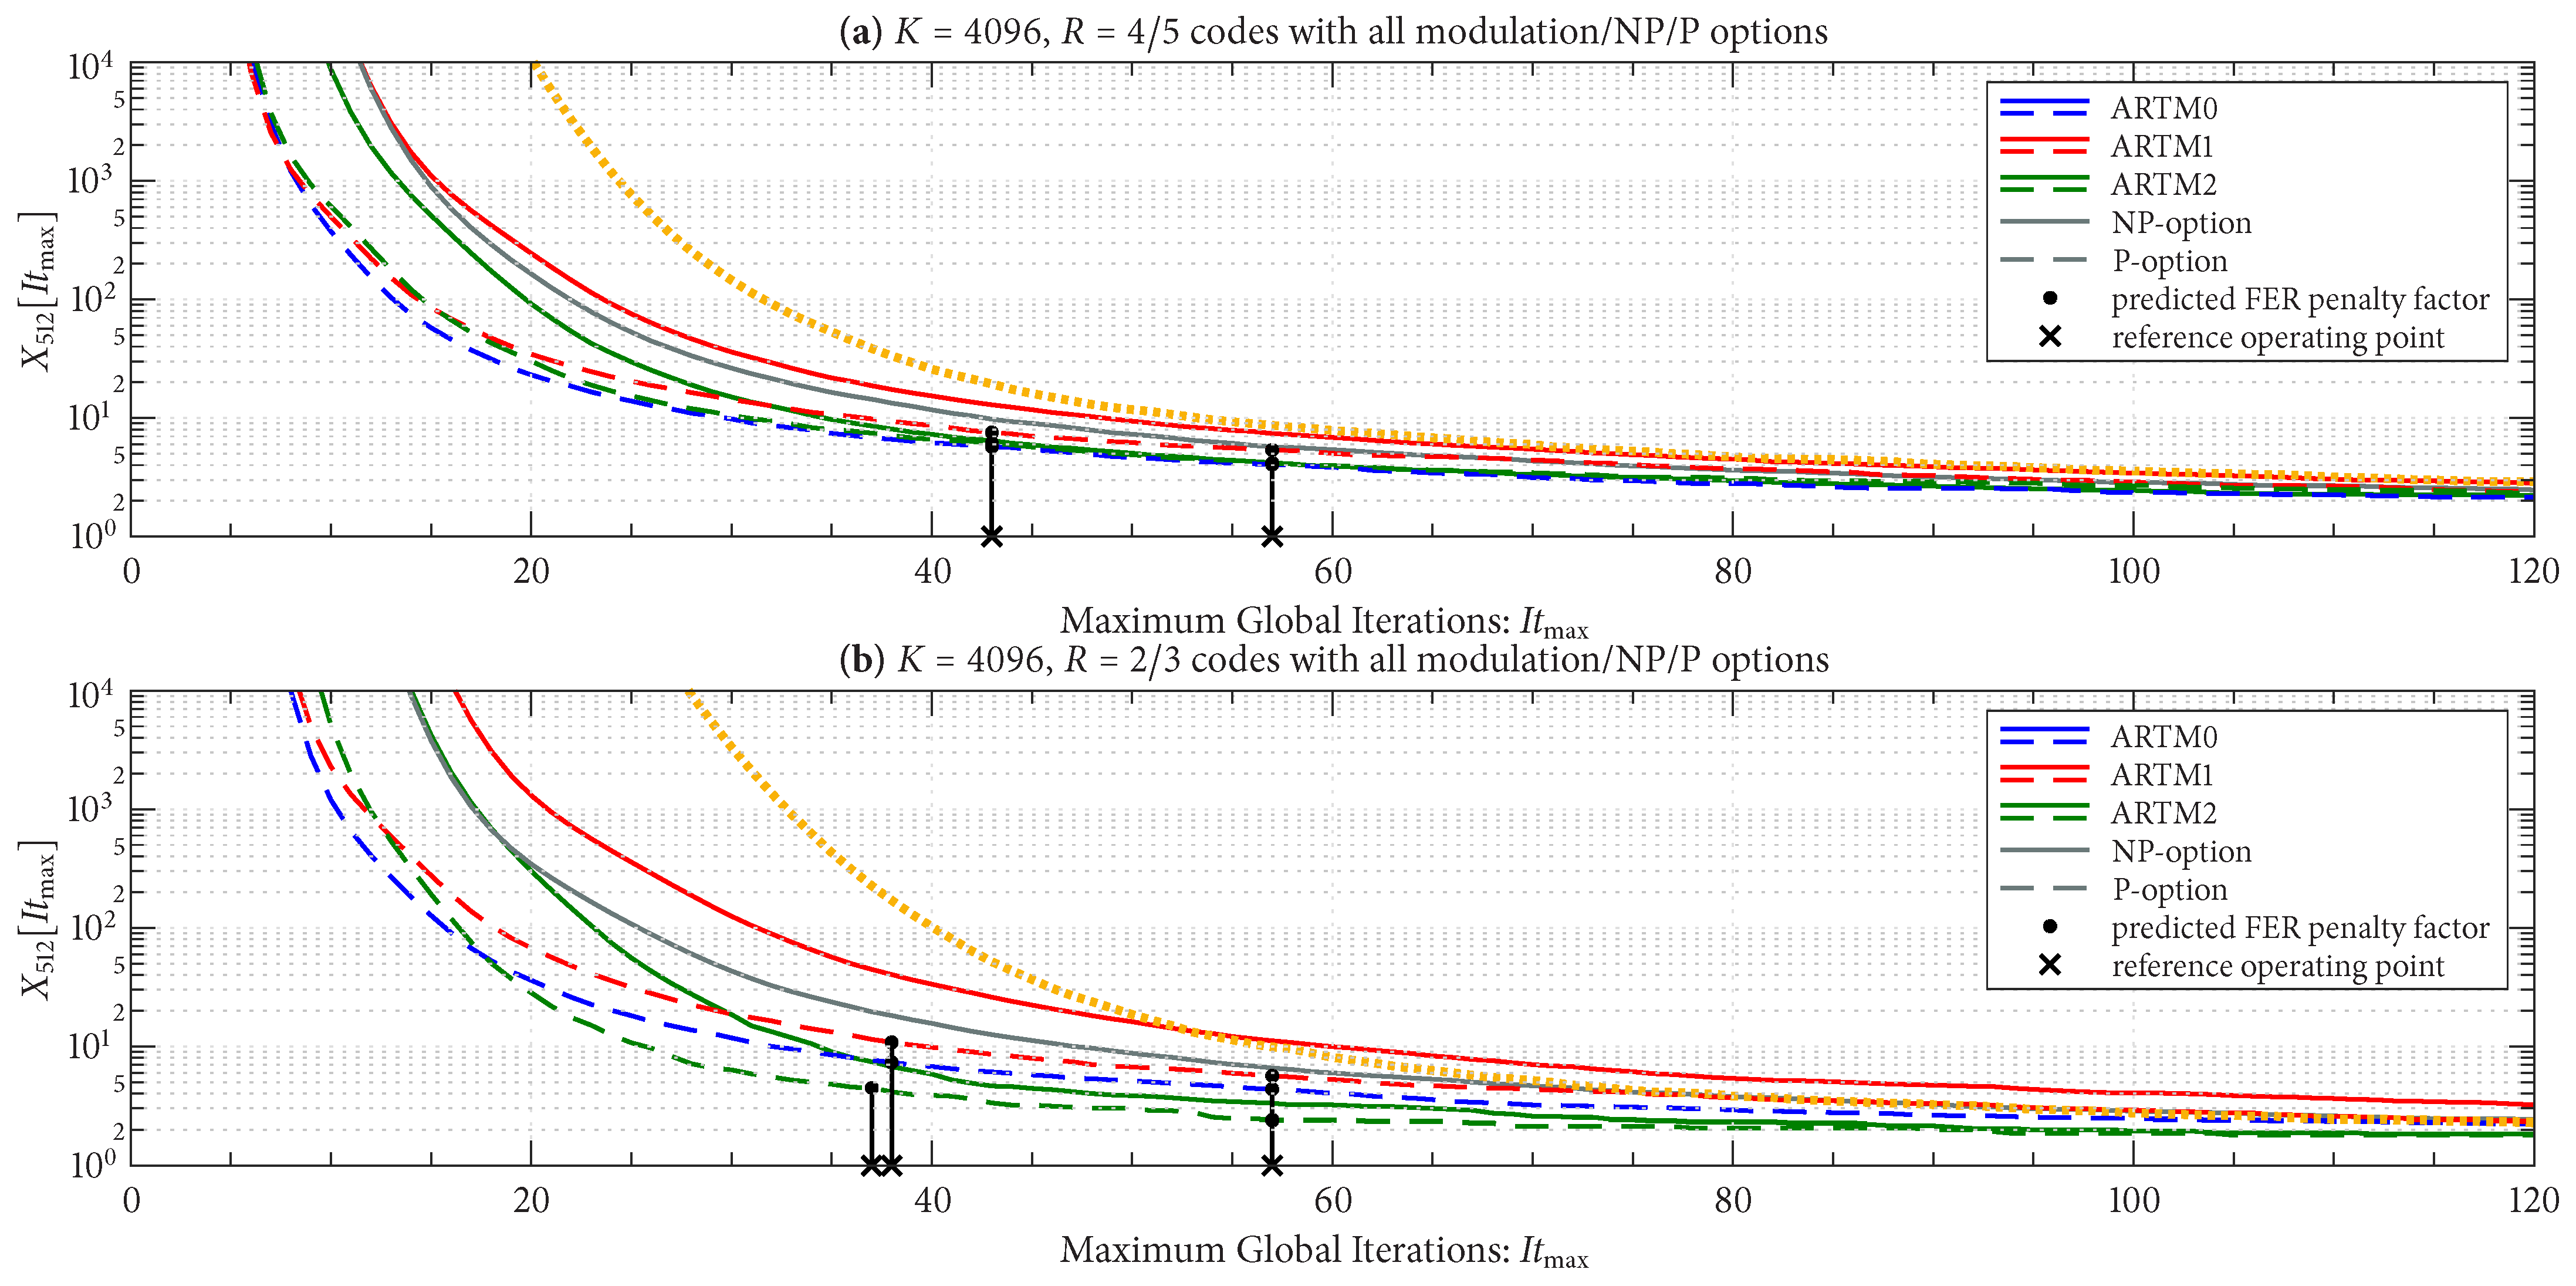
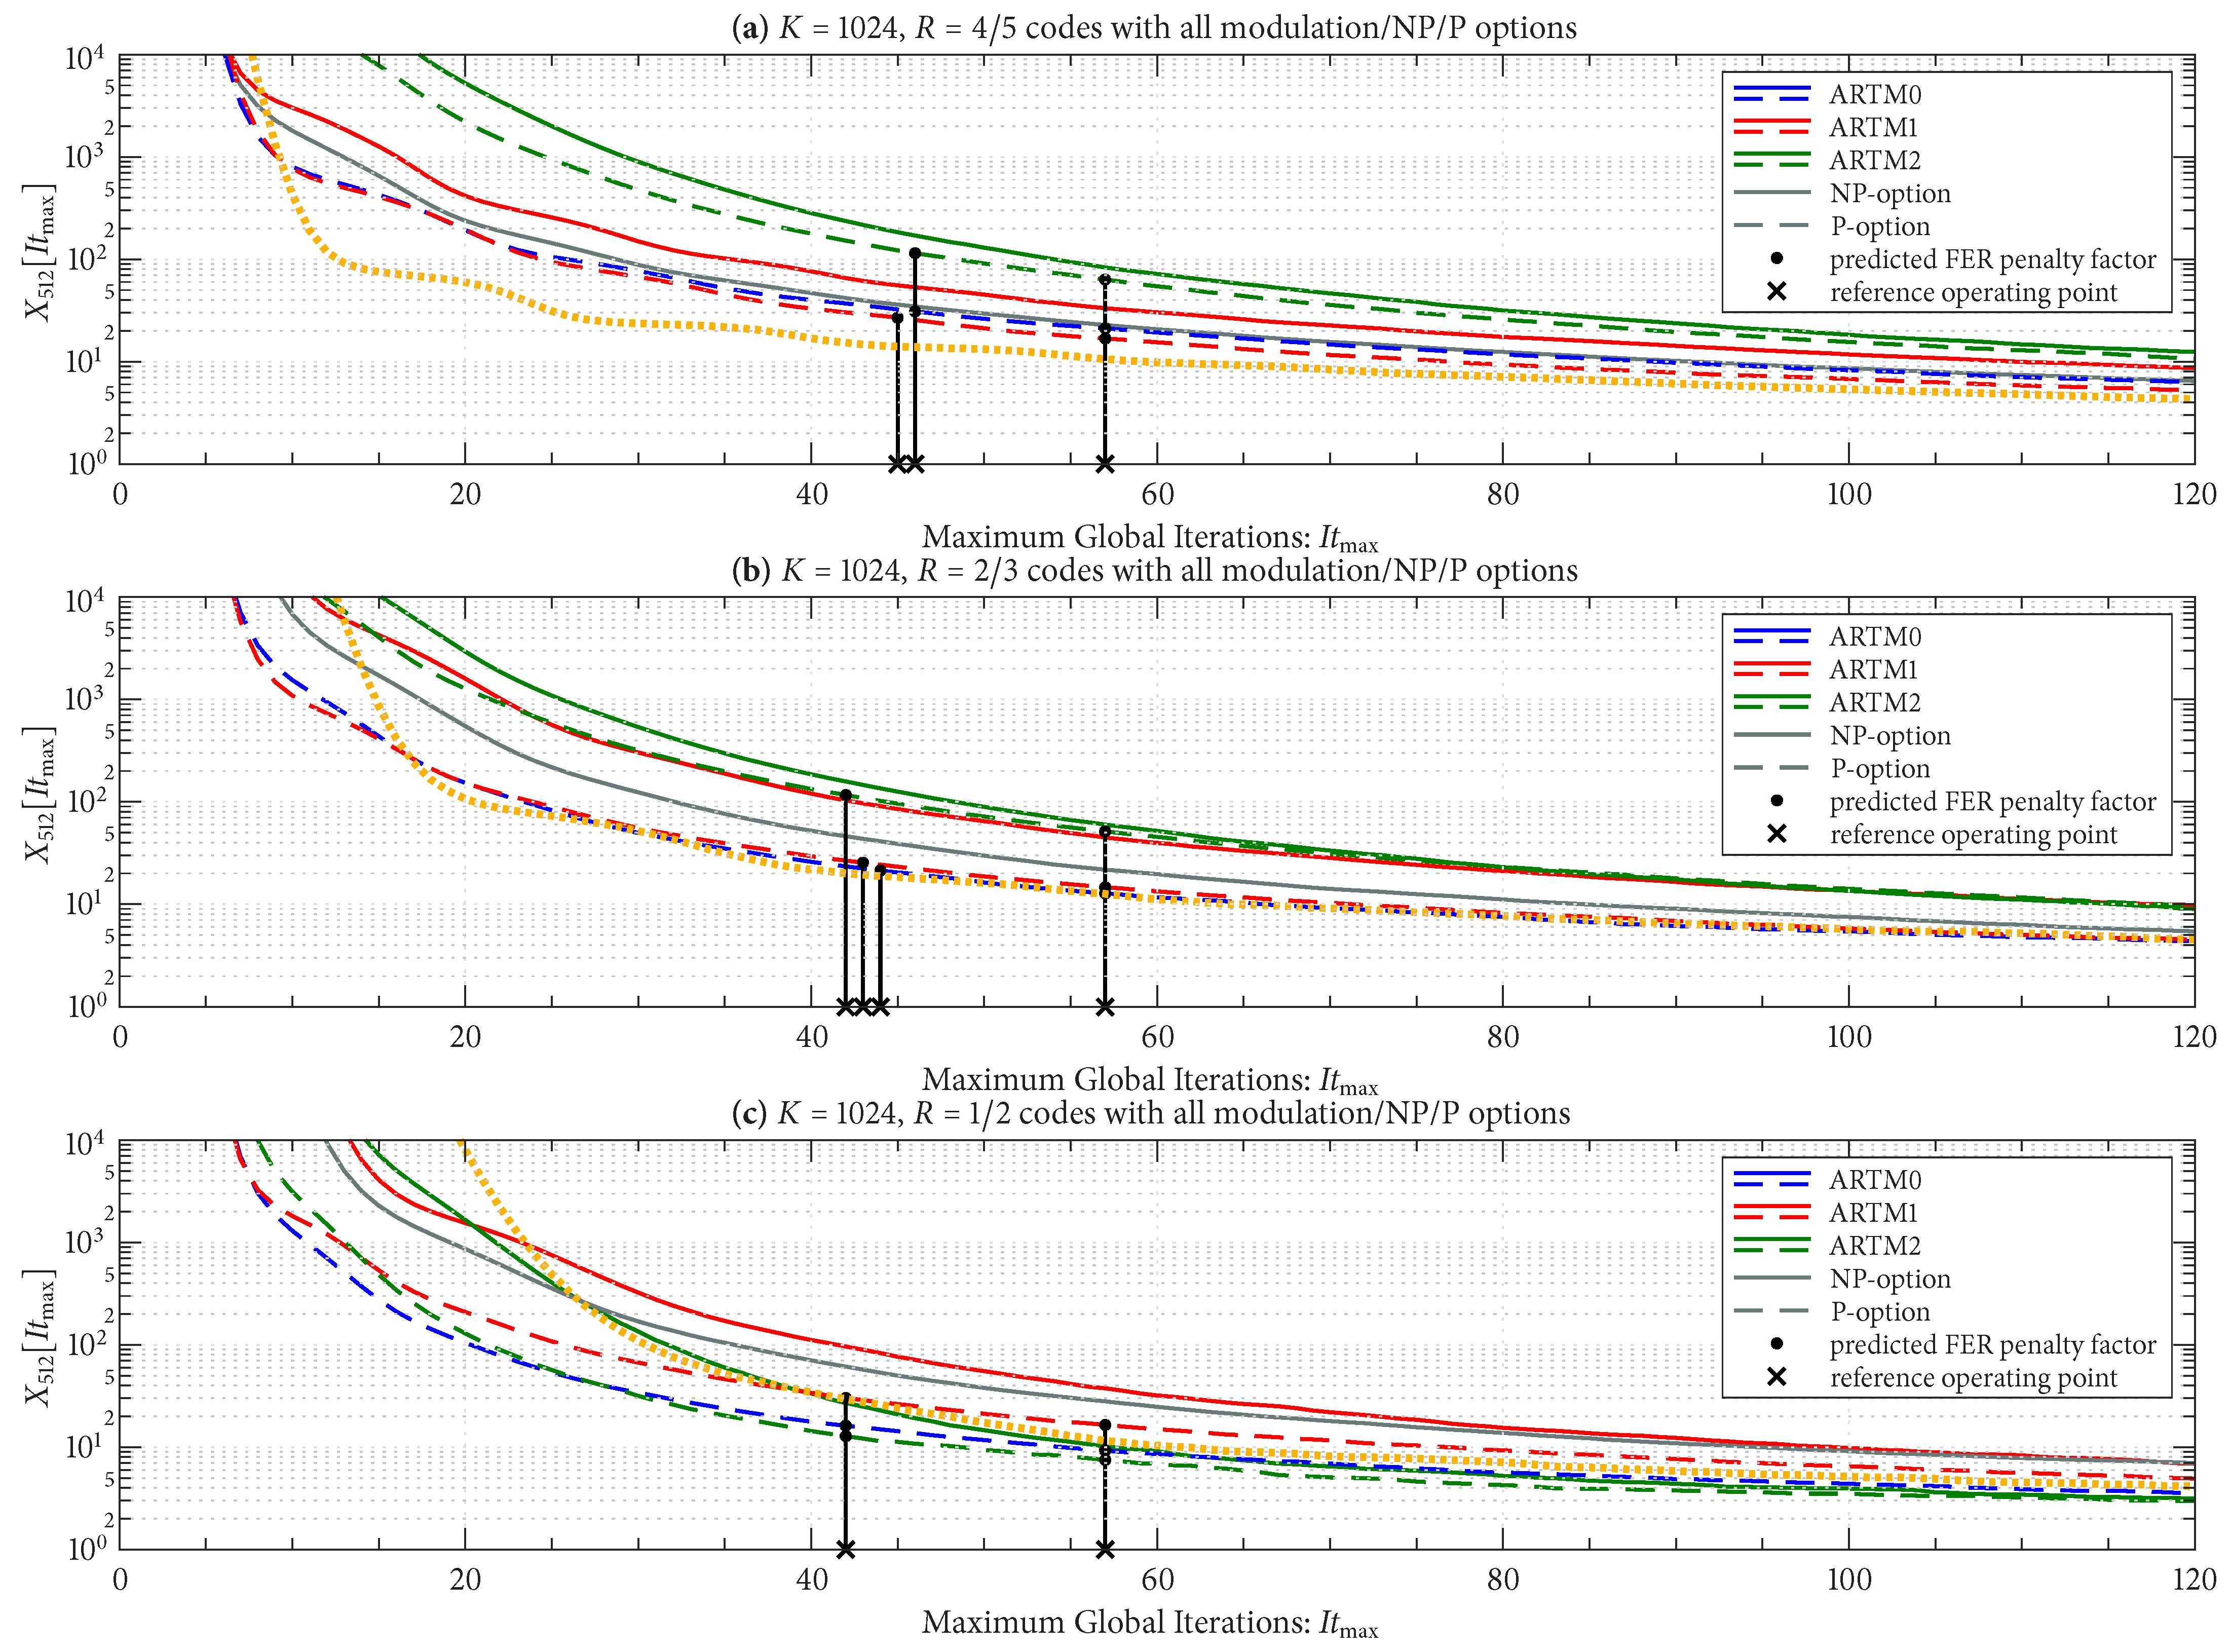
Figure 12 shows
for the three groupings with the longer block length of
, and
Figure 13 does the same for the three groupings with the shorter block length of
, as listed in the title of each sub-figure. There is a side-by-side comparison in each sub-figure of the NP/P options, where we see that the P option has a smaller FER penalty factor for a given
in all cases. The black vertical lines (bars) in
Figure 12 and
Figure 13 pertain to the
design procedure and will be explained shortly.
Figure 12 and
Figure 13 also show the FER penalty factor for the AR4JA-ARTM1-NR configurations (orange curves). In most cases, AR4JA-ARTM1-NR requires larger values of
to achieve a fixed FER penalty factor (compare the orange and red curves).
5. Real-Time Decoder with a Fixed Iteration Budget
5.1. Architecture
We now develop a relatively simple architecture that addresses the high “peak to average” problem with global iterations. The main idea is that if the hardware can accomplish only a limited and fixed “budget” of global iterations during a single code word interval, it is better to distribute these iterations over many code words simultaneously than it is to devote them solely to the current code word. The architecture does not seek to reduce the peak-to-average ratio. Instead, the architecture seeks to focus the hardware complexity on the average decoding requirement. The mechanism that addresses the peak requirement is the introduction of decoding delay (latency). The two primary “costs” of this approach are thus memory (storage) and latency (delay). The processing complexity is held constant (fixed) and the primary design consideration is the trade-off that is introduced between maximum iterations () and latency.
We begin by unraveling the global iterative decoding loop in
Figure 3. A block diagram of the
first global iteration is shown in
Figure 14, which we refer to as the
-iteration. The sole input to this iteration is the signal received from the AWGN channel,
in (
2), and all other a priori inputs are initialized to zero (no information). This is the only instance where
is used, and, likewise, the only instance where the more-complex CPM
demodulator SISO is used. This iteration produces four outputs. The first is the final output of the LDPC decoder, which is the soft MAP output,
, and the pass/fail parity check result. The three other outputs are intermediate results/state variables that will be used in subsequent iterations:
,
, and
.
Figure 15 shows the processing that takes place in all iterations after the first, which we refer to as
-iterations. These iterations accept the three intermediate results/state variables from a previous iteration and produce the same four outputs that were discussed above. The less-complex CPM
decoder SISO is used in the
-iterations. The notation in
Figure 14 and
Figure 15 highlights the “local” iterative loop that is used when
. It is worth pointing out that several parallelization strategies were developed in [
14] that were shown to be very effective in speeding up these iterations.
Figure 16 shows how
Figure 14 and
Figure 15 are connected together to form a “chain” with a fixed length of
iterations. There is a rainbow-colored scheduling block (“S”) situated between each iteration. This block executes a scheduling algorithm and has storage for a set of
decoder buffers,
,
, where
is the number of such buffers; the many colors pictured within the S-block are meant to depict each individual decoder buffer. These data structures contain all state variables that are needed to handle the decoding of a single code word from one global iteration to the next, such as the following:
Storage for and the pass/fail parity check result;
Storage for ;
Storage for ;
Storage for ;
A flag to indicate if the buffer is “active” or not;
An integer index indicating the sequence order of its assigned code word;
A counter indicating the current latency of the assigned code word (i.e., the number of time steps the buffer has been active);
The number of global iterations the buffer has experienced so far (for statistical purposes);
Because each
-iteration involves the state variables contained in a given
, it is thus trivial for the scheduling block to swap in/out a pointer to different
from one
-iteration to the next. Using the parallelization strategies in [
14], the entire chain of
-iterations can be executed quite rapidly, i.e., it is likely the case that the entire chain of
-iterations can be executed in the same amount of time as one
-iteration. A given buffer is allowed to be active for maximum latency (count) of
time steps (i.e., complete executions of the fixed-length chain in
Figure 16), at which point a decoder failure (frame error) is declared. We have introduced
and
as distinct parameters; however, going forward, we will assume that the amount decoder memory is the same as the maximum latency, i.e.,
.
5.2. Scheduling Scheme with -Mode = TRUE
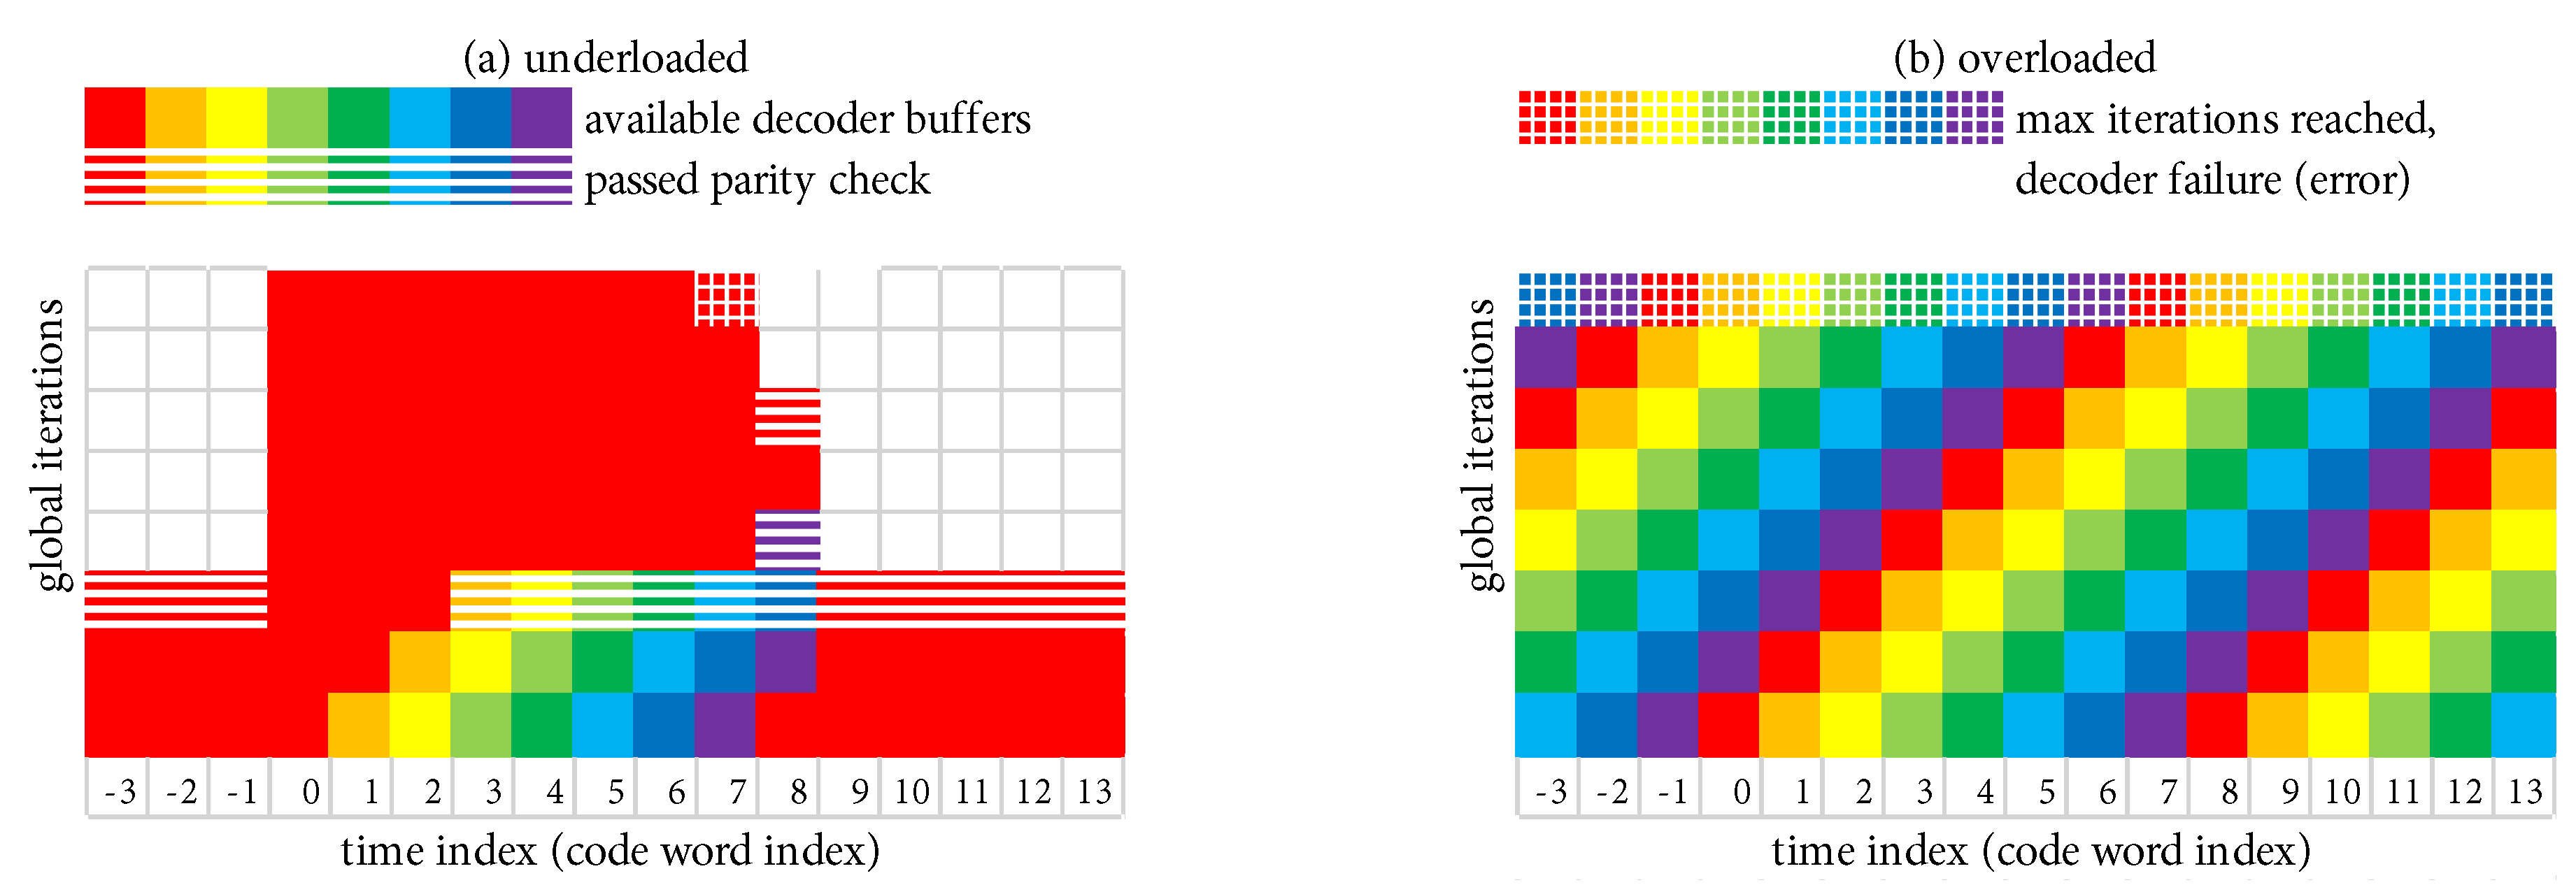
Figure 17a,b show the execution of a simple example scheduling scheme that is operating, respectively, in
underloaded and
overloaded conditions. The example scheduling scheme consists of the system in
Figure 16 configured to perform a total of
global iterations during each time index, where the scheduling block has storage for
decoder buffers, and the maximum allowable decoding latency is
code words. The simple scheduling strategy is that each active decoder buffer receives one iteration at each time index, after which the excess/unused iterations are given to the “oldest” code word. At least one decoder buffer must be inactive at the beginning of each time index in order to receive the output of the
-iteration. We refer to this scheduling strategy as
-mode = TRUE because each active buffer receives at least one iteration each time (this terminology will be given more context shortly).
Under the favorable conditions present in
Figure 17a,
is such that
(in fact,
), which results in the decoder being underloaded on average. The code word at time index 0 is an “outlier”. During the window of length
where the outlier is allowed to be active (time indexes 0–7), three additional decoder buffers are activated to handle the new code words as they arrive. During this window, after each active decoder receives its single iteration, the excess/unused iterations are given to the outlier. This permits the outlier to receive a total of 46 global iterations until a decoder failure (frame error) occurs when
is reached at time index 7 (i.e., there are exactly 46 red-shaded squares during time indexes 0–7). Once this occurs, the system quickly “catches up” and returns to a state where only one decoder buffer is active. We emphasize the fact that the processing complexity remains fixed at
iterations per time step.
Under the poor conditions present in
Figure 17b,
is such that
, which results in the decoder being overloaded on average. Each code word is an outlier in the sense that they all require more iterations than can be budgeted. All
decoder buffers are put to use to handle the new code words as they arrive. The “oldest” decoder buffer is forced to fail when
is reached after it has received only
global iterations.
Algorithm 1 provides pseudocode for the simple scheduling scheme we have used in the above examples. The receiver maintains a master time (sequence) index, k, for the code words as they arrive. When the k-th code word arrives, we assume that at least one decoder buffer is inactive and available for the -iteration, which is identified by the index . When the decoding iterations are completed, the receiver outputs the code word , which has a fixed latency (delay) of code words. Therefore, the receiver always commences a decoding operation each time a code word arrives and it always outputs a decoded code word. The following variables are required by the algorithm and are updated as needed: is the maximum latency count of any active buffer and is the index of this buffer, where indicates there are no buffers currently active; and is the index of a buffer that is currently inactive.
| Algorithm 1 Example real-time global iteration scheduling scheme. |
- 1:
Input: Received signal belonging to the k-th LDPC code word in a transmitted sequence. - 2:
Assumptions: k is the master time (sequence) index, indicates an inactive buffer, -mode is defined. - 3:
Initialization: Increment k, activate , and set . Perform the -iteration and possibly one -iteration per active buffer: - 4:
for do - 5:
if is Active then - 6:
Increment ’s latency counter; - 7:
if then - 8:
Perform the -iteration using and filling ; - 9:
Increment ; increment ’s iteration counter; deactivate if parity check passes; - 10:
else if -mode == TRUE then - 11:
Perform a -iteration drawing from and updating ; - 12:
Increment ; increment ’s iteration counter; deactivate if parity check passes; - 13:
end if - 14:
end if - 15:
end for Allocate Remaining -Iterations to Oldest Buffer: - 16:
for do - 17:
Identify ; - 18:
if then - 19:
Stop iterations; - 20:
else - 21:
Perform a -iteration using ; - 22:
Increment ; increment ’s iteration counter; deactivate if parity check passes; - 23:
end if - 24:
end for Ensure at Least One Buffer is Available for Next Time: - 25:
Identify , , and ; - 26:
if then - 27:
Declare a decoder failure; - 28:
Deactivate ; - 29:
Set ; - 30:
else - 31:
Set ; - 32:
end if - 33:
Output , which was filled somewhere above when its buffer was deactivated;
|
The process of “activating” a decoder buffer for the -iteration consists of initializing the and arrays to zero; setting the active flag; resetting the latency and iteration counters to zero; and saving the master sequence index k.
The process of “deactivating” a decoder buffer consists of copying from the internal memory of the buffer to the receiver output stream, in proper sequence order, as indicated by the stored sequence index k; likewise, copying the accompanying parity check result and global iteration count in their proper sequence orders; and clearing the active flag.
5.3. Scheduling Scheme with -Mode = FALSE
We now consider a variation of this example scheduling scheme, where the -iteration takes place as before, but all-iterations are reserved only for the “oldest” code word. Because -iterations are withheld from the other active buffers, we refer to this variation as -mode = FALSE. The pseudocode in Algorithm 1 includes the notation necessary for -mode = TRUE/FALSE.
Figure 18a,b show the execution of
-mode = FALSE, respectively, in
underloaded and
overloaded conditions. We select
and
as before. When overloaded with
-mode = FALSE in
Figure 18b, each code word receives only
global iterations, as was the case with
-mode = TRUE.
When
-mode = FALSE is underloaded in
Figure 18a, the outlier at time index 0 is able to receive a total of 57 global iterations before
is reached at time index 7 (i.e., there are exactly 57 red-shaded squares during time indexes 0–7); this is an increase of 11 global iterations over
-mode = TRUE. Although the decoder has fallen further behind with
-mode = FALSE, the first code word that must be decoded in the “catch up” phase is still allowed its full budget of
global iterations. Using Bayes’ rule
, the probability of the joint event of an outlier exceeding
iterations, immediately followed by a code word exceeding
iterations, is
. Thus, the probability of an outlier error (i.e., the original FER) plus the probability that such an error is immediately followed by a second error is
. The benefit of additional global iterations (11 in our example) is embodied in a reduced value of
. The disadvantage is embodied in the potential FER increase due to the factor
. In our numerical results in
Section 6, we will show that the benefit of
-mode = FALSE outweighs the disadvantage.
5.4. Expected Minimum and Maximum Iterations of Example Scheduling Scheme
As discussed above, when the system is overloaded, i.e., , each code word will receive at least a minimum—and likely no more than a maximum—of iterations. This is because it is highly unlikely that a significant number of unused iterations will become available for use by other code words.
The probability that the system is overloaded (
) is of great interest, but this probability is difficult to quantify in precise terms. However, in our extensive numerical results, we have observed
when
exceeds
, and we have also observed
when
falls roughly 0.5 iterations below
. Thus, the threshold that indicates whether or not the system is overloaded is essentially
which is what we have used in the above discussion. A similar observation was made in ([
26],
Figure 8).
When the system is underloaded, each code word is still budgeted a
minimum of
iterations, but any of these that are not needed can be transferred to another code word. The
maximum number of iterations,
, is not fixed in this case, but rather it fluctuates depending on
,
, and the receiver operating conditions as characterized by
. Because outliers are rare in the underloaded scenario, the typical steady-state assumption is that only one decoder buffer is active, as shown for the beginning and ending time indexes in
Figure 17a and
Figure 18a.
For
-mode = FALSE, the large red-shaded region in
Figure 18a belonging to the outlier (during time indexes 0–7) is easily quantified in terms of
and
. Thus, when
-mode = FALSE, the
expected maximum number of iterations when the system is underloaded is described by the formula
which yields a value of
iterations when fed the parameters of the example in
Figure 18.
For
-mode = TRUE, the irregular red-shaded region in
Figure 17a belonging to the outlier (during time indexes 0–7) can be described with several terms. When the outlier arrives at time index 0 in
Figure 17a, there is a “transient” period where additional decoder buffers are activated (time indexes 0–2); this is a rectangular region that is “tall and skinny” but also missing a triangle at the bottom. If
is sufficiently long (as it is in
Figure 17), there is an additional red-shaded “steady-state” rectangular-shaped region (time indexes 3–7 in
Figure 17). Thus, when
-mode = TRUE, the
expected maximum number of iterations when the system is underloaded is described by the formula
where the various terms in (
9) quantify the transient and (possibly) steady-state behavior just described. This formula yields a value of
iterations when fed with the parameters of the example in
Figure 17.
6. Design Study for LDPC–CPM and Final FER Performance
We now provide examples of a design procedure that is based on the above discussion. This procedure results in a real-time decoder architecture where the maximum number of iterations that need to be performed during a single code word interval has a fixed (and modest) value of , the maximum decoding latency is fixed at code words, but a relatively large expected maximum value of iterations can be allocated to a given code word if needed.
As before, we set our real-time decoder to have a hardware complexity with a fixed budget of global iterations per code word, and we select the maximum decoding latency to be code words (which also determines ).
Given these design constraints, the real-time decoder (when it is underloaded) can achieve an expected maximum number of global iterations as predicted by (
8) or (
9), depending on the selection of
-mode. The expected value of
, in turn, results in a predicted FER penalty factor of
, relative to a reference operating point. We focus on the P option (puncturing, with
local iterations) because of its many demonstrated advantages, including effectiveness with smaller (constrained) values of
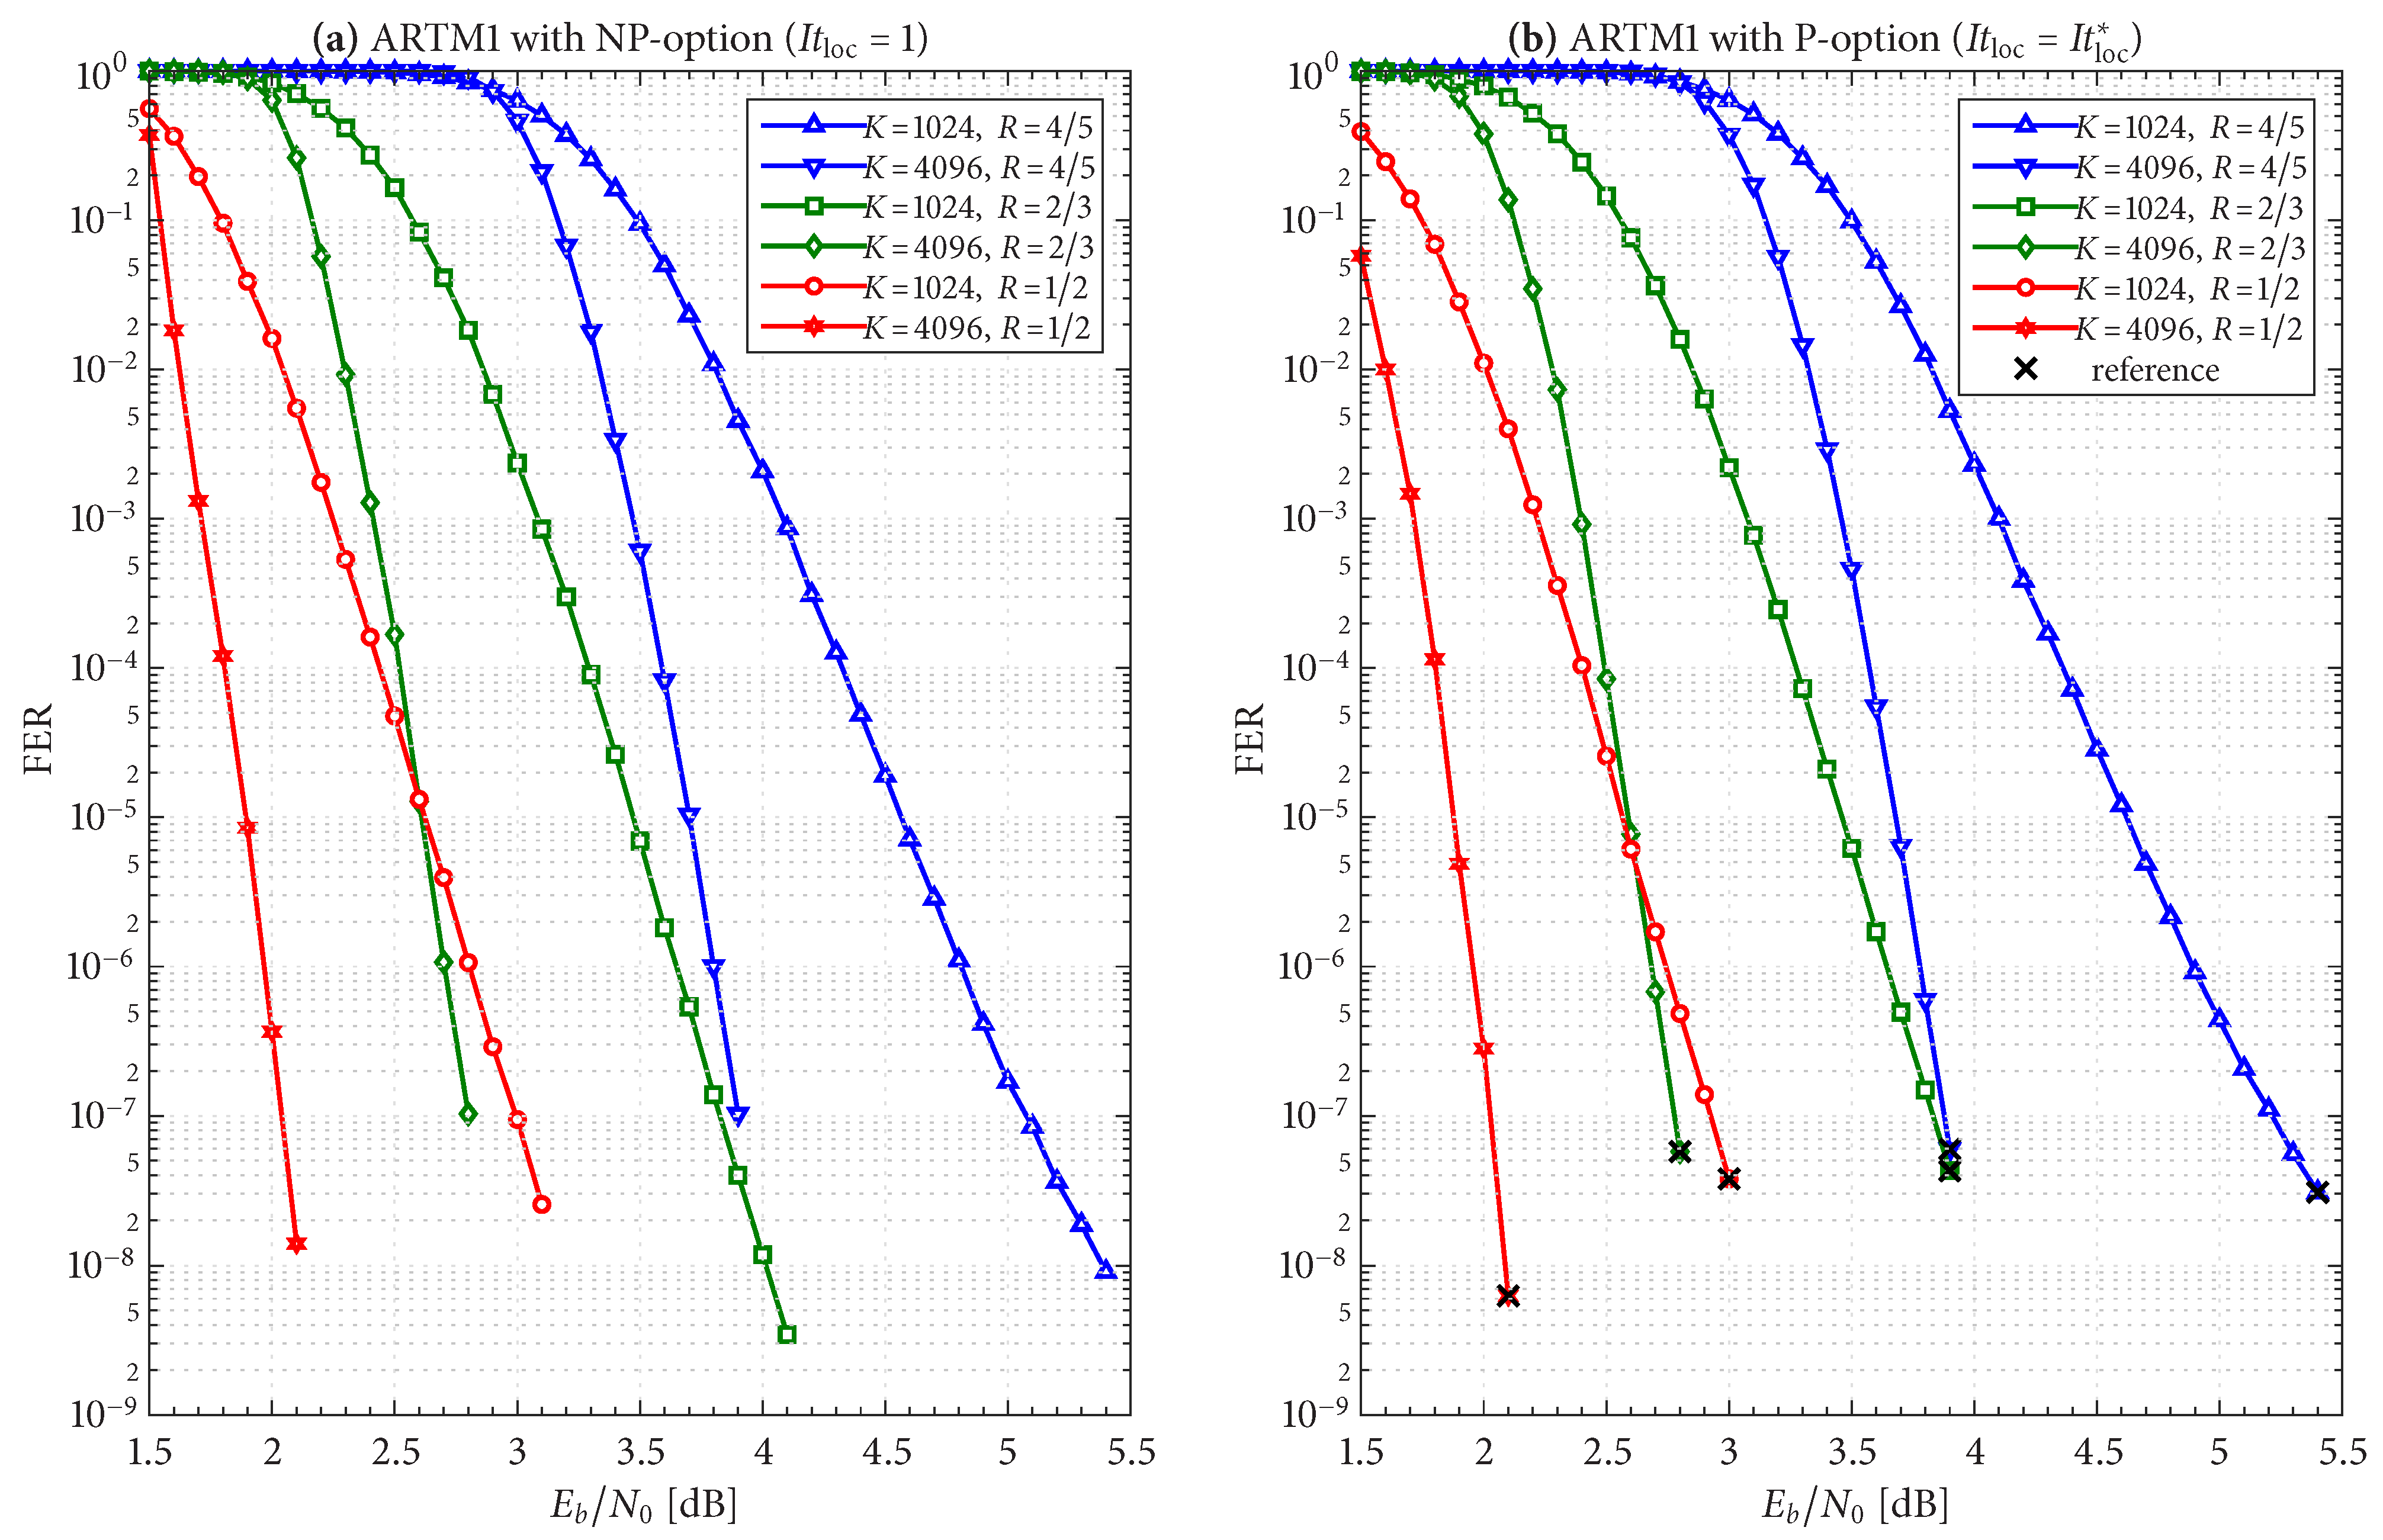
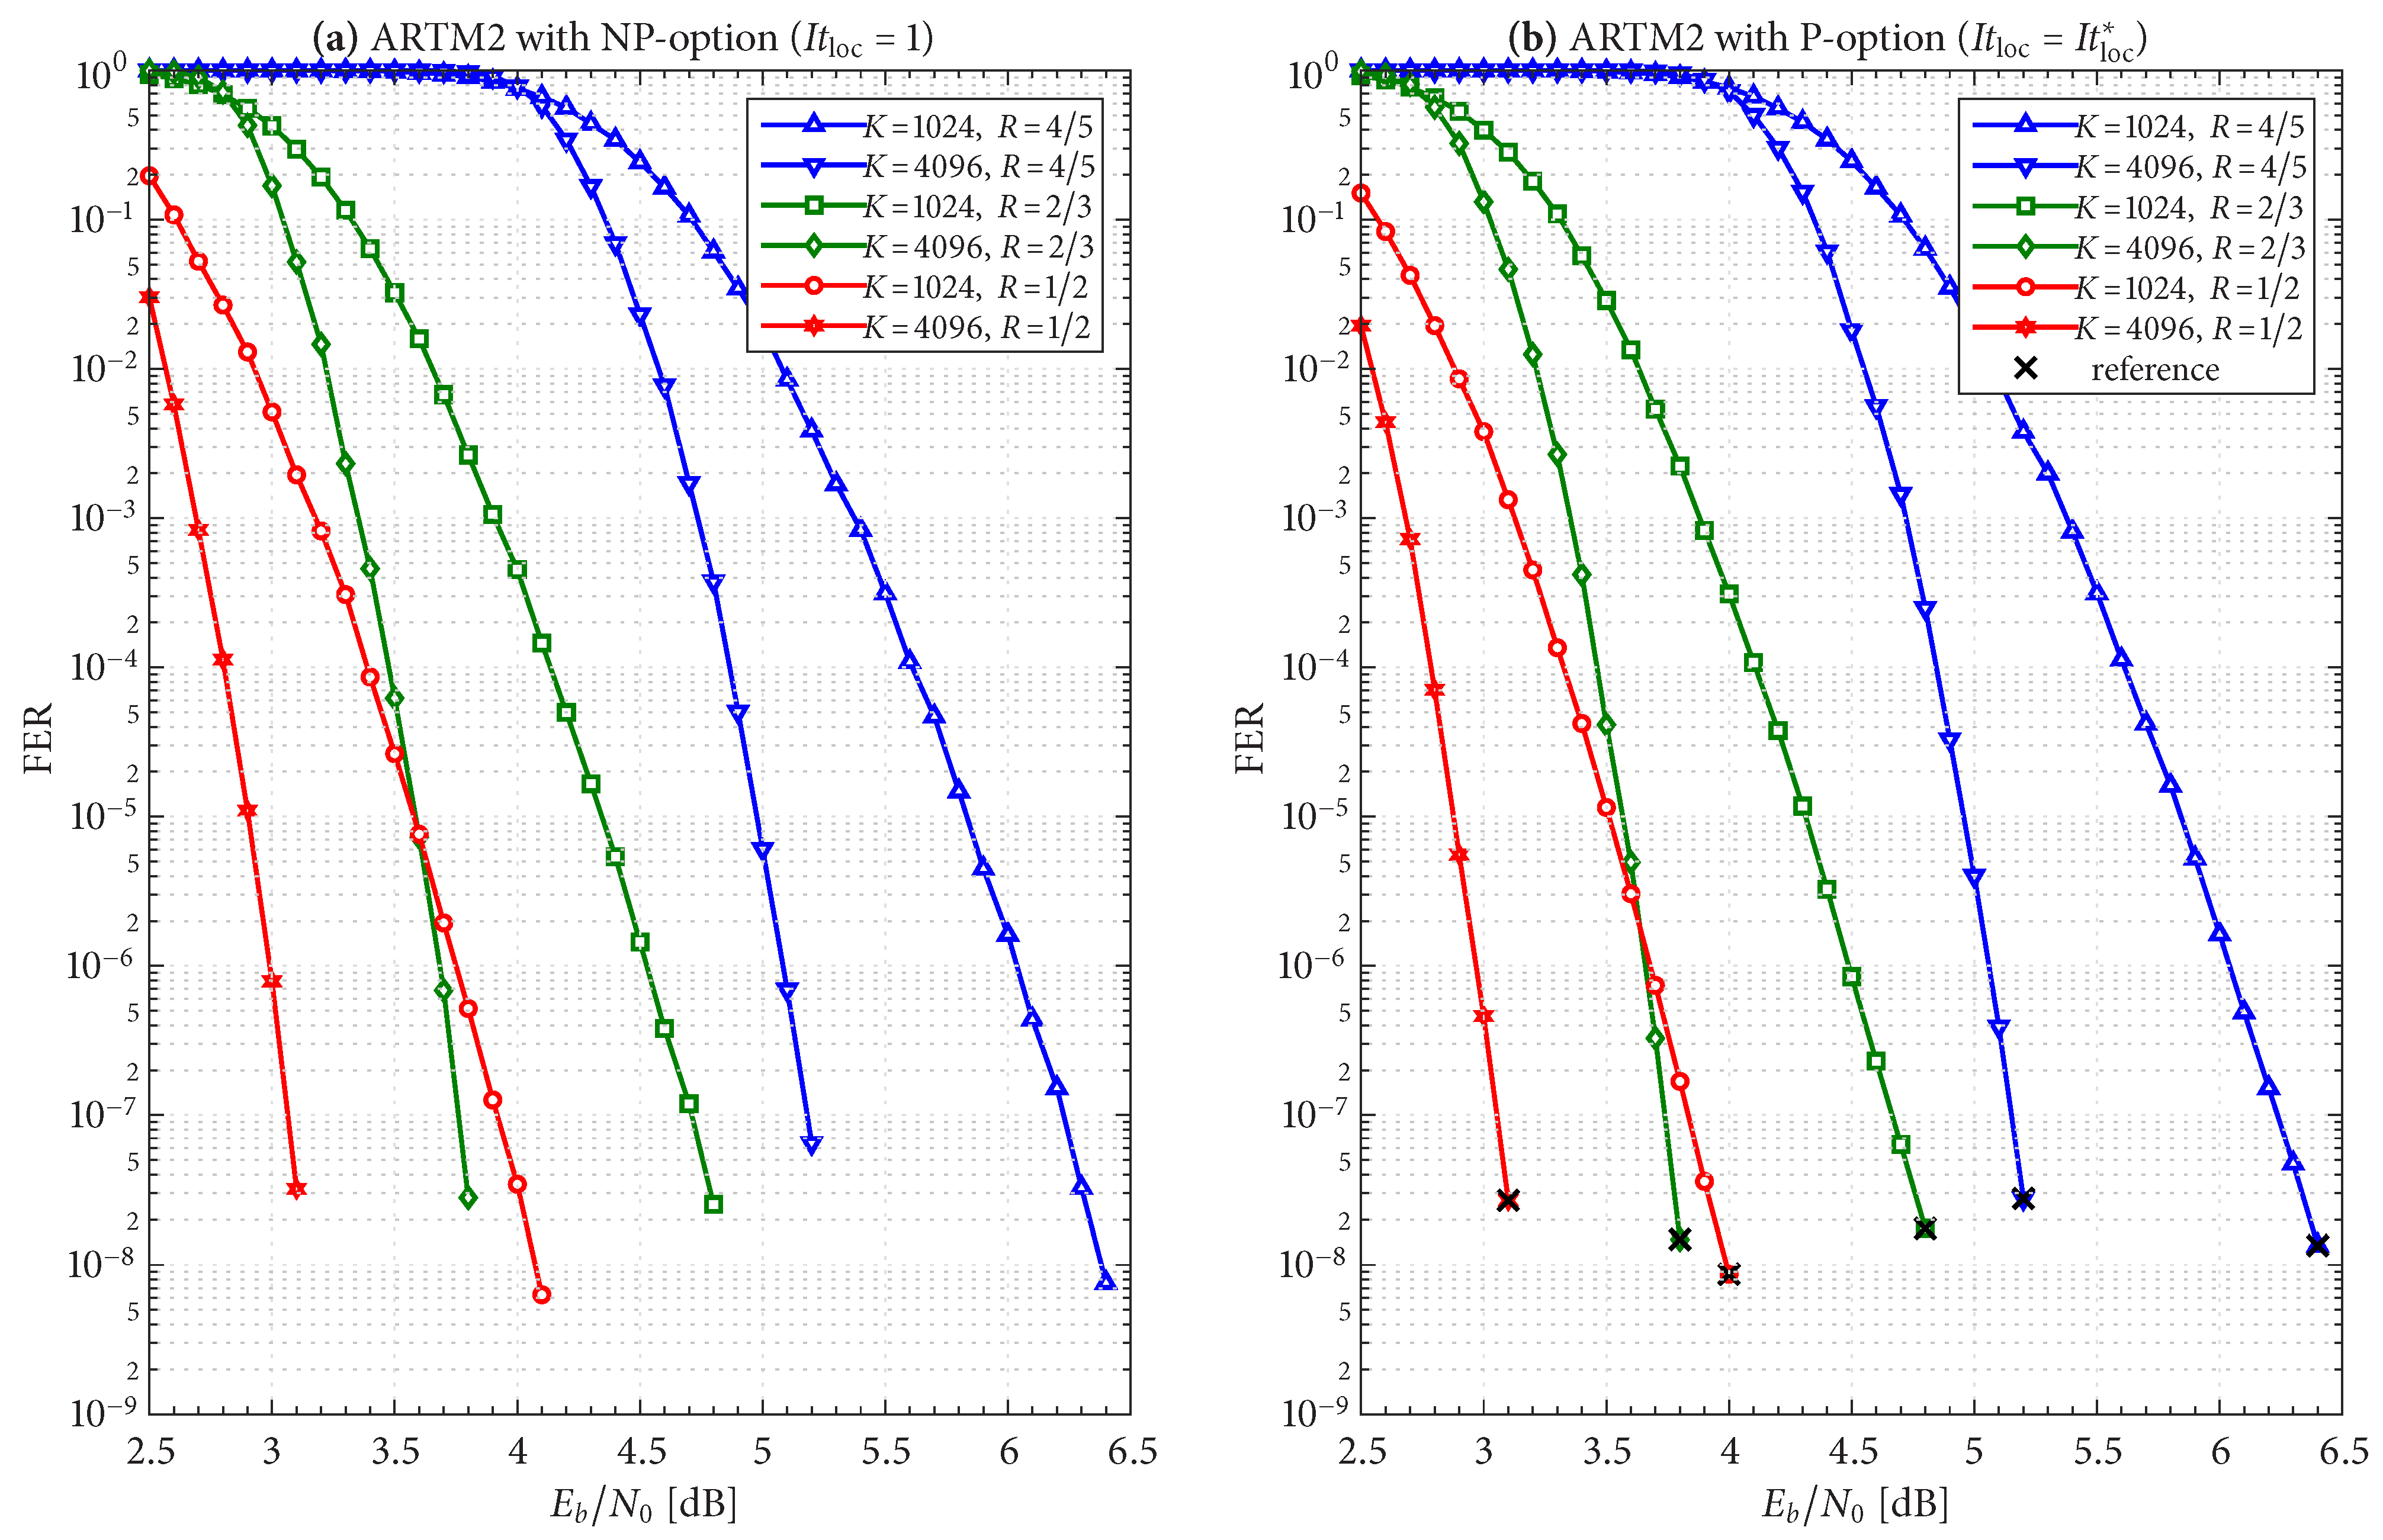
. The reference operating points for the six ARTM0 configurations with the P option are listed in
Table 2, and
Table 3 and
Table 4 contain corresponding data for ARTM1 and ARTM2, respectively (18 configurations in total for the P option). We use
,
, and
to denote the numerical values of the reference “×” points plotted in
Figure 4,
Figure 5 and
Figure 6 and
Figure 10. All values of
in
Table 2,
Table 3 and
Table 4 are below
, and thus the decoder is predicted to be underloaded for any
, although several of the configurations have
that crosses below
at an even earlier point. The values of
listed in
Table 2,
Table 3 and
Table 4 are used to obtain
via the curves plotted in
Figure 12 and
Figure 13. The numerical values of the predicted FER penalty from these curves,
, are listed in
Table 2,
Table 3 and
Table 4, and are also plotted as the vertical black lines (bars) in
Figure 12 and
Figure 13.
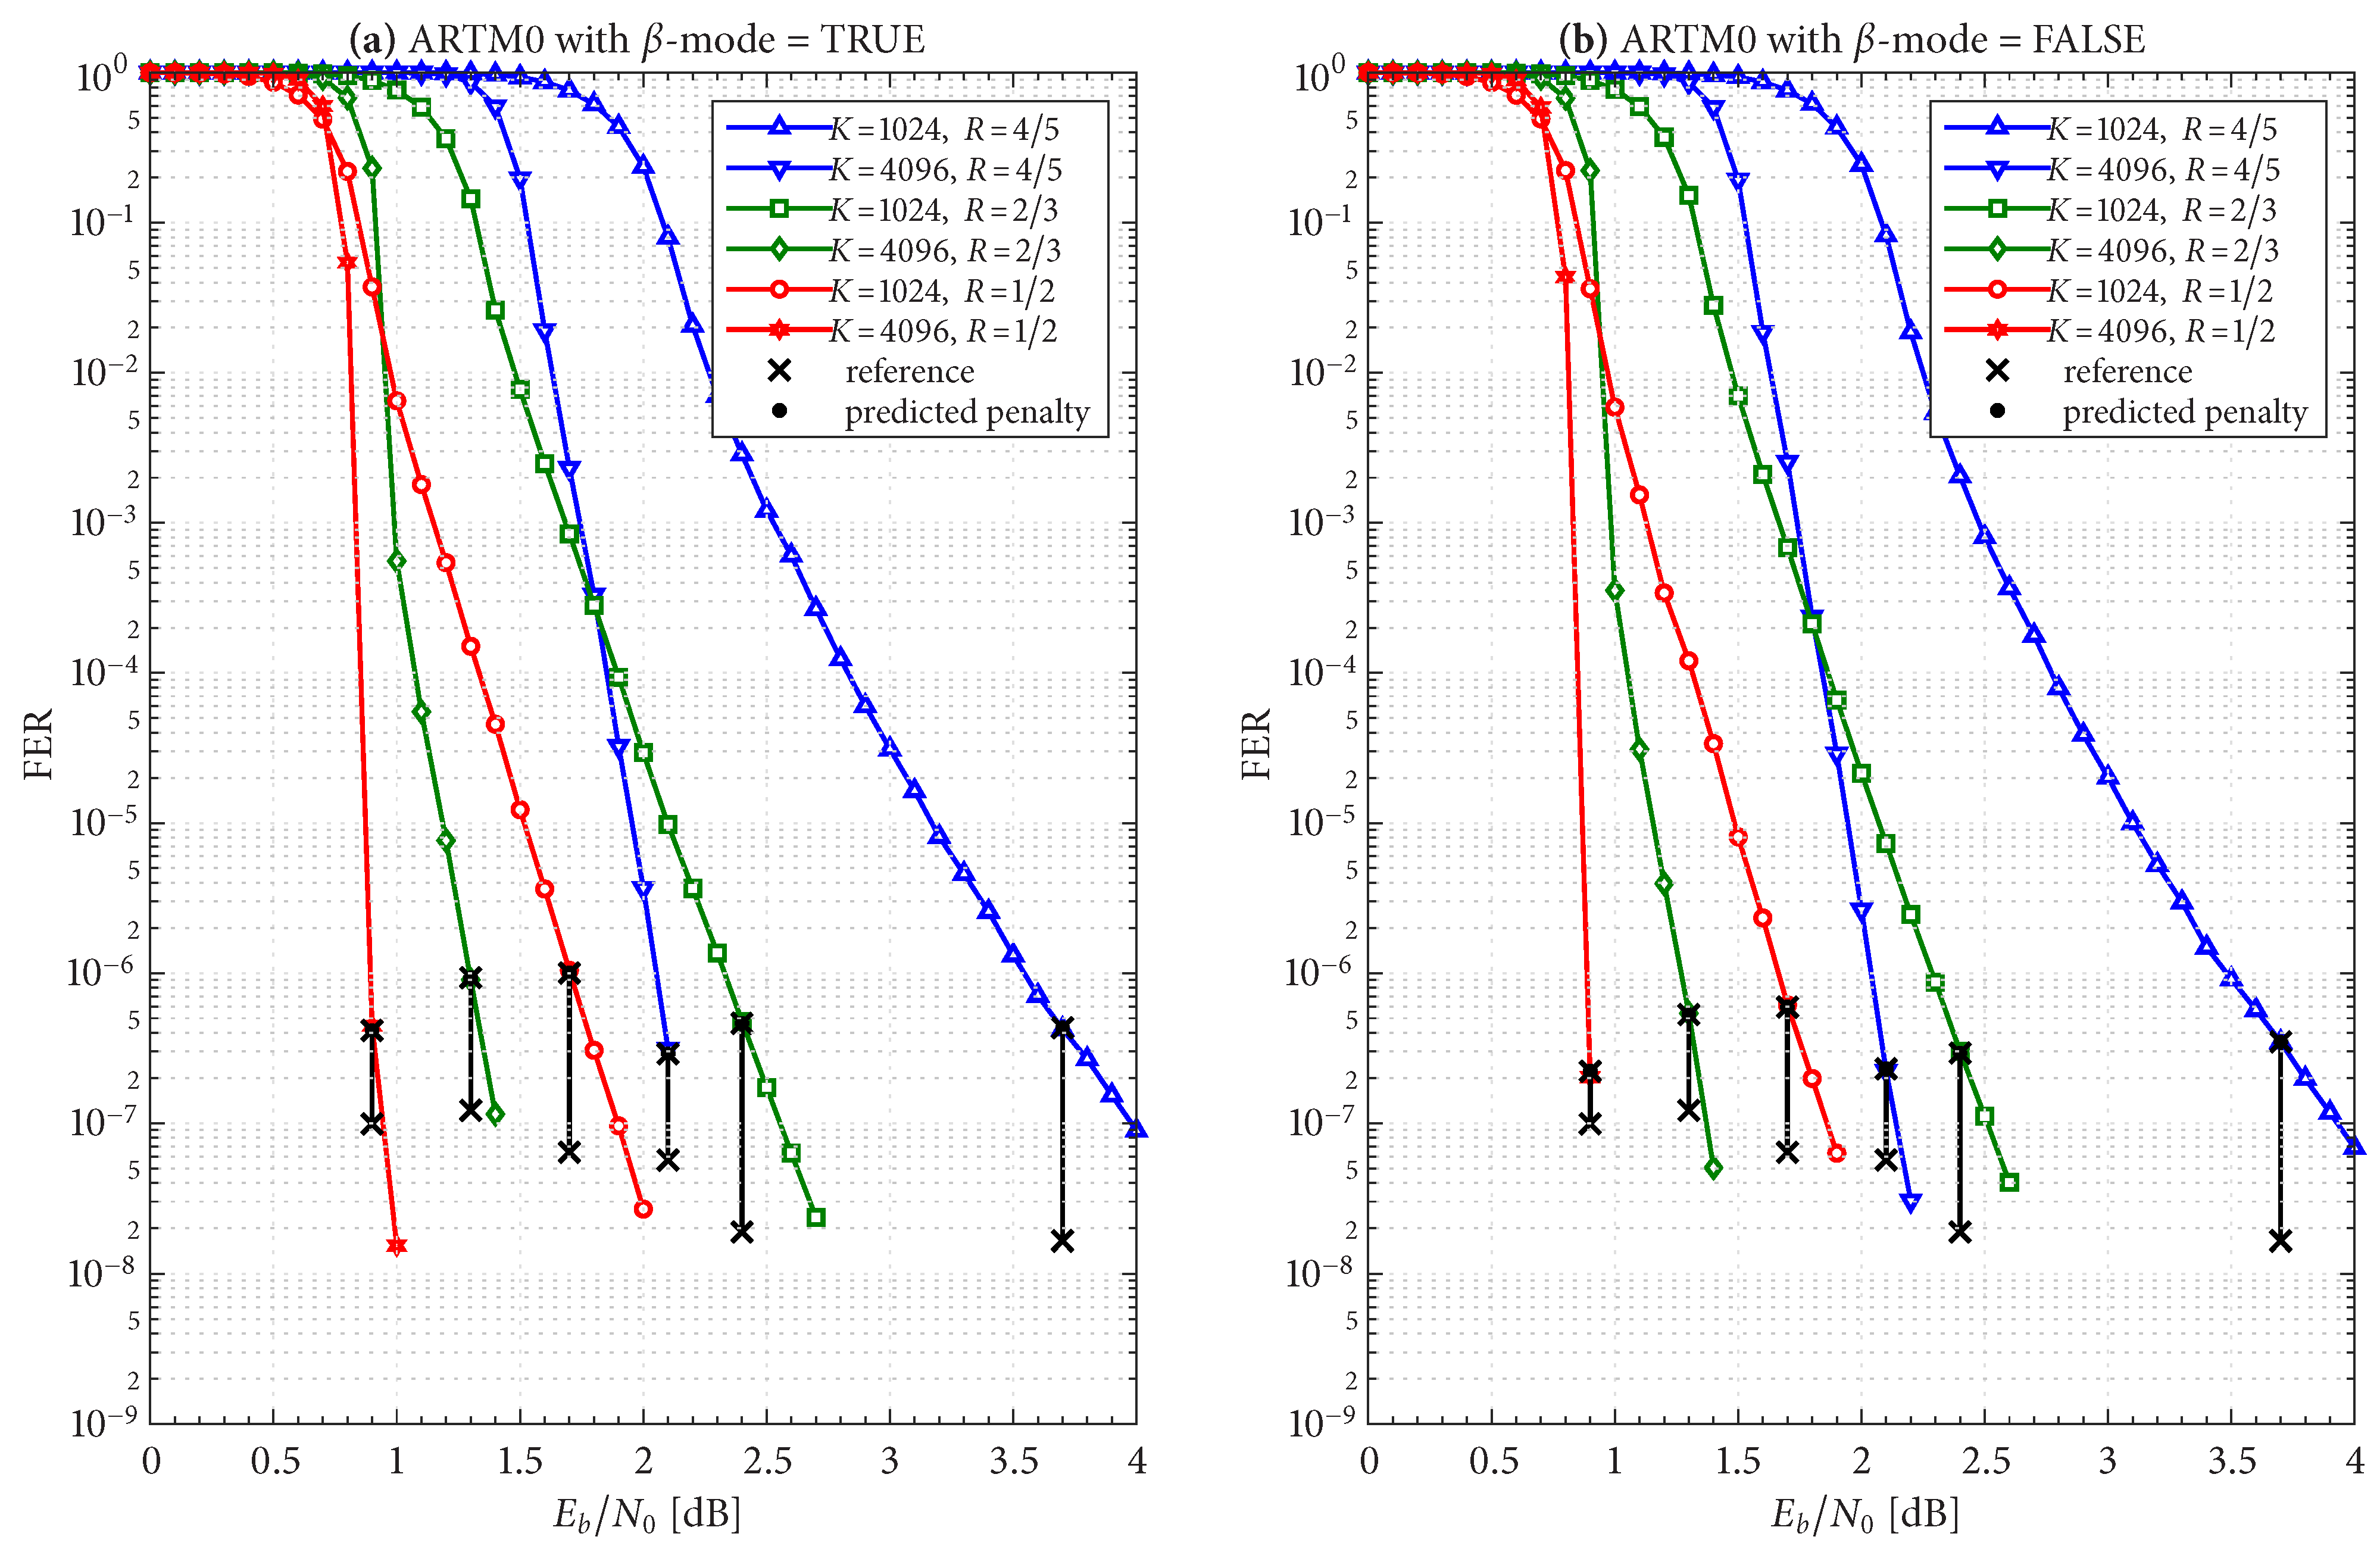
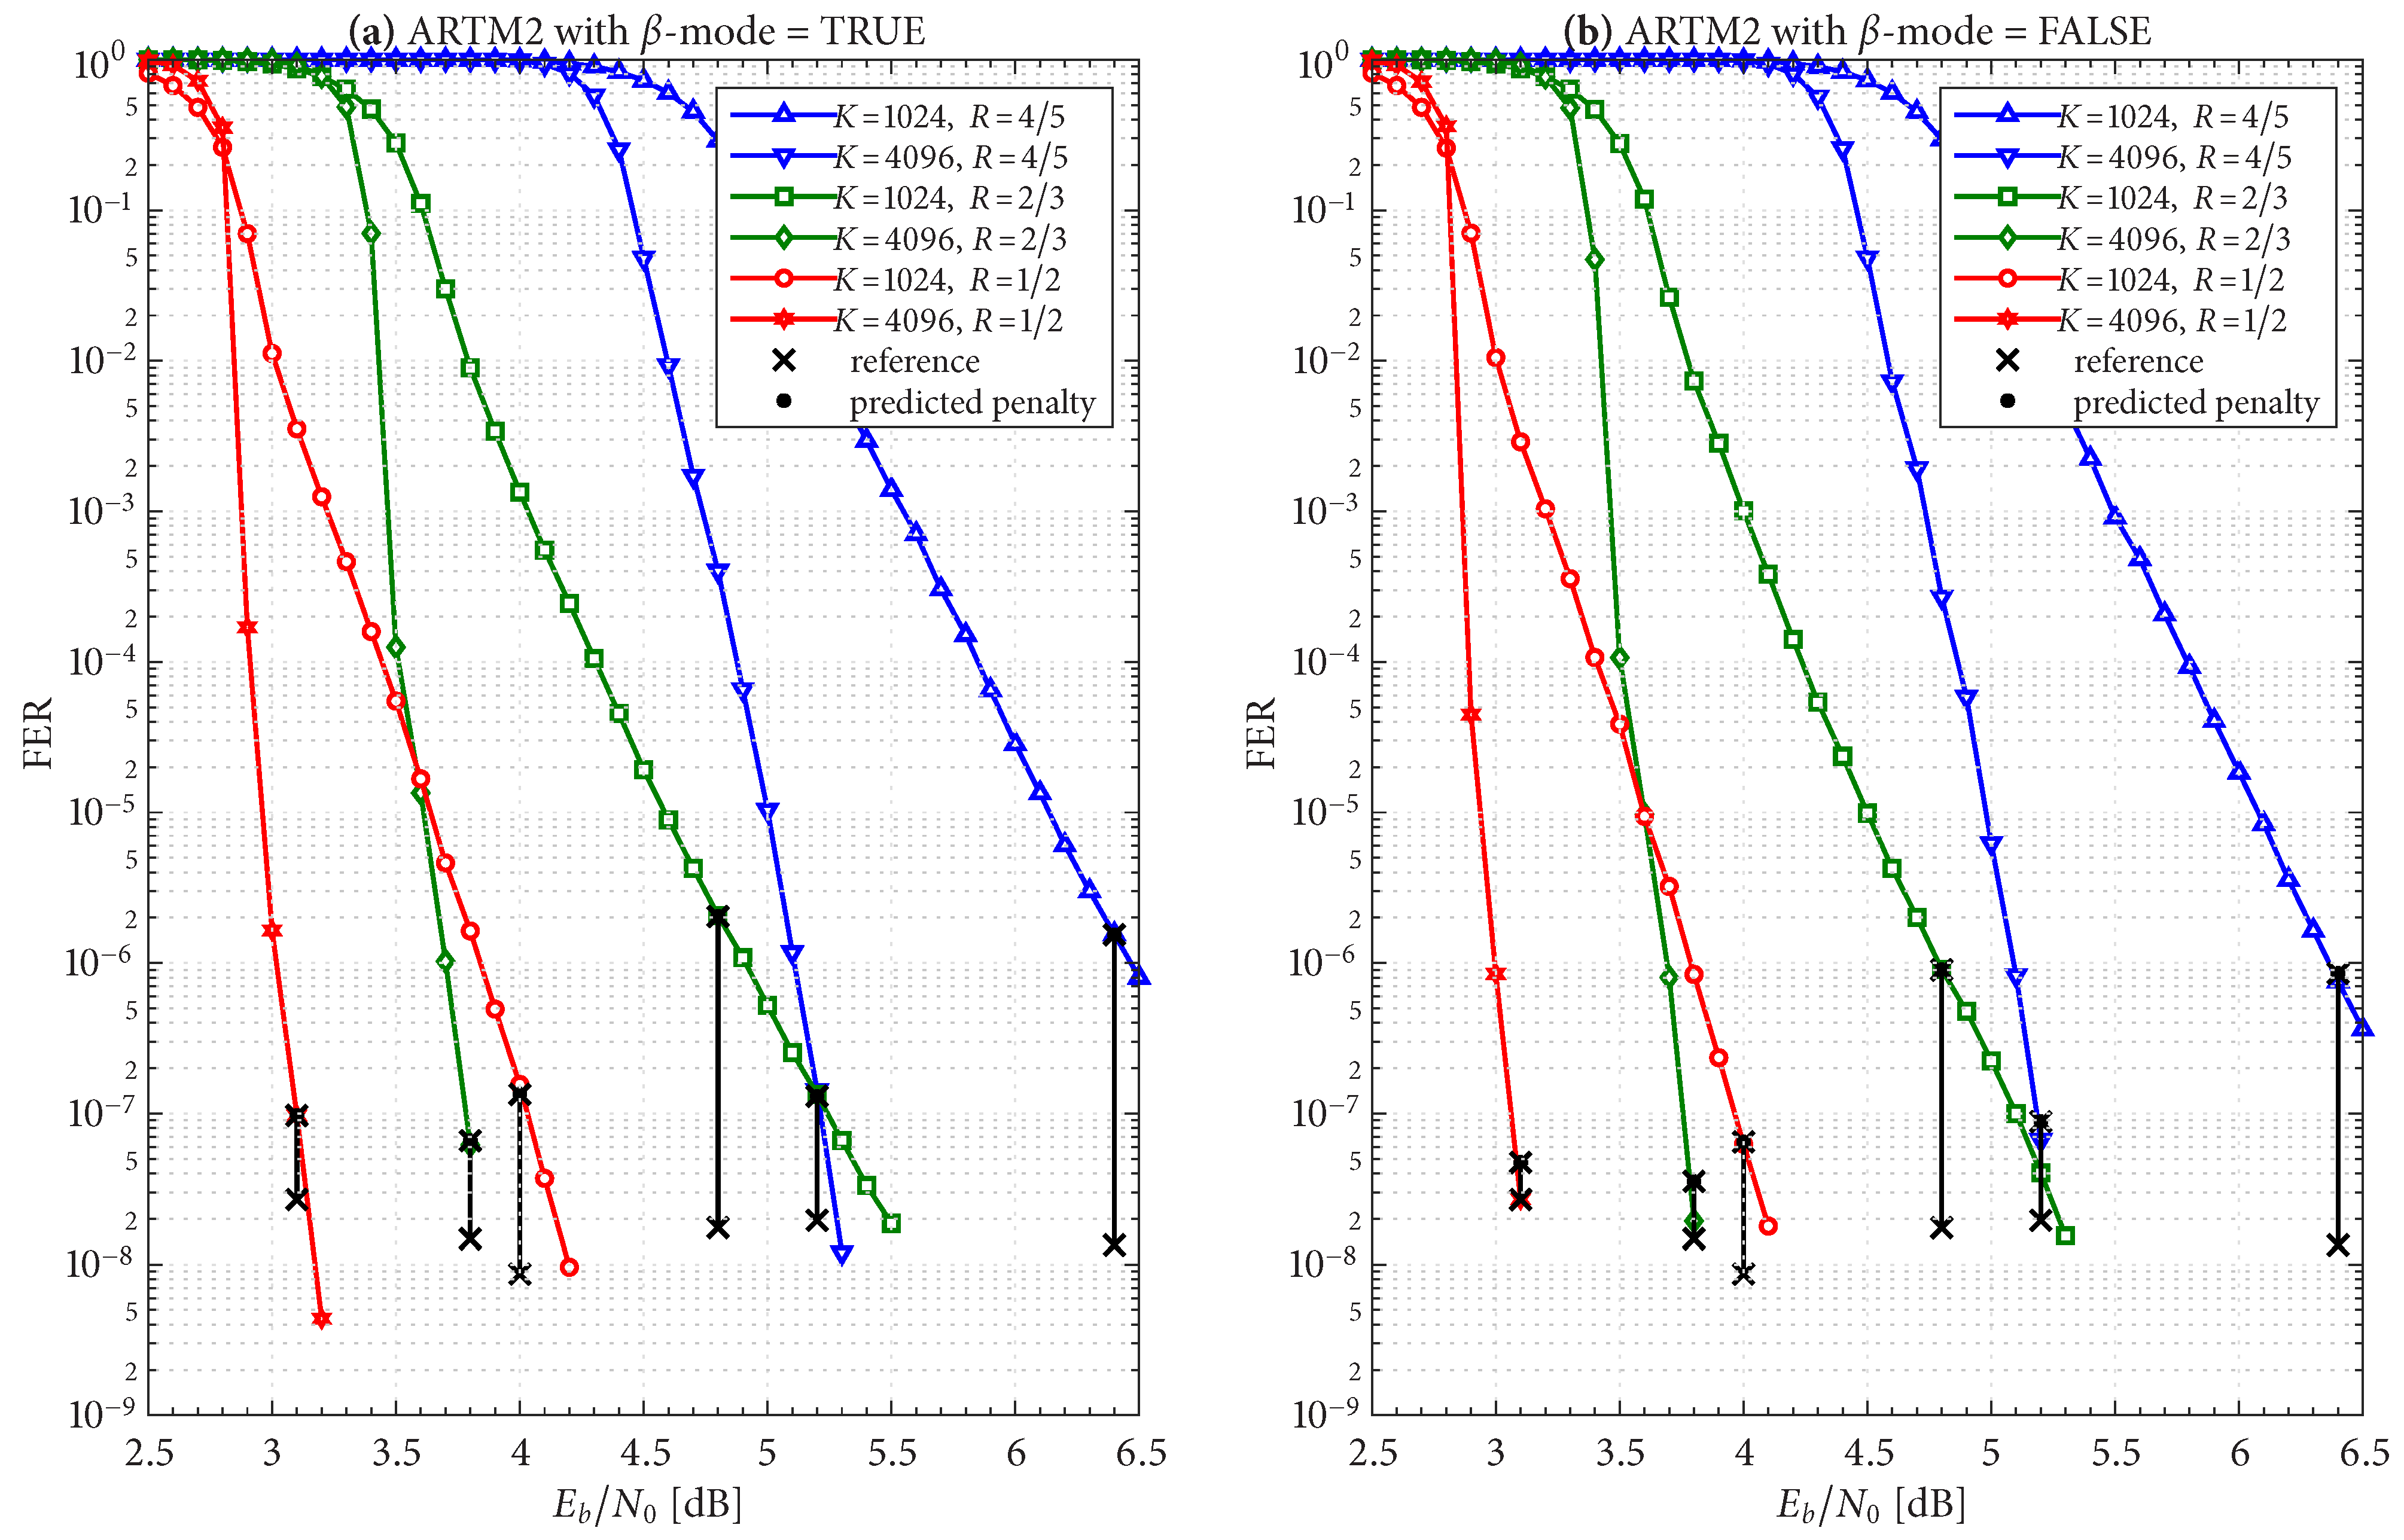
Figure 19,
Figure 20 and
Figure 21 show FER simulations of the real-time decoder, respectively, for ARTM0, ARTM1, and ARTM2; each of these have sub-figure (a) giving results for
-mode = TRUE and sub-figure (b) for
-mode = FALSE. As predicted, the decoder is underloaded when
equals
. However, the transition between the overloaded/underloaded condition is quite dramatic in some cases. For example, with the
,
configurations in
Figure 19 and
Figure 20, the FER diminishes by
four orders of magnitude during the final 0.1 dB increment in SNR to reach
. It is during this narrow SNR interval when
falls below
and a sudden “step up” in maximum iterations comes into effect (i.e., (
8) and (
9) predict large values of
in these configurations when underloaded, vs. a maximum of eight iterations when overloaded). The dramatic “step up” in maximum iterations results in the dramatic “step down” in FER that is observed.
These dramatic transitions are also the points where
-mode = FALSE has the highest likelihood of producing “double errors”. At
for the
,
configurations in
Figure 19 and
Figure 20, the factor
predicts a 10% increase in FER, which rapidly goes to 0% as
continues to increase. However, comparing the values of
in
Table 2,
Table 3 and
Table 4 for
-mode = TRUE vs.
-mode = FALSE, we see that
-mode = FALSE can reduce the FER by as much as 50% relative to
-mode = TRUE, which confirms that it is the superior option between the two.
The black bars in
Figure 12 and
Figure 13 that predict the FER penalty are copied into
Figure 19,
Figure 20 and
Figure 21, and the base (bottom) of each bar is positioned at its respective reference operating point [see
Table 2,
Table 3 and
Table 4]. In all cases, the top of the black bar (i.e., FER penalty that was predicted in the above design procedure) agrees with the FER that was observed in the simulation of the real-time decoder, for both selections of
-mode. This verifies that a
reference simulation (such as
Figure 4,
Figure 5 and
Figure 6), conducted using a value of
that is sufficiently large, can be used to quantify the FER performance of a particular configuration of the real-time decoder.
The predicted FER penalties,
, listed in
Table 2,
Table 3 and
Table 4, appear to be large. However, when placed in the context of the FER simulations in
Figure 19,
Figure 20 and
Figure 21, we are able to translate these into
SNR penalties, denoted as
, which are more meaningful. The vertical black bars are helpful in quantifying
, which is defined as the amount of
additional required in order for the respective FER curve of the real-time decoder to reach the bottom of its reference black bar.
Table 2,
Table 3 and
Table 4 list the value of
measured at the respective operating points for both selections of
-mode.
In cases where the slope of the FER curve is steep (such as the , configurations already discussed in some detail), we observe dB. However, the , configurations have a much shallower FER slope, which translates to values of approaching one dB; this is also true for the , configuration for ARTM2. As with other challenges facing these configurations, the smaller value of is to blame for these larger FER penalties.
In these cases, the FER penalty can be reduced by increasing
, and as (
8) indicates, this is accomplished by increasing
or
as hardware and operational constraints allow. The accuracy of our design methodology means that the FER performance of this parameter space can be explored without the need for additional FER simulations.

