


GLH: From Global to Local Gradient Attacks with High-Frequency Momentum Guidance for Object Detection


Abstract
1. Introduction
- We propose a generalization of object detection-based adversarial attacks that target images by dynamic gradient features. Our approach almost defeats the judgment of the object detection model in a white-box attack. For the black-box attack, our attack also achieves excellent results on object detection models with different structures.
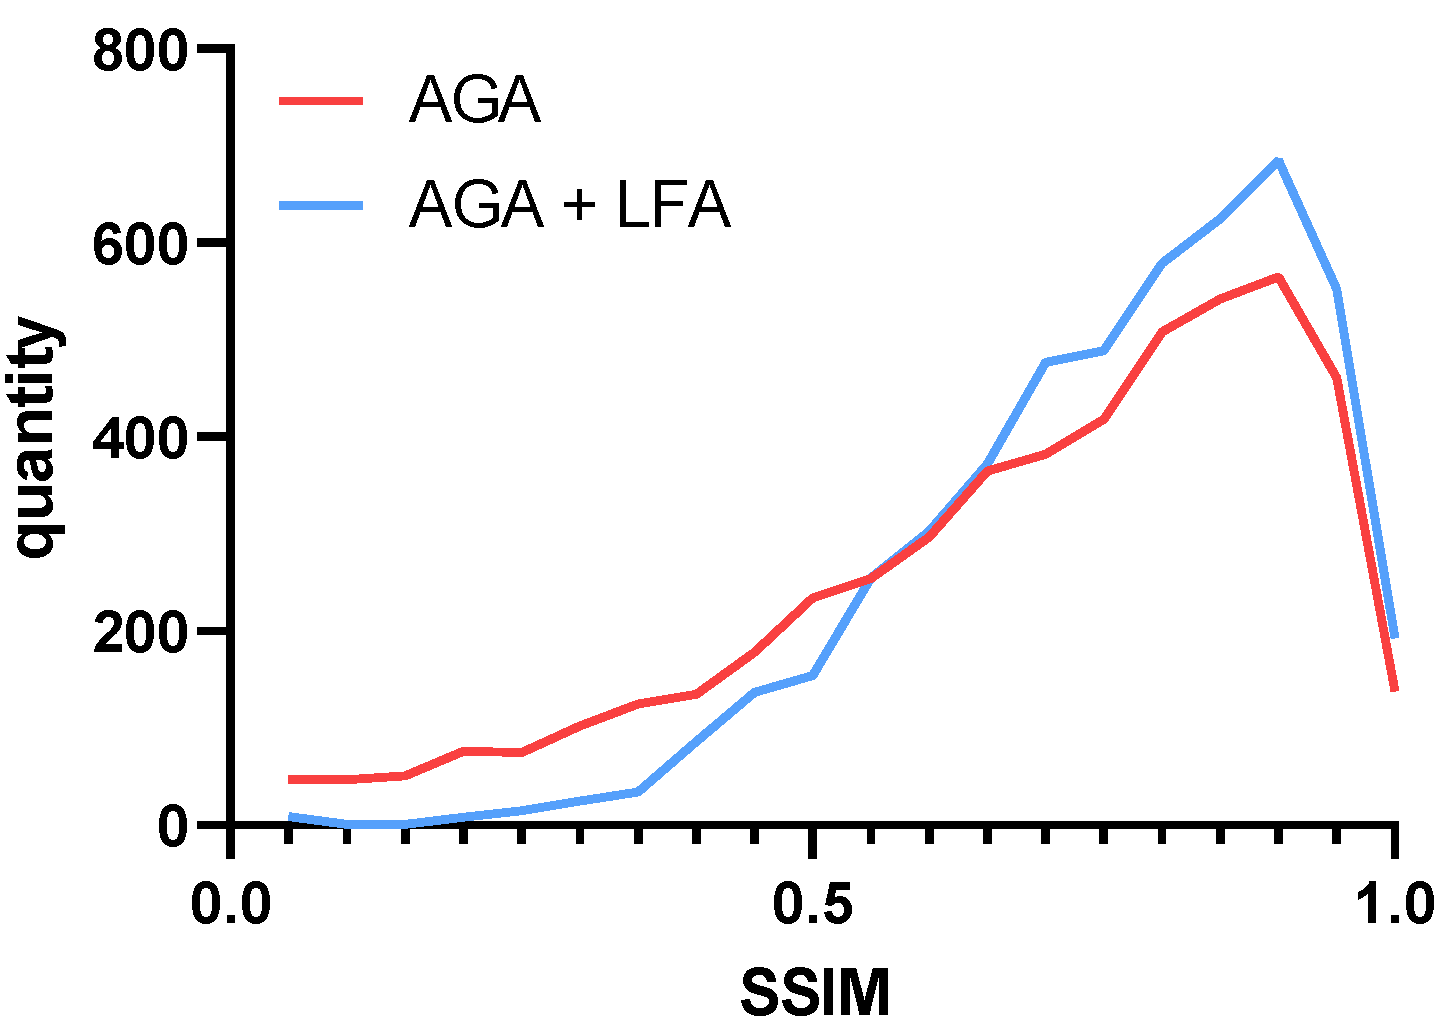
- A local dynamic constraint module is proposed to alleviate the problem of excessive image similarity fluctuations after the attack by limiting the high-gradient perturbations, which reduces the perturbations to the background by eliminating the low-gradient information. On the whole, the similarity of the adversarial sample is improved.
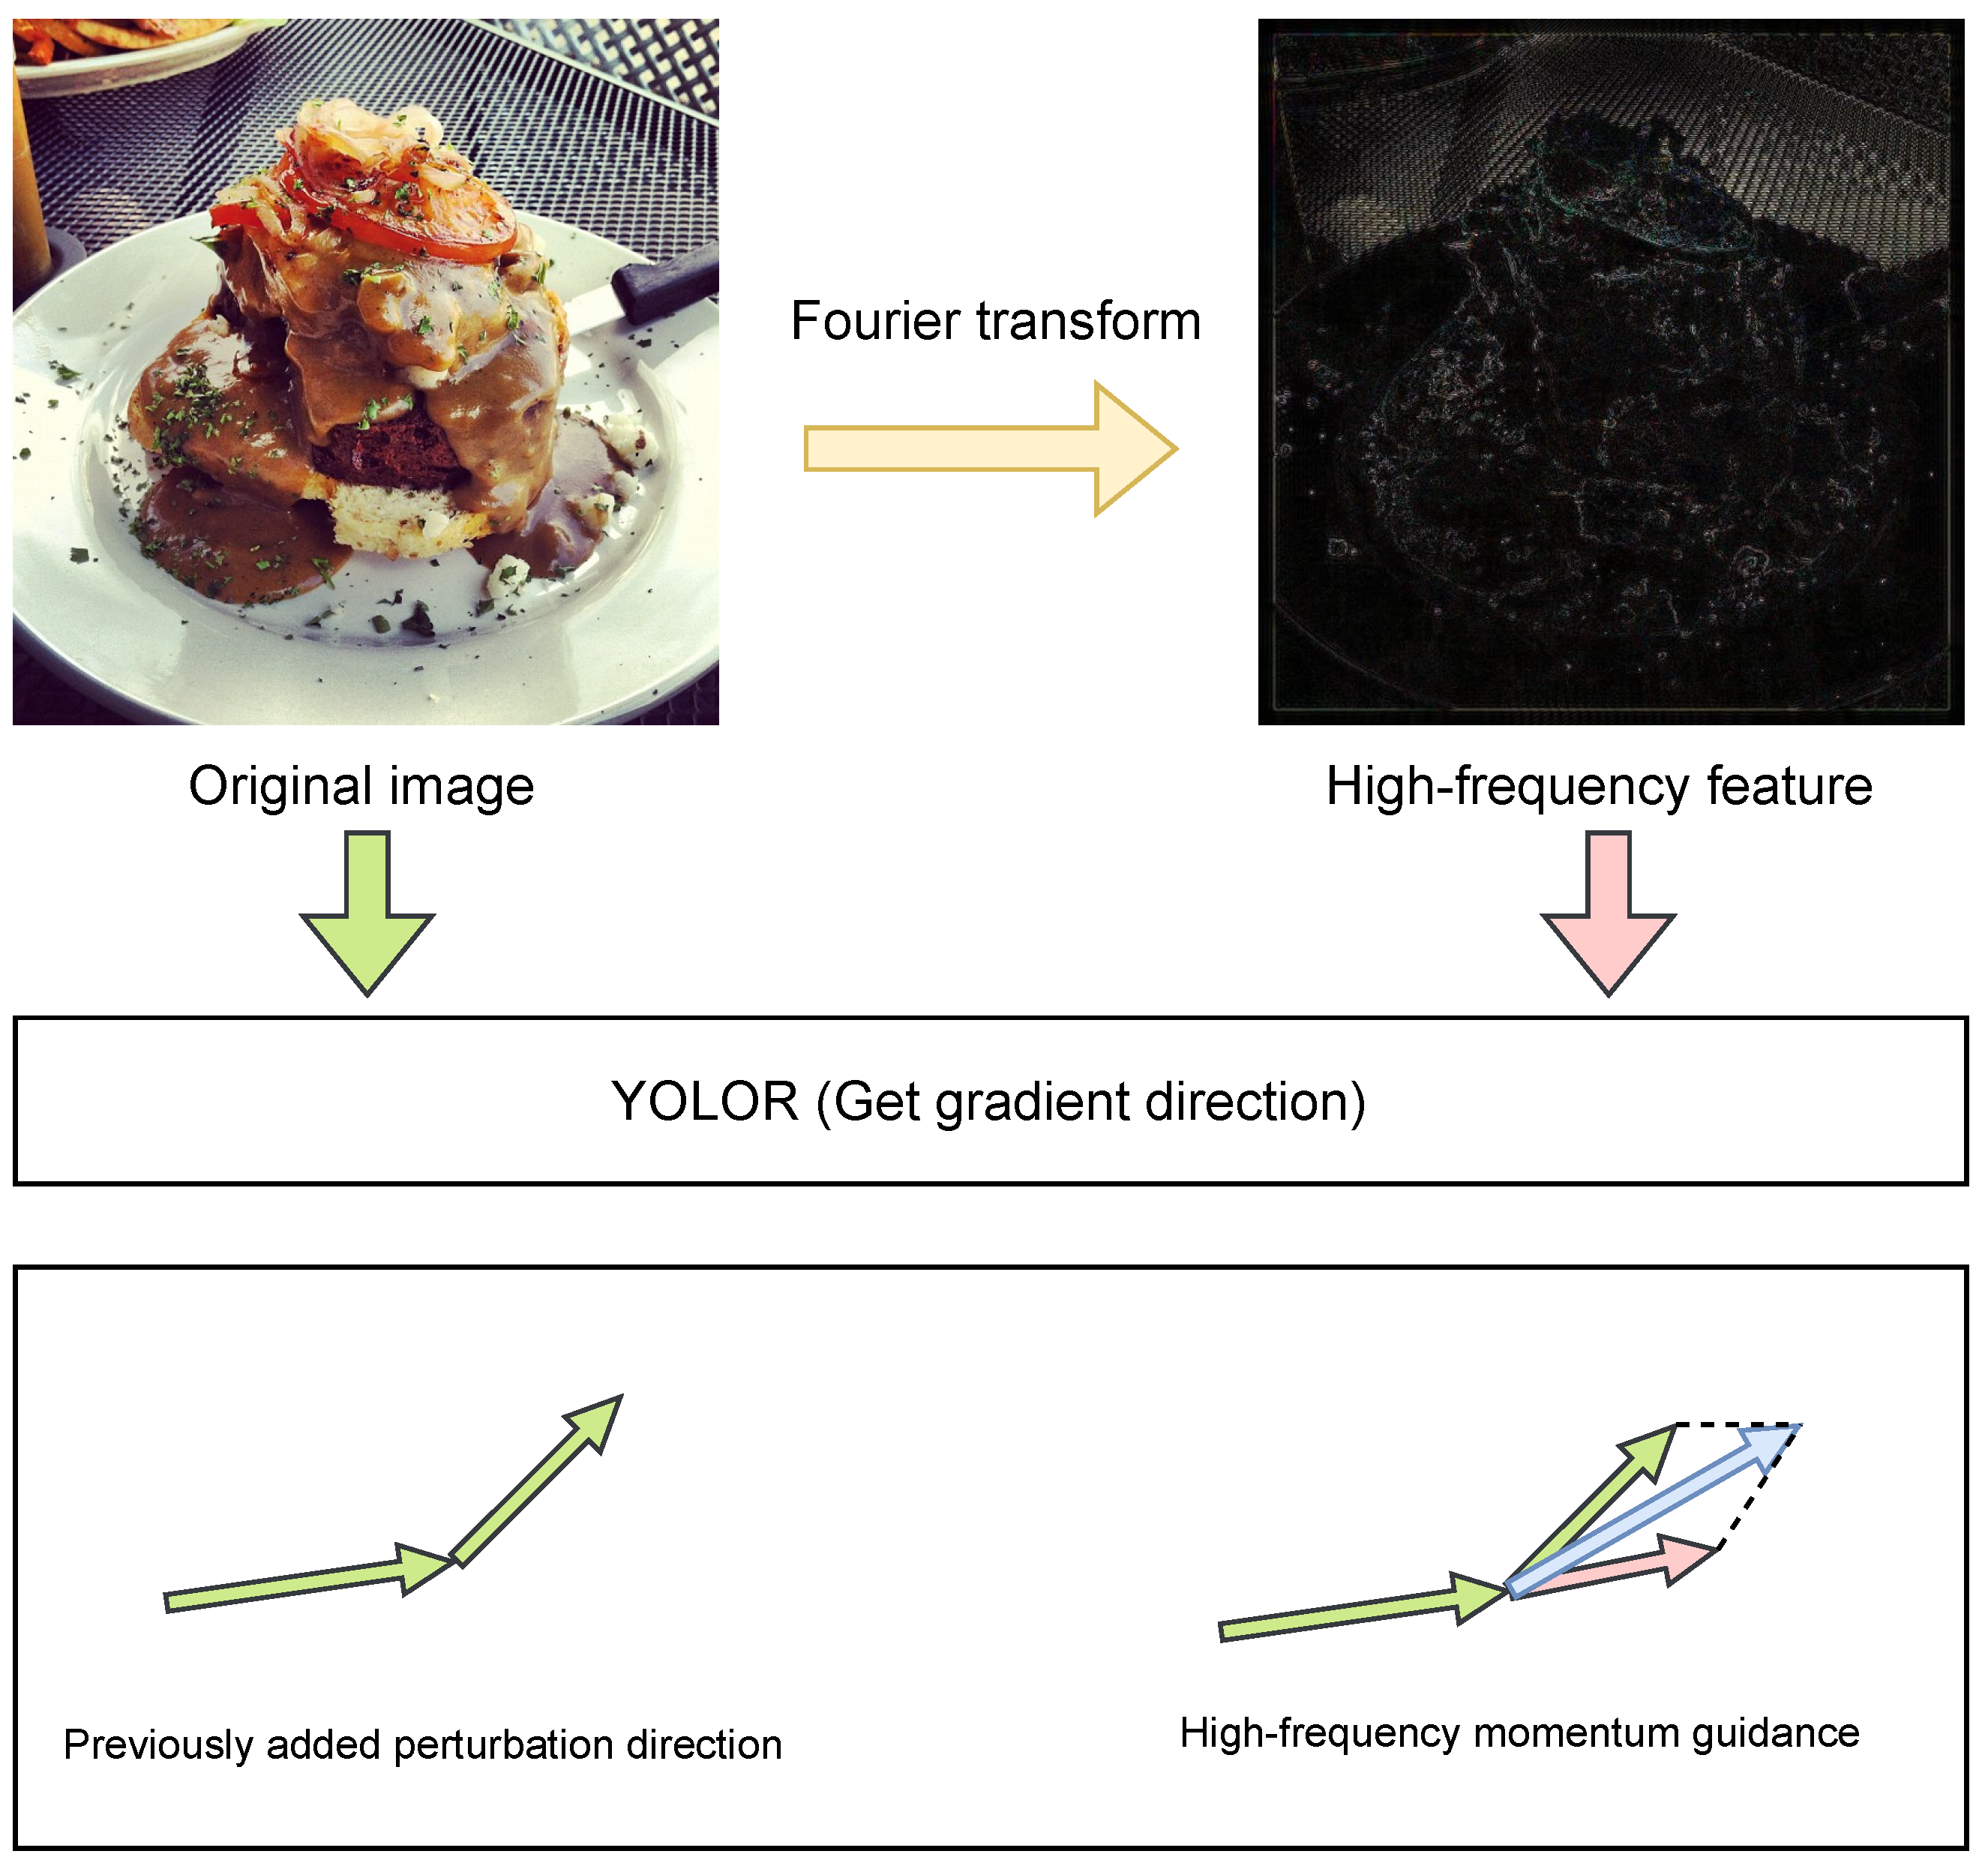
- A momentum guidance method based on high-frequency gradient features is proposed to filter the Fourier-transformed images by high-frequency filtering. The gradient information of the processed image is added as momentum to the next iteration of the perturbation. The overall effect of the attack is improved.
2. Related Work
2.1. Gradient-Based Classification Attacks
2.2. Query-Based Classification Adversarial Attack
2.3. Patch-Based Object Detection Adversarial Attack
2.4. White-Box Based Object Detection Adversarial Attack
3. Methods
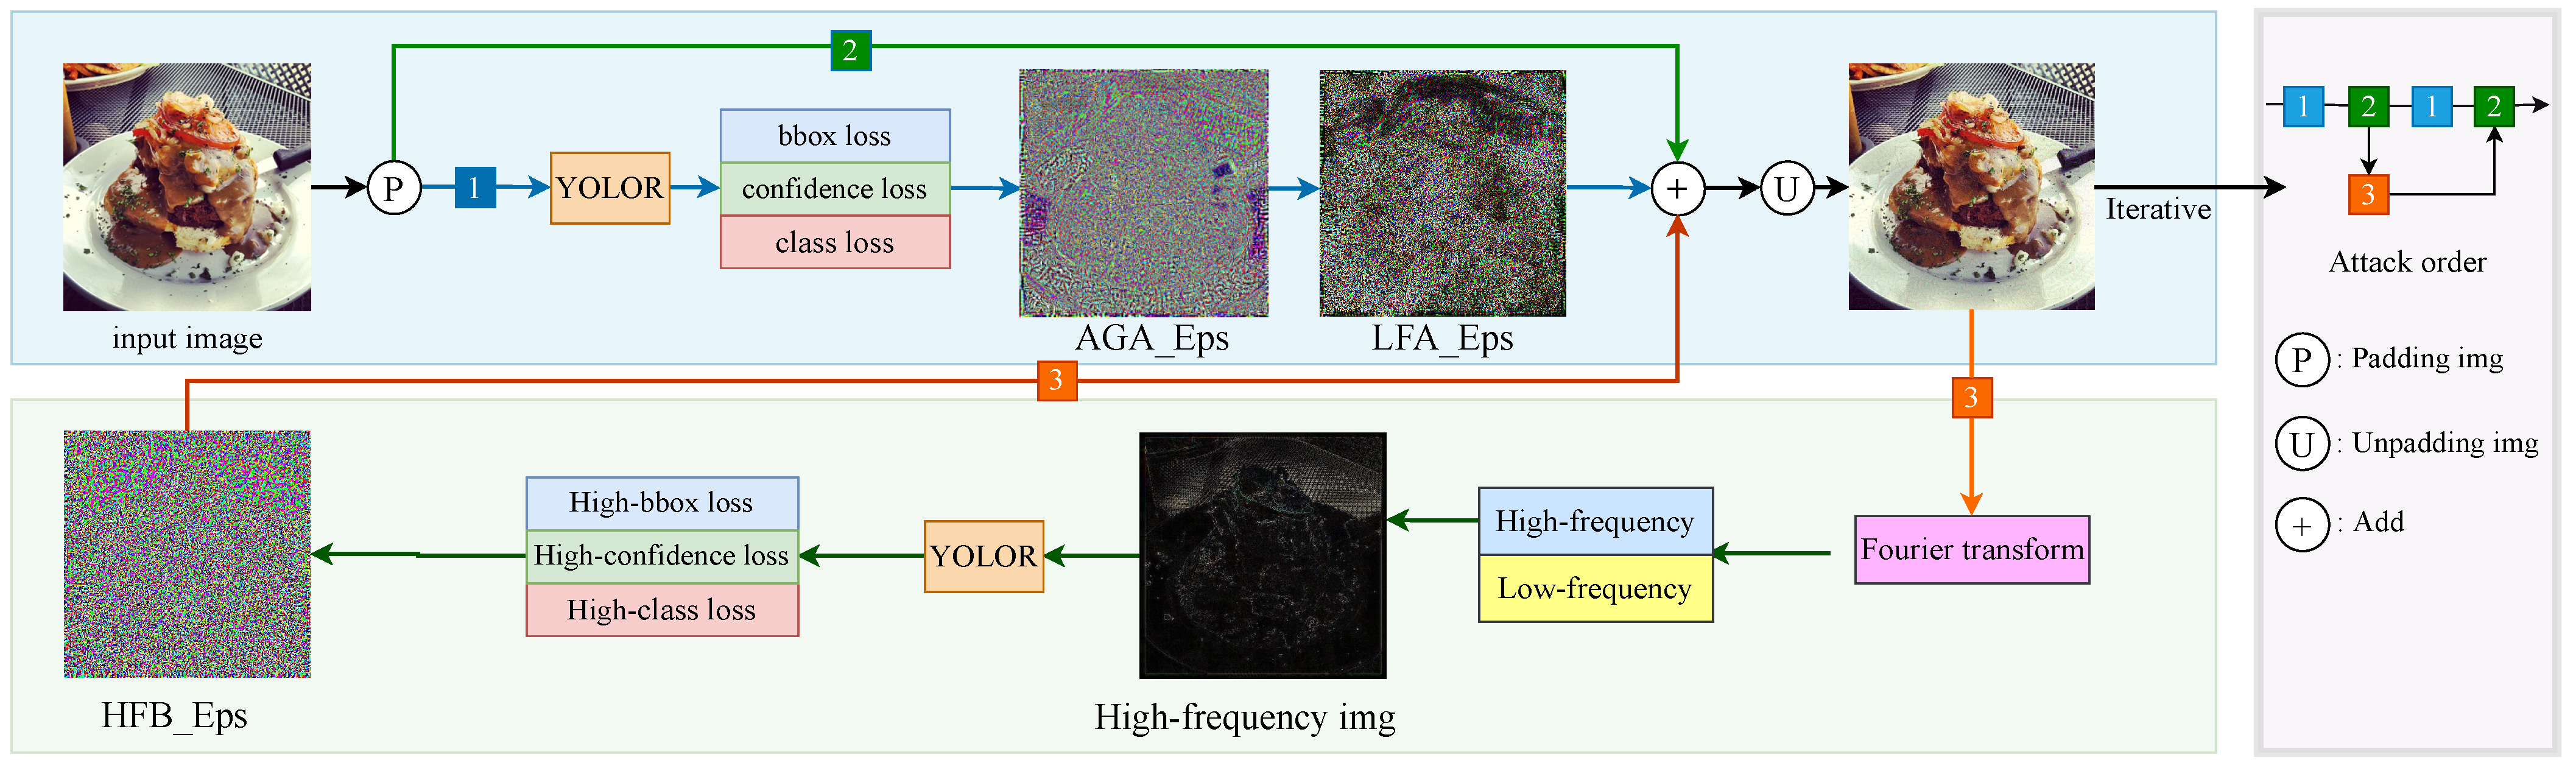
3.1. Overall Framework
| Algorithm 1 GLH. |
|
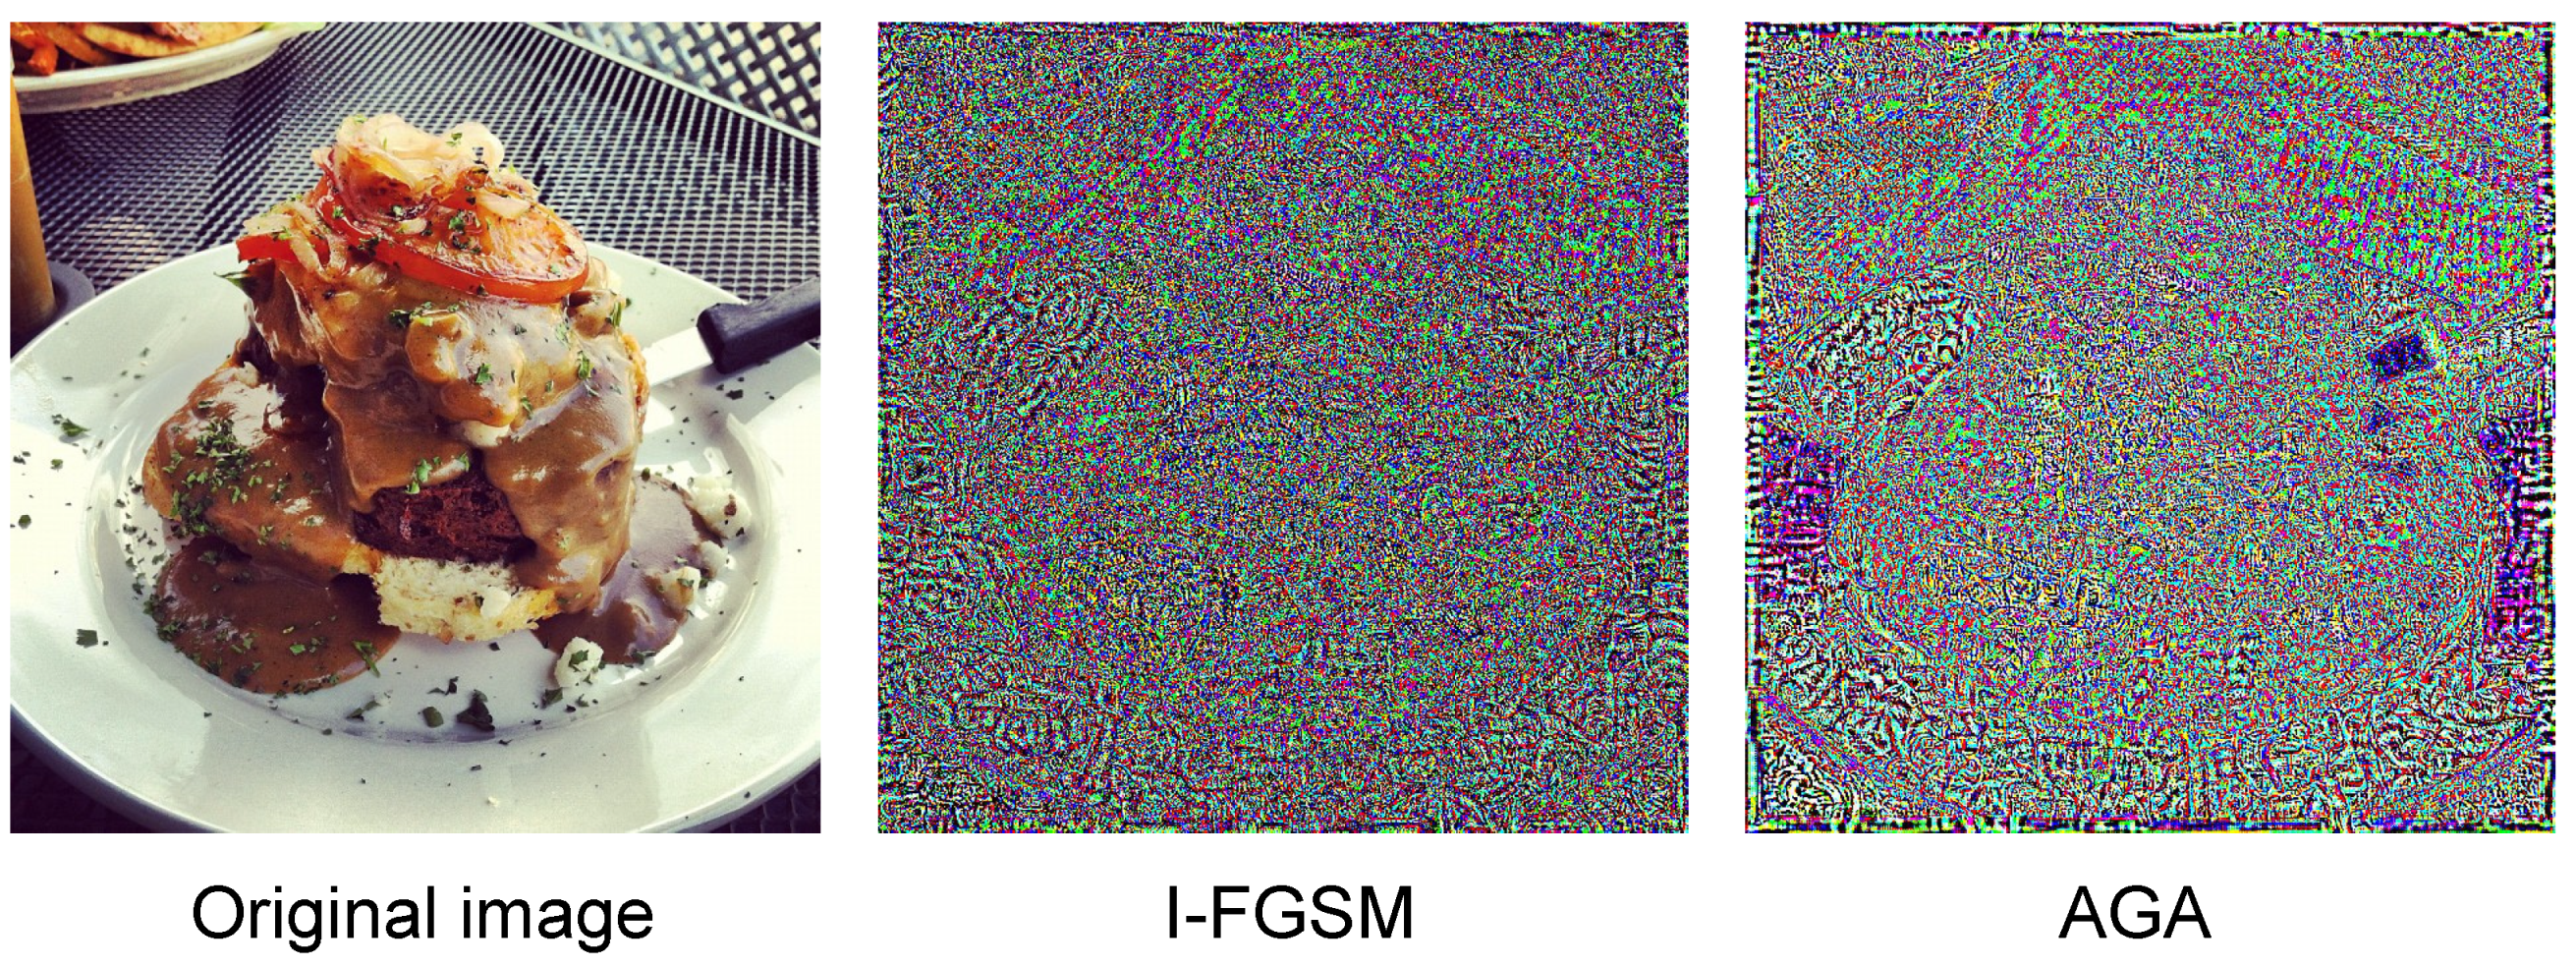
3.2. Adaptive Gradient Attack
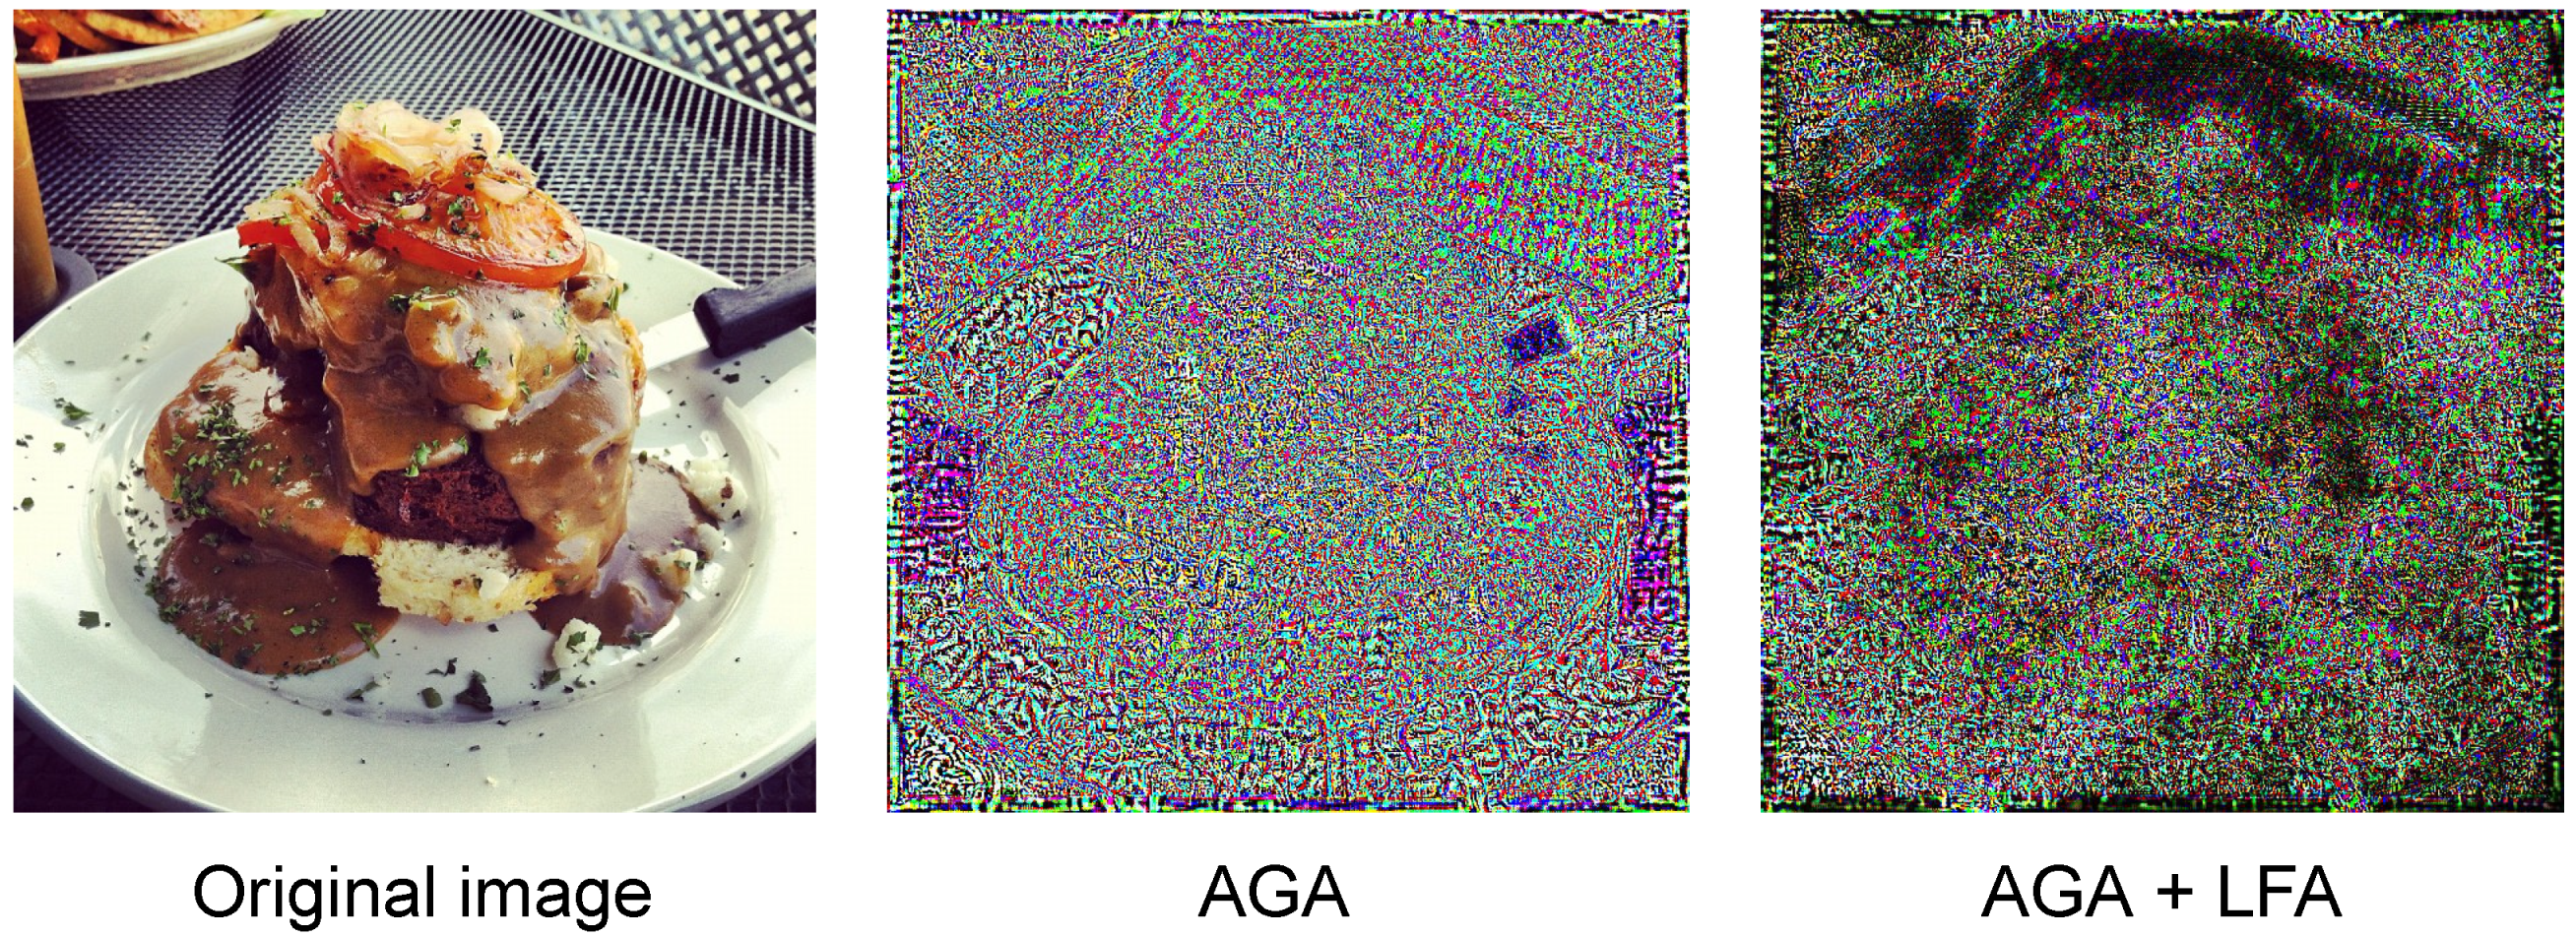
3.3. Local Gradient Feature Attack
3.4. Fourier High-Frequency Momentum Guidance
4. Experiments
4.1. Experimental Details
4.2. Evaluation Indicators
4.3. Generalizability Comparisons
4.4. Visualization
5. Conclusions
Author Contributions
Funding
Institutional Review Board Statement
Informed Consent Statement
Data Availability Statement
Conflicts of Interest
References
- LeCun, Y.; Bengio, Y.; Hinton, G. Deep learning. Nature 2015, 521, 436–444. [Google Scholar] [CrossRef]
- Chen, Y.; Dong, S.; Li, T.; Wang, Y.; Zhou, H. Dynamic multi-key FHE in asymmetric key setting from LWE. IEEE Trans. Inf. Forensics Secur. 2021, 16, 5239–5249. [Google Scholar] [CrossRef]
- Al-Garadi, M.A.; Mohamed, A.; Al-Ali, A.K.; Du, X.; Ali, I.; Guizani, M. A survey of machine and deep learning methods for internet of things (IoT) security. IEEE Commun. Surv. Tutor. 2020, 22, 1646–1685. [Google Scholar] [CrossRef]
- Zhao, Z.Q.; Zheng, P.; Xu, S.t.; Wu, X. Object detection with deep learning: A review. IEEE Trans. Neural Netw. Learn. Syst. 2019, 30, 3212–3232. [Google Scholar] [CrossRef] [PubMed]
- Jafri, R.; Arabnia, H.R. A survey of face recognition techniques. J. Inf. Process. Syst. 2009, 5, 41–68. [Google Scholar] [CrossRef]
- Veres, M.; Moussa, M. Deep learning for intelligent transportation systems: A survey of emerging trends. IEEE Trans. Intell. Transp. Syst. 2019, 21, 3152–3168. [Google Scholar] [CrossRef]
- Hu, Y.; Yang, A.; Li, H.; Sun, Y.; Sun, L. A survey of intrusion detection on industrial control systems. Int. J. Distrib. Sens. Netw. 2018, 14, 1550147718794615. [Google Scholar] [CrossRef]
- Shen, D.; Wu, G.; Suk, H.I. Deep learning in medical image analysis. Annu. Rev. Biomed. Eng. 2017, 19, 221. [Google Scholar] [CrossRef]
- Redmon, J.; Divvala, S.; Girshick, R.; Farhadi, A. You only look once: Unified, real-time object detection. In Proceedings of the IEEE Conference on Computer Vision and Pattern Recognition, Las Vegas, NV, USA, 26 June–1 July 2016; pp. 779–788. [Google Scholar]
- Liu, W.; Anguelov, D.; Erhan, D.; Szegedy, C.; Reed, S.; Fu, C.Y.; Berg, A.C. Ssd: Single shot multibox detector. In Proceedings of the European Conference on Computer Vision, Amsterdam, The Netherlands, 11–14 October 2016; Springer: Berlin/Heidelberg, Germany, 2016; pp. 21–37. [Google Scholar]
- Girshick, R.; Donahue, J.; Darrell, T.; Malik, J. Rich feature hierarchies for accurate object detection and semantic segmentation. In Proceedings of the IEEE Conference on Computer Vision and Pattern Recognition, Columbus, OH, USA, 23–28 June 2014; pp. 580–587. [Google Scholar]
- Szegedy, C.; Zaremba, W.; Sutskever, I.; Bruna, J.; Erhan, D.; Goodfellow, I.; Fergus, R. Intriguing properties of neural networks. In Proceedings of the 2nd International Conference on Learning Representations, ICLR 2014, Banff, AB, Canada, 14–16 April 2014. [Google Scholar]
- Ren, K.; Zheng, T.; Qin, Z.; Liu, X. Adversarial attacks and defenses in deep learning. Engineering 2020, 6, 346–360. [Google Scholar] [CrossRef]
- Lin, T.Y.; Maire, M.; Belongie, S.; Hays, J.; Perona, P.; Ramanan, D.; Dollár, P.; Zitnick, C.L. Microsoft coco: Common objects in context. In Proceedings of the European Conference on Computer Vision, Zurich, Switzerland, 6–12 September 2014; Springer: Berlin/Heidelberg, Germany, 2014; pp. 740–755. [Google Scholar]
- Wang, Z.; Bovik, A.C.; Sheikh, H.R.; Simoncelli, E.P. Image quality assessment: From error visibility to structural similarity. IEEE Trans. Image Process. 2004, 13, 600–612. [Google Scholar] [CrossRef]
- Goodfellow, I.J.; Shlens, J.; Szegedy, C. Explaining and harnessing adversarial examples. arXiv 2014, arXiv:1412.6572. [Google Scholar]
- Kurakin, A.; Goodfellow, I.J.; Bengio, S. Adversarial examples in the physical world. In Artificial Intelligence Safety and Security; Chapman and Hall/CRC: Boca Raton, FL, USA, 2018; pp. 99–112. [Google Scholar]
- Madry, A.; Makelov, A.; Schmidt, L.; Tsipras, D.; Vladu, A. Towards Deep Learning Models Resistant to Adversarial Attacks. In Proceedings of the International Conference on Learning Representations, Vancouver, BC, Canada, 30 April–3 May 2018. [Google Scholar]
- Huang, Y.; Chen, Y.; Wang, X.; Yang, J.; Wang, Q. Promoting Adversarial Transferability via Dual-Sampling Variance Aggregation and Feature Heterogeneity Attacks. Electronics 2023, 12, 767. [Google Scholar] [CrossRef]
- Ru, B.; Cobb, A.; Blaas, A.; Gal, Y. Bayesopt adversarial attack. In Proceedings of the International Conference on Learning Representations, New Orleans, LA, USA, 6–9 May 2019. [Google Scholar]
- Du, J.; Zhang, H.; Zhou, J.T.; Yang, Y.; Feng, J. Query-efficient Meta Attack to Deep Neural Networks. In Proceedings of the International Conference on Learning Representations, New Orleans, LA, USA, 6–9 May 2019. [Google Scholar]
- Moon, S.; An, G.; Song, H.O. Parsimonious black-box adversarial attacks via efficient combinatorial optimization. In Proceedings of the International Conference on Machine Learning, Long Beach, CA, USA, 9–15 June 2019; pp. 4636–4645. [Google Scholar]
- Chen, Z.; Ding, J.; Wu, F.; Zhang, C.; Sun, Y.; Sun, J.; Liu, S.; Ji, Y. An Optimized Black-Box Adversarial Simulator Attack Based on Meta-Learning. Entropy 2022, 24, 1377. [Google Scholar] [CrossRef]
- Brown, T.B.; Mané, D.; Roy, A.; Abadi, M.; Gilmer, J. Adversarial patch. arXiv 2017, arXiv:1712.09665. [Google Scholar]
- Liu, X.; Yang, H.; Liu, Z.; Song, L.; Chen, Y.; Li, H. DPATCH: An Adversarial Patch Attack on Object Detectors. In Proceedings of the SafeAI@ AAAI, Honolulu, HI, USA, 27 January 2019. [Google Scholar]
- Lee, M.; Kolter, Z. On physical adversarial patches for object detection. arXiv 2019, arXiv:1906.11897. [Google Scholar]
- Thys, S.; Van Ranst, W.; Goedemé, T. Fooling Automated Surveillance Cameras: Adversarial Patches to Attack Person Detection. In Proceedings of the 2019 IEEE/CVF Conference on Computer Vision and Pattern Recognition Workshops (CVPRW), Long Beach, CA, USA, 16–20 June 2019; pp. 49–55. [Google Scholar]
- Hu, Z.; Huang, S.; Zhu, X.; Sun, F.; Zhang, B.; Hu, X. Adversarial Texture for Fooling Person Detectors in the Physical World. In Proceedings of the IEEE/CVF Conference on Computer Vision and Pattern Recognition, New Orleans, LA, USA, 18–24 June 2022; pp. 13307–13316. [Google Scholar]
- Xie, C.; Wang, J.; Zhang, Z.; Zhou, Y.; Xie, L.; Yuille, A. Adversarial examples for semantic segmentation and object detection. In Proceedings of the IEEE International Conference on Computer Vision, Venice, Italy, 22–29 October 2017; pp. 1369–1378. [Google Scholar]
- Zhang, H.; Zhou, W.; Li, H. Contextual adversarial attacks for object detection. In Proceedings of the 2020 IEEE International Conference on Multimedia and Expo (ICME), London, UK, 6–10 July 2020; pp. 1–6. [Google Scholar]
- Wei, X.; Liang, S.; Chen, N.; Cao, X. Transferable adversarial attacks for image and video object detection. In Proceedings of the 28th International Joint Conference on Artificial Intelligence, Macao, China, 10–16 August 2019; pp. 954–960. [Google Scholar]
- Chow, K.H.; Liu, L.; Loper, M.; Bae, J.; Gursoy, M.E.; Truex, S.; Wei, W.; Wu, Y. Adversarial objectness gradient attacks in real-time object detection systems. In Proceedings of the 2020 Second IEEE International Conference on Trust, Privacy and Security in Intelligent Systems and Applications (TPS-ISA), Atlanta, GA, USA, 28–31 October 2020; pp. 263–272. [Google Scholar]
- Wang, C.Y.; Yeh, I.H.; Liao, H.Y.M. You only learn one representation: Unified network for multiple tasks. arXiv 2021, arXiv:2105.04206. [Google Scholar]
- Deng, J.; Dong, W.; Socher, R.; Li, L.J.; Li, K.; Fei-Fei, L. Imagenet: A large-scale hierarchical image database. In Proceedings of the 2009 IEEE Conference on Computer Vision and Pattern Recognition, Miami, FL, USA, 20–25 June 2009; pp. 248–255. [Google Scholar]
- Russakovsky, O.; Deng, J.; Su, H.; Krause, J.; Satheesh, S.; Ma, S.; Huang, Z.; Karpathy, A.; Khosla, A.; Bernstein, M.; et al. Imagenet large scale visual recognition challenge. Int. J. Comput. Vis. 2015, 115, 211–252. [Google Scholar] [CrossRef]
- Rezatofighi, H.; Tsoi, N.; Gwak, J.; Sadeghian, A.; Reid, I.; Savarese, S. Generalized intersection over union: A metric and a loss for bounding box regression. In Proceedings of the IEEE/CVF Conference on Computer Vision and pattern Recog Nition, Long Beach, CA, USA, 15–20 June 2019; pp. 658–666. [Google Scholar]
- Ge, Z.; Liu, S.; Wang, F.; Li, Z.; Sun, J. Yolox: Exceeding yolo series in 2021. arXiv 2021, arXiv:2107.08430. [Google Scholar]
- Bochkovskiy, A.; Wang, C.Y.; Liao, H.Y.M. Yolov4: Optimal speed and accuracy of object detection. arXiv 2020, arXiv:2004.10934. [Google Scholar]
- Li, C.; Li, L.; Jiang, H.; Weng, K.; Geng, Y.; Li, L.; Ke, Z.; Li, Q.; Cheng, M.; Nie, W.; et al. YOLOv6: A Single-Stage Object Detection Framework for Industrial Applications. arXiv 2022, arXiv:2209.02976. [Google Scholar]
- Wang, C.Y.; Bochkovskiy, A.; Liao, H.Y.M. YOLOv7: Trainable bag-of-freebies sets new state-of-the-art for real-time object detectors. arXiv 2022, arXiv:2207.02696. [Google Scholar]
- Carion, N.; Massa, F.; Synnaeve, G.; Usunier, N.; Kirillov, A.; Zagoruyko, S. End-to-end object detection with transformers. In Proceedings of the European Conference on Computer Vision, Glasgow, UK, 23–28 August 2020; Springer: Berlin/Heidelberg, Germany, 2020; pp. 213–229. [Google Scholar]
- Tan, M.; Pang, R.; Le, Q.V. Efficientdet: Scalable and efficient object detection. In Proceedings of the IEEE/CVF Conference on Computer Vision and Pattern Recognition, Seattle, WA, USA, 13–19 June 2020; pp. 10781–10790. [Google Scholar]
- He, K.; Gkioxari, G.; Dollár, P.; Girshick, R. Mask r-cnn. In Proceedings of the IEEE International Conference on Computer Vision, Venice, Italy, 22–29 October 2017; pp. 2961–2969. [Google Scholar]
- Zhang, Y.F.; Ren, W.; Zhang, Z.; Jia, Z.; Wang, L.; Tan, T. Focal and efficient IOU loss for accurate bounding box regression. Neurocomputing 2022, 506, 146–157. [Google Scholar] [CrossRef]
- Zheng, Z.; Wang, P.; Liu, W.; Li, J.; Ye, R.; Ren, D. Distance-IoU loss: Faster and better learning for bounding box regression. In Proceedings of the AAAI Conference on Artificial Intelligence, New York, NY, USA, 7–12 February 2020; Volume 34, pp. 12993–13000. [Google Scholar]
- Zheng, Z.; Wang, P.; Ren, D.; Liu, W.; Ye, R.; Hu, Q.; Zuo, W. Enhancing geometric factors in model learning and inference for object detection and instance segmentation. IEEE Trans. Cybern. 2021, 52, 8574–8586. [Google Scholar] [CrossRef] [PubMed]
- Muhammad, M.B.; Yeasin, M. Eigen-cam: Class activation map using principal components. In Proceedings of the 2020 International Joint Conference on Neural Networks (IJCNN), Glasgow, UK, 19–24 July 2020; pp. 1–7. [Google Scholar]


| Model | Constraints | Size | SSIM | PSNR | ||||||
|---|---|---|---|---|---|---|---|---|---|---|
| YOLOR-CSP | - | 640 | 49.20% | 67.60% | 53.70% | 32.90% | 54.40% | 63.00% | - | - |
| I-FGSM [17] | 640 | 30.70% | 45.70% | 32.30% | 14.40% | 32.30% | 46.60% | 0.879 | 34.19 | |
| PGD [18] | 640 | 30.40% | 45.40% | 31.90% | 13.90% | 31.80% | 46.00% | 0.881 | 34.24 | |
| GLH(,i) | - | 640 | 25.10% | 38.60% | 26.00% | 9.90% | 25.30% | 40.70% | 0.897 | 36.02 |
| I-FGSM [17] | - | 640 | 23.10% | 35.40% | 24.00% | 9.10% | 23.70% | 37.50% | 0.835 | 31.94 |
| PGD [18] | - | 640 | 21.60% | 33.30% | 22.50% | 8.00% | 22.20% | 35.40% | 0.831 | 32.09 |
| GLH(,i) | - | 640 | 19.00% | 29.80% | 19.20% | 6.60% | 18.70% | 32.50% | 0.859 | 34.03 |
| GLH(,i) | - | 640 | 4.90% | 8.30% | 4.80% | 0.80% | 3.50% | 12.10% | 0.700 | 27.82 |
| Method | Constraints | Size | SSIM | PSNR | ||||||
|---|---|---|---|---|---|---|---|---|---|---|
| YOLOR-CSP | - | 640 | 37.60% | 61.80% | 67.20% | 50.80% | 72.70% | 81.00% | - | - |
| I-FGSM [17] | 640 | 27.70% | 47.40% | 53.20% | 31.50% | 57.50% | 71.60% | 0.879 | 34.19 | |
| PGD [18] | 640 | 27.50% | 47.10% | 52.90% | 30.70% | 57.40% | 70.30% | 0.881 | 34.24 | |
| GLH(,i) | - | 640 | 24.00% | 42.40% | 48.00% | 26.30% | 51.50% | 66.60% | 0.897 | 36.02 |
| I-FGSM [17] | - | 640 | 23.60% | 41.60% | 46.90% | 25.20% | 50.60% | 65.30% | 0.835 | 31.94 |
| PGD [18] | - | 640 | 22.70% | 40.10% | 45.70% | 24.30% | 49.10% | 63.70% | 0.831 | 32.09 |
| GLH(,i) | - | 640 | 20.30% | 36.70% | 42.00% | 21.10% | 44.80% | 60.30% | 0.859 | 34.03 |
| GLH(,i) | - | 640 | 8.80% | 17.80% | 20.90% | 5.80% | 19.90% | 34.90% | 0.700 | 27.82 |
| YOLOR-CSP [33] | YOLOv4-pacsp-s [38] | YOLOv5-s | YOLOX-s [37] | YOLOv6-s [39] | YOLOv7 [40] | |
|---|---|---|---|---|---|---|
| Backbone | DarkNet53 | DarkNet53 | DarkNet53 | DarkNet53 | EfficientRep | ELANNet |
| Base | 49.20% | 38.90% | 37.40% | 39.60% | 43.80% | 51.40% |
| YOLOR-CSP | 4.90% | 10.30% | 15.30% | 18.10% | 18.70% | 16.40% |
| DETR [41] | Efficientdet-d5 [42] | Mask R-CNN [43] | |
|---|---|---|---|
| Backbone | Resnet50 | EfficientNet | Resnet50 |
| Base | 42.00% | 50.00% | 30.90% |
| YOLOR-CSP | 15.70% | 22.00% | 8.50% |
| LFA | HFB | AP | SSIM | PSNR | |
|---|---|---|---|---|---|
| Clean | 0.492 | - | - | ||
| AGA | 0.053 | 0.668 | 24.81 | ||
| AGA | ✓ | 0.071 | 0.733 | 29.08 | |
| AGA | ✓ | 0.053 | 0.668 | 24.80 | |
| AGA | ✓ | ✓ | 0.070 | 0.733 | 29.08 |
Disclaimer/Publisher’s Note: The statements, opinions and data contained in all publications are solely those of the individual author(s) and contributor(s) and not of MDPI and/or the editor(s). MDPI and/or the editor(s) disclaim responsibility for any injury to people or property resulting from any ideas, methods, instructions or products referred to in the content. |
© 2023 by the authors. Licensee MDPI, Basel, Switzerland. This article is an open access article distributed under the terms and conditions of the Creative Commons Attribution (CC BY) license (https://creativecommons.org/licenses/by/4.0/).
Share and Cite
Chen, Y.; Yang, H.; Wang, X.; Wang, Q.; Zhou, H. GLH: From Global to Local Gradient Attacks with High-Frequency Momentum Guidance for Object Detection. Entropy 2023, 25, 461. https://doi.org/10.3390/e25030461
Chen Y, Yang H, Wang X, Wang Q, Zhou H. GLH: From Global to Local Gradient Attacks with High-Frequency Momentum Guidance for Object Detection. Entropy. 2023; 25(3):461. https://doi.org/10.3390/e25030461
Chicago/Turabian StyleChen, Yuling, Hao Yang, Xuewei Wang, Qi Wang, and Huiyu Zhou. 2023. "GLH: From Global to Local Gradient Attacks with High-Frequency Momentum Guidance for Object Detection" Entropy 25, no. 3: 461. https://doi.org/10.3390/e25030461
APA StyleChen, Y., Yang, H., Wang, X., Wang, Q., & Zhou, H. (2023). GLH: From Global to Local Gradient Attacks with High-Frequency Momentum Guidance for Object Detection. Entropy, 25(3), 461. https://doi.org/10.3390/e25030461