


Part-Aware Point Cloud Completion through Multi-Modal Part Segmentation


Abstract
:1. Introduction
- We introduce a novel multi-modal part assignment module aimed at addressing the scarcity of suitable datasets, enabling the aligned part segmentation of coarse point cloud and ground truth.
- We introduce a plug-in module along with a corresponding part loss function designed to guide the network in learning local structures, enhancing local details.
- Extensive experiments and visualizations demonstrate that our method achieves novel performance, significantly enhancing localized structures.
2. Related Work
2.1. Deep Learning-Based Point Cloud Completion
2.1.1. Folding-Based Decoding
2.1.2. Coarse-to-Fine Decoding
2.2. Point Cloud Part Segmentation
2.3. Multi-Modal Method of Point Cloud
3. Method
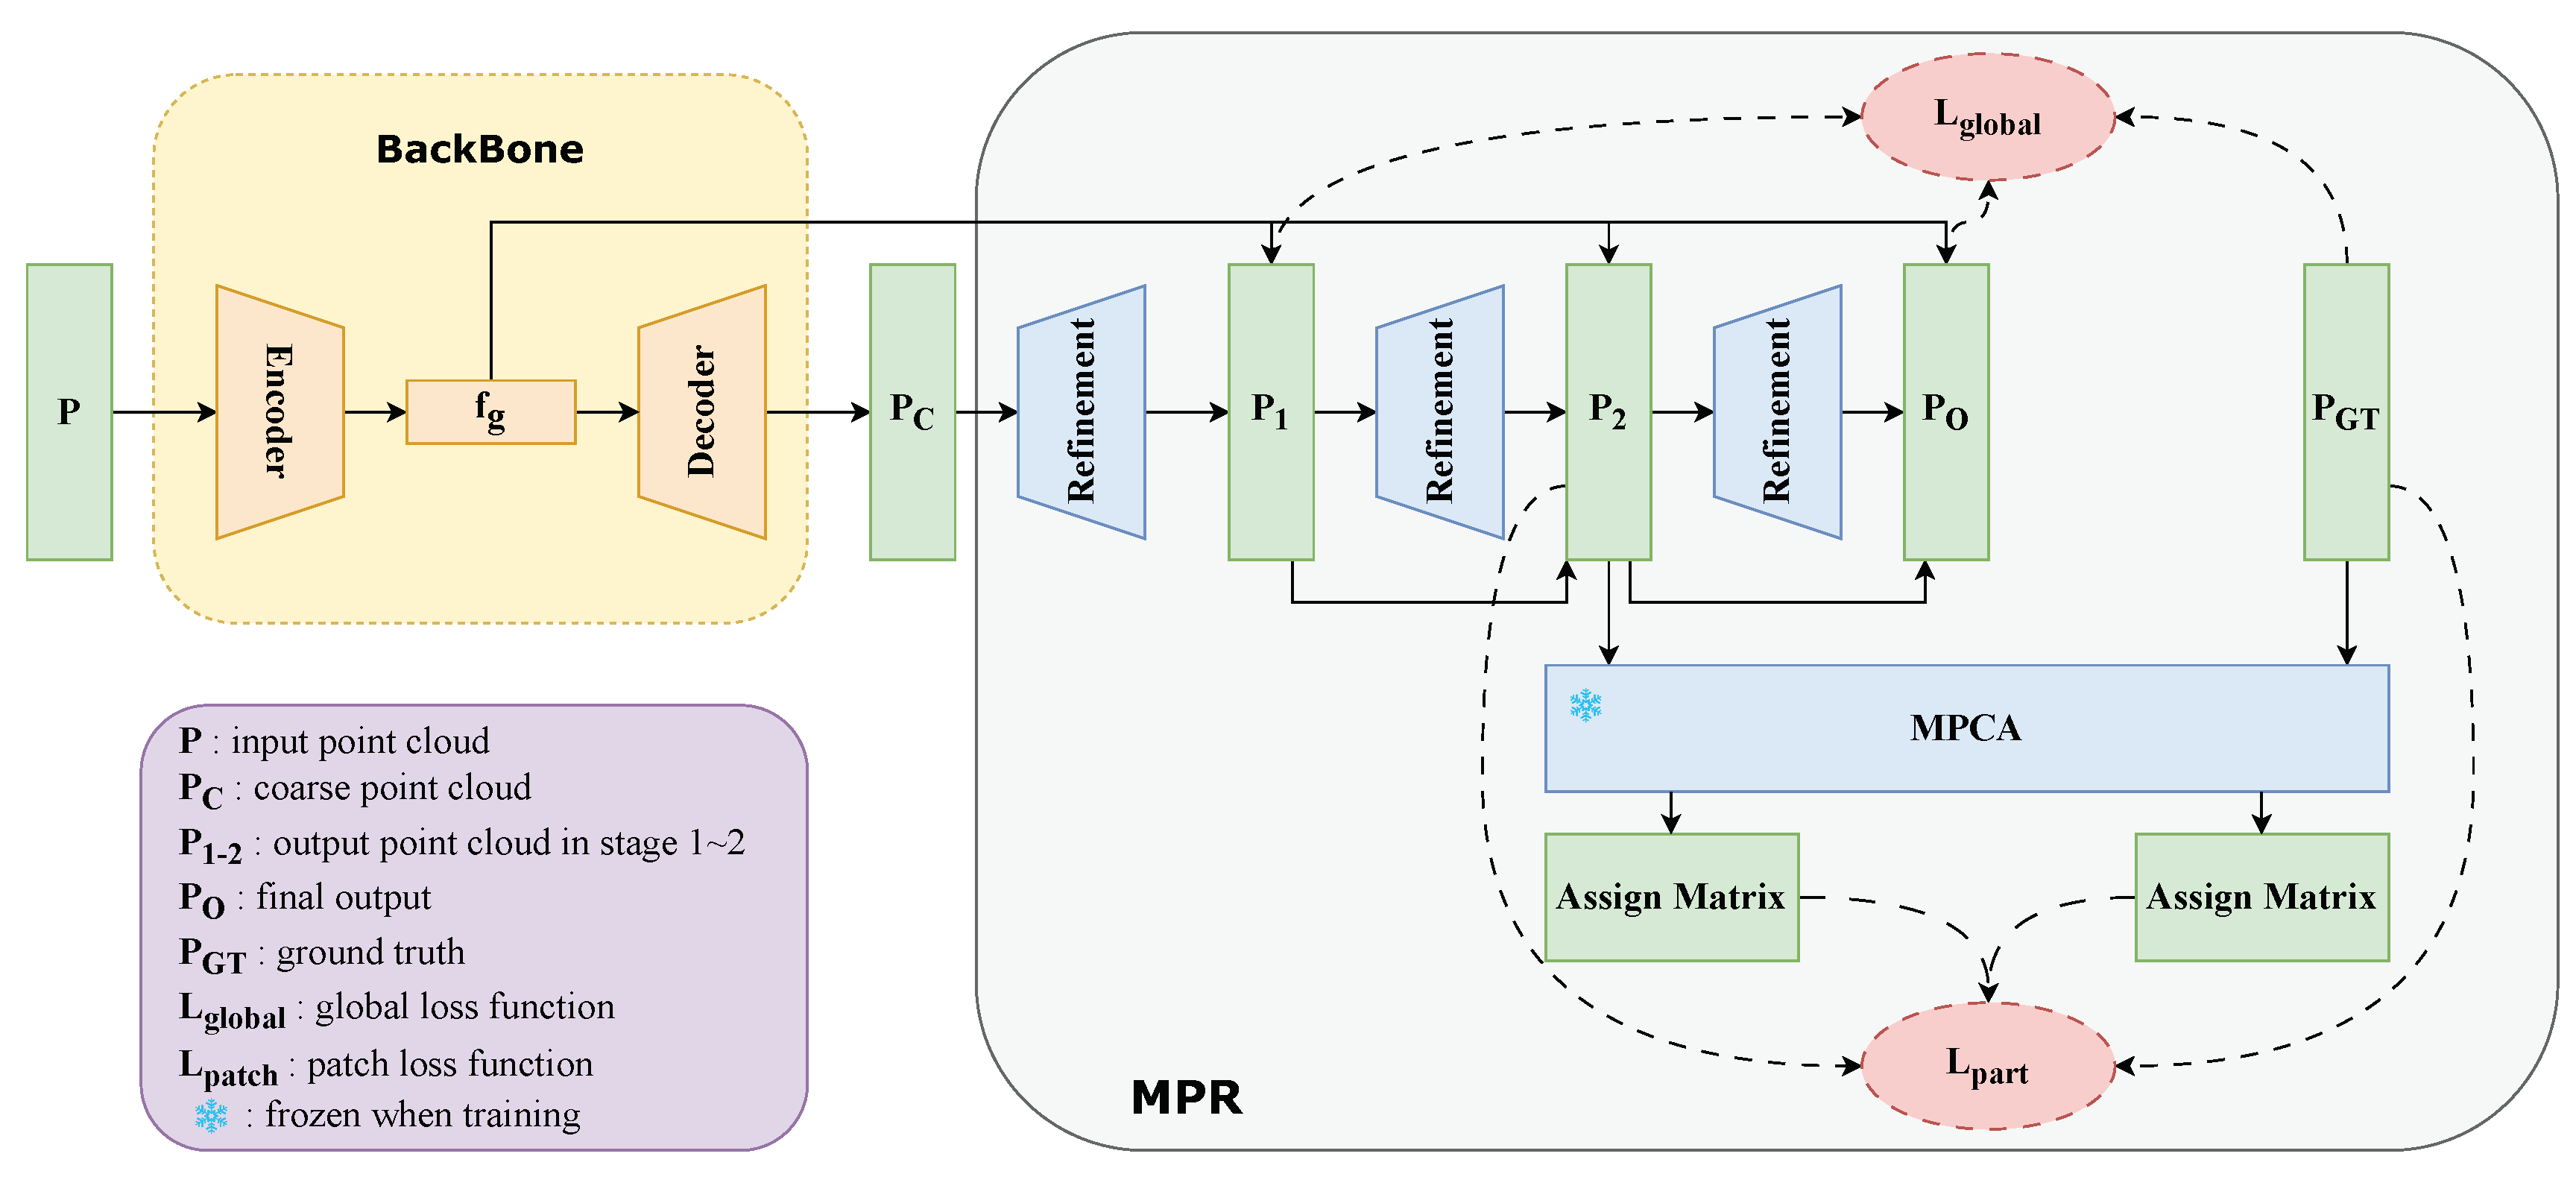
3.1. Overview
3.1.1. Backbone Network
3.1.2. MPR Module
3.2. Refinement Sub-Module
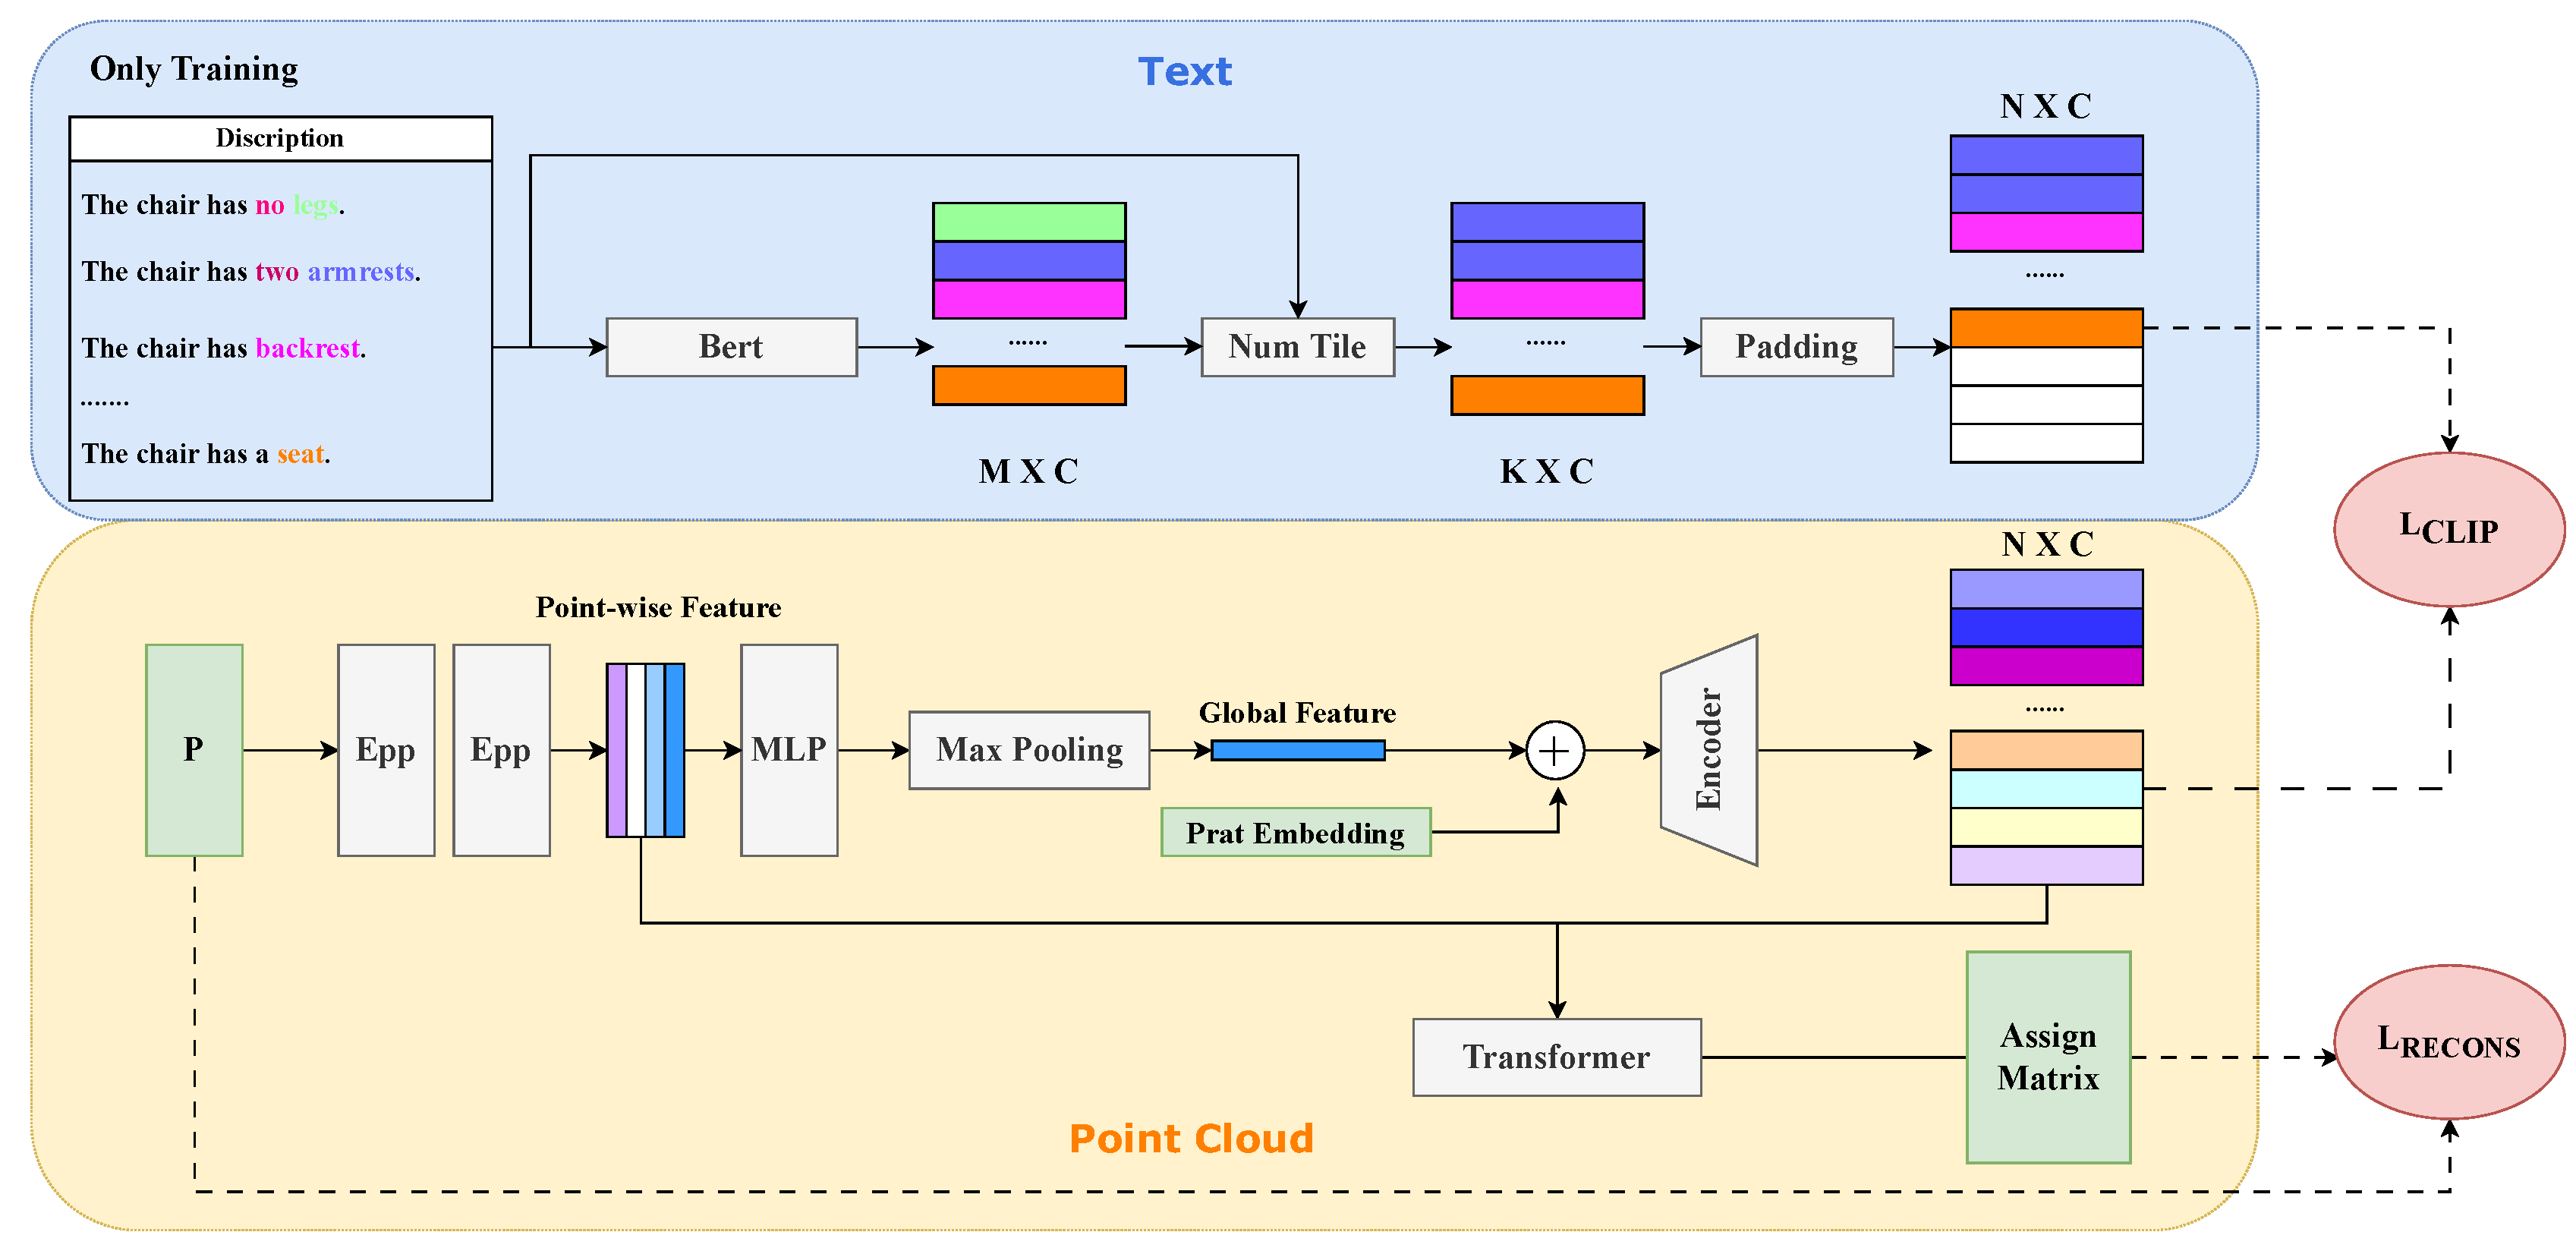
3.3. MPCA Module
3.3.1. Textual Embedding Generation
3.3.2. Framework
3.3.3. Loss Function of MPCA
3.4. Loss Function
3.4.1. Global Loss
3.4.2. Part Loss
4. Experiment
4.1. Experiment on MPCA Module
4.1.1. Dataset and Settings
Implementation Details
Dataset
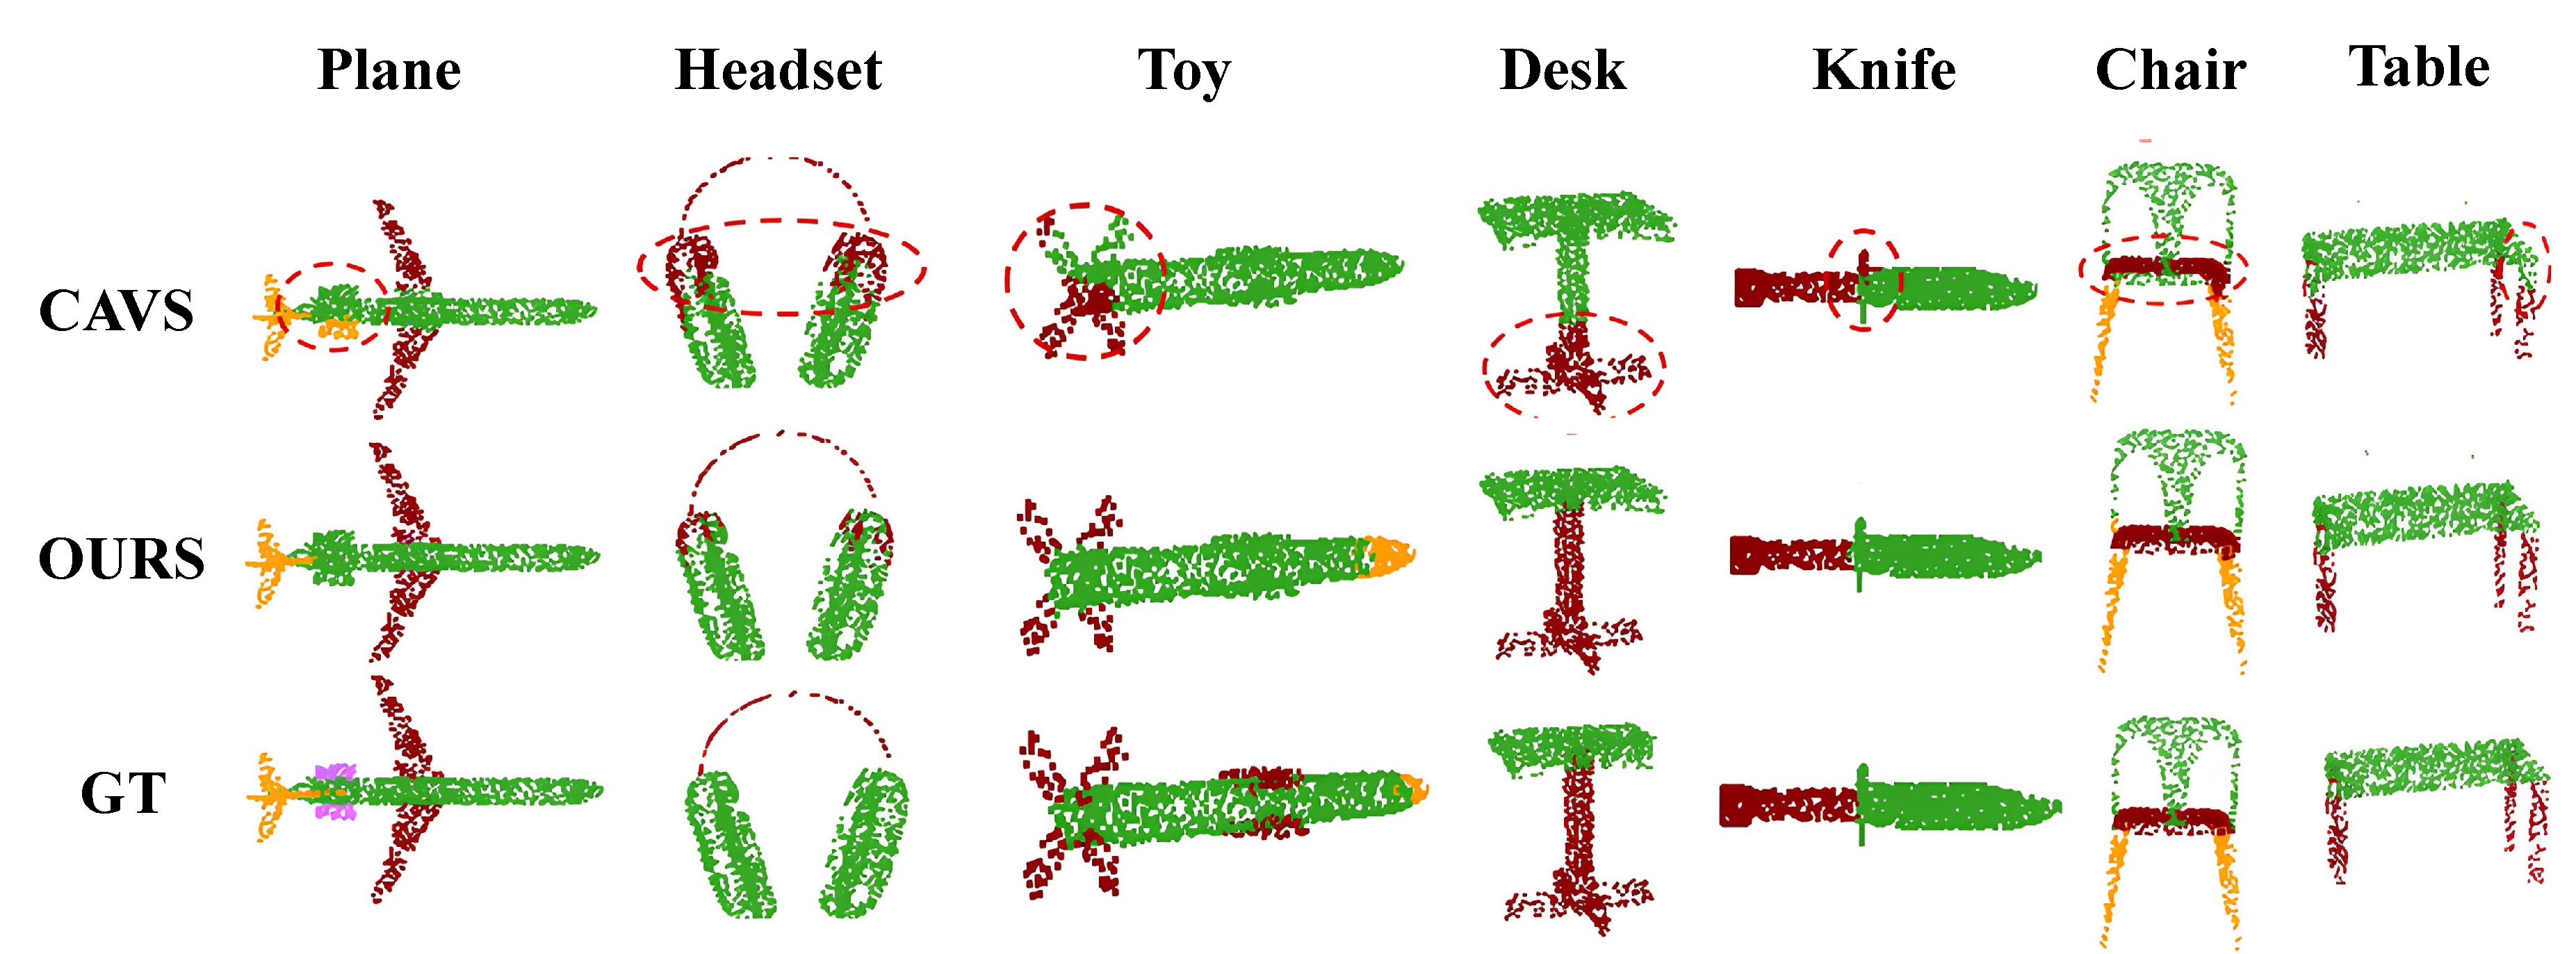
4.1.2. Visualization Results on ShapeNet-Part
4.1.3. Visualization Result on Completion3D Dataset
4.2. Experiment on Point Cloud Completion
4.2.1. Dataset and Settings
Implementation Details
Dataset
- The Completion3D dataset [33] comprises a total of 30,974 objects across eight categories, with each object containing an incomplete point cloud and its corresponding ground truth. Each complete point cloud consists of 2048 points, while the incomplete point cloud is obtained by back-projecting depth images into 3D space, resulting in a varying number of points. We divided the dataset into training, validation and test sets following the Completion3D protocol.
Evaluation Metric
4.2.2. Quantitative Analysis
Experiments on PCN Dataset
Experiments on Completion3D Dataset
Ablation Study
Plug-in Experiment
4.2.3. Visualization
Visualization Results on Completion3D
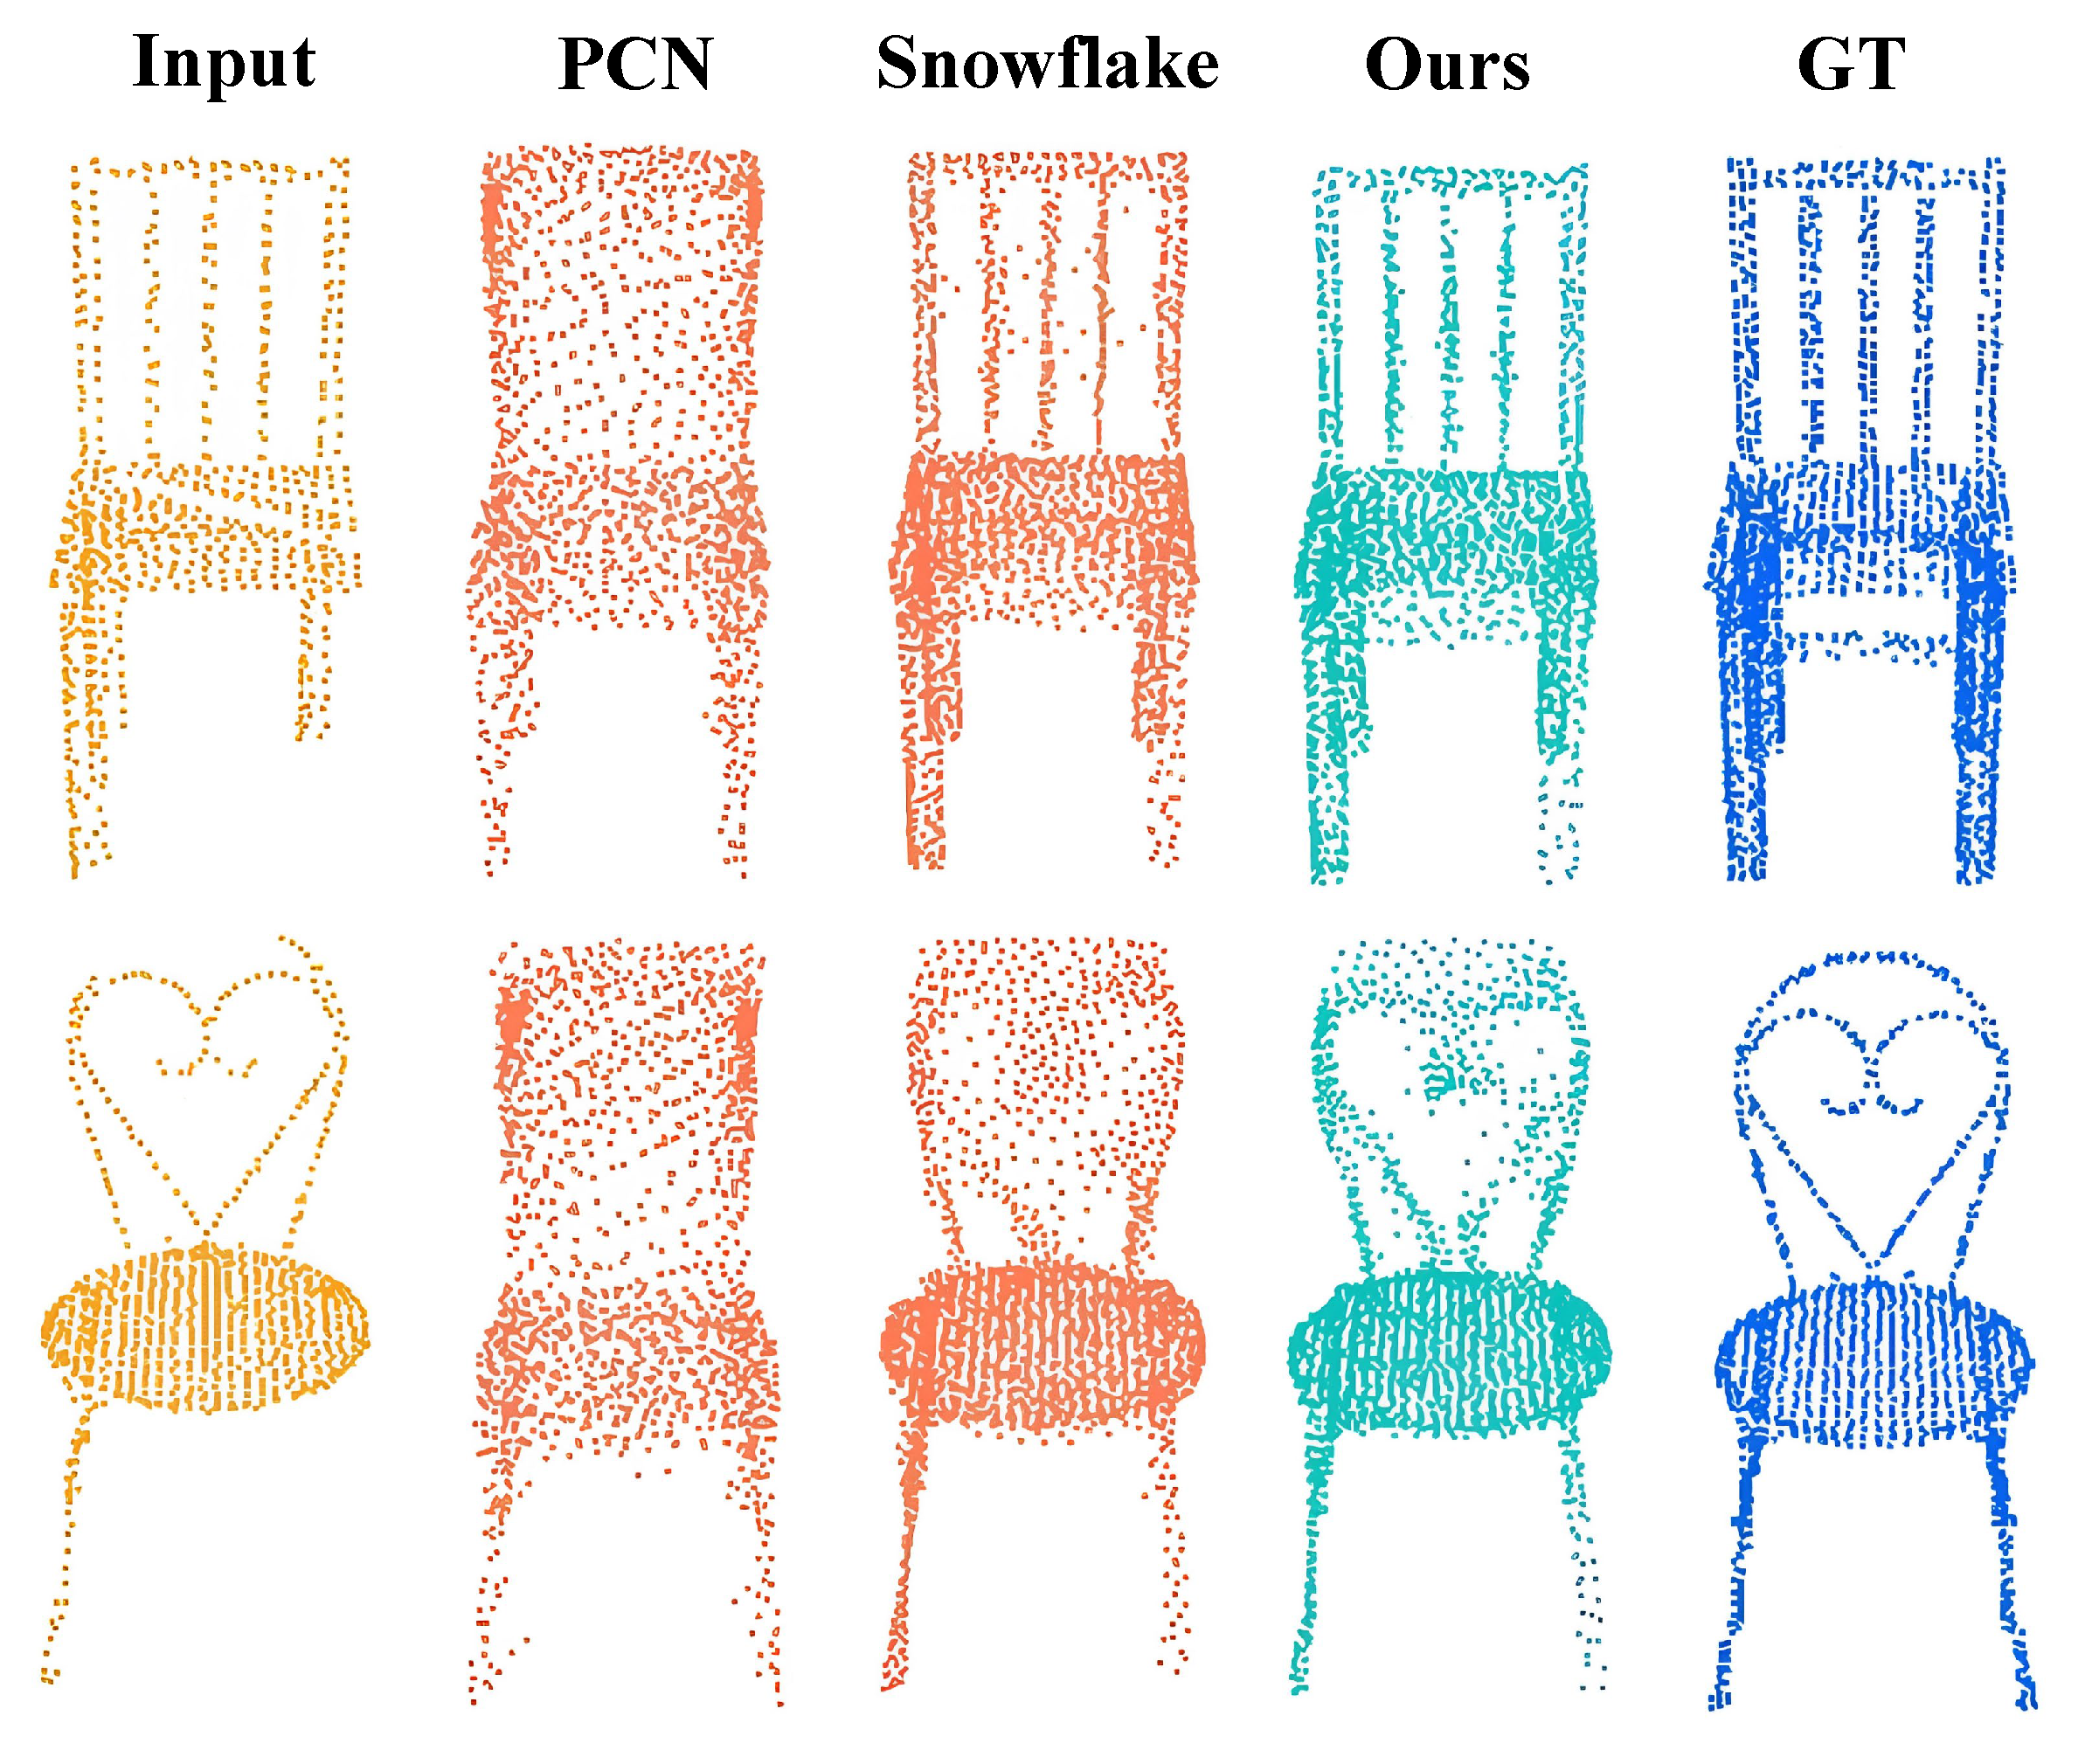
Visualization Result on Chair Category
5. Conclusions
Author Contributions
Funding
Data Availability Statement
Conflicts of Interest
References
- Wen, X.; Li, T.; Han, Z.; Liu, Y.S. Point cloud completion by skip-attention network with hierarchical folding. In Proceedings of the IEEE/CVF Conference on Computer Vision and Pattern Recognition, Seattle, WA, USA, 13–19 June 2020; pp. 1939–1948. [Google Scholar]
- Zhao, W.; Gao, S.; Lin, H. A robust hole-filling algorithm for triangular mesh. Vis. Comput. 2007, 23, 987–997. [Google Scholar] [CrossRef]
- Sorkine, O.; Cohen-Or, D. Least-squares meshes. In Proceedings of the Shape Modeling Applications, Genova, Italy, 7–9 June 2004; pp. 191–199. [Google Scholar]
- Han, X.; Li, Z.; Huang, H.; Kalogerakis, E.; Yu, Y. High-resolution shape completion using deep neural networks for global structure and local geometry inference. In Proceedings of the IEEE International Conference on Computer Vision, Venice, Italy, 22–29 October 2017; pp. 85–93. [Google Scholar]
- Litany, O.; Bronstein, A.; Bronstein, M.; Makadia, A. Deformable shape completion with graph convolutional autoencoders. In Proceedings of the IEEE Conference on Computer Vision and Pattern Recognition, Salt Lake City, UT, USA, 18–23 June 2018; pp. 1886–1895. [Google Scholar]
- Yang, Y.; Feng, C.; Shen, Y.; Tian, D. Foldingnet: Point cloud auto-encoder via deep grid deformation. In Proceedings of the IEEE Conference on Computer Vision and Pattern Recognition, Salt Lake City, UT, USA, 18–23 June 2018; pp. 206–215. [Google Scholar]
- Huang, Z.; Yu, Y.; Xu, J.; Ni, F.; Le, X. Pf-net: Point fractal network for 3d point cloud completion. In Proceedings of the IEEE/CVF Conference on Computer Vision and Pattern Recognition, Seattle, WA, USA, 14–19 June 2020; pp. 7662–7670. [Google Scholar]
- Zheng, W.; Han, Z. Snowflake point deconvolution for point cloud completion and generation with skip-transformer. IEEE Trans. Pattern Anal. Mach. Intell. 2023, 45, 6320–6338. [Google Scholar]
- Yuan, W.; Khot, T.; Held, D.; Mertz, C.; Hebert, M. Pcn: Point completion network. In Proceedings of the 2018 International Conference on 3D Vision (3DV), Verona, Italy, 5–8 September 2018; pp. 728–737. [Google Scholar]
- Chen, X.; Chen, B.; Mitra, N.J. Unpaired point cloud completion on real scans using adversarial training. arXiv 2019, arXiv:1904.00069. [Google Scholar]
- Gu, J.; Ma, W.C.; Manivasagam, S.; Zeng, W.; Wang, Z.; Xiong, Y.; Su, H.; Urtasun, R. Weakly-supervised 3D shape completion in the wild. In Proceedings of the Computer Vision–ECCV 2020: 16th European Conference, Glasgow, UK, 23–28 August 2020; Proceedings, Part V 16. Springer: Berlin/Heidelberg, Germany, 2020; pp. 283–299. [Google Scholar]
- Nie, Y.; Lin, Y.; Han, X.; Guo, S.; Chang, J.; Cui, S.; Zhang, J.J. Skeleton-bridged point completion: From global inference to local adjustment. Adv. Neural Inf. Process. Syst. 2020, 33, 16119–16130. [Google Scholar]
- Li, R.; Li, X.; Fu, C.W.; Cohen-Or, D.; Heng, P.A. Pu-gan: A point cloud upsampling adversarial network. In Proceedings of the IEEE/CVF International Conference on Computer Vision, Seoul, Republic of Korea, 27 October–2 November 2019; pp. 7203–7212. [Google Scholar]
- Zong, D.; Sun, S.; Zhao, J. ASHF-Net: Adaptive sampling and hierarchical folding network for robust point cloud completion. In Proceedings of the AAAI Conference on Artificial Intelligence, Virtually, 2–9 February 2021; Volume 35, pp. 3625–3632. [Google Scholar]
- Zhang, W.; Yan, Q.; Xiao, C. Detail preserved point cloud completion via separated feature aggregation. In Proceedings of the Computer Vision–ECCV 2020: 16th European Conference, Glasgow, UK, 23–28 August 2020; Proceedings, Part XXV 16. Springer: Berlin/Heidelberg, Germany, 2020; pp. 512–528. [Google Scholar]
- Wang, X.; Ang, M.H., Jr.; Lee, G.H. Cascaded refinement network for point cloud completion. In Proceedings of the IEEE/CVF Conference on Computer Vision and Pattern Recognition, Seattle, WA, USA, 14–19 June 2020; pp. 790–799. [Google Scholar]
- Wu, Z.; Song, S.; Khosla, A.; Yu, F.; Zhang, L.; Tang, X.; Xiao, J. 3D shapenets: A deep representation for volumetric shapes. In Proceedings of the IEEE Conference on Computer Vision and Pattern Recognition, Boston, MA, USA, 7–12 June 2015; pp. 1912–1920. [Google Scholar]
- Mo, K.; Zhu, S.; Chang, A.X.; Yi, L.; Tripathi, S.; Guibas, L.J.; Su, H. Partnet: A large-scale benchmark for fine-grained and hierarchical part-level 3d object understanding. In Proceedings of the IEEE/CVF Conference on Computer Vision and Pattern Recognition, Long Beach, CA, USA, 15–20 June 2019; pp. 909–918. [Google Scholar]
- Thomas, H.; Qi, C.R.; Deschaud, J.E.; Marcotegui, B.; Goulette, F.; Guibas, L.J. Kpconv: Flexible and deformable convolution for point clouds. In Proceedings of the IEEE/CVF International Conference on Computer Vision, Seoul, Republic of Korea, 27 October–2 November 2019; pp. 6411–6420. [Google Scholar]
- Yu, F.; Liu, K.; Zhang, Y.; Zhu, C.; Xu, K. Partnet: A recursive part decomposition network for fine-grained and hierarchical shape segmentation. In Proceedings of the IEEE/CVF Conference on Computer Vision and Pattern Recognition, Long Beach, CA, USA, 15–20 June 2019; pp. 9491–9500. [Google Scholar]
- Zhao, Y.; Birdal, T.; Deng, H.; Tombari, F. 3D point capsule networks. In Proceedings of the IEEE/CVF Conference on Computer Vision and Pattern Recognition, Long Beach, CA, USA, 15–20 June 2019; pp. 1009–1018. [Google Scholar]
- Alliegro, A.; Boscaini, D.; Tommasi, T. Joint supervised and self-supervised learning for 3d real world challenges. In Proceedings of the 2020 25th International Conference on Pattern Recognition (ICPR), Milan, Italy, 10–15 January 2021; pp. 6718–6725. [Google Scholar]
- Wang, Y.; Mao, Q.; Zhu, H.; Deng, J.; Zhang, Y.; Ji, J.; Li, H.; Zhang, Y. Multi-modal 3d object detection in autonomous driving: A survey. Int. J. Comput. Vis. 2023, 131, 2122–2152. [Google Scholar] [CrossRef]
- Su, H.; Maji, S.; Kalogerakis, E.; Learned-Miller, E. Multi-view convolutional neural networks for 3d shape recognition. In Proceedings of the IEEE International Conference on Computer Vision, Santiago, Chile, 7–13 December 2015; pp. 945–953. [Google Scholar]
- Michel, O.; Bar-On, R.; Liu, R.; Benaim, S.; Hanocka, R. Text2mesh: Text-driven neural stylization for meshes. In Proceedings of the IEEE/CVF Conference on Computer Vision and Pattern Recognition, New Orleans, LA, USA, 19–23 June 2022; pp. 13492–13502. [Google Scholar]
- Radford, A.; Kim, J.W.; Hallacy, C.; Ramesh, A.; Goh, G.; Agarwal, S.; Sastry, G.; Askell, A.; Mishkin, P.; Clark, J.; et al. Learning transferable visual models from natural language supervision. In Proceedings of the International Conference on Machine Learning, Virtual, 18–24 July 2021; pp. 8748–8763. [Google Scholar]
- Zhang, R.; Guo, Z.; Zhang, W.; Li, K.; Miao, X.; Cui, B.; Qiao, Y.; Gao, P.; Li, H. Pointclip: Point cloud understanding by clip. In Proceedings of the IEEE/CVF Conference on Computer Vision and Pattern Recognition, New Orleans, LA, USA, 18–24 June 2022; pp. 8552–8562. [Google Scholar]
- Huang, T.; Dong, B.; Yang, Y.; Huang, X.; Lau, R.W.; Ouyang, W.; Zuo, W. Clip2point: Transfer clip to point cloud classification with image-depth pre-training. In Proceedings of the IEEE/CVF International Conference on Computer Vision, Paris, France, 2–3 October 2023; pp. 22157–22167. [Google Scholar]
- Song, W.; Zhou, J.; Wang, M.; Tan, H.; Li, N.; Liu, X. Fine-grained Text and Image Guided Point Cloud Completion with CLIP Model. arXiv 2023, arXiv:2308.08754. [Google Scholar]
- Wang, H.; Schor, N.; Hu, R.; Huang, H.; Cohen-Or, D.; Huang, H. Global-to-local generative model for 3d shapes. ACM Trans. Graph. (TOG) 2018, 37, 1–10. [Google Scholar] [CrossRef]
- Yang, K.; Chen, X. Unsupervised learning for cuboid shape abstraction via joint segmentation from point clouds. ACM Trans. Graph. (TOG) 2021, 40, 1–11. [Google Scholar]
- Yi, L.; Kim, V.G.; Ceylan, D.; Shen, I.C.; Yan, M.; Su, H.; Lu, C.; Huang, Q.; Sheffer, A.; Guibas, L. A scalable active framework for region annotation in 3d shape collections. Acm Trans. Graph. (ToG) 2016, 35, 1–12. [Google Scholar] [CrossRef]
- Tchapmi, L.P.; Kosaraju, V.; Rezatofighi, H.; Reid, I.; Savarese, S. Topnet: Structural point cloud decoder. In Proceedings of the IEEE/CVF Conference on Computer Vision and Pattern Recognition, Long Beach, CA, USA, 15–20 June 2019; pp. 383–392. [Google Scholar]
- Xie, H.; Yao, H.; Zhou, S.; Mao, J.; Zhang, S.; Sun, W. Grnet: Gridding residual network for dense point cloud completion. In Proceedings of the European Conference on Computer Vision, Glasgow, UK, 23–28 August 2020; Springer: Berlin/Heidelberg, Germany, 2020; pp. 365–381. [Google Scholar]
- Wang, X.; Ang, M.H.; Lee, G.H. Voxel-based network for shape completion by leveraging edge generation. In Proceedings of the IEEE/CVF International Conference on Computer Vision, Montreal, QC, Canada, 10–17 October 2021; pp. 13189–13198. [Google Scholar]


| Method | Plane | Cabinet | Car | Chair | Lamp | Couch | Table | Watercraft | Average |
|---|---|---|---|---|---|---|---|---|---|
| PCN [9] | 6.03 | 21.67 | 11.12 | 8.73 | 10.68 | 11.53 | 12.04 | 10.23 | |
| TopNet [33] | 7.26 | 13.26 | 10.68 | 14.24 | 14.69 | 14.55 | 11.67 | 10.98 | 12.16 |
| GRNet [34] | 6.23 | 10.29 | 9.65 | 9.33 | 8.16 | 10.46 | 8.37 | 8.22 | 8.84 |
| Snowflake [8] | 4.35 | 9.32 | 8.52 | 7.51 | 6.21 | 9.42 | 6.42 | 6.78 | 7.32 |
| Ours | 4.41 | 9.14 | 8.52 | 7.09 | 6.19 | 9.65 | 6.13 | 6.82 | 7.24 |
| Method | Plane | Cabinet | Car | Chair | Lamp | Couch | Table | Watercraft | Average |
|---|---|---|---|---|---|---|---|---|---|
| PCN [9] | 9.68 | 21.04 | 12.87 | 24.76 | 22.14 | 20.02 | 19.93 | 11.92 | 17.80 |
| TopNet [33] | 7.29 | 18.38 | 12.69 | 19.34 | 14.28 | 16.12 | 14.78 | 8.86 | 13.96 |
| SA-Net [1] | 4.29 | 12.41 | 6.79 | 11.64 | 11.73 | 12.13 | 11.75 | 7.89 | 9.83 |
| GRNet [34] | 5.83 | 15.62 | 7.32 | 10.32 | 10.05 | 9.39 | 12.02 | 6.03 | 9.57 |
| VE-PCN [35] | 2.56 | 12.03 | 6.23 | 10.04 | 9.62 | 9.10 | 15.10 | 4.72 | 8.68 |
| Snowflake [8] | 2.08 | 11.55 | 5.94 | 10.48 | 9.71 | 8.40 | 13.93 | 4.90 | 8.37 |
| Ours | 2.25 | 11.35 | 6.08 | 10.06 | 9.52 | 8.70 | 12.32 | 4.71 | 8.13 |
| Global Loss | Part Loss | Airplane | Cabinet | Car | Chair | Lamp | Couch | Table | Watercraft | Average |
|---|---|---|---|---|---|---|---|---|---|---|
| ✗ | ✓ | 2.07 | 11.6 | 6.17 | 10.54 | 9.85 | 9.38 | 12.66 | 4.63 | 8.39 |
| ✓ | ✗ | 2.08 | 11.55 | 5.94 | 10.48 | 9.71 | 8.40 | 13.93 | 4.90 | 8.37 |
| ✓ | ✓ | 2.25 | 11.35 | 6.08 | 10.06 | 9.52 | 8.70 | 12.32 | 4.71 | 8.13 |
| Method | Plane | Cabinet | Car | Chair | Lamp | Couch | Table | Watercraft | Average |
|---|---|---|---|---|---|---|---|---|---|
| PCN [9] | 9.68 | 21.04 | 12.87 | 24.76 | 22.14 | 20.02 | 19.93 | 11.92 | 17.80 |
| PCN + MPR | 8.32 | 16.03 | 11.06 | 22.04 | 18.32 | 17.63 | 16.67 | 10.96 | 15.32 |
| Snowflake [8] | 2.08 | 11.55 | 5.94 | 10.48 | 9.71 | 8.40 | 13.93 | 4.90 | 8.37 |
| Snowflake + MPR | 2.25 | 11.35 | 6.08 | 10.06 | 9.52 | 8.70 | 12.32 | 4.71 | 8.13 |
Disclaimer/Publisher’s Note: The statements, opinions and data contained in all publications are solely those of the individual author(s) and contributor(s) and not of MDPI and/or the editor(s). MDPI and/or the editor(s) disclaim responsibility for any injury to people or property resulting from any ideas, methods, instructions or products referred to in the content. |
© 2023 by the authors. Licensee MDPI, Basel, Switzerland. This article is an open access article distributed under the terms and conditions of the Creative Commons Attribution (CC BY) license (https://creativecommons.org/licenses/by/4.0/).
Share and Cite
Yu, F.; Tian, R.; Wang, X.; Liang, X. Part-Aware Point Cloud Completion through Multi-Modal Part Segmentation. Entropy 2023, 25, 1588. https://doi.org/10.3390/e25121588
Yu F, Tian R, Wang X, Liang X. Part-Aware Point Cloud Completion through Multi-Modal Part Segmentation. Entropy. 2023; 25(12):1588. https://doi.org/10.3390/e25121588
Chicago/Turabian StyleYu, Fuyang, Runze Tian, Xuanjun Wang, and Xiaohui Liang. 2023. "Part-Aware Point Cloud Completion through Multi-Modal Part Segmentation" Entropy 25, no. 12: 1588. https://doi.org/10.3390/e25121588
APA StyleYu, F., Tian, R., Wang, X., & Liang, X. (2023). Part-Aware Point Cloud Completion through Multi-Modal Part Segmentation. Entropy, 25(12), 1588. https://doi.org/10.3390/e25121588