Abstract
We evaluated the transport properties of a bacterial cellulose (BC) membrane for aqueous ethanol solutions. Using the Rr version of the Kedem–Katchalsky–Peusner formalism (KKP) for the concentration polarization (CP) conditions of solutions, the osmotic and diffusion fluxes as well as the membrane transport parameters were determined, such as the hydraulic permeability (Lp), reflection (σ), and solute permeability (ω). We used these parameters and the Peusner () coefficients resulting from the KKP equations to assess the transport properties of the membrane based on the calculated dependence of the concentration coefficients: the resistance, coupling, and energy conversion efficiency for aqueous ethanol solutions. The transport properties of the membrane depended on the hydrodynamic conditions of the osmotic diffusion transport. The resistance coefficients , , and were positive and higher, and the coefficient was negative and lower under CP conditions (higher in convective than nonconvective states). The energy conversion was evaluated and fluxes were calculated for the U-, F-, and S-energy. It was found that the energy conversion was greater and the S-energy and F-energy were lower under CP conditions. The convection effect was negative, which means that convection movements were directed vertically upwards. Understanding the membrane transport properties and mechanisms could help to develop and improve the membrane technologies and techniques used in medicine and in water and wastewater treatment processes.
1. Introduction
Membranes exert multiple functions, including protective, regulatory, and coordinating functions [1]. The protective and regulatory functions are based on the membrane selectivity of a barrier that regulates the transport between the interior of a system and its surroundings [2]. The separation properties of synthetic polymer membranes enable their application in many fields of science, technology, and medicine, such as food production, water treatment, hemodialysis, wastewater treatment, and membrane dressings [1,3]. The coordinating function seems to apply only to biological systems, where the membrane simultaneously plays the role of a receiver, regulator, and coordinator of environmental signals, which are the driving forces of membrane transport [4]. These driving forces cause various types of physical fields, such as concentration, pressure, temperature, or electric potentials, which participate in shaping the field character of nature [5,6].
Selective permeability is one of the basic properties of porous media, including polymeric membrane-forming materials. It is required for large-scale models of fluid flow and mass transport. These models operate within the framework of nonequilibrium thermodynamics, hydrodynamics, and statistical physics [7]. The last 20 years have seen a significant increase in the use of modeling to study multiphase flow and transport in porous media. Starting with models of fluid systems in single pores, calculations of the relative permeability, interfacial area, dissolution rate, and many other physical properties have been carried out [8]. One of the more interesting methods for pore-scale numerical studies is direct hydrodynamic simulation (DHD) technology [9], which uses a description of the dispersed interface and is applied to various fluid–rock or fluid–fluid interactions for equal rheological conditions.
In the paper [10], a stochastic method based on simulated annealing and X-ray microtomography was used to study the pore structures of various porous solids that differ in pore space morphology and topology. In the process of verifying the developed models, many interesting simulation and experimental results were obtained, which confirmed the pore space models. In addition, it was shown that predictions based on tomographic pore space models were more effective than stochastic models and that the time-dependent effective diffusivity is particularly sensitive to small morphological deviations between the actual and reconstructed pore structures. It was also shown that the combined prediction of the effective permeability, effective pore size, geometric coefficient, and time-dependent effective water diffusivity is needed to reliably evaluate pore space reconstruction.
The paper [11] presented a description of volume membrane transport using the Kedem–Katchalsky equations of homogeneous aqueous solutions of ethanol and glucose. The flows generated by the hydrostatic pressure differential, the osmotic pressure differential, and the simultaneous action of these two thermodynamic drives were analyzed independently. In addition, a formula for the membrane filtration coefficient was presented, taking into account the density and viscosity of ethanol, and the corresponding calculations were made. In this way, it was shown that the membrane filtration coefficient depends on both the membrane properties and the flowing fluid. In turn, the paper [12] presented formulas for calculating the viscosity and diffusion coefficients of binary aqueous nonelectrolyte solutions as a function of the solution concentration under isothermal conditions. In the process of verifying the obtained formulas, the dependence of the diffusion coefficient, filtration coefficient, and dynamic viscosity coefficient for these solutions on the solution concentration was calculated. Based on the obtained formulas, the results of calculations of the diffusion coefficient, membrane filtration coefficient, and dynamic viscosity of aqueous solutions of ethanol and glucose were presented.
Processes such as diffusion or osmosis can modify physical fields, including concentration fields. In addition, a concentration field can be modified by the concentration polarization (CP) as a consequence of the creation of the concentration boundary layers (CBLs) and on both sides of the membrane [5,13]. The thickness of CBL is , and the thickness of CBL is . As a consequence of the CBL formation, the concentration difference decreases from the value of – to the value of , where > , > , and > , and the density difference increases from − to the value of , where > , > , and > . When a lower density solution is placed in the compartment under the membrane and a higher density solution is placed in the compartment above the membrane, the complex /M/ loses its hydrodynamic stability. Hydrodynamic instability is manifested by natural convection in near-membrane areas [13,14,15].
Then, the concentration Rayleigh number (), which controls the process of the appearance of gravitational convection, exceeds its critical value, and hydrodynamic instabilities appear in the near-membrane areas [5,14,16,17,18]. Over time, the destructive effect of gravitational convection limits the growth of and and accelerates the diffusion of substances beyond the layers, which extends the effect of convection to the entire volume of the solution. Under certain conditions, even self-organization of the liquid may occur, which is manifested in the ”plum structure” [19]. The creation of CBLs can be visualized by a Mach–Zehnder laser interferometer [14]. The consequence of CP is a significant reduction in concentration gradients, as evidenced by the minimization of the osmotic and diffusion fluxes of dissolved substances and the membrane potentials [6,13,15]. Under certain conditions, depending on the compositions of the solutions and the orientation of the artificial biomembrane in relation to the gravity vector, concentration gradients can be reconstructed by gravitational convection [6,13,20]. The basic research tools for describing membrane transport are the Kedem–Katchalsky (KK) equations, both the classical version [3,21] and the modified forms [13,16,22]. For the concentration polarization conditions of the solutions, the equations have the form
where , , and are the hydraulic permeability, reflection, and solute permeability coefficients; = − and = are the hydrostatic and osmotic pressure differences ( is the product of the gas constant and temperature, = − , and are the solutes concentrations, and is the solution concentration difference); and are the volume and solute fluxes; σ is the reflection coefficient; is the permeability coefficient of the solute; = ( − )[ln (−1)]−1 is the average concentration of the solutes; and , , , and are, respectively, the hydraulic, osmotic, diffusive, and advective coefficients of the CP [23]. For dilute nonelectrolyte solutions, = . In contrast, for nondilute solutions, ≠ [16].
From Equations (1) and (2), the phenomenological coefficients of homogeneous solutions ( = = = = 1) are defined as follows:
The tetrad of membrane transport parameters (, , , and ) play the roles of proportionality coefficients. The coefficients , , and play similar roles. The products , , and determine the transport properties of the membrane complex and the concentration boundary layers.
The values of the , and coefficients, for isotropic and electrically neutral artificial membranes and for dilute solutions, are constant. Examples of such membranes are those made of regenerated cellulose (Nephprophan and Cuprophan) and bacterial cellulose (Biofill) [24,25,26]. The values of these coefficients for compound and ion-exchange membranes (Nafion and Textus bioactiv) are concentration-dependent [27,28,29,30].
The Kedem–Katchalsky–Peusner (KKP) equations are the network forms of the KK equations proposed by L. Peusner, which are obtained by means of the symmetrical or hybrid transformations proposed by Peusner network thermodynamics [25]. These equations contain the Peusner coefficients (), which for the conditions of homogeneity of solutions are a combination of the phenomenological coefficients of the membrane (Lp, σ, and ω) and the average concentration of the solutions ().
In previous papers [24,31], we showed descriptions of the membrane transport of binary solutions of nonelectrolytes under conditions of heterogeneity of solutions by introducing the forms of the KKP equations and the versions of the KKP equations for binary solutions of nonelectrolytes for the conditions of solution homogeneity. Here, we evaluated the transport properties of a membrane for aqueous ethanol solutions and the conditions of CP using network KKP equations. We experimentally determined the time and concentration characteristics of the volume () and solute () fluxes for conditions of homogeneity and CP. Next, we calculated the time and concentration dependencies of the CP coefficients ( and ) and resistance coefficients ( and i, j ∈ {1, 2}, r = A, B). We used , and to calculate the energy conversion efficiency coefficients (() and the flux of dissipated energy (S-energy) ((). Then, we used ( and ( to calculate the flux of free energy (F-energy) (() and the flux of internal energy (U-energy) (().
2. Materials and Methods
2.1. Membrane System
The system used as a model to study membrane transport, illustrated schematically in Figure 1, consisted of a membrane (M) situated in the horizontal plane and separating two aqueous solutions of ethanol with concentrations at the initial moment of and = constant ( ≥ ). The density of the solutions with concentrations of and fulfilled the condition ≤ = constant. In configuration A, a solution with the concentration was located in the compartment above the membrane and a solution with the concentration was in the compartment under the membrane. In configuration B, the solutions with the concentrations of and were swapped.
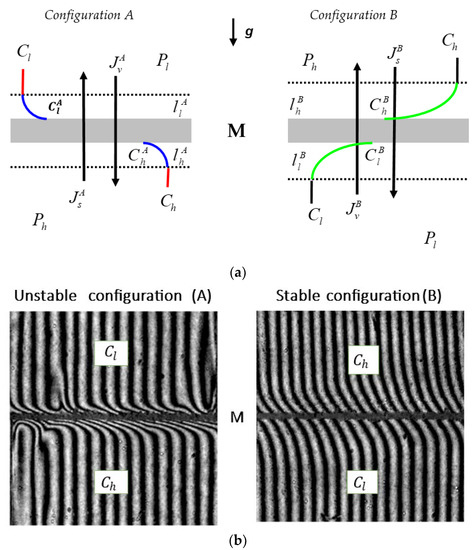
Figure 1.
(a) The model of a single-membrane system: M—membrane; g—gravitational acceleration; and —the concentration boundary layers (CBLs) in configuration A; and —the CBLs in configuration B; Ph and Pl—mechanical pressures; and —total solution concentrations ( > ); , , , and —local (at boundaries between the membrane and CBLs) solution concentrations; —solute and volume fluxes in configuration A; —solute and volume fluxes in configuration B. (b) Interferometric images of concentration boundary layers for a membrane system that contains ethanol solutions of concentrations = 1 mol⋅m−3 and = 125 mol⋅m−3 at time 80 s; M—membrane [14].
The study on volume () and solute () fluxes was carried out using the measuring set described in the paper [32] and is presented in Figure 2. It consisted of two cylindrical measuring vessels with volumes of 200 cm3 each containing aqueous ethanol solutions, one with a concentration in the range of 1–501 mol m−3 and the other with a constant concentration of 1 mol⋅m−3. The solutions in the vessels were separated by a previously described bacterial cellulose (BC) membrane called Bioprocess® (Biofill Produtos Biotechnologicos S.A., Curitiba, Brasile) [33,34,35,36] positioned in a horizontal plane with an area of A = 3.36 cm2. The BC membrane was produced in flat sheets, and its structure was made of microcellulose fibers produced by Acetobacter Xylinum [8,37].
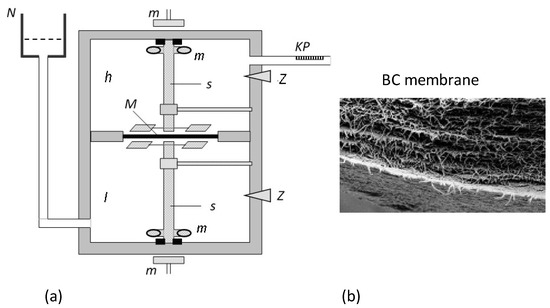
Figure 2.
(a) Measuring system (h and l—measuring vessels, N—external solution tank, s—mechanical stirrers, M—membrane, K—calibrated pipette, m—magnets, Z—plugs) [33]. (b) Image of a cross section of a Bioprocess membrane obtained from a scanning electron microscope (magnification: 10,000 times) [37].
The volume flux was calculated based on the volume changes () in the pipette over time (Δt) through the membrane surface (A) using the formula = ()−1()−1. The solute flux was calculated based on the formula = −1()−1, where is the volume of the measuring vessel and is the increase in the total concentration of the solutions. The was measured by a Rayleigh interferometer based on previously calculated feature curves, i.e., the experimental dependence of the shift of the interference bars (n) as a function of the ethanol concentration (C) [38]. The study was carried out at = 295 K. A laser interferometry method can also be used to determine [39,40,41].
We measured and under intense mechanical stirring of the solutions at 500 rpm, and when steady-state flows were obtained, the stirring of the solutions was turned off. In the second step, the increments of and were measured until steady-state flows were obtained. The volume flux was from a vessel with a lower concentration of solutions to a vessel with a higher concentration of solutions, and the solute flux was in the opposite direction. The and were measured in a series of independent experiments. From the measurements of and , the characteristics = f(t) and = f(t) were determined for different concentrations of ethanol solutions. For each characteristic, three independent experiments were performed. The relative error in the determination of = f(t) and = f(t) was no greater than 10%.
Based on the time characteristics of and for the steady state, we calculated the concentration characteristics of and . Next, we used the characteristics = f(t) (for the homogeneity of solutions) and = f(t) (for the conditions of CP) to calculate the dependence ). Similarly, we used the characteristics of = f(t) (for the homogeneity of solutions) and = () (for CP conditions) to calculate the dependence = f(t). Additionally, the dependence ) was determined based on the characteristics = f(ΔC) (for the homogeneity conditions of solutions and = f() for CP conditions. Similarly, the dependence ) was determined based on the characteristics = f() for the conditions of CP and = f() for CP conditions. Moreover, the dependences ), ), ), ), ), and ) were calculated.
2.2. The Rr Form of Kedem–Katchalsky Equations for Binary Nonelectrolyte Solutions
For the interpretation of the obtained results, we used the Rr form of the KKP equations, which can be obtained using simple algebraic transformations presented in the paper [24,31]:
The above equations can be written in matrix form:
wre is the matrix of resistance coefficients given by
From the above equation, it follows that ≠ and that the matrix determinant is equal to
To write Equations (3)–(7) for the homogeneity conditions of the solutions, it is enough to leave the ‘r’ index and assume = = = = 1. Then, we have = and = .
The first part of the right-hand side of Equation (4) has the sense of the membrane Peclét number [42]. The classical definition of this number has the form = and appears in Equation (4) for conditions of homogeneity of solutions ( = = 1, = , and = ). In this equation ≡ α is the Peclét coefficient and is the solute permeability coefficient. For conditions of concentration polarization, this number can be written in the form
where and is expressed in s m−1.
The second part of the right side of Equation (3) is similar to the membrane Peclét number. However, in this case, the definition of this number has the form = and appears in Equation (3) for conditions of homogeneity of solutions ( = = 1, = , and = ). For conditions of concentration polarization, this number can be written in the form
where = and is expressed in m2s mol−1.
It follows that the coefficients = , = , = and = (r = A, B) are related to Peclét’s coefficients, which are known from the literature [24,42].
Using the coefficients , , and , it is possible to define the coefficients and , which are measures of the CP effect, and the coefficients and , which are measures of the effect of gravitational convection in osmotic and diffusive membrane transport. The definitions of these coefficients can be written as
The coefficients and are measures of the distance of the membrane system from the CP state, and the coefficients and are measures of the distance of the membrane system from the unstable state.
In thermodynamic systems, including membrane systems, U-energy can be converted into F-energy and S-energy (TS) [3,22]. If the solutions contain a solvent and one solute, the flux of S-energy for the CP conditions () is described by the equation [5]
where is the global S-energy for CP conditions, is the S-energy produced by , and is the S-energy produced by .
Taking into account Equations (3) and (4), in Equation (14) we obtain
An explicit form of the coefficients , , , and appearing in the above equation is given in Equation (6). To obtain a global S-energy for the conditions of homogeneity of solutions () in Equations (14) and (15), one should assume the condition of = = = = 1. In turn, from Equation (6), the coefficients , and can be expressed using the coefficients .
Using the definition proposed by Kedem and Caplan [43] and Peusner [30], we present the definitions of the energy conversion efficiency coefficients for CP conditions:
where is the coupling coefficient [30,43]. To obtain the expressions for and , it is enough to omit the superscripts “r” due to the fact that ≈ , = , ≠ , and = . In turn, to obtain the expressions for and , it is enough to omit the superscripts “r” due to the fact that ≈ = , ≈ , and = .
According to the first law of thermodynamics, for isothermal isochoric processes, the following equation is correct:
where is the flux of dissipated energy (S-energy), is the flux of free energy (F-energy), and is the flux of internal energy (U-energy). All of these fluxes are expressed in Wm−2.
We calculate the fluxes and using the expression below:
Transforming this expression, we obtain
The transport properties of the BC membrane were determined by the hydraulic permeability (), reflection (), and solute permeability () coefficients. The values of these coefficients, determined in a series of independent experiments that were carried out according to a previously described procedure [14], were = (62.8 ± 0.5) × 10−12 m3 N−1s−1, = (0.23 ± 0.01) × 10−2, and = (15.3 ± 0.5) × 10−10 mol N−1s−1.
3. Results and Discussion
3.1. The Time and Concentration Dependencies of and
The time dependencies of the volume flux () and the solute flux () for = 501 mol m−3 and = 1 mol m−3 are shown in Figure 3a,b. Curves 1A and 1B were obtained for mechanically stirred solutions that favored solution homogeneity. Curves 1A and 1B are symmetrical with respect to the horizontal axes passing through the points = 0 and = 0, indicating that stirring was effective. This symmetry is reflected in the linearity of the dependences and , as illustrated by curves 1A and 1B in Figure 3c,d. In steady states, the relations = = and = = were fulfilled. In CP conditions, the time dependencies of and shown by curves 2A and 2B, are asymmetric with respect to the horizontal axes passing through the points = 0 and = 0. The consequence of this asymmetry is the nonlinear dependencies and illustrated by curves 2A and 2B in Figure 3c,d. The shapes of these graphs indicate that both and reached steady states relatively quickly and that in the steady states > and > . This dependence was a consequence of the emergence of gravitational convection, which is destructive to CBLs. This means that, in this case, CP and gravitational convection were antagonistic processes.
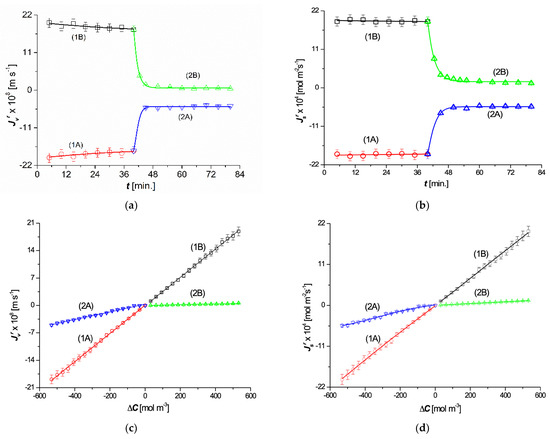
Figure 3.
Dependences (a), (b), (c), and (d): curves 1A and 1B were obtained for homogeneous solutions (mechanical mixing), and curves 2A and 2B were obtained for concentration polarization conditions (after excluding mechanical mixing of the solutions).
The characteristics of , , and presented in Figure 3a–d, illustrated by plots 2B, are typical for solutions whose densities decrease with increasing concentrations and CP conditions. Examples include aqueous solutions of ethanol, methanol, or ammonia [13]. If an aqueous solution of such a substance is placed in the compartment above the membrane (configuration B), a stable system of CBLs is formed, which causes a reduction in the value of the osmotic pressure difference, which results in the and fluxes. In configuration A, which refers to the situation when an aqueous solution of such a substance is placed in a compartment under the membrane, natural convection occurs, which decreases the reduction in the value of the osmotic pressure difference and causes fluxes and .
3.2. The Time and Concentration Dependencies of and
The time dependencies of and were calculated based on the results illustrated in Figure 4a,b. According to the definitions of = / and = /, to obtain the dependencies presented in Figure 4a, = and = for = 500 mol m−3. The coefficients and take their values from the intervals ≤ ≤ 1, ≤ ≤ 1, ≤ ≤ 1, and ≤ ≤ 1. As shown in Figure 4a, and take values from the intervals 0.03 ≤ ≤ 1, 0.26 ≤ ≤ 1, 0.06 ≤ ≤ 1, and 0.29 ≤ ≤ 1. Based on these time dependencies, the concentration dependencies = f() and = f() were determined for the steady states (Figure 4b). The coefficients and take their values from the intervals ≤ ≤ and ≤ ≤ . As shown in Figure 4b, and take their values in the range between 0.03 ≤ ≤ 0.26 and 0.06 ≤ ≤ 0.29. Therefore, the coefficients and are a measure of the CP in both convection and nonconvection states.
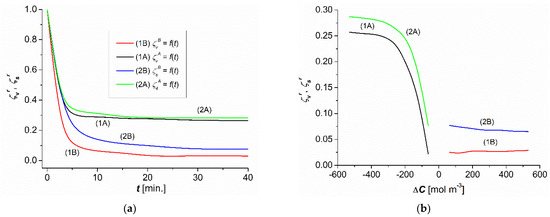
Figure 4.
Time (a) and concentration (b) dependences of and for aqueous ethanol solutions.
The transition from nonconvective to convective states is controlled by the Rayleigh concentration number (). The critical value of this number can be calculated from Equation (18):
where is the gravitational acceleration, D is the diffusion coefficient in the solution, is the mass density, is the kinematic viscosity of the solution, is the solute permeability coefficient through the membrane, is the variation in density with concentration, and is the concentration polarization coefficient.
Considering = 9.81 m s−2, = 24.51 × 10² J mol−1, = 998.2 kg m−3, = 1.01 × 10⁻⁶ m2s−1, = 1.53 × 10⁻⁹ mol N−1s−1, = 1.07 × 10⁻⁹ m2s−1, = −0.009 kg mol−1, = 80 mol m−3, and = 0.16 (estimated based Figure 4b) in Equation (19), we obtain = −1155.07. The minus sign indicates that the convective currents are directed vertically upwards. In contrast, for aqueous glucose solutions, studied previously, convective currents were directed vertically downwards, and therefore had a positive sign [5]. The obtained critical value of is consistent with the values presented in the papers [44,45].
3.3. Concentration Dependencies of the Resistance Coefficients and
The concentration dependencies of the resistance coefficients , , , and , calculated based on Equations (6) and (7), are shown in Figure 5a–d for homogenous solutions (curves 1A and 1B) and CP conditions (curves 2A and 2B). For all studied dependences of the resistance coefficients, curves 1A and 1B were symmetrical, whereas curves 2A and 2B were asymmetrical with respect to the point = 0.
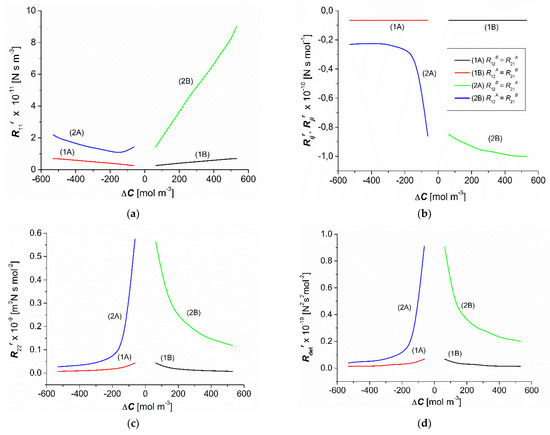
Figure 5.
Concentration dependences of the resistance coefficients (a) (b) , (c) , and (d) for aqueous ethanol solutions.
The comparison of the dependencies = f() (Figure 5a) for homogenous and CP conditions indicates that for = the condition = = was fulfilled. In turn, for the same values (), the condition > was fulfilled, and for the same values of the condition > . Moreover, for = the condition < was fulfilled, and for = = 62.5 mol m−3 the condition = was fulfilled.
The dependencies = f(ΔC) and = f(), presented in Figure 5b, indicate that for = , the conditions were = , = and = . In turn, for the same values (), the condition = < = was fulfilled, and for the same values of the condition = < = was fulfilled. Moreover, for = the condition was = > = , and for = = 62.5 mol m−3 the condition was = = = . From Equation (6), it follows that ≠ . To explain why this relation did not hold, we calculated the quotient / = using Equation (5), and we obtained / = 1.002, meaning that = , with accuracy to two significant figures.
As shown in Figure 5c, the dependencies of = f(ΔC) indicate that for = the condition = = was fulfilled. In turn, for the same values (), the condition > was fulfilled, and for the same values of the condition > was fulfilled. Moreover, for = the condition < was fulfilled, and for = = 62.5 mol m−3 the condition = was fulfilled.
The dependencies of = f(ΔC), shown in Figure 5d, indicate that for = the condition = = was satisfied. In turn, for the same values (), the condition > was fulfilled, and for the same values of —the condition > . Moreover, for = the condition < was fulfilled, and for = = 62.5 mol m−3 the condition = was fulfilled.
The coefficients , and were positive, and the coefficients and were negative and dependent on for the CP conditions. Compared to the conditions of homogeneity of solutions, the CP increased the value of the coefficients , , and and reduced the value of the coefficients and . For the same , the values of the coefficients , , and were smaller, and the coefficients and were higher for the nonconvective state.
Using the dependencies shown in Figure 3c,d and Figure 5a–c, we calculated the values of the Peclét numbers , , and for the point at which = 2.83 × 10⁻⁸ m s−1, = = 0.45 × 10⁻⁸ m s−1, = 3.01 × 10⁻⁴ mol m−2s−1, and = = 0.48 × 10⁻⁴ mol m−2s−1. The values of these Peclét numbers were = 7.5 ×10⁻⁶, = 7.5 × 10⁻³, = 7.99 × 10⁻², and = 79.95, and > > > .
3.4. Concentration Dependencies and
Figure 6a,b shows the concentration dependencies of the CP effects and , calculated based on Equations (10) and (11). Figure 6a shows that for the same indices ij the dependencies = f(–) were asymmetric to the dependence = f(). The plots 2A, 3A, and 4A overlap for negative values, whereas plots 2B, 3B, and 4B overlap for positive values. This means that ≈ ≈ ≈ > and ≈ ≈ ≈ > . Figure 6b shows the concentration dependencies of the effect of gravitational convection, = f() and = f(), calculated based on Equations (12) and (13).
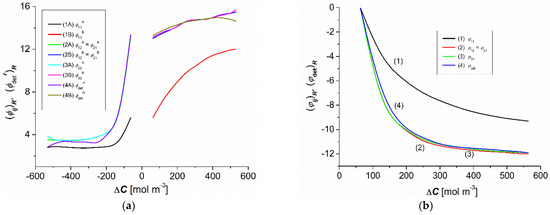
Figure 6.
Concentration dependencies of the coefficients and ( (a) and the coefficients and ( (b) for aqueous ethanol solutions.
As shown in Figure 6b, for the same values of the dependency, ≈ ≈ ≈ < . Moreover, the values of the coefficients , , , and were negative. According to the convention adopted in [5], the convection currents in a system containing aqueous ethanol solutions, which are a consequence of the hydrodynamic instabilities of CBLs, are directed vertically upwards. In contrast, the convection currents in a system containing aqueous glucose solutions are directed vertically downward. The results from Equations (12) and (13) state that for the nonconvective state = 0 and ( = 0 and for the convective state < 0 and ( < 0. Therefore, from Figure 6b we can conclude that = 0 and ( = 0 for = 80 mol m−3.
The coefficients and ( were positive, and the coefficients and ( were negative. The negative convection effect shows that the convection movements were directed vertically upwards. Moreover, for the same , the values of these coefficients were higher for the nonconvective state.
3.5. Concentration Dependencies of , , , and
As shown in Figure 7a, the dependencies = f() (r = A, B) calculated based on Equation (15) were nonlinear and symmetrical with respect the point ΔC = 0 for homogenous conditions (curves 1A and 1B), whereas they were complex and asymmetrical with respect to the vertical axis passing through the point = 0 for CP conditions (curves 2A and 2B). The comparison of curves 2A and 2B shows that for the conditions of concentration polarization and the same values (−) and () the values of (for the convective state) were greater than (for the nonconvection state). On the other hand, when comparing curves 1A and 1B to curves 2A and 2B, it can be seen that for the same values of (−) and () the values of and for homogeneous solution conditions were greater than for CP conditions. Compared to the conditions of homogeneity of solutions, for the same , CP reduced the value of the source of entropy . For the concentration polarization conditions, the values of were positive and depended on both the value and the sign of . CP reduced the flux of dissipated energy (S-energy).
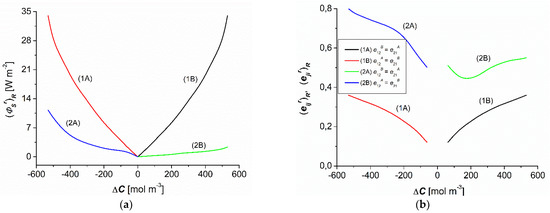
Figure 7.
Concentration dependencies of (a) and maximum energy conversion efficiency coefficients (b) for aqueous ethanol solutions.
Curves 1A and 1B in Figure 7b show the dependencies = f() for homogeneous conditions of solutions, calculated based on Equation (16). This figure shows that curves 1A and 1B are nonlinear and symmetrical with respect to the vertical axis passing through the point = 0. Curves 2A and 2B in Figure 7b show the dependencies of = f() for CP conditions of the solutions. The figure shows that curves 2A and 2B are nonlinear complex curves that are asymmetric with respect to the vertical axis passing through the point = 0. Curves 1A and 1B show that for the conditions of homogeneity of solutions the condition was 0.12 ≤ = ≤ 0.36. On the other hand, curves 2A and 2B show that for the conditions of CP of solutions, the conditions were 0.5 ≤ = ≤ 0.8 and 0.44 ≤ = ≤ 0.55. Figure 6b also shows that = > = > = . This indicates that the most intense energy conversion occurred in the A configuration for CP conditions. The values of the coefficients and increased in CP compared to the homogeneous conditions. For the conditions of CP, the values of these coefficients were positive and dependent on . Moreover, for the same the values of the coefficients and were greater for the convective state.
Taking into account the results of and shown in Figure 7a,b and Equations (19) and (20), the dependencies = f() and = f() were calculated. As shown in Figure 8a, the dependencies = f() (r = A, B) calculated based on Equation (19) were nonlinear and symmetrical with respect to the point ΔC = 0 for homogenous conditions (curves 1A and 1B), whereas they were complex and asymmetrical with respect to the vertical axis passing through the point = 0 for CP conditions (curves 2A and 2B). The comparison of curves 2A and 2B shows that for the conditions of CP and the same values of (−) and () the values of (for the convective state) were greater than (for nonconvection conditions). On the other hand, when comparing curves 1A and 1B to curves 2A and 2B, it can be seen that for the same values of (−) and () the values of and for homogeneous solution conditions were greater than for CP conditions.
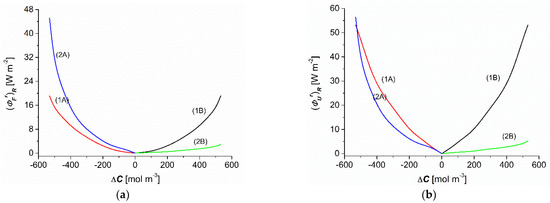
Figure 8.
Concentration dependencies of the flux of F-energy (a) and the flux of U-energy (b) for aqueous ethanol solutions.
This tendency was maintained for dependence = f(). Figure 8a shows that the dependencies = f(), calculated based on Equation (20), were nonlinear and symmetrical with respect the point ΔC = 0 for homogenous conditions (curves 1A and 1B), whereas they were complex and asymmetrical with respect to the vertical axis passing through the point = 0 for CP conditions (curves 2A and 2B). The comparison of curves 2A and 2B shows that for the conditions of CP and the same values of (-) and () the values of (for the convective state) were greater than (for nonconvection conditions). On the other hand, when comparing curves 1A and 1B to curves 2A and 2B, it can be seen that for the same values of (−) and () the values of and for homogeneous solution conditions were greater than for CP conditions.
As shown in Figure 7a and Figure 8a,b, the following relations were satisfied for the homogeneity conditions of the solutions: = = , = = and = = . In contrast, for the conditions of concentration polarization, the following relations were fulfilled: > < , > , > , < , > , = (for C = −500 mol m−3), < (for C > −500 mol m−3), > (for C < −500 mol m−3), and < .
The is a measure of the flux of F-energy, that is, that part of the ( that can be converted into useful work. The conversion efficiency of U-energy to F-energy for the same values of ranged from 12 to 36% (for conditions of homogeneity of solutions separated by the membrane). For diffusion conditions (configuration B), the efficiency of the U-energy to F-energy conversion was contained in the range from 50 to 57%, and for diffusion–convection conditions (configuration B) the efficiency ranged from 50 to 79%. Although this efficiency was relatively high, the amount of F-energy produced was small. The amount of this energy can be important in biological microsystems.
The procedure presented in this paper for evaluating membrane transport properties and energy conversion in a membrane system could be useful for any biological or artificial membranes [46,47,48,49,50].
4. Conclusions
This study presents the following results:
- Developed within the framework of the Kedem–Katchalsky–Peusner formalism, the procedure using the Peusner coefficients (i = j ∈ {1, 2}, r = A, B) and is suitable for evaluating the transport properties of polymer membranes and assessing the conversion of internal energy (U-energy) to useful energy (F-energy) and degraded energy (S-energy).
- Peusner coefficients and are related to the membrane Peclét coefficients and .
- The procedure developed in this paper to evaluate the conversion of internal energy (U-energy) to useful energy (F-energy) and degraded energy (S-energy) requires the calculation of the value of the flux of S-energy and efficiency factors and , followed by the fluxes of F-energy and U-energy ().
- The procedure proposed in the paper can be applied to membranes for which the coefficients , , , and can be determined experimentally.
Author Contributions
Conceptualization, I.Ś.-P., K.M.B. and A.Ś.; methodology, K.M.B., A.Ś. and I.Ś.-P.; software, K.M.B.; formal analysis: K.M.B., A.Ś. and I.Ś.-P.; investigation, K.M.B., A.Ś. and I.Ś.-P.; resources, K.M.B., A.Ś. and I.Ś.-P.; data curation, K.M.B. and A.Ś.; writing—original draft preparation, K.M.B., A.Ś, and I.Ś.-P.; writing—review and editing, K.M.B., A.Ś. and I.Ś.-P; visualization, K.M.B. and A.Ś.; supervision, A.Ś. All authors have read and agreed to the published version of the manuscript.
Funding
This research received no external funding.
Data Availability Statement
The datasets for this study are available on request from the corresponding author.
Conflicts of Interest
The authors declare no conflict of interest.
List of Symbols
| hydraulic permeability coefficient (m3N−1s−1) | |
| average concentration of solutes (mol m−3) | |
| hydraulic, osmotic, diffusive, and advective coefficients of CP | |
| i, j ∈ {1, 2}, r = A, B | (N2s2mol−2)) |
| thicknesses of the concentration boundary layers (CBLs) (m) | |
| energy conversion efficiency coefficients | |
| matrix of the Peusner coefficients | |
| flux of S-energy (W m−2) | |
| flux of F-energy (W m−2) | |
| flux of U-energy (W m−2) | |
| mass density (kg m−3) | |
| coupling coefficient | |
| concentration Rayleigh number | |
| concentration polarization effects | |
| effects of gravitational convection in osmotic and diffusive transport | |
| Peclét number | |
| (s m−1)) | |
| (mol m−2s−1)) | |
| A and B | configurations of membrane system |
| M | membrane |
| CP | concentration polarization |
| BC | bacterial cellulose |
| the concentration boundary layers (CBLs) | |
| complex of CBLs and membrane | |
| KKP equations | Kedem–Katchalsky–Peusner equations |
References
- Baker, R. Membrane Technology and Application; John Wiley & Sons: New York, NY, USA, 2012; ISBN 978-0-470-74372-0. [Google Scholar]
- Savencu, I.; Iurian, S.; Porfire, A.; Bogdan, C.; Tomuță, I. Review of advances in polymeric wound dressing films. React. Funct. Polym. 2021, 168, 105059. [Google Scholar] [CrossRef]
- Demirel, Y. Nonequilibrium Thermodynamics: Transport and Rate Processes in Physical, Chemical and Biological Systems; Elsevier: Amsterdam, The Netherlands, 2014; ISBN 978-0-444-53079-0. [Google Scholar]
- Lipton, B. The Biology of Belief: Unleashing the Power of Consciousness; Hay House: Carlsbad, CA, USA, 2018; ISBN-10: 1401923127. [Google Scholar]
- Batko, K.M.; Ślęzak, A. Evaluation of the global S-entropy production in membrane transport of aqueous solutions of hydrochloric acid and ammonia. Entropy 2020, 22, 1021. [Google Scholar] [CrossRef] [PubMed]
- Delmotte, M.; Chanu, J. Non-equilibrium Thermodynamics and Membrane Potential Measurement in Biology. In Topics Bioelectrochemistry and Bioenergetics; Millazzo, G., Ed.; John Wiley Publish & Sons: Chichester, UK, 1979; pp. 307–359. [Google Scholar]
- Gerke, K.M.; Vasilyev, R.V.; Khirevich, S.; Collins, D.; Karsanina, M.V.; Sizonenko, T.O.; Korost, D.V.; Lamontagne, S.; Mallants, D. Finite-difference method Stokes solver (FDMSS) for 3D pore geometries: Software development, validation and case studies. Comput. Geosci. 2018, 114, 41–58. [Google Scholar] [CrossRef]
- Blunt, M.J. Flow in porous media—Pore-network models and multiphase flow. Curr. Opin. Colloid Interface Sci. 2001, 6, 197–207. [Google Scholar] [CrossRef]
- Koroteev, D.; Dinariev, O.; Evseev, N.; Klemin, D.; Nadeev, A.; Safonov, S.; Gurpinar, O.; Berg, S.; van Kruijsdijk, C.; Armstrong, R.; et al. Direct hydrodynamic simulation of multiphase flow in porous rock. Petrophysics 2014, 55, 294–303. [Google Scholar]
- Veselý, M.; Bultreys, T.; Peksa, M.; Lang, J.; Cnudde, V.; Van Hoorebeke, L.; Kočiřík, M.; Hejtmánek, V.; Šolcová, O.; Soukup, K.; et al. Prediction and evaluation of time-dependent effective self-diffusivity of water and other effective transport properties associated with reconstructed porous solids. Transp. Porous Media 2015, 110, 81–111. [Google Scholar] [CrossRef]
- Jarzyńska, M.; Pietruszka, M. The application of the Kedem-Katchalsky equations to membrane transport of ethyl alcohol and glucose. Desalination 2011, 280, 14–19. [Google Scholar] [CrossRef]
- Jarzyńska, M.; Staryga, E.; Kluza, F.; Spiess, W.E.L.; Góral, D. Diffusion characteristics in ethyl alcohol and glucose solutions using Kedem-Katchalsky equations. Chem. Eng. Technol. 2020, 43, 248–252. [Google Scholar] [CrossRef]
- Ślęzak, A. Irreversible thermodynamic model equations of the transport across a horizontally mounted membrane. Biophys. Chem. 1989, 34, 91–102. [Google Scholar] [CrossRef]
- Dworecki, K.; Ślęzak, A.; Ornal-Wąsik, B.; Wąsik, S. Effect of hydrodynamic instabilities on solute transport in a membrane system. J. Membr. Sci. 2005, 265, 94–100. [Google Scholar] [CrossRef]
- Ślęzak, A. A model equation for the gravielectric effect in electrochemical cells. Biophys. Chem. 1990, 38, 189–199. [Google Scholar] [CrossRef] [PubMed]
- Kargol, A. Modified Kedem-Katchalsky equations and their application. J. Membr. Sci. 2000, 174, 43–53. [Google Scholar] [CrossRef]
- Ślęzak, A.; Dworecki, K.; Anderson, J.E. Gravitational effects on transmembrane flux: The Rayleigh-Taylor convective instability. J. Membr. Sci. 1985, 23, 71–81. [Google Scholar] [CrossRef]
- Ślęzak, A.; Dworecki, K.; Jasik-Ślęzak, J.; Wąsik, J. Method to determine the practical concentration Rayleigh number in isothermal passive membrane transport processes. Desalination 2004, 168, 397–412. [Google Scholar] [CrossRef]
- Puthenveettil, B.A.; Arakeri, J.H. Plum structure in high-Rayleigh-Number convection. J. Fluid Mech. 2005, 542, 217–249. [Google Scholar] [CrossRef]
- Slezak-Prochazka, I.; Batko, K.M.; Ślęzak, A.; Bajdur, W.M.; Włodarczyk-Makuła, M. Non-linear effects in osmotic membrane transport: Evaluation of the S-entropy production by volume flux of aqueous ammonia and sulfuric acid solutions under concentration polarization conditions. Desal. Water Treat. 2022, 260, 23–36. [Google Scholar] [CrossRef]
- Katchalsky, A.; Curran, P.F. Nonequilibrium Thermodynamics in Biophysics; Harvard: Cambridge, UK, 1965; ISBN 9780674494121. [Google Scholar]
- Friedman, M.H.; Meyer, R.A. Transport across homoporous and heteroporous membranes in nonideal nondilute solutions. I. Inequality of reflection coefficients for volume flow and solute flow. Biophys. J. 1981, 34, 535–544. [Google Scholar] [CrossRef] [PubMed]
- Kargol, M.; Kargol, A. Mechanistic formalism for membrane transport generated by osmotic and mechanical pressure. Gen. Physiol. Biophys. 2003, 22, 51–68. [Google Scholar]
- Batko, K.M.; Ślęzak, A.; Grzegorczyn, S.; Bajdur, W.M. The Rr form of the Kedem–Katchalsky–Peusner model equations for description of the membrane transport in concentration polarization conditions. Entropy 2020, 22, 857. [Google Scholar] [CrossRef]
- Richter, T.; Keipert, S. In vitro permeation studies comparing bovine nasal mucosa, porcine cornea and artificial membrane: Androstendedione in microemulsions and their components. Eur. J. Pharma Biopharm. 2004, 58, 137–143. [Google Scholar] [CrossRef]
- Twardowski, Z. Scholarly Review: History of hemodialyzers’ designs. Hemodial. Inter. 2008, 12, 173–210. [Google Scholar] [CrossRef] [PubMed]
- Zholkovskiy, E.; Koter, I.; Koter, S.; Kujawski, W.; Yaroshchuk, A. Analysis of membrane transport equations for reverse electrodialysis (RED) using irreversible thermodynamics. Int. J. Mol. Sci. 2020, 21, 6325. [Google Scholar] [CrossRef]
- Auclair, B.; Nikonenko, V.; Larchet, C.; Métayer, M.; Dammak, L. Correlation between transport parameters of ion-exchange membranes. J. Membr. Sci. 2002, 195, 89–102. [Google Scholar] [CrossRef]
- Batko, K.M.; Ślęzak-Prochazka, I.; Grzegorczyn, S.M.; Pilis, A.; Dolibog, P.; Ślęzak, A. Energy conversion in Textus Bioactiv Ag membrane dressings using Peusner’s network thermodynamic descriptions. [published on line as ahead of print November 10, 2022]. Polym. Med. 2022, 12. [Google Scholar] [CrossRef]
- Peusner, L. Studies in Network Thermodynamics; Elsevier: Amsterdam, The Netherlands, 1986; ISBN 0444425802. [Google Scholar]
- Ślęzak, A.; Grzegorczyn, S.; Batko, K.M. Resistance coefficients of polymer membrane with concentration polarization. Transp. Porous Media 2012, 95, 151–170. [Google Scholar] [CrossRef]
- Ślęzak, A.; Grzegorczyn, S.; Jasik-Ślęzak, J.; Michalska-Małecka, K. Natural convection as an asymmetrical factor of the transport through porous membrane. Transp. Porous. Media 2010, 84, 685–698. [Google Scholar] [CrossRef]
- Ślęzak, A.; Kucharzewski, M.; Franek, A.; Twardokęs, W. Evaluation of the efficiency of venous leg ulcer treatment with a membrane dressing. Med. Eng. Phys. 2004, 26, 53–60. [Google Scholar] [CrossRef]
- Batko, K.M.; Ślęzak, A.; Pilis, W. Evaluation of transport properties of biomembranes by means of Peusner network thermodynamics. Acta Bioeng. Biomech. 2021, 23, 63–72. [Google Scholar] [CrossRef]
- Hussain, Z.; Sajjad, W.; Khan, T.; Wahid, F. Production of bacterial cellulose from industrial wastes: A review. Cellulose 2019, 26, 2895–2911. [Google Scholar] [CrossRef]
- Tayeb, A.H.; Amini, E.; Ghasemi, M.; Tajvidi, S. Cellulose nanomaterials—Binding properties and applications: A review. Molecules 2018, 23, 2683. [Google Scholar] [CrossRef]
- Grzegorczyn, S.; Ślęzak, A. Kinetics of concentration boundary layers buildup in the system consisted of microbial cellulose biomembrane and electrolyte solutions. J. Membr. Sci. 2007, 304, 148–155. [Google Scholar] [CrossRef]
- Ewing, G.W. Instrumental Methods of Chemical Analysis; McGraw-Hill Book, Co.: New York, NY, USA, 1985; ISBN 0-07-019857-8. [Google Scholar]
- Dworecki, K. Interferometric investigation of near-membrane diffusion layers. J. Biol. Phys. 1995, 21, 37–49. [Google Scholar] [CrossRef]
- Gałczyńska, K.; Rachuna, J.; Ciepluch, K.; Kowalska, M.; Wąsik, S.; Kosztołowicz, T.; Lewandowska, K.D.; Semaniak, J.; Kurdziel, K.; Arabski, M. Experimental and theoretical analysis of metal complex diffusion through cell monolayer. Entropy 2021, 23, 360. [Google Scholar] [CrossRef] [PubMed]
- Arabski, M.; Wąsik, S.; Dworecki, K.; Kaca, W. Laser interferometric determination of ampicillin and colistin transfer through cellulose biomembrane in the presence of Proteus vulgaris O25 lipopolysaccharide. J. Membr. Sci. 2007, 299, 268–275. [Google Scholar] [CrossRef]
- Bason, S.; Kedem, O.; Freger, V. Determination of concentration-dependent transport coefficient s in nanofiltration: Experimental evaluation of coefficients. J. Membr. Sci. 2008, 310, 197–204. [Google Scholar] [CrossRef]
- Kedem, O.; Caplan, S.R. Degree of coupling and its relations to efficiency of energy conversion. Trans. Faraday Soc. 1965, 61, 1897–1911. [Google Scholar] [CrossRef]
- Lebon, G.; Jou, D.; Casas-Vasquez, J. Understanding Non-Equilibrium Thermodynamics. Foundations, Applications, Frontiers; Springer: Berlin/Heidelberg, Germany, 2008. [Google Scholar]
- Batko, K.M.; Ślęzak-Prochazka, I.; Ślęzak, A.; Bajdur, W.M.; Włodarczyk-Makuła, M. Management of energy conversion processes in membrane systems. Energies 2022, 15, 1661. [Google Scholar] [CrossRef]
- Mohammad, A.W.; Teow, Y.H.; Ang, W.L.; Chung, Y.T.; Oatley-Radcliffe, D.L.; Hilal, N. Nanofiltration membranes review: Recent advances and future prospects. Desalination 2015, 356, 226–354. [Google Scholar] [CrossRef]
- Han, Y.; Xu, Z.; Gao, C. Ultrathin Graphene nanofiltration membrane for water purification. Adv. Funct. Mat. 2013, 23, 3693–3700. [Google Scholar] [CrossRef]
- Weinstein, A.M. An equation for flow in the renal proximal tubule. Bull. Math. Biol. 1986, 48, 29–57. [Google Scholar] [CrossRef]
- Huang, Y.; Chen, W.; Lei, Y. Outer membrane vesicles (OMVs) enabled bio-applications: A critical review. Biotech. Bioeng. 2022, 119, 34–47. [Google Scholar] [CrossRef] [PubMed]
- Stamatialis, D.F.; Papenburg, B.J.; Gironés, M.; Saiful, S.; Bettahalli, S.N.M.; Schmitmeier, S.; Wessling, M. Medical applications of membranes: Drug delivery, artificial organs and tissue engineering. J. Membr. Sci. 2008, 308, 1–34. [Google Scholar] [CrossRef]
Disclaimer/Publisher’s Note: The statements, opinions and data contained in all publications are solely those of the individual author(s) and contributor(s) and not of MDPI and/or the editor(s). MDPI and/or the editor(s) disclaim responsibility for any injury to people or property resulting from any ideas, methods, instructions or products referred to in the content. |
© 2022 by the authors. Licensee MDPI, Basel, Switzerland. This article is an open access article distributed under the terms and conditions of the Creative Commons Attribution (CC BY) license (https://creativecommons.org/licenses/by/4.0/).