
Is Bitcoin’s Carbon Footprint Persistent? Multifractal Evidence and Policy Implications


Abstract
:1. Introduction
2. Data and Methodology
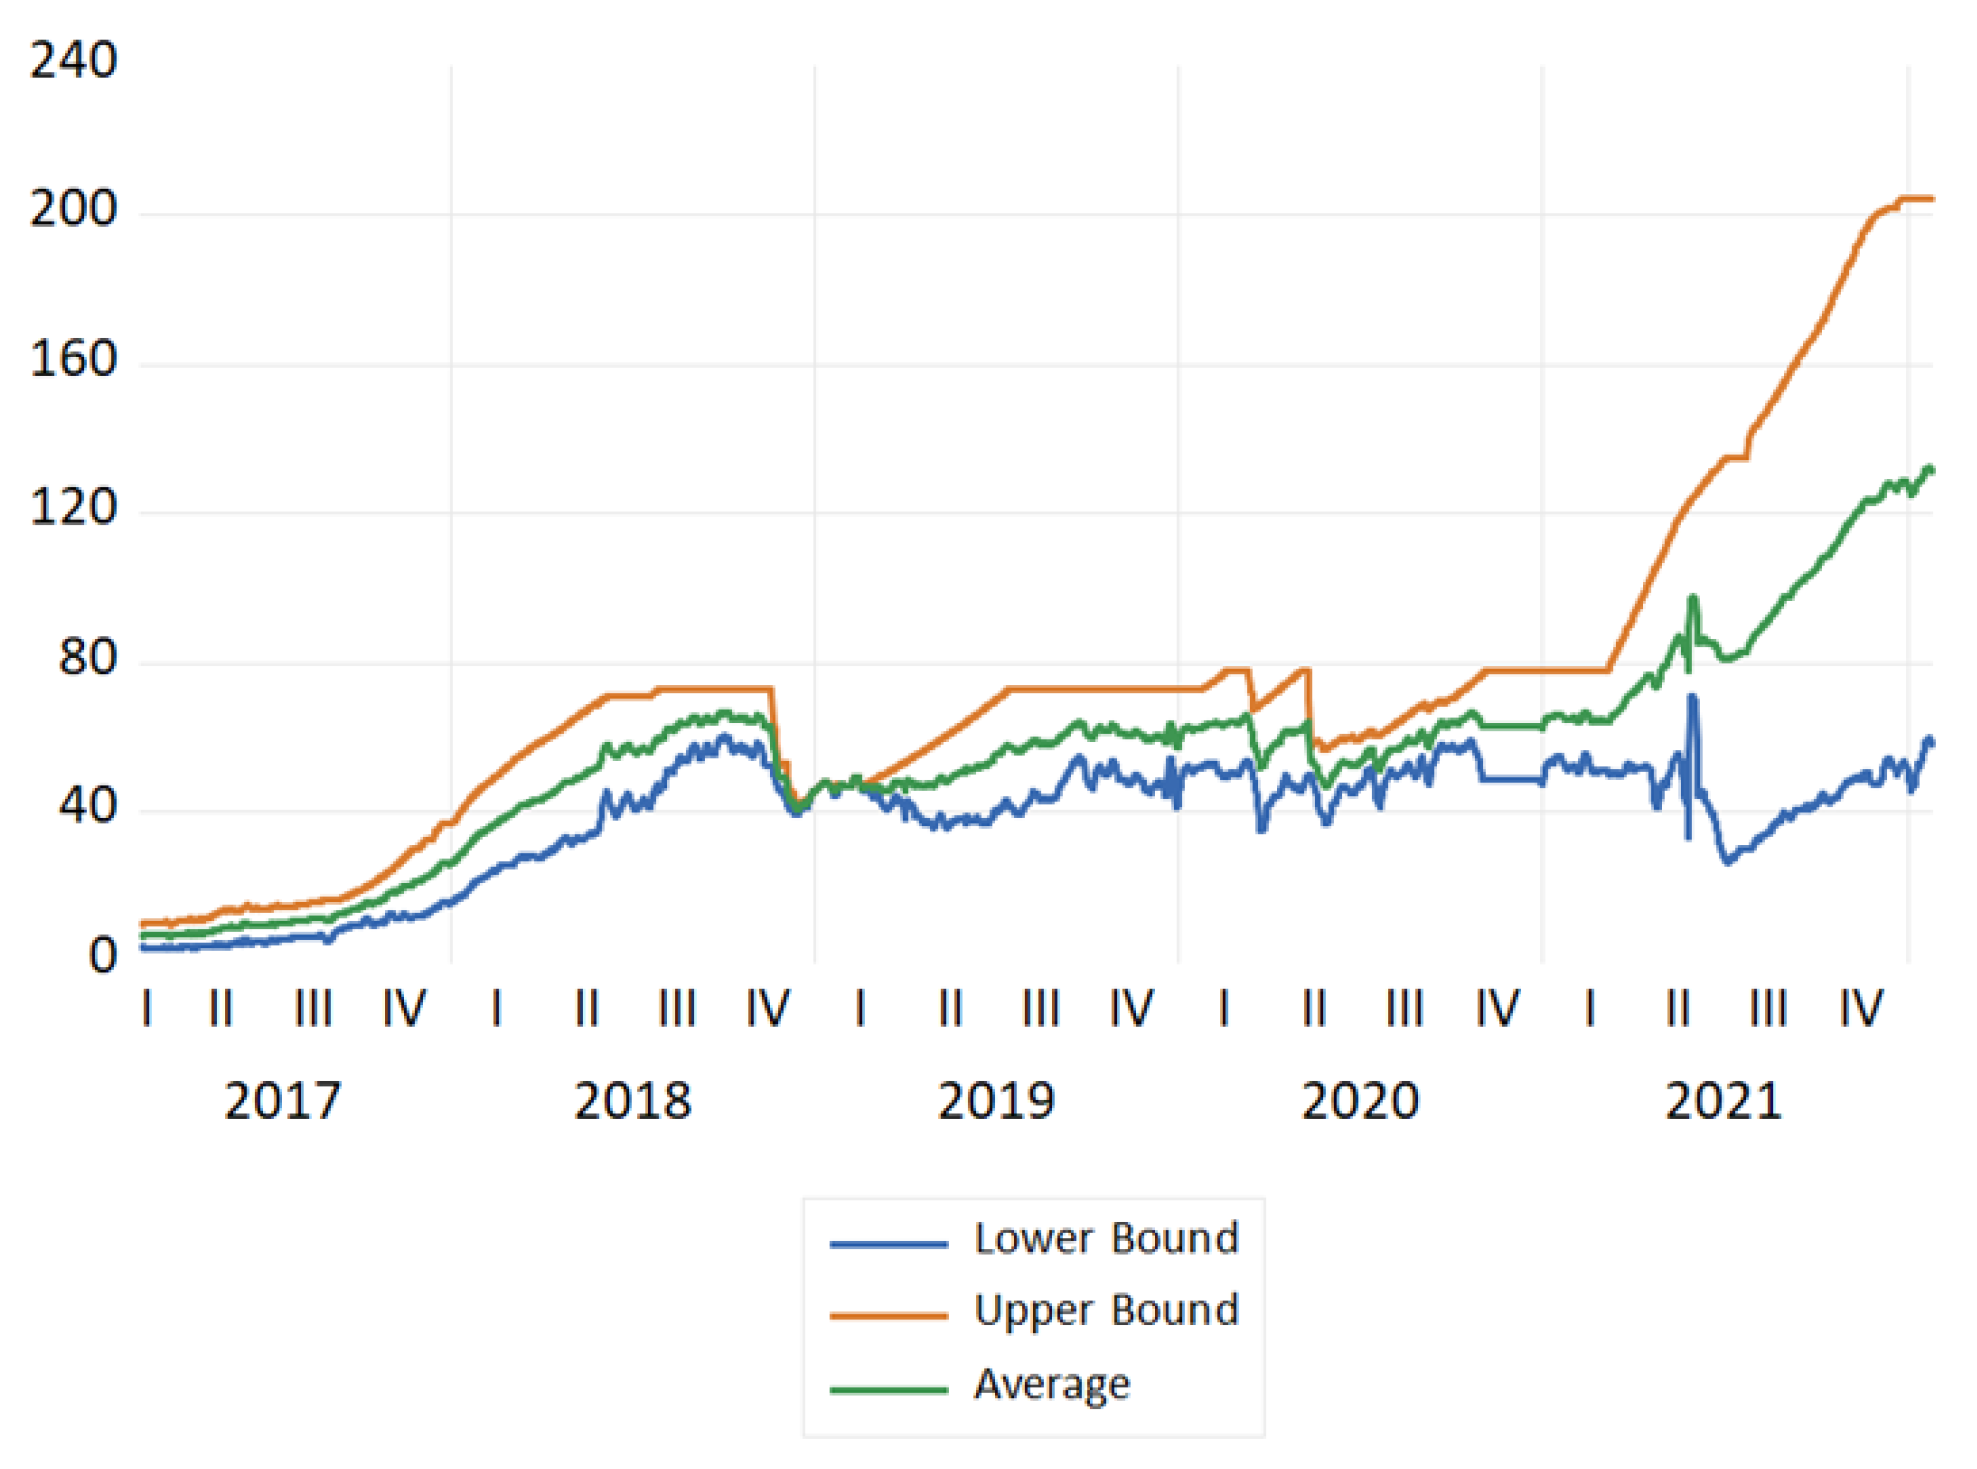
2.1. Data
2.2. Methodology
- Determining the profilewhere, is the series, and mean subtraction occurs. Further,
- Dividing the profile: To divide the profile N numbers of non-overlapping series of the same length ‘s’. Since N may not be a multiple of the time scale ‘s’, was considered.
- Calculation of the local trend: Local trend finding for each segments are carried out by a least-square fit procedure & finding the variance in this process.where is the curve fitting polynomial is segment
- Averaging across all segments to find qth order fluctuation function:where q can be any real number, but not zero. It is interesting to note that q = 2 coincides with the standard DFA process. Research suggests that extremely large q values (−10 or +10) increase the error in the multifractal spectrum tails [26]; therefore, q = 5 was used to calibrate such series, which is recommended by another research work [27].
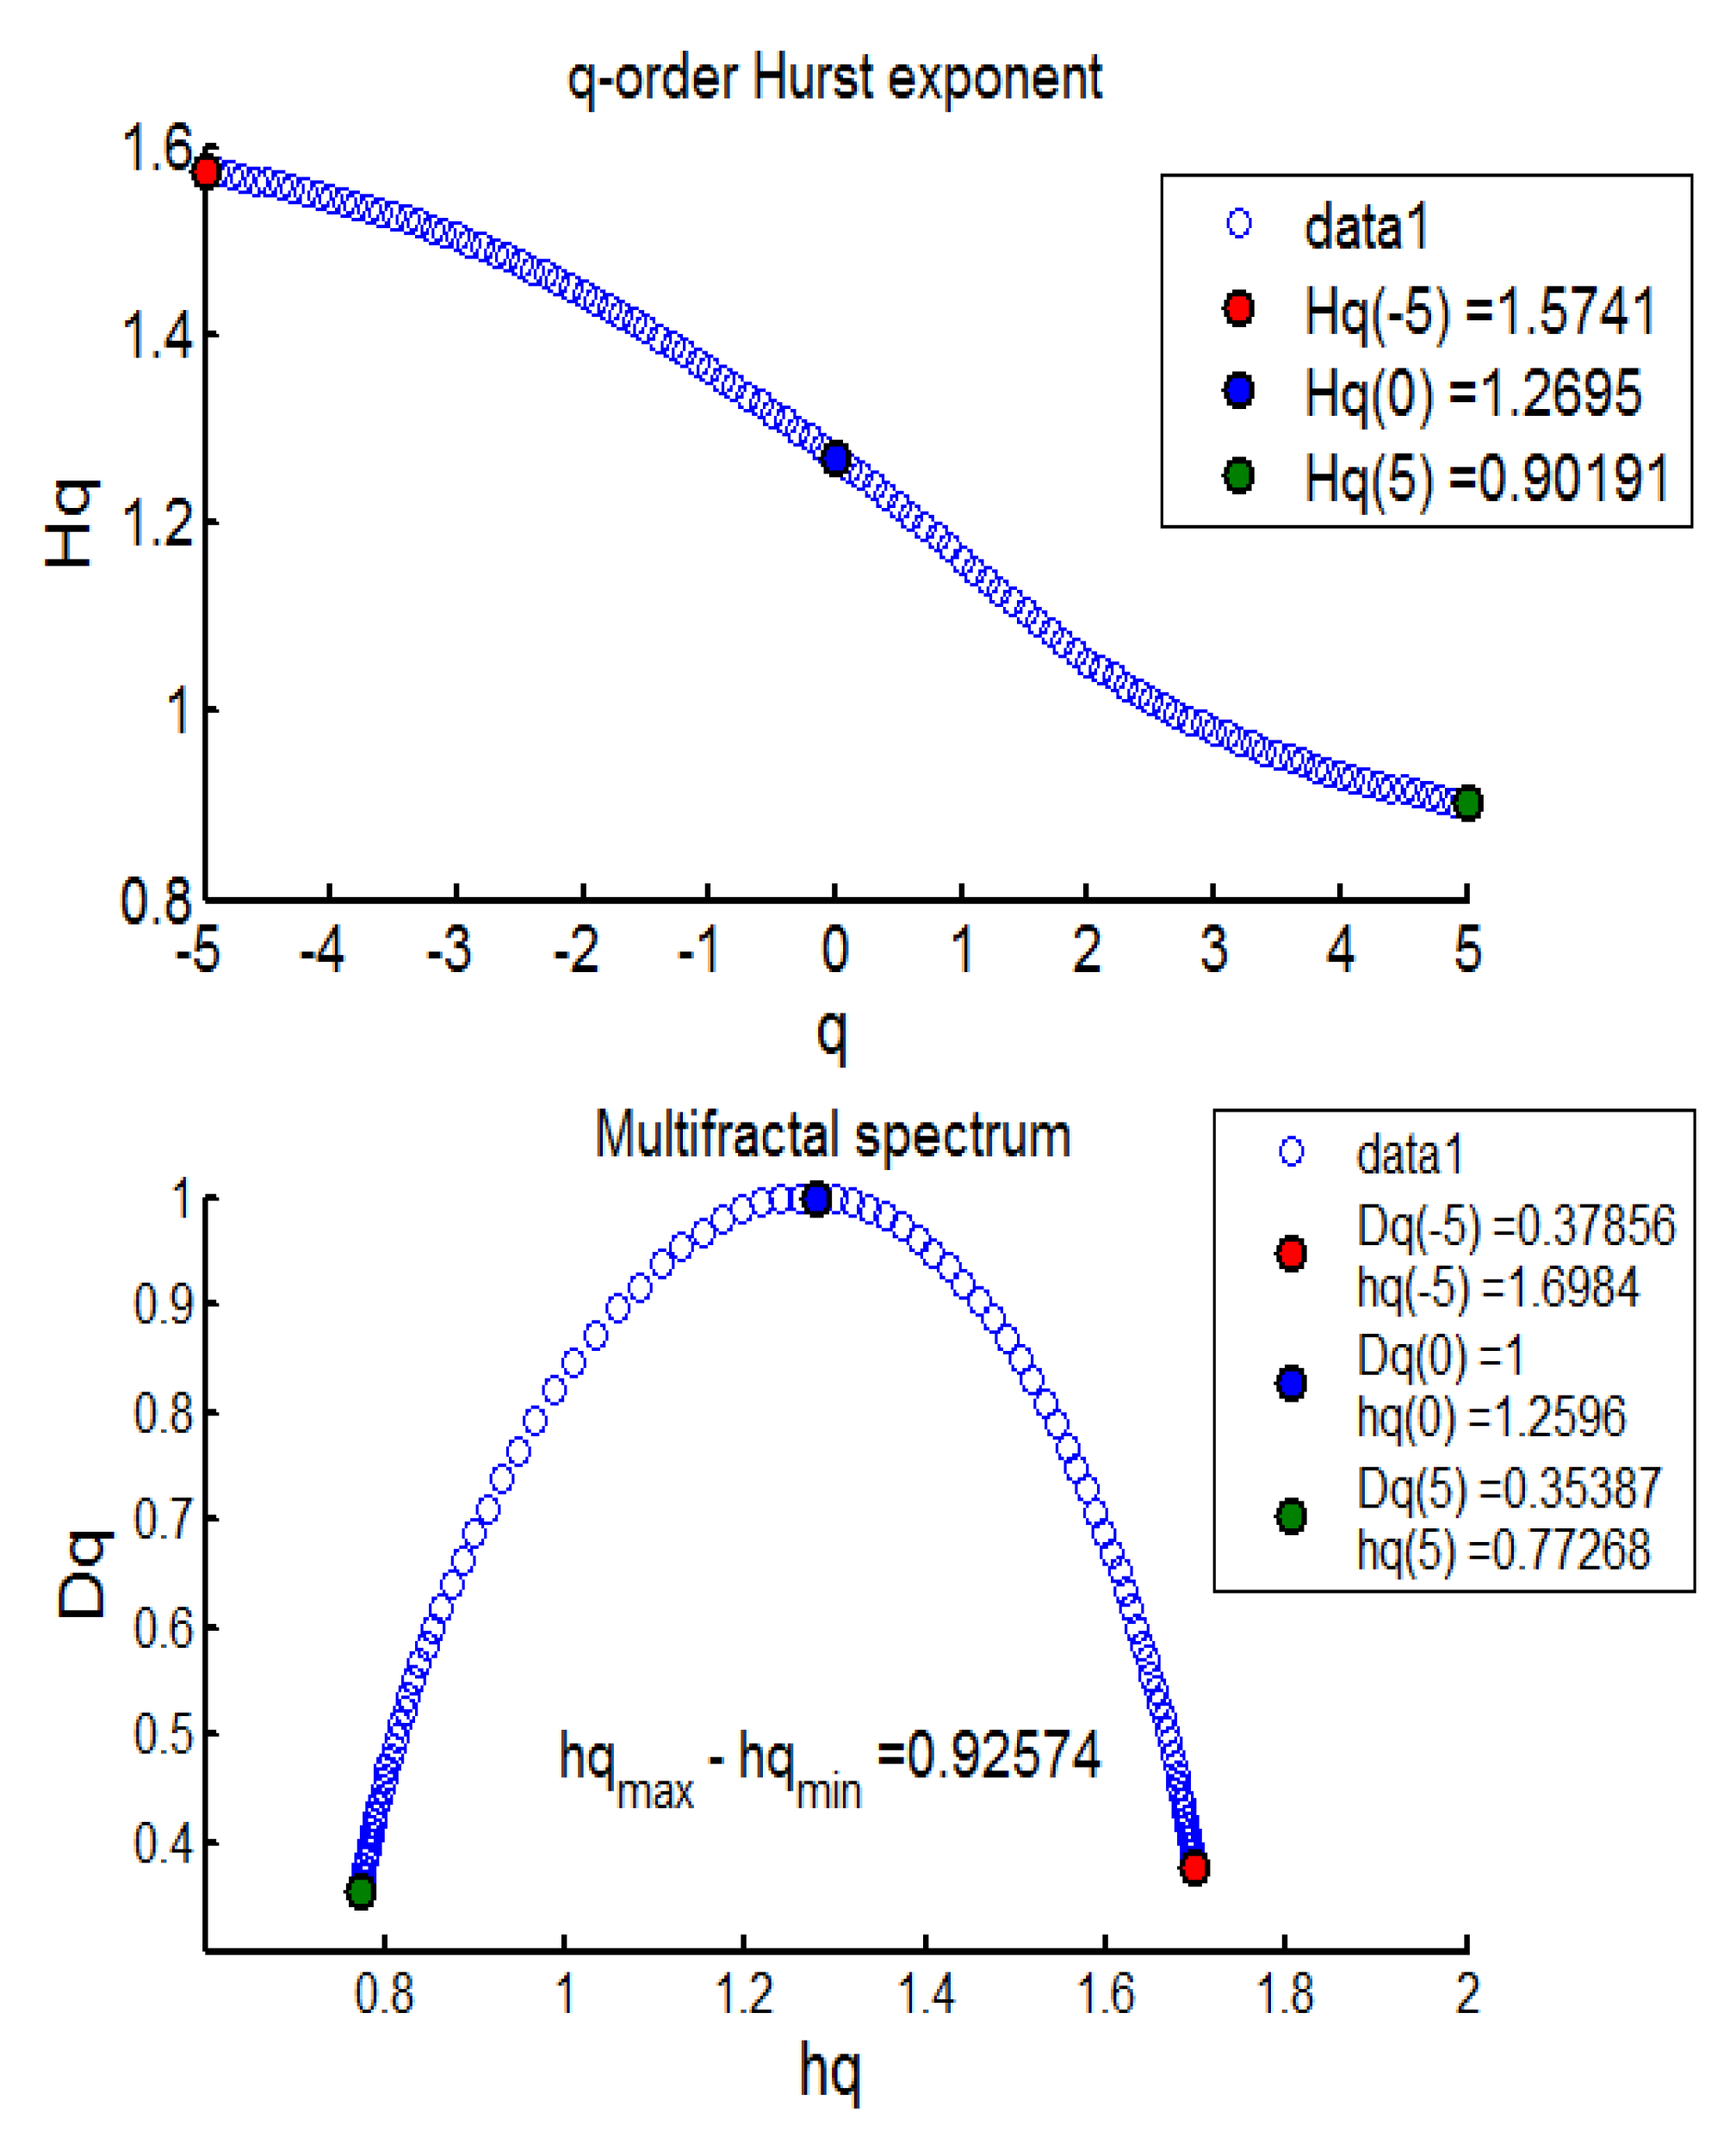
- Determination of the scaling property of the fluctuation function:where H(q) represents the generalised Hurst exponent of the underlying series.
3. Results
3.1. Results from the MFDFA
3.2. Results from the FIGARCH
3.3. Overall Results Analysis
4. Conclusions and Policy Implications
5. Limitations & Future Scope of Study
Author Contributions
Funding
Institutional Review Board Statement
Informed Consent Statement
Data Availability Statement
Conflicts of Interest
References
- Bouri, E.; Jalkh, N.; Molnár, P.; Roubaud, D. Bitcoin for energy commodities before and after the December 2013 crash: Diversifier, hedge or safe heaven? Appl. Econ. 2017, 49, 5063–5073. [Google Scholar] [CrossRef]
- O’Dwyer, K.J.; Malone, D. Bitcoin mining and its energy footprint. IET Conf. Publ. 2014, 2014, 280–285. [Google Scholar]
- Corbet, S.; Lucey, B.M.; Yarovaya, L. The Financial Market Effects of Cryptocurrency Energy Usage. 2019. Available online: https://papers.ssrn.com/sol3/papers.cfm?abstract_id=3412194 (accessed on 17 March 2022).
- Howson, P. Tackling climate change with blockchain. Nat. Clim. Chang. 2019, 9, 644–645. [Google Scholar] [CrossRef]
- Karathanasopoulos, A.; Dunis, C.; Khalil, S. Modelling, forecasting and trading with a new sliding window approach: The crack spread example. Quant. Financ. 2016, 16, 1875–1886. [Google Scholar] [CrossRef]
- Belbute, J.M.; Pereira, A.M. Do Global CO2 Emissions from Fuel Consumption Exhibit Long Memory? A Fractional Integration Analysis (Issue 165). 2015. Available online: https://economics.wm.edu/wp/cwm_wp165.pdf (accessed on 11 January 2022).
- Vranken, H. Sustainability of bitcoin and blockchains. Curr. Opin. Environ. Sustain. 2017, 28, 1–9. [Google Scholar] [CrossRef] [Green Version]
- Belbute, J.M.; Pereira, A.M. Do global CO2 emissions from fossil-fuel consumption exhibit long memory? A fractional-integration analysis. Appl. Econ. 2017, 49, 4055–4070. [Google Scholar] [CrossRef]
- McCook, H. The Cost & Sustainability of Bitcoin. 2018. Available online: https://cryptowords.github.io/the-cost-and-stability-of-bitcoin (accessed on 10 January 2022).
- Krause, M.J.; Tolaymat, T. Quantification of energy and carbon costs for mining cryptocurrencies. Nat. Sustain. 2018, 1, 711–718. [Google Scholar] [CrossRef]
- Mora, C.; Rollins, R.L.; Taladay, K.; Kantar, M.B.; Chock, M.K.; Shimada, M.; Franklin, E.C. Bitcoin emissions alone could push global warming above 2 °C. Nat. Clim. Chang. 2018, 8, 931–933. [Google Scholar] [CrossRef]
- Howson, P.; de Vries, A. Preying on the poor? Opportunities and challenges for tackling the social and environmental threats of cryptocurrencies for vulnerable and low-income communities. Energy Res. Soc. Sci. 2022, 84, 102394. [Google Scholar] [CrossRef]
- Sedlmeir, J.; Buhl, H.U.; Fridgen, G.; Keller, R. The Energy Consumption of Blockchain Technology: Beyond Myth. Bus. Inf. Syst. Eng. 2020, 62, 599–608. [Google Scholar] [CrossRef]
- Stoll, C.; Klaaßen, L.; Gallersdörfer, U. The Carbon Footprint of Bitcoin. Joule 2019, 3, 1647–1661. [Google Scholar] [CrossRef]
- GHG PROTOCOL. GHG Protocol Scope 2 Guidance: An amendment to the GHG Protocol Corporate Standard. In GHG Protocol Scope 2 Guidance. 2015. Available online: https://ghgprotocol.org/sites/default/files/standards/Scope%202%20Guidance_Final_Sept26.pdf (accessed on 11 January 2022).
- WBCSD; WRI. A Corporate Accounting and Reporting Standard. In Greenhouse Gas Protocol; World Resources Institute: Washington, DC, USA, 2012. [Google Scholar]
- De Vries, A. Bitcoin’s energy consumption is underestimated: A market dynamics approach. Energy Res. Soc. Sci. 2020, 70, 101721. [Google Scholar] [CrossRef]
- Hanapi, A.L.M.; Othman, M.; Sokkalingam, R.; Sakidin, H. Developed A Hybrid Sliding Window and GARCH Model for Forecasting of Crude Palm Oil Prices in Malaysia. J. Phys. Conf. Ser. 2018, 1123, 1–8. [Google Scholar]
- Vera-Valdés, J.E. On long memory origins and forecast horizons. J. Forecast. 2020, 39, 811–826. [Google Scholar] [CrossRef] [Green Version]
- Baillie, R.; Bollerslev, T.; Mikkelsen, H.O. Fractionally integrated generalized autoregressive conditional heteroscedasticity. J. Econom. 1996, 74, 3–30. [Google Scholar] [CrossRef]
- Kantelhardt, J.W. Fractal and Multifractal Time Series, 1–59. 2008. Available online: http://arxiv.org/abs/0804.0747 (accessed on 10 January 2022).
- Kantelhardt, J.W.; Zschiegner, S.A.; Koschielny-Bunde, E.S.; Havlin, A.; Bunde, H.E.S. Multi-fractal detrended fluctuation analysis of nonstationary time series. Physica A 2002, 316, 87–114. [Google Scholar] [CrossRef] [Green Version]
- Ramos-Requena, J.P.; Trinidad-Segovia, J.E.; Sánchez-Granero, M.A. Introducing Hurst exponent in pair trading. Phys. A Stat. Mech. Its Appl. 2017, 488, 39–45. [Google Scholar] [CrossRef]
- Morales, R.; Di Matteo, T.; Gramatica, R.; Aste, T. Dynamical generalized Hurst exponent as a tool to monitor unstable periods in financial time series. Phys. A Stat. Mech. Its Appl. 2012, 391, 3180–3189. [Google Scholar] [CrossRef] [Green Version]
- Ihlen, E.A.F. Introduction to multifractal detrended fluctuation analysis in matlab. Front. Physiol. 2012, 3, 141. [Google Scholar] [CrossRef] [Green Version]
- Kaulakys, B.; Alaburda, M. Modeling the inverse cubic distributions by nonlinear stochastic differential equations. In Proceedings of the 21st International Conference on Noise and Fluctuations, Toronto, ON, Canada, 12–16 June 2011; pp. 499–502. [Google Scholar] [CrossRef]
- Thompson, J.R.; Wilson, J.R. Multifractal detrended fluctuation analysis: Practical applications to financial time series. Math. Comput. Simul. 2016, 126, 63–88. [Google Scholar] [CrossRef]
- Mandelbrot, B.B.; Fisher, A.; Calvet, L. A Multifractal Model of Asset Returns; Working Papers—Yale School of Management’s Economics Research Network; Yale University: New Haven, CT, USA, 1997; Volume 1, Available online: https://users.math.yale.edu/~bbm3/web_pdfs/Cowles1164.pdf (accessed on 11 January 2022).
- Watkins, N.W.; Franzke, C. A brief history of long memory: Hurst, Mandelbrot and the road to Road to ARFIMA, 1951–1980. Entropy 2017, 19, 437. [Google Scholar] [CrossRef] [Green Version]
- Bella, G.; Massidda, C.; Mattana, P. The relationship among CO2 emissions, electricity power consumption and GDP in OECD countries. J. Policy Modeling 2014, 36, 970–985. [Google Scholar] [CrossRef]
- Bouri, E.; Gil-Alana, L.A.; Gupta, R.; Roubaud, D. Modelling Long Memory Volatility in the Bitcoin Market: Evidence of Persistence and Structural Breaks. Int. J. Finance Econ. 2019, 24, 412–426. [Google Scholar] [CrossRef] [Green Version]
- Peters, E.E. Fractal Market Analysis: Applying Chaos Theory to Investment and Economics; John Wiley & Sons: Hoboken, NJ, USA, 1994; Volume 24. [Google Scholar]
- Rydin Gorjão, L.; Hassan, G.; Kurths, J.; Witthaut, D. MFDFA: Efficient multifractal detrended fluctuation analysis in python. Comput. Phys. Commun. 2022, 273, 108254. [Google Scholar] [CrossRef]
- Drozdz, S.; Kowalski, R.; Oświȩcimka, P.; Rak, R.; Gȩbarowski, R. Dynamical variety of shapes in financial multifractality. Complexity 2018, 2018, 7015721. [Google Scholar] [CrossRef]
- Drożdż, S.; Oświȩcimka, P. Detecting and interpreting distortions in hierarchical organization of complex time series. Phys. Rev. E Stat. Nonlinear Soft Matter Phys. 2015, 91, 030902(R). [Google Scholar] [CrossRef] [Green Version]
- Hayes, A.S. Bitcoin price and its marginal cost of production: Support for a fundamental value. Appl. Econ. Lett. 2019, 26, 554–560. [Google Scholar] [CrossRef]
- Lo, Y.C.; Medda, F. Bitcoin mining: Converting computing power into cash flow. Appl. Econ. Lett. 2019, 26, 1171–1176. [Google Scholar] [CrossRef]
- Wang, L.; Sarker, P.K.; Bouri, E. Short- and Long-Term Interactions between Bitcoin and Economic Variables: Evidence from the US. Comput Econ 2022. [Google Scholar] [CrossRef]
- Ghosh, B.; Bouri, E. Long memory and fractality in the universe of volatility indices. Complexity 2022, 22, 6728432. [Google Scholar] [CrossRef]
- Drozdz, S.; Kwapień, J.; Oświecimka, P.; Stanisz, T.; Watorek, M. Complexity in economic and social systems: Cryptocurrency market at around COVID-19. Entropy 2020, 22, 1043. [Google Scholar] [CrossRef] [PubMed]
- Fama, E.F. Efficient capital markets: A review of theory and empirical work. J. Financ. 1970, 25, 383–417. [Google Scholar] [CrossRef]


| Mean | Max. | Min. | Std. Dev. | Kurtosis | Jarque-Bera | ADF Test | |
|---|---|---|---|---|---|---|---|
| BECI-LB | 0.0261 | 0.818 | 0.801 | 0.200 | 6.871 | 124.51 | 16.451 * |
| BECI-UB | 0.0349 | 0.5128 | 0.587 | 0.139 | 5.892 | 72.61 | 13.017 * |
| BECI Average | 0.0305 | 0.5293 | 0.463 | 0.131 | 6.098 | 86.18 | 12.071 * |
| Ranges of ‘d’ | Ranges of ‘H’ | Interpretation |
|---|---|---|
| 0.5 < d < 0 | 0 < H < 0.5 | Intermediate memory tending towards short memory |
| 0 < d < 0.5 | 0.5 < H < 1 | Long memory, autoregression decays |
| Window Number | Sliding Observations | BECI UB d | BECI UB H | BECI LB d | BECI LB H | BECI Average d | BECI Average H |
|---|---|---|---|---|---|---|---|
| 1 | 0–200 | 0.36 | 0.86 | 0.50 | 1.00 | 0.43 | 0.93 |
| 2 | 100–300 | 0.45 | 0.95 | 0.41 | 0.91 | 0.43 | 0.93 |
| 3 | 200–400 | 0.35 | 0.85 | 0.30 | 0.80 | 0.33 | 0.83 |
| 4 | 300–500 | 0.48 | 0.98 | 0.41 | 0.91 | 0.45 | 0.95 |
| 5 | 400–600 | 0.44 | 0.94 | 0.41 | 0.91 | 0.42 | 0.92 |
| 6 | 500–700 | 0.44 | 0.94 | 0.31 | 0.81 | 0.37 | 0.87 |
| 7 | 600–800 | 0.42 | 0.92 | 0.29 | 0.79 | 0.36 | 0.86 |
| 8 | 700–900 | 0.45 | 0.95 | −0.05 | 0.45 | 0.20 | 0.70 |
| 9 | 800–1000 | 0.41 | 0.91 | 0.13 | 0.63 | 0.27 | 0.77 |
| 10 | 900–1100 | 0.46 | 0.96 | 0.43 | 0.93 | 0.44 | 0.94 |
| 11 | 1000–1200 | 0.29 | 0.79 | 0.48 | 0.98 | 0.39 | 0.89 |
| 12 | 1100–1300 | 0.50 | 1.00 | 0.38 | 0.88 | 0.44 | 0.94 |
| 13 | 1200–1400 | 0.33 | 0.83 | 0.47 | 0.97 | 0.40 | 0.90 |
| 14 | 1300–1500 | 0.43 | 0.93 | 0.40 | 0.90 | 0.42 | 0.92 |
| 15 | 1400–1600 | 0.41 | 0.91 | 0.48 | 0.98 | 0.45 | 0.95 |
| 16 | 1500–1700 | 0.43 | 0.93 | 0.43 | 0.93 | 0.43 | 0.93 |
| 17 | 1600–1800 | 0.43 | 0.93 | 0.37 | 0.87 | 0.40 | 0.90 |
| Window Number | Sliding Observations | BECI UB d | BECI UB H | BECI LB d | BECI LB H | BECI Average d | BECI Average H |
|---|---|---|---|---|---|---|---|
| 1 | 0–200 | 0.40 | 0.90 | 0.27 | 0.77 | 0.34 | 0.84 |
| 2 | 100–300 | 0.40 | 0.90 | 0.35 | 0.85 | 0.38 | 0.88 |
| 3 | 200–400 | 0.48 | 0.98 | 0.45 | 0.95 | 0.47 | 0.97 |
| 4 | 300–500 | 0.45 | 0.95 | 0.34 | 0.84 | 0.40 | 0.90 |
| 5 | 400–600 | 0.35 | 0.85 | 0.39 | 0.89 | 0.37 | 0.87 |
| 6 | 500–700 | 0.34 | 0.84 | 0.44 | 0.94 | 0.39 | 0.89 |
| 7 | 600–800 | 0.32 | 0.82 | 0.09 | 0.59 | 0.21 | 0.71 |
| 8 | 700–900 | 0.49 | 0.99 | 0.45 | 0.95 | 0.47 | 0.97 |
| 9 | 800–1000 | 0.48 | 0.98 | 0.41 | 0.91 | 0.45 | 0.95 |
| 10 | 900–1100 | 0.35 | 0.85 | −0.07 | 0.43 | 0.14 | 0.64 |
| 11 | 1000–1200 | 0.40 | 0.90 | 0.12 | 0.62 | 0.26 | 0.76 |
| 12 | 1100–1300 | 0.21 | 0.71 | 0.09 | 0.59 | 0.15 | 0.65 |
| 13 | 1200–1400 | 0.47 | 0.97 | 0.27 | 0.77 | 0.37 | 0.87 |
| 14 | 1300–1500 | 0.32 | 0.82 | 0.2 | 0.7 | 0.26 | 0.76 |
| 15 | 1400–1600 | 0.50 | 1.00 | 0.02 | 0.52 | 0.26 | 0.76 |
| 16 | 1500–1700 | 0.39 | 0.89 | 0.26 | 0.76 | 0.33 | 0.83 |
| 17 | 1600–1800 | 0.47 | 0.97 | 0.27 | 0.77 | 0.37 | 0.87 |
Publisher’s Note: MDPI stays neutral with regard to jurisdictional claims in published maps and institutional affiliations. |
© 2022 by the authors. Licensee MDPI, Basel, Switzerland. This article is an open access article distributed under the terms and conditions of the Creative Commons Attribution (CC BY) license (https://creativecommons.org/licenses/by/4.0/).
Share and Cite
Ghosh, B.; Bouri, E. Is Bitcoin’s Carbon Footprint Persistent? Multifractal Evidence and Policy Implications. Entropy 2022, 24, 647. https://doi.org/10.3390/e24050647
Ghosh B, Bouri E. Is Bitcoin’s Carbon Footprint Persistent? Multifractal Evidence and Policy Implications. Entropy. 2022; 24(5):647. https://doi.org/10.3390/e24050647
Chicago/Turabian StyleGhosh, Bikramaditya, and Elie Bouri. 2022. "Is Bitcoin’s Carbon Footprint Persistent? Multifractal Evidence and Policy Implications" Entropy 24, no. 5: 647. https://doi.org/10.3390/e24050647
APA StyleGhosh, B., & Bouri, E. (2022). Is Bitcoin’s Carbon Footprint Persistent? Multifractal Evidence and Policy Implications. Entropy, 24(5), 647. https://doi.org/10.3390/e24050647