Article

Identifying Important Nodes in Complex Networks Based on Node Propagation Entropy

1
School of Software, Yunnan University, Kunming 650091, China
2
Key Laboratory in Software Engineering of Yunnan Province, Yunnan University, Kunming 650091, China
3
School of Education, Yunnan University of Business Management, Kunming 650033, China
*
Authors to whom correspondence should be addressed.
Entropy 2022, 24(2), 275; https://doi.org/10.3390/e24020275
Submission received: 14 December 2021 / Revised: 7 February 2022 / Accepted: 12 February 2022 / Published: 14 February 2022
(This article belongs to the Section Complexity)

Abstract

:
In recent years, the identification of the essential nodes in complex networks has attracted significant attention because of their theoretical and practical significance in many applications, such as preventing and controlling epidemic diseases and discovering essential proteins. Several importance measures have been proposed from diverse perspectives to identify crucial nodes more accurately. In this paper, we propose a novel importance metric called node propagation entropy, which uses a combination of the clustering coefficients of nodes and the influence of the first- and second-order neighbor numbers on node importance to identify essential nodes from an entropy perspective while considering the local and global information of the network. Furthermore, the susceptible–infected–removed and susceptible–infected–removed–susceptible epidemic models along with the Kendall coefficient are used to reveal the relevant correlations among the various importance measures. The results of experiments conducted on several real networks from different domains show that the proposed metric is more accurate and stable in identifying significant nodes than many existing techniques, including degree centrality, betweenness centrality, closeness centrality, eigenvector centrality, and H-index.

1. Introduction

Complex systems in many real-world domains are modeled as complex networks to ensure efficient analysis. Such systems include electrical networks [1], social networks [2,3], protein–DNA networks [4], transportation networks [5], and biological networks [6]. In recent years, the identification of the essential nodes in complex networks has attracted significant interest because of their important theoretical and practical significance, e.g., in preventing and controlling epidemic diseases [7,8], controlling the spread of rumors [9,10], proposing new marketing strategies [11], and discovering essential proteins [12]. Faced with a large-scale complex network, the question of how to rapidly and productively determine the important nodes in the network is the first challenge that has to be addressed in the study of node importance.
Several importance metrics have been proposed to evaluate the significance of nodes from a network topology perspective. They include degree centrality [13], betweenness centrality [14], closeness centrality [14], k-shell [15], and eigenvector centrality [16]. Degree centrality, which asserts that the more neighbors a node has, the more influential it is, is relatively simple, intuitive, and easy to implement. However, it generally does not consider the global properties of the network or the individual properties of nodes. Therefore, it does not perform well in most real-world applications. Betweenness centrality asserts that the more times the shortest length path between any pair of nodes in the network passes over one node, the more mediated the node is, and the more critical in the network. Closeness centrality asserts that the smaller the mean value of the shortest length path from a node to the rest of the nodes in the network, the more influential the node is in the network. K-shell asserts that the closer the node is to the core of the network, the more critical it is. Nodes within the same shell are considered to have the same importance and the same scalability. However, k-shell is unsuitable for real networks. Eigenvector centrality asserts that a node’s importance is determined by the number and importance of its neighbors (i.e., the degree of the node). However, it is unsuitable for large networks.
Zhao et al. [17] asserted that the significance of a node is related to both its own significance and to that of the nodes to which it connects. However, any metric that takes this into consideration will have high time complexity. Ullah et al. [18] proposed a Local and Global Centrality (LGC) measurement algorithm that identifies significant nodes by processing both local and global information about network topology. Methods have been proposed based on random walks, e.g., the famous PageRank [19], LeaderRank [20], VoteRank [21], and HITS [22]. Entropy has been used to scale the importance of nodes as well [23,24]. For example, Zareie et al. [25] proposed a method based on information entropy to test the propagation ability of a node in a network according to the topological information of the node. Fei et al. [26] integrated the advantages of existing importance metrics and proposed a method to identify critical nodes using relative entropy and the technique for order performance by similarity to idea solution (TOPSIS) method. Hu et al. [27] proposed a sorting method for influential nodes with structural holes. Thus, the use of entropy for identifying key nodes has a sound theoretical basis and is the basis of several proposed approaches.
The idea of complex networks originated in the field of statistical physics, where entropy is an important concept. The primary starting point of this study is the application of entropy to the identification of important nodes in complex networks. Traditionally, Shannon entropy [24] has been used to analyze the overall statistical characteristics of networks. The centrality of nodes considers the importance of a node in the whole network; thus, the entropy of nodes can be considered as reflecting the importance of a node. Furthermore, the decision tree, which is very common in machine learning for data analysis, is also based on entropy.
Inspired by the useful applications of entropy outlined above, we propose a novel entropy-based metric to measure the importance of nodes in complex networks. The proposed metric, called node propagation entropy, combines the clustering coefficients of nodes and the influence of the first- and second-order neighbor numbers on node importance from an entropy perspective. We evaluate the proposed node propagation entropy metric via epidemic models and robustness experiments. The results of experiments conducted on twelve real networks from different domains show that the proposed node propagation entropy metric provides superior performance in terms of monotonicity, rankings list accuracy, and stability. The application of node propagation entropy in complex networks expands the practical application of information entropy theory.
The remainder of this paper is structured as follows: Section 2 describes the critical metrics used in the comparison experiments; Section 3 provides the details of the proposed node propagation entropy metric and its implementation; Section 4 analyzes the experimental performance of the proposed metric; and Section 5 provides concluding remarks.

2. Centrality Indicators

A complex network can be modeled as G = (V,E), where V = {v1,v2,…,vn} is a set of nodes, E = {e1,e2,…,em} is the set of edges between the nodes, and n, m denote the number of nodes and edges in the network, respectively. Each edge in E is located between its corresponding nodes in V.
Many methods have been proposed for the identification and determination of the significance of key nodes in complex networks in terms of degree centrality, betweenness centrality, closeness centrality, eigenvector centrality, H-index, and GIN. The definitions of these methods and metrics are as follows.
Definition 1 (Important Nodes).
Important nodes are nodes that play an essential role in the organization of network structure or the dynamical behavior of network system [28]. Previous research has generally used node centrality to quantify node importance. We propose the node propagation entropy metric to quantify the importance of nodes by calculating node centrality from an entropy perspective.
Definition 2 (Degree Centrality, DC).
The DC [13] of a node, i, is calculated as follows:
D C ( i ) = j i n a i j
where node j represents any node other than i, n is the total number of nodes, and a i j denotes the edge between nodes i and j. If an edge exists, a i j has a value of “1”; otherwise, its value is “0”.
Definition 3 (Betweenness Centrality, BC).
The BC [14] of a node, i, is calculated as follows:
B C ( i ) = j , l i g j l ( i ) g j l
where nodes j and l represent any two nodes other than i, gjl denotes the number of shortest length paths from node j to node l, and gjl(i) denotes the number of shortest length paths from node j to node l via node i.
Definition 4 (Closeness Centrality, CC).
The CC [14] of a node, i, is calculated as follows:
C C ( i ) = j N d i j 1
where dij denotes the distance from node i to node j.
Definition 5 (Eigenvector Centrality, EC).
The EC [16] of a node, i, is evaluated as follows:
E C ( i ) = x i = c j N ( i ) a i j x j
where N(i) denotes the neighbors of node i, c is a constant, xi signifies the importance of node i, and a i j denotes the edge between nodes i and j. If the edge exists, then a i j has a value of “1”; otherwise, its value is “0”. We denote x = x 1 , x 2 , x 3 , , x n T , and after several iterations to reach the steady-state, we obtain the following form:
x = c A x
where x is an eigenvector corresponding to the eigenvalue c−1of matrix A. In addition, it can be expressed as A x = c 1 x   , where c 1 is the eigenvalue of matrix A.
Definition 6 (H-index).
Lü et al. [29] constructed the operator H to act on a limited number of real numbers (x1,x2,…,xn) which return an integer y, where y is the maximum value satisfying the condition that there are at least y items in (x1,x2,…,xn), each not smaller than y. Then, the H-index of node i is calculated as follows:
h i = H ( k a , k b , , k c )
where ki denotes the degree of node i and k a , k b , , k c denote the degrees of the node’s neighbors. We define hi(0) = ki to be a node i with zero-order H-index. More generally, an n-order H-index (n > 0) is defined as follows:
h i ( n ) = H ( h a ( n 1 ) , h b ( n 1 ) , , h c ( n 1 ) )
where the first-order H-index value is the final H-index value, i.e., hi(1) = hi.
Definition 7 (GIN).
The GIN [17] of a node, i, is calculated as follows:
G I N ( i ) = e k i n i j k j d i j
where ki denotes the degree of node i and * signifies the multiplication operator.
Definition 8 (LGC).
The LGC [18] of a node, i, is calculated as follows:
L G C ( i ) = k i n j i k j + d i j
where is a tunable parameter. LGC performs best when = 0.4 [18]; therefore, we herein set = 0.4 .

3. Materials and Methods

In general, the importance of a node and its impact on other nodes are enhanced when the node effectively spreads information throughout the network. To evaluate the ability of nodes to locate important nodes in complex networks, we propose the node propagation entropy (PE) metric, which combines the clustering coefficients of nodes and the influence of the first- and second-order neighbor numbers on node importance from an entropy perspective.

3.1. Node Propagation Entropy

Nodes prefer to form relatively tightly connected groups with each other [30]. This tendency is greater than the average probability of establishing a random relationship between two nodes. In complex networks, the clustering coefficient is used as a measure of the degree of node clustering. The clustering coefficient is divided into the global and local clustering coefficients. This study uses the local clustering coefficient. The local clustering coefficient of a node i is given by the ratio of the actual number of edges existing between the neighboring nodes of node i to the largest number of possible edges. Thus, the local clustering coefficient of an undirected network is defined as follows:
c i = 2 j , k N ( i ) a j k k i ( k i 1 )
where N(i) denotes all first-order neighboring nodes of node i and ki denotes the degree of node i. If ki ≤ 1, we allow ci = 0.
Degree centrality states that any increase in a node’s neighbors extends its influence; therefore, we extend degree centrality to second-order neighbors. The propagation ability of a node is related to both the number of first-order neighbors and to the number of second-order neighbors, which is comparable to the probability of befriending the friend of a friend. Further, we consider the effect of the clustering coefficient on node propagation ability. According to the random walk theory, information from a node in the network is transmitted to other nodes to which it is connected with a certain probability; the larger the clustering coefficient of a node, the easier it is for the information to be transmitted back. Therefore, the larger the clustering coefficient, the worse the node’s propagation ability. The larger the average node clustering coefficient, the slower the propagation if other network parameters remain constant.
Accordingly, we propose the idea of Clustering Coefficient and Neighbors (cn), which describes the local propagation capacity of nodes and is defined as follows:
c n i = ( N 2 ( i ) + N ( i ) ) / ( 1 + c i )
where N(i) and N2(i) represent the number of first- and second-order neighbors of node i, respectively; ci denotes the clustering coefficient of node i.
cn only considers local information, not global information. Entropy has been successfully used to assess the significance of nodes in a network [31]. Therefore, we adopt the definition of information entropy and propose node PE, which considers a certain amount of global information in the network as an indicator of node importance.
Node PE is defined as follows in Equations (12) and (13):
I i = c n i j = 1 n c n j
where node j denotes any node in a network, n is the total number of nodes, and cnj denotes the local propagation capacity of node j.
P E i = j N ( i ) I j ln I j
where N(i) denotes all first-order neighbors of node i and j represents any node in N(i).
Equation (12) compensates for the deficiency in Equation (11), where the local propagation capacity only considers local information about the nodes. More specifically, it considers a certain amount of global information about the network which replaces the relative importance of the nodes with the ratio of the local propagation capacity of each node to that of the total nodes.
Meanwhile, Equation (13) is based on the definition of information entropy considering the relative importance of nodes obtained from Equation (12). It replaces the probability of j with the relative importance of neighbor node j to derive the PE of node i. Node PE states that the importance of a node should be assessed by considering all its neighbors, and that each neighbor node contributes differently. I j ln I j indicates the contribution of neighbor node j. The importance of node i is equal to the sum of the contributions of all neighbors of node i.
Algorithm 1 outlines the calculation process of PE.
Algorithm 1: Propagation entropy (PE) computation procedure
Input: G = (V,E)
1: Initialize network G
2: for each vertex i in V do
3: if i degree ≤ 1:
4:  ci = 0
5: else:
6:  compute ci via Equation (10)
7: end for
8: sumcn = 0.0
9: for each vertex i in V do
10: sumneigh = N(i) + N2(i)
11: cni = sumneigh/(1 + ci)
12: sumcn += cni
13: end for
14: for each vertex i in V do
15: Ii = cni/sumcn
16: end for
17: for each vertex i in V do
18: sum_Ii = 0.0
19: for each vertex j in N(i) do
20:  sum_Ii +=Ijln(Ij)
21: PEi = sum_Ii
22: end for
23: Rank the PE value of all nodes
Output: An ordered list of nodes
The PE computation procedure comprises four steps. First, calculate the clustering coefficient of each node (time complexity: O(n2)). Second, calculate the number of second-order neighbors (time complexity: O(n2)). The time complexity of the third and fourth steps is O(n). Consequently, the aggregate time complexity of PE is O(n2).

3.2. Effectiveness of the Proposed Node Propagation Entropy Metric

In this section, the yeast protein interaction network of Saccharomyces cerevisiae [32] is used to verify the effectiveness of the proposed node PE metric. Nodes in the network represent proteins, while each edge represents the interactions between two proteins. The yeast–protein interaction network contains 5093 nodes and 24,743 edges. Of the 5093 nodes in the yeast network, 1167 are important, 3591 are unimportant, and the importance of the remaining 335 is unknown.
We used ten different centrality measures to identify important proteins in this yeast network. Further, we used the precision metric [33] to evaluate the accuracy with which the important proteins are identified. The indicator only considers whether the top k nodes are predicted accurately; its value is equal to the proportion of nodes in the first k nodes that are predicted accurately. The precision metric is defined as follows:
p r e c i s i o n = n p k
where np denotes the number of important nodes contained in the first k nodes of the prediction. k was set as 1167 in this yeast network test.
It can be seen from Table 1 that the accuracy of the PE metric is on par with that of other importance measures, and PE can accurately identify important nodes in the network. These results indicate that it is reasonable and adequate to use PE as a metric for evaluating node importance.

4. Experiments and Results

4.1. Date

To better demonstrate the validity of the node PE metric for representing the importance of nodes, we evaluated it on twelve real networks from different domains. None of the networks allow for the existence of self-loops, i.e., two vertices of an edge having the same vertex. The twelve real networks comprised (i) two human social networks, the Train [34] and Karate [35] networks; (ii) a collaboration network, Ca_Sandi_Auth [36]; (iii) an animal network, Dolphins [34]; (iv) a DIMACS10 and a bio-c. elegans neural network [36]; (v) an email network, Email-Enron [36]; (vi) two miscellaneous networks, PolBooks [34] and AdjNoun [36]; (vii) an interaction network, Crime [34]; (viii) a metabolic network, Yeast [34]; a co-authorship network, Netscience [34]; and an infrastructure network, Uspowergrid [34]. These networks are publicly available and were downloaded from http://konect.cc/networks/ (accessed on 13 December 2021) and https://networkrepository.com/networks.php (accessed on 13 December 2021).
The topological features of the network dataset are presented in Table 2.

4.2. Evaluation of the Susceptible–Infected–Removed Model

This section focuses on the principles and implementation of the susceptible–infected–removed (SIR) model to set the stage for subsequent experiments. In the study of infectious disease dynamics, to analyze the influence of crucial nodes in complex networks, the SIR model [37] (developed by Kermack and McKendrick in 1927 when they studied the transmission patterns of the Black Death and plague) is frequently employed. The SIR model replicates the natural state of disease transmission. It divides the population into the following three categories: S for susceptible, I for infected, and R for removed (Figure 1).
The proportions of individuals in susceptible, infected, and recovered status as a percentage of the total over time is expressed as follows:
d s ( t ) d t = β i ( t ) s ( t ) d i ( t ) d t = β i ( t ) s ( t ) γ i ( t ) d r ( t ) d t = γ i ( t )
where, s(t), i(t), and r(t) denote those nodes in susceptible, infected, and recovered status at time t, respectively; β is the infection rate; and γ is the recovery rate.
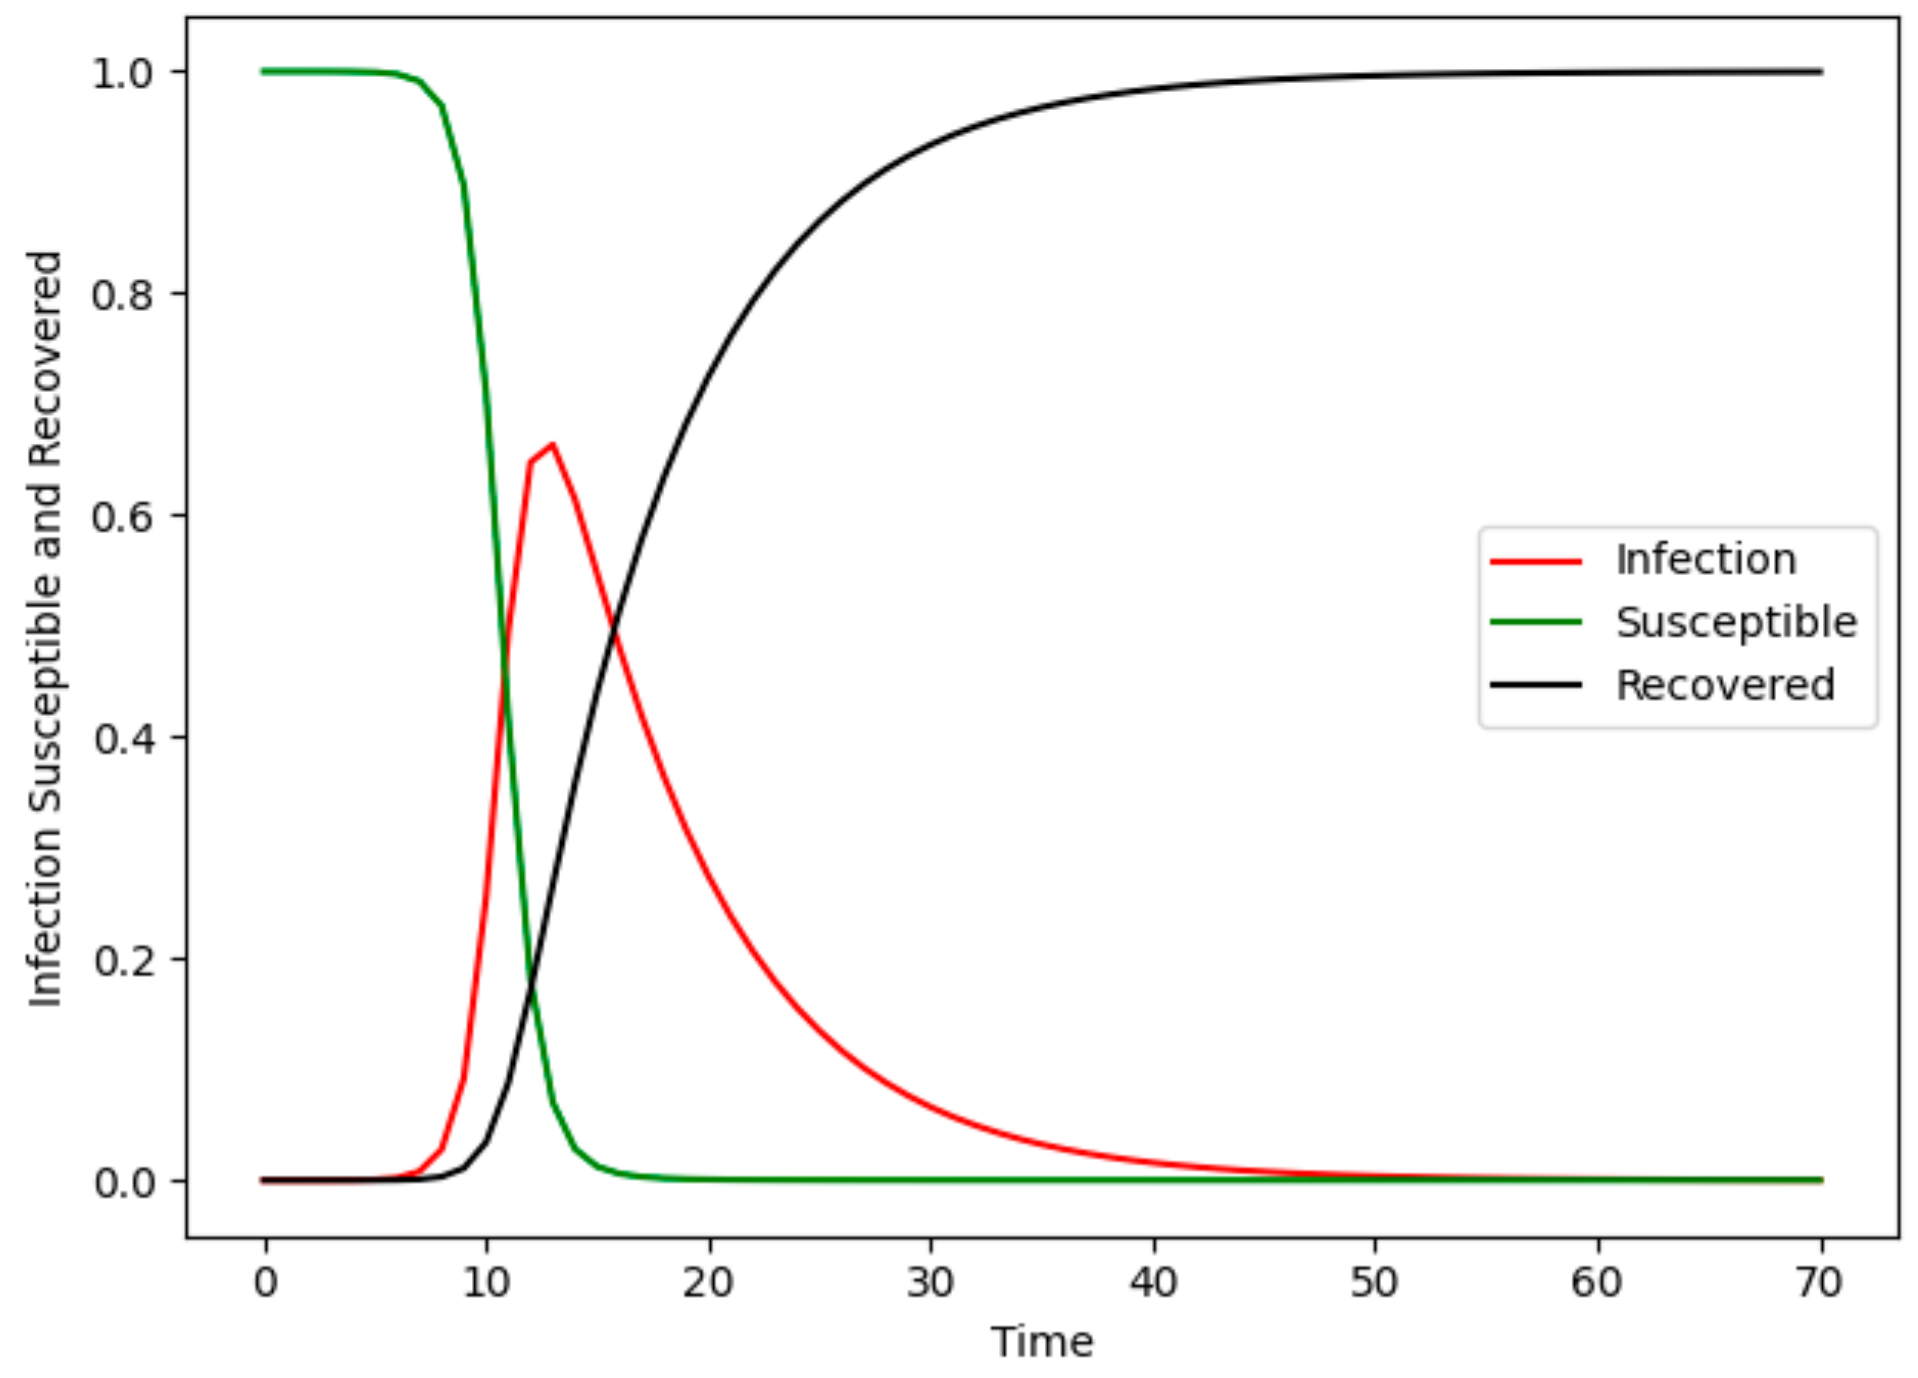
In the SIR model, the proportion of nodes in different states to all nodes varies with time (Figure 2). When the probability of infection is high, all susceptible nodes eventually become infected over time, whereas all infected individuals are eventually in the recovered state.
We applied the SIR model to analyze the impact of critical nodes in the complex networks and to model the propagation of information between the nodes. The propagation process was as follows. First, one node was infected, and all others were susceptible. In each time step, nodes in the infected condition infected other neighboring nodes in the susceptible condition with a probability β (here, set as the prevalence threshold of the network). Second, each of the previously infected nodes entered the recovered state with a probability γ (set as 1) [18,38]; nodes in the recovered state would not be reinfected. The process of propagation was reiterated until the network was free of infected nodes. The propagation capability of node i is expressed by Ri, which is the mean number of final nodes recovered over 1000 independent runs, with each independent run of node i being the only infected seed. The higher the value of Ri, the better is the propagation capability of node i. Third, a list of nodes ranked in descending order of importance was obtained based on the propagation ability of the nodes in the network.
Based on the theory of heterogeneous mean fields [39], the prevalence threshold of the SIR model was approximated as
β c = < k > < k 2 > < k >
where <k> denotes the mean degree of community c.

4.3. Evaluation of the Susceptible–Infected–Removed–Susceptible Model

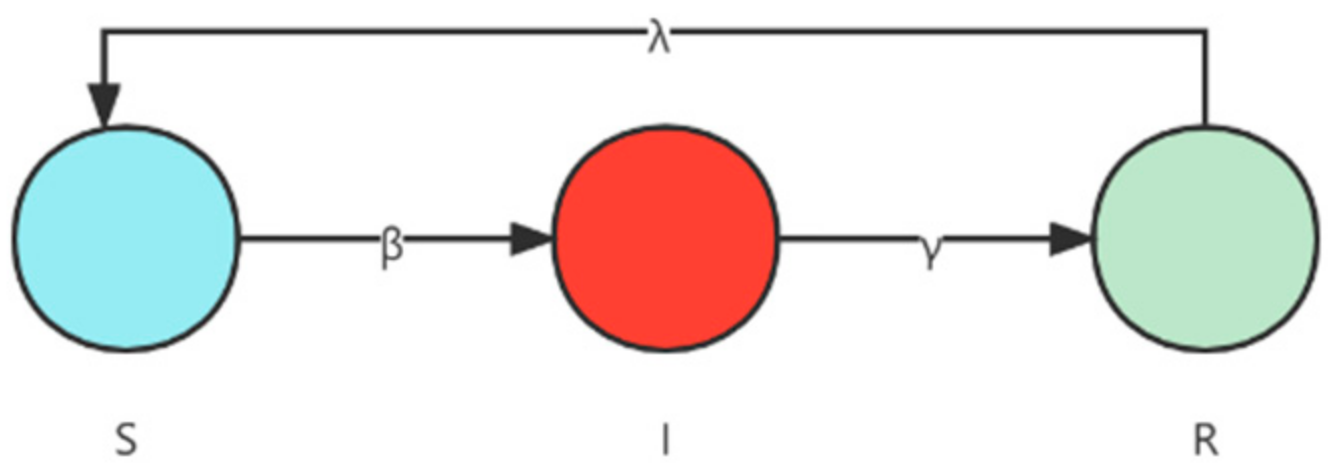
The SIR model, the Susceptible–Infected–Removed–Susceptible (SIRS) model [40], is obtained by adding antibody time to the SIR model. Further, in the SIRS model the recovered only have temporary immunity. After the antibody time, they become susceptible and may be infected again. This divides the total population into the following three categories: S for susceptible, I for infected, and R for removed (Figure 3).
The proportions of individuals with susceptible, infected, and recovered status as a percentage of the total over time is expressed as follows:
d s ( t ) d t = β i ( t ) s ( t ) + λ r ( t ) d i ( t ) d t = β i ( t ) s ( t ) γ i ( t ) d r ( t ) d t = γ i ( t ) λ r ( t )
where, s(t), i(t), and r(t) denote those nodes with susceptible, infected, and recovered status at time t, respectively; β is the infection rate; λ is the loss of immunization rate; and γ is the recovery rate.

4.4. Kendall Coefficient (τ)

We used the SIR and SIRS models to produce a descending order rankings list of node importance based on their propagation ability in the network. The Kendall coefficient, τ [41], was applied to estimate the correlation between the importance rankings list obtained by each importance measure and the real importance rankings list generated by the SIR model. The higher the τ value, the higher the correlation between the two rankings lists and the higher the accuracy of the results obtained by the method. The closer the Kendall coefficient is to one, the more accurate the ranking result is and the more effective the method is in identifying important nodes.
The Kendall coefficient considers a pair of binary groups consisting of two sets of random variables, X and Y. For any pair (Xi, Yi) and (Xj, Yj), the pair of binaries is said to be consistent if both Xi > Xj and Yi > Yj or Xi < Xj and Yi < Yj. They are considered inconsistent if Xi > Xj and Yi < Yj or Xi < Xj and Yi > Yj; if Xi = Xj or Yi = Yj, the pair is neither consistent nor inconsistent. The Kendall coefficient, τ, is calculated as follows:
τ = 2 ( n c n i ) n ( n 1 )
where nc and ni denote the number of consistent and inconsistent binary groups, respectively, and n denotes the number of binary groups. The Kendall coefficient τ is in the range [−1, 1]. Ideally, if τ = 1, then the rankings list produced by the degree centrality metric is identical to the rankings list produced by the actual propagation process.

4.5. Epidemic Models Experiment

This section compares the node PE metric with nine other node importance metrics: K-shell++, DC, BC, CC, EC, PE(N2), H-index, GIN, and LGC. In order to compare the performance of cn and N2, we use PE for PE calculated with cn and PE(N2) for PE calculated with N2. First, the SIR and SIRS models were applied to determine the impact of nodes on the dynamic propagation process to obtain the node propagation ability generated by the natural propagation process of the ranked list. Then, the Kendall coefficient was applied to estimate the extent to which the node PE metric was similar to the propagation capability of a single node. The performance of the other nine comparison metrics was similarly measured using the Kendall coefficient.
The correlation between the rankings lists provided by the ten different importance measures for nine real networks in different domains and the rankings list obtained from the SIR model by adjusting the infection rate, β, are depicted in Figure 4.
Figure 4 shows that the fold of the node PE metric is at the top of each comparison plot, especially near the threshold value where the value of τ for PE is largest, indicating its effectiveness in identifying vital nodes. When 0.1 ≤ β ≤ 0.4, PE obtained larger τ values in the nine real networks, especially in the Adjnoun, Ca_Sandi_Authh, and PolBooks networks, indicating that PE more accurately identified important nodes in the networks. In large networks, such as Crime and NetScience, PE performed well and obtained the maximum τ value for both networks, indicating that PE has an advantage in identifying important nodes. In contrast to certain centrality measures, the performance of which fluctuated widely from network to network, the node PE metric performed well across networks, indicating its stability.
When the contagion probability, β, is very low in the SIR model, the disease does not spread because the infected node has only a small probability of infecting its neighbors; hence, the node only infects a limited area or not at all, making it difficult to measure the proper spread of the node. Conversely, when the transmission rate is high, the disease infects a large proportion of nodes regardless of which node it started from, which is meaningless for comparing the impact of individual nodes. Therefore, we focused on the range in which the transmission rate was around the epidemic threshold [39].
From Table 3, we obtained the τ values of each importance metric under the prevalence threshold of each network, from which it can be seen that the node PE metric performed better than the other importance metrics; PE performed best for eight of the nine networks.
The nine real networks used in the SIR model experiments are representative networks in various fields, and the experimental results are general. Figure 4 and Table 3 show that PE obtained higher τ values for all nine networks, especially the Ca_Sandi_Auth, Email-Enron, Dolphins, Crime, and Polbooks networks, for which the value was higher than that of the other nine methods. The closer τ was to one, the more accurate the sorting results were. We found that PE tends to perform better than PE(N2), indicating that cn is better suited to identify important nodes than N2. The results show that PE identified the critical nodes in the network more accurately, and had strong applicability and good performance in most networks.
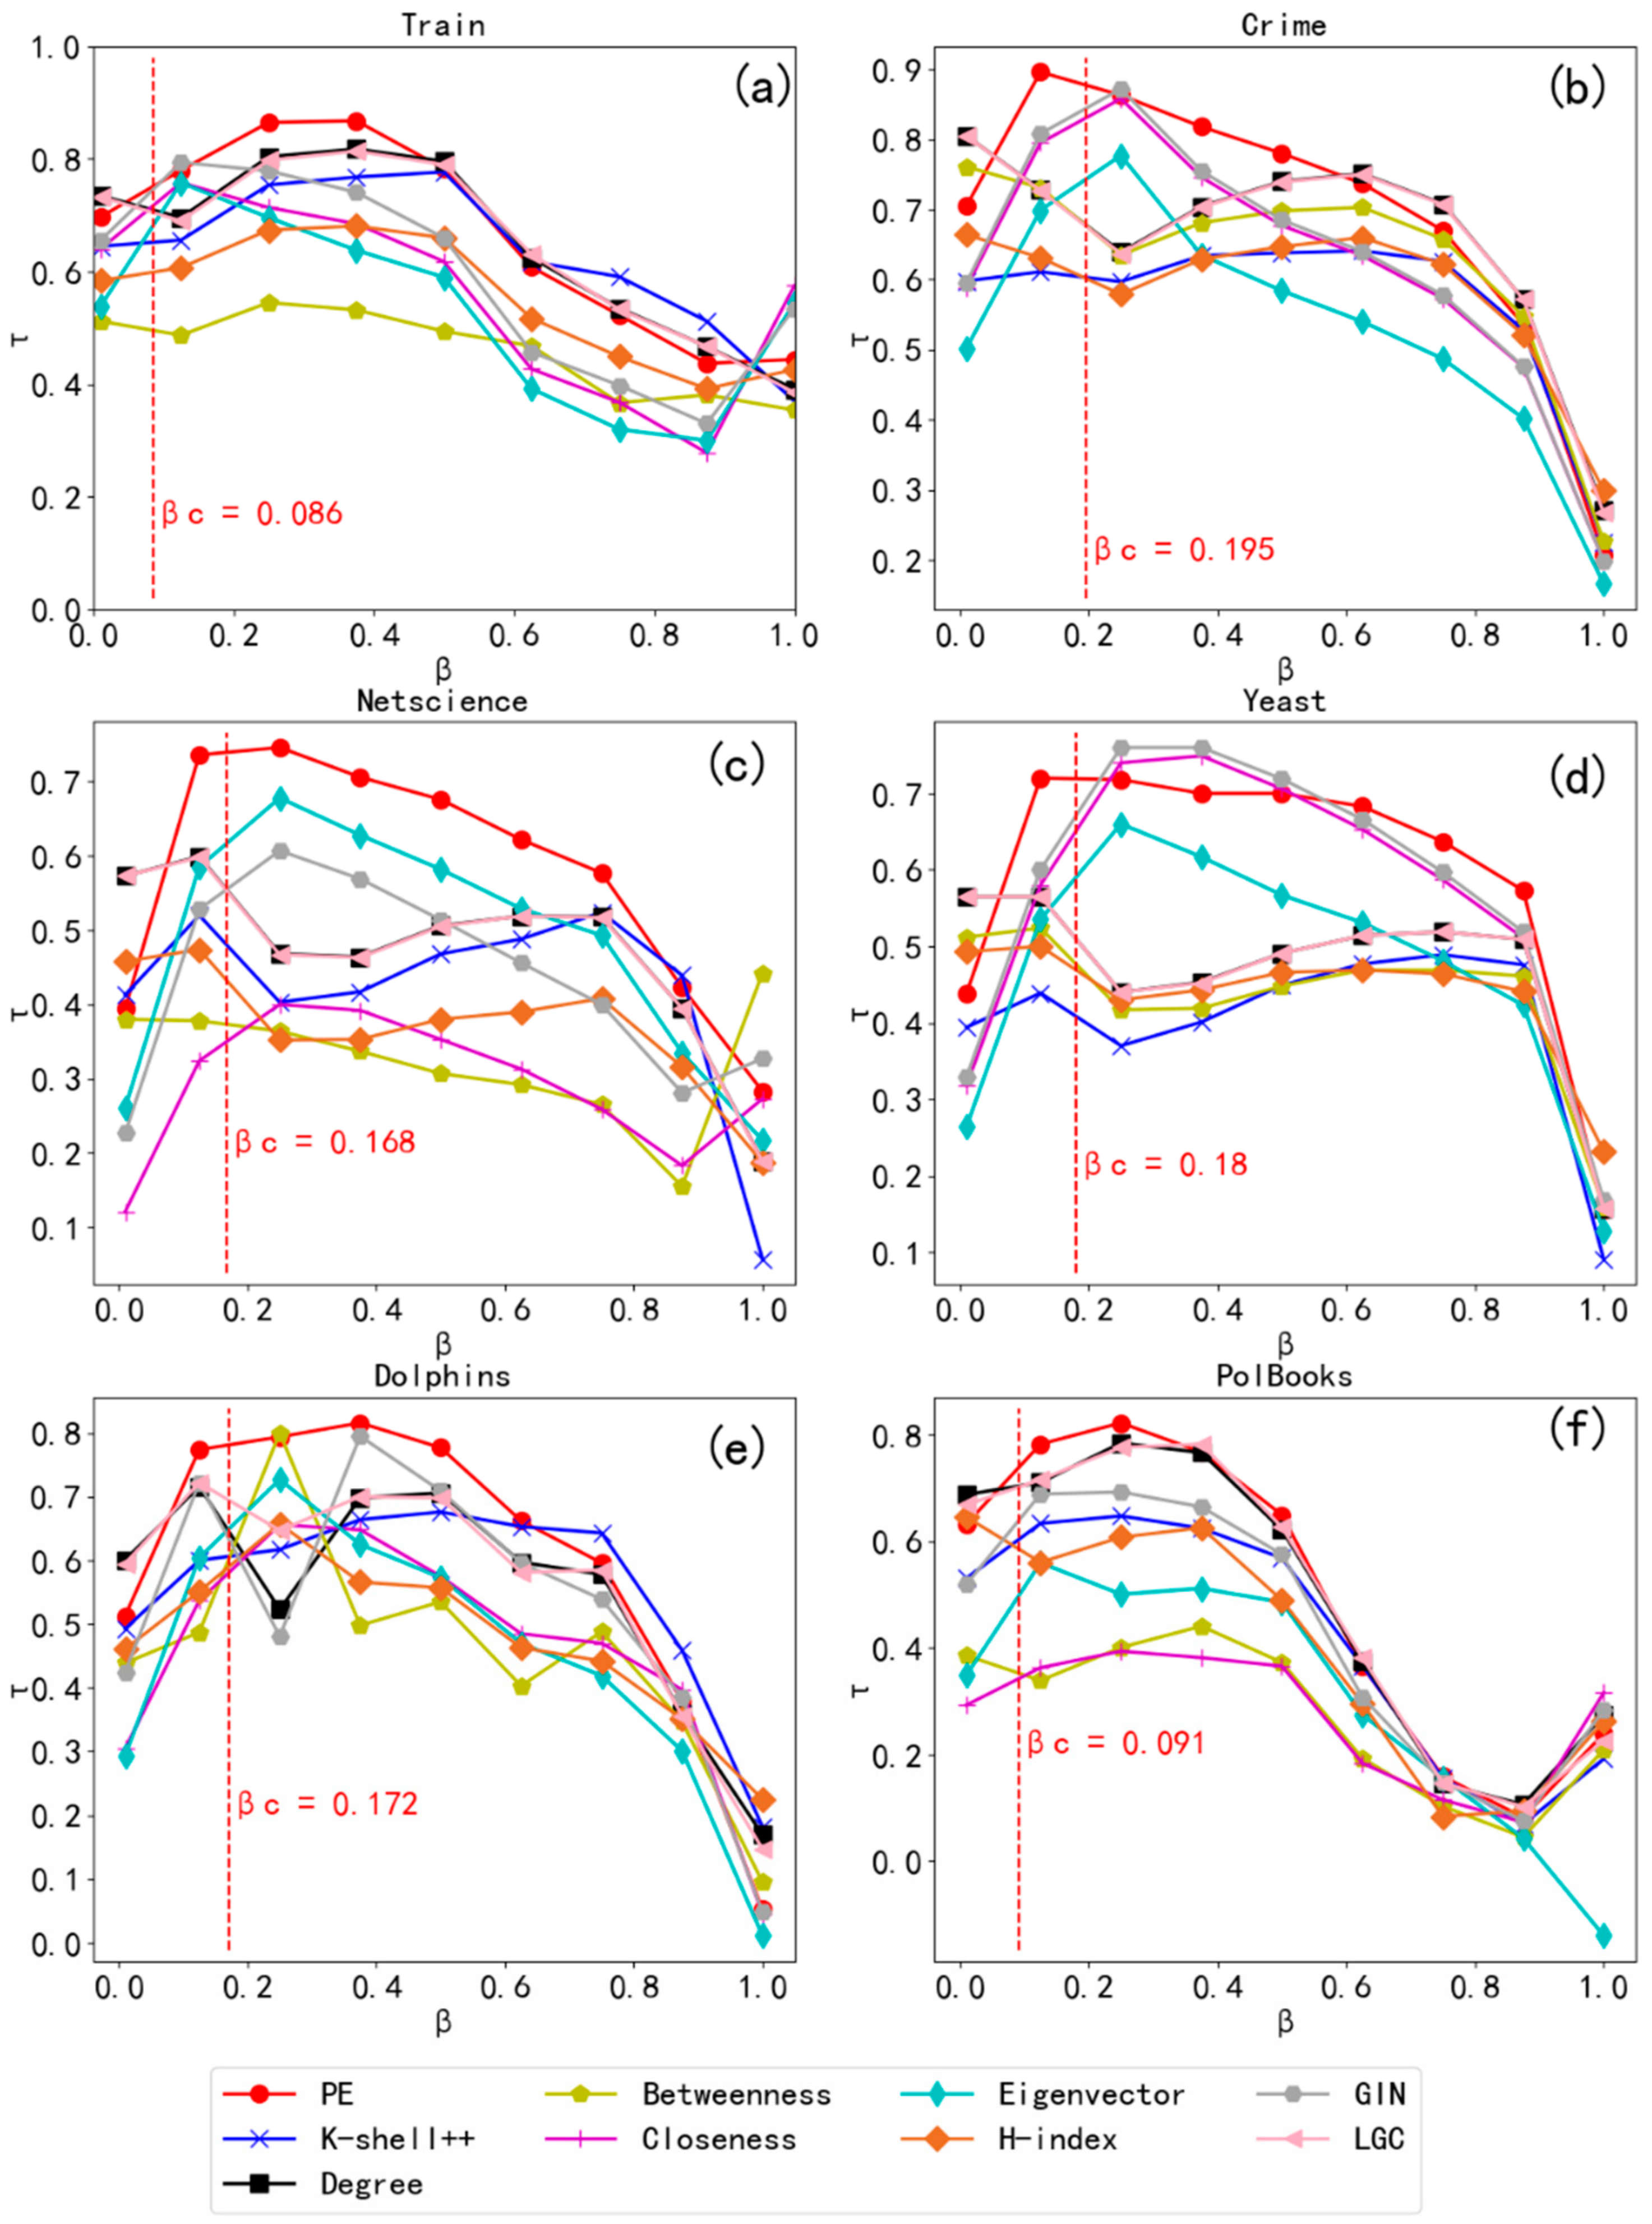
The correlation between the rankings lists provided by nine different importance measures, six real networks in different domains, and the rankings lists obtained from the SIRS model by adjusting the infection rate β are shown in Figure 5.
Figure 5 shows that PE performed the best compared to the other eight importance measures on both small and large networks. We found that the performance of degree centrality was best when the value of β was small. This might be because when the infection rate is small, it is difficult for infected nodes to infect other nodes; at this time, the more neighboring nodes a node has, the more likely it is that the node will infect other nodes, which is consistent with reality. Figure 5 shows that the rankings list obtained from PE correlates more strongly with that obtained from the SIRS model as the infection rate increased, especially when β was near the prevalence threshold, and was higher than other importance indicators. Therefore, the rankings list of nodes obtained by PE was more accurate, and PE identified important nodes in the network accurately.
Table 4 shows that we obtained the τ values of each importance metric under the prevalence threshold of each network, from which it can be seen that the node PE metric performed better than the other importance metrics; PE performed the best on all six networks.
Figure 5 and Table 4 show that in the six real networks used in the SIRS model experiment, regardless of size, the importance rankings list obtained by PE was more closely related to the real importance rankings list simulated by the SIRS model. Furthermore, the τ value was higher and better than that of the other eight importance indexes. In addition, the results show that PE could identify the important nodes in the network in the SIRS model.

4.6. Robustness Experiment

This section evaluates the accuracy of the algorithm in identifying important nodes from the perspective of robustness [42] and whether the significance of a node is determined by the impact on network connectivity after removing the node. We assess the impact of node failure on network connectivity through the largest connectivity coefficient [43]; the greater the impact, the more important the failed node is.
A connected component is a network subgraph in which any two nodes in a subgraph are connected. There are many disconnected networks in the real world. These are broken down into multiple connected components, in which the connected component with the largest number of nodes is called the largest connected component [43]. The size of the largest connected component reflects the connectivity of a complex networks. The scale of the largest connected component changes owing to the removal of nodes. After removing the important nodes, its scale becomes smaller; the greater the change, the more crucial the nodes that were removed. Hence, the robustness of the network was estimated with the largest connectivity coefficient.
The largest connected coefficient (denoted r) can be defined as the ratio of the number of nodes contained in the network’s largest connected component to the overall number of nodes in the network. It is formulated as follows:
r = n c n
where nc denotes the number of nodes contained in the network’s largest connected component after the removal of some nodes and n denotes the total number of nodes in the network. The value varies according to the ratio of the number of nodes removed from the network to the overall number of nodes in the network, which is denoted f. A gradual decrease in the r value is observed as the number of nodes removed increases.
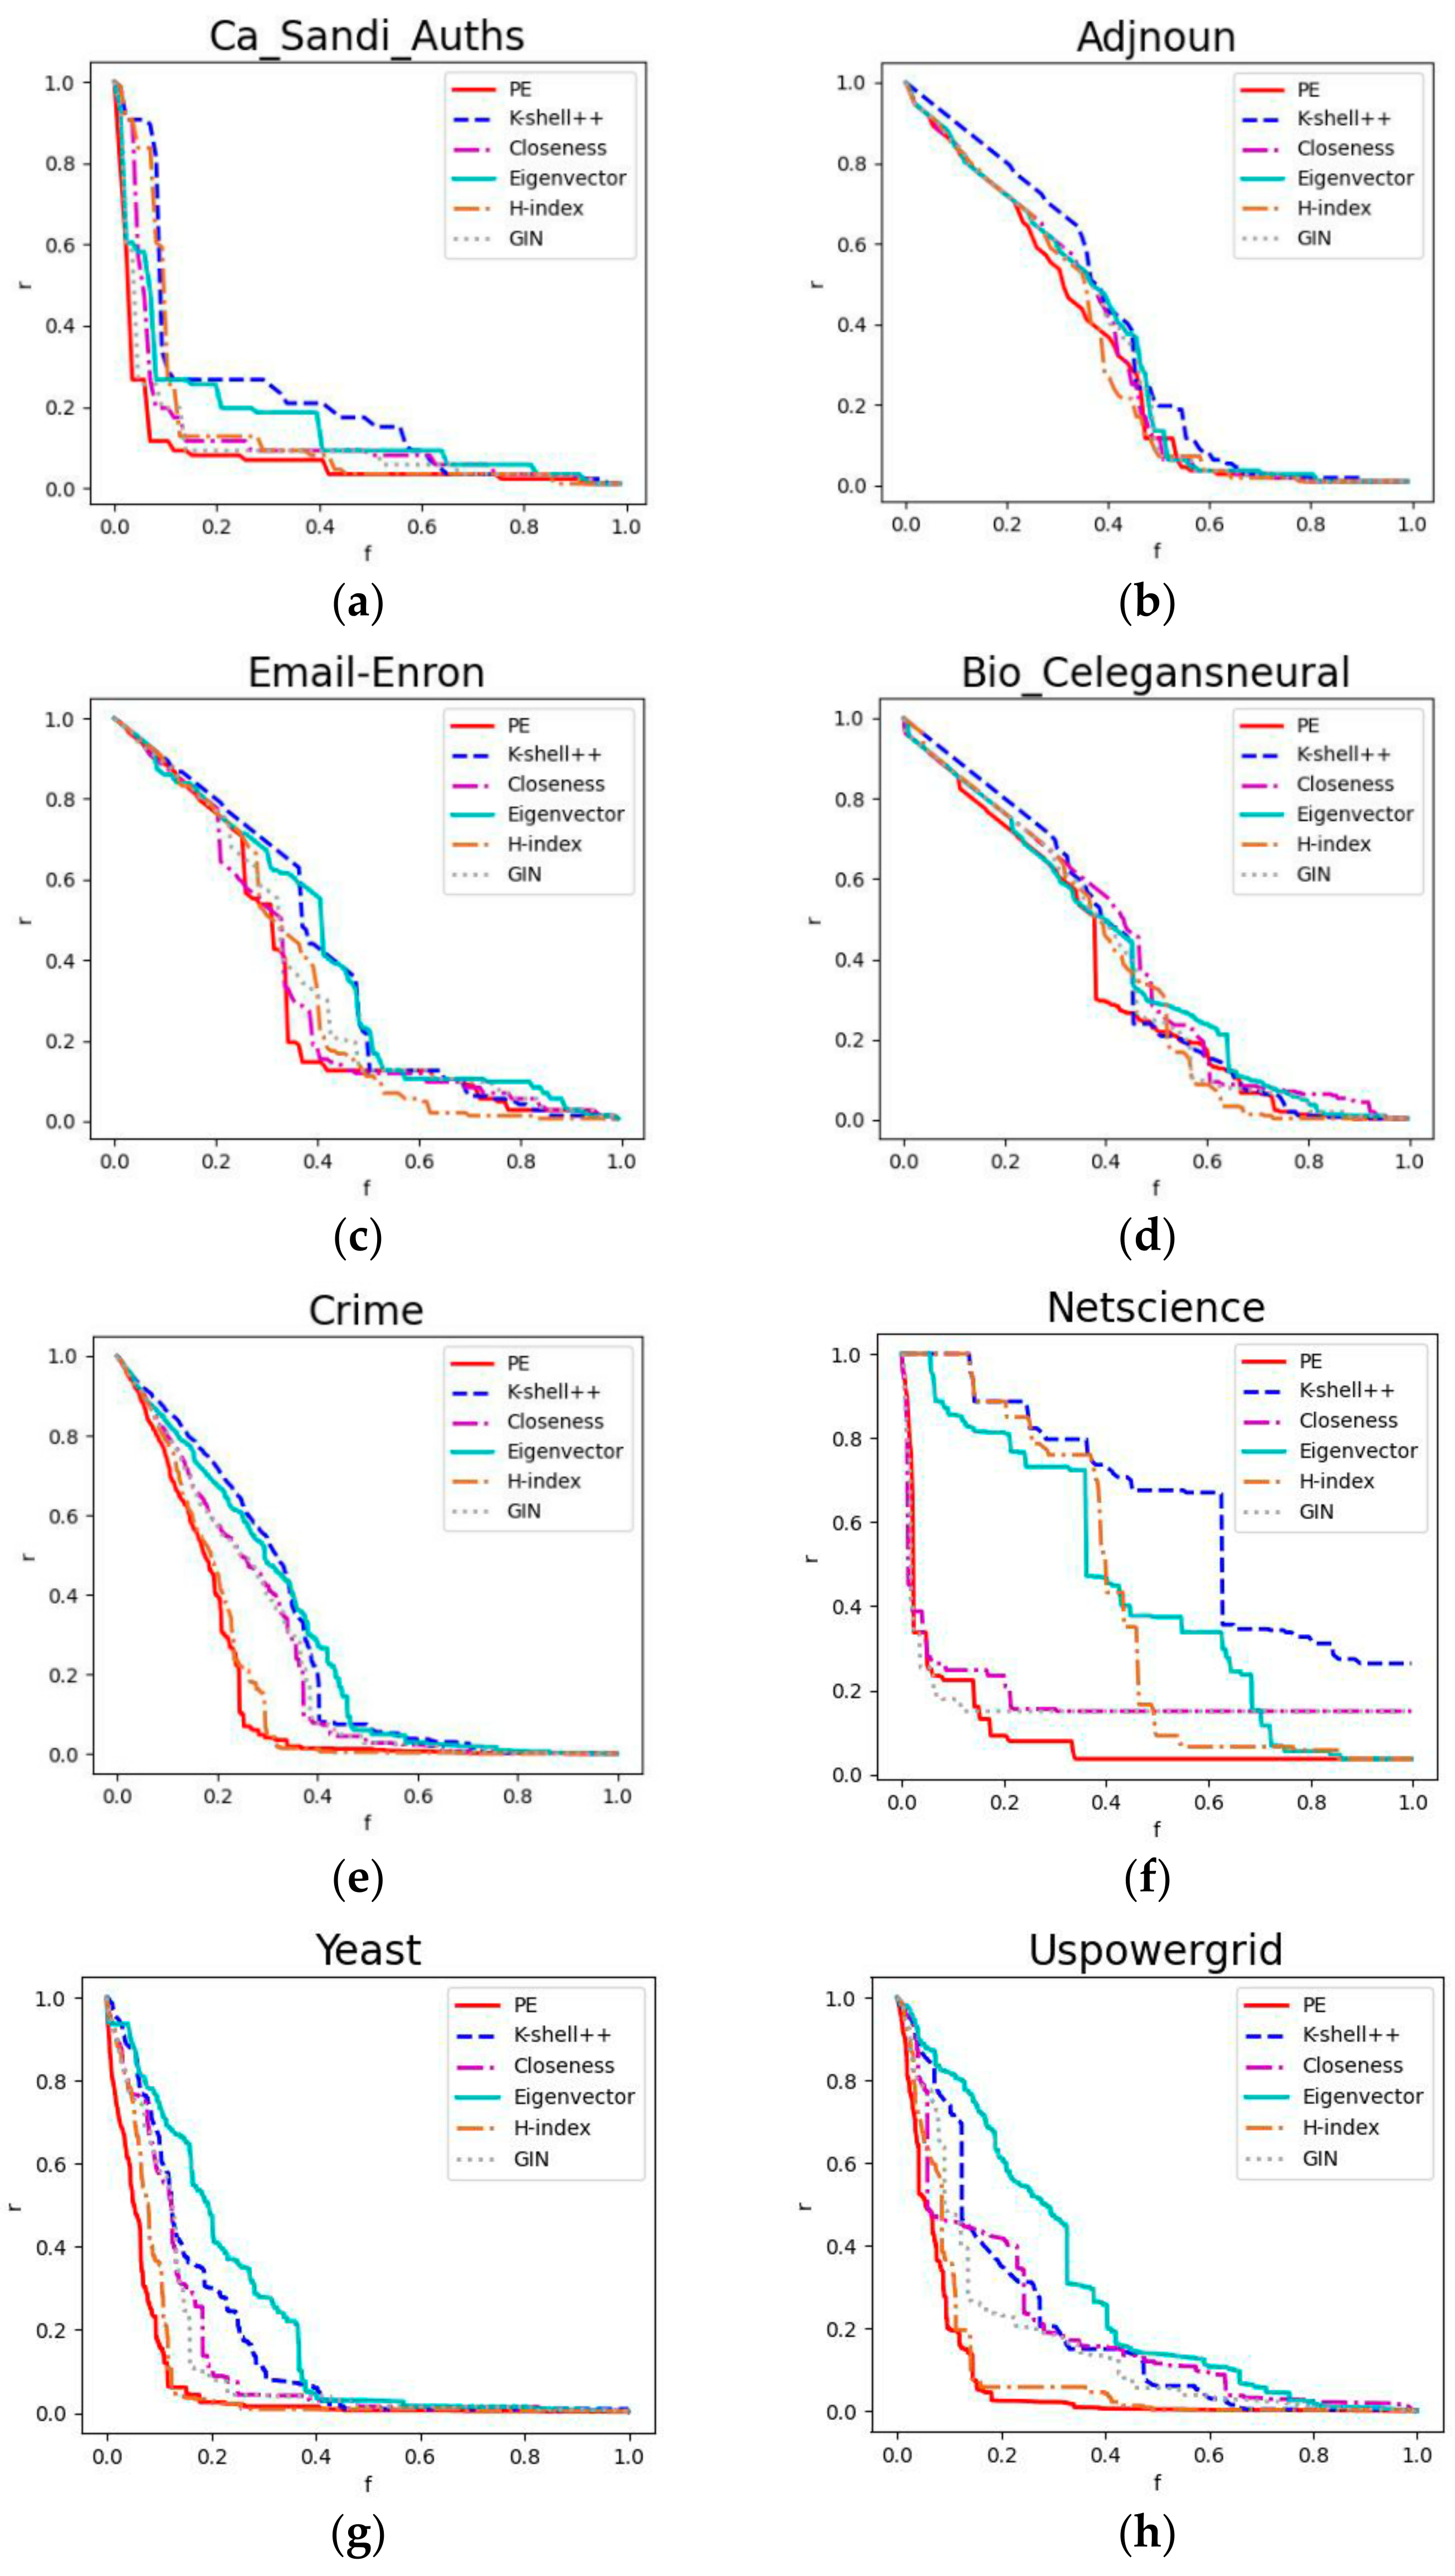
By drawing the network nodes on two-dimensional coordinates in terms of the importance evaluation algorithm, the curve of the change in the largest connectivity coefficient of the network was analyzed after the nodes were removed one by one on the basis of their order of importance, from largest to smallest. The more pronounced the downward trend of the curve, the better the effect of the algorithm. Eight different real-world networks respectively used six different importance measures to sort the nodes and remove them in order of importance from largest to smallest (Figure 6).
We used the robustness value, R [42,44], to estimate the performance of the method; R is calculated as follows:
R = 1 n j = 1 n r j
where n denotes the total number of nodes in the original network and rj signifies the largest connected coefficients after removing j nodes. Every time a node is removed, the largest connectivity coefficient of the network is calculated and added to R; this process iterates until the network is empty. Consequently, the smaller the final R value is, the faster the network crashes, illustrating that the important nodes identified by the algorithm are more accurate.
We analyzed the robustness of the above six different importance measures on the basis of connectivity. Table 4 presents the evaluation results of their robustness, R.
From Equation (19), it was inferred that the smaller the robustness value, the faster the network collapses, expressed as better performance of the algorithm in identifying important nodes. Table 5 shows that PE rapidly reduced the maximum connectivity coefficient, r, of the network on all eight networks, with the smallest R value, and identified the important nodes in the network. The results verify that when PE removed network nodes in order of importance from largest to smallest, it minimized the robustness; i.e., the node PE metric accurately identified the important nodes in the network.

5. Discussion

This paper proposed a novel importance metric, node PE, for identifying critical nodes in complex networks. Node PE achieves this by combining the effects of the clustering coefficients and number of first- and second-order neighbor on the importance of nodes from an entropy perspective while considering the global and local information of the network. We applied the proposed method to nine real networks in order to evaluate its performance, and simulated the propagation process using the epidemic model. The ranking correlation between the rankings lists (those generated by different centrality metrics and that generated by simulation results) was measured using the Kendall coefficient, τ.
The results of comparative experiments conducted using nine different importance measures, specifically, K-Shell++, DC, BC, CC, EC, H-index, GIN, and LGC, showed that our proposed node PE metric provides superior performance and is relatively stable as compared to other methods. We observed that PE provided very accurate results in the epidemic models as well as in the robustness experiments. Furthermore, our proposed measure outperformed other measures and was consistent on most networks. Through experimental demonstrations on twelve real networks from different domains, the proposed node PE metric proved to be more effective and stable in identifying significant nodes in complex networks. However, there are limitations to node PE, such as the fact that it is designed to be used only on undirected networks. In future work, we will investigate the viability of the node PE metric in directed networks and verify whether PE is predictive in real-world contexts.

Author Contributions

Conceptualization, T.G. and J.L.; methodology, Y.Y.; software, B.Z.; validation, B.Z., Y.Y. and L.C.; formal analysis, Y.Y.; investigation, B.Z.; resources, L.C.; data curation, L.C.; writing—original draft preparation, B.Z.; writing—review and editing, Y.Y.; visualization, B.Z.; supervision, J.L.; project administration, T.G.; funding acquisition, Y.Y. All authors have read and agreed to the published version of the manuscript.

Funding

This research was funded by the Science Foundation of Yunnan Province, grant number 202001BB050063, and the Open Foundation of Key Laboratory in Software Engineering of Yunnan Province, grant number 2020SE315.

Data Availability Statement

The datasets generated during and analyzed during the current study are available in The Network Data Repository, https://networkrepository.com, accessed on 13 December 2021.

Acknowledgments

The authors would like to thank the editors for their encouragement and the reviewers for their valuable comments and suggestions.

Conflicts of Interest

The authors declare no conflict of interest.

References

  1. Pagani, G.A.; Aiello, M.J. The power grid as a complex network: A survey. Phys. A Stat. Mech. 2013, 392, 2688–2700. [Google Scholar] [CrossRef] [Green Version]
  2. Serrat, O. Social network analysis. In Knowledge Solutions; Springer: Berlin/Heidelberg, Germany, 2017; pp. 39–43. [Google Scholar]
  3. Scott, J.J. Social network analysis: Developments, advances, and prospects. Soc. Netw. Anal. Min. 2011, 1, 21–26. [Google Scholar] [CrossRef]
  4. Sathyapriya, R.; Vijayabaskar, M.; Vishveshwara, S.J. Insights into protein–DNA interactions through structure network analysis. PLoS Comput. Biol. 2008, 4, e1000170. [Google Scholar] [CrossRef] [PubMed] [Green Version]
  5. Saberi, M.; Hamedmoghadam, H.; Ashfaq, M.; Hosseini, S.A.; Gu, Z.; Shafiei, S.; Nair, D.J.; Dixit, V.; Gardner, L.; Waller, S.T. A simple contagion process describes spreading of traffic jams in urban networks. Nat. Commun. 2020, 11, 1616. [Google Scholar] [CrossRef] [Green Version]
  6. Bracken, C.P.; Scott, H.S.; Goodall, G.J. A network-biology perspective of microRNA function and dysfunction in cancer. Nat. Rev. Genet. 2016, 17, 719–732. [Google Scholar] [CrossRef]
  7. Gates, M.C.; Woolhouse, M.E. Controlling infectious disease through the targeted manipulation of contact network structure. Epidemics 2015, 12, 11–19. [Google Scholar] [CrossRef]
  8. Chaters, G.; Johnson, P.; Cleaveland, S.; Crispell, J.; De Glanville, W.; Doherty, T.; Matthews, L.; Mohr, S.; Nyasebwa, O.; Rossi, G.J. Analysing livestock network data for infectious disease control: An argument for routine data collection in emerging economies. Philos. Trans. R. Soc. B 2019, 374, 20180264. [Google Scholar] [CrossRef] [Green Version]
  9. Lin, Y.; Cai, Z.; Wang, X.; Hao, F.J. Incentive mechanisms for crowdblocking rumors in mobile social networks. IEEE Trans. Veh. Technol. 2019, 68, 9220–9232. [Google Scholar] [CrossRef]
  10. Yang, L.; Li, Z.; Giua, A.J. Containment of rumor spread in complex social networks. J. Inf. Sci. 2020, 506, 113–130. [Google Scholar] [CrossRef]
  11. Badi, S.; Wang, L.; Pryke, S.J. Relationship marketing in Guanxi networks: A social network analysis study of Chinese construction small and medium-sized enterprises. Ind. Mark. Manag. 2017, 60, 204–218. [Google Scholar] [CrossRef]
  12. Yu, H.; Li, C.; Wang, X.; Duan, J.; Yang, N.; Xie, L.; Yuan, Y.; Li, S.; Bi, C.; Yang, B.J. Techniques and strategies for potential protein target discovery and active pharmaceutical molecule screening in a pandemic. J. Proteome Res. 2020, 19, 4242–4258. [Google Scholar] [CrossRef] [PubMed]
  13. Freeman, L.C. Centrality in social networks conceptual clarification. Soc. Netw. 1978, 1, 215–239. [Google Scholar] [CrossRef] [Green Version]
  14. Freeman, L.C. A set of measures of centrality based on betweenness. Sociometry 1977, 40, 35–41. [Google Scholar] [CrossRef]
  15. Kitsak, M.; Gallos, L.K.; Havlin, S.; Liljeros, F.; Muchnik, L.; Stanley, H.E.; Makse, H.A. Identification of influential spreaders in complex networks. Nat. Phys. 2010, 6, 888–893. [Google Scholar] [CrossRef] [Green Version]
  16. Bonacich, P.; Lloyd, P.J. Eigenvector-like measures of centrality for asymmetric relations. Soc. Netw. 2001, 23, 191–201. [Google Scholar] [CrossRef]
  17. Zhao, J.; Wang, Y.; Deng, Y.J. Identifying influential nodes in complex networks from global perspective. Chaos Soliton. Fract. 2020, 133, 109637. [Google Scholar] [CrossRef]
  18. Ullah, A.; Wang, B.; Sheng, J.; Long, J.; Khan, N.; Sun, Z.J. Identifying vital nodes from local and global perspectives in complex networks. Expert Syst. Appl. 2021, 186, 115778. [Google Scholar] [CrossRef]
  19. Brin, S.; Page, L. The anatomy of a large-scale hypertextual web search engine. Comput. Netw. ISDN Syst. 1998, 30, 107–117. [Google Scholar] [CrossRef]
  20. Lü, L.; Zhang, Y.C.; Yeung, C.H.; Zhou, T.J. Leaders in social networks, the delicious case. PLoS ONE 2011, 6, e21202. [Google Scholar] [CrossRef] [Green Version]
  21. Zhang, J.X.; Chen, D.B.; Dong, Q.; Zhao, Z.D. Identifying a set of influential spreaders in complex networks. Sci. Rep. 2016, 6, 27823. [Google Scholar] [CrossRef]
  22. Kleinberg, J.M. Authoritative Sources in a Hyperlinked Environment. J. ACM 1999, 46, 604–632. [Google Scholar] [CrossRef]
  23. Guo, C.; Yang, L.; Chen, X.; Chen, D.; Gao, H.; Ma, J.J. Influential nodes identification in complex networks via information entropy. Entropy 2020, 22, 242. [Google Scholar] [CrossRef] [PubMed] [Green Version]
  24. Shannon, C.E. A mathematical theory of communication. Bell Syst. Tech. J. 1948, 27, 379–423. [Google Scholar] [CrossRef] [Green Version]
  25. Zareie, A.; Sheikhahmadi, A.; Fatemi, A.J. Influential nodes ranking in complex networks: An entropy-based approach. Chaos Soliton. Fract. 2017, 104, 485–494. [Google Scholar] [CrossRef]
  26. Fei, L.; Deng, Y.J. A new method to identify influential nodes based on relative entropy. Chaos Soliton. Fract. 2017, 104, 257–267. [Google Scholar] [CrossRef]
  27. Hu, P.; Mei, T.J. Ranking influential nodes in complex networks with structural holes. Phys. A Stat. Mech. Appl. 2018, 490, 624–631. [Google Scholar] [CrossRef]
  28. Qiu, Z.; Fan, T.; Li, M. Identifying vital nodes by Achlioptas process. N. J. Phys. 2021, 23, 033036. [Google Scholar] [CrossRef]
  29. Lü, L.; Zhou, T.; Zhang, Q.M.; Stanley, H.E. The H-index of a network node and its relation to degree and coreness. Nat. Commun. 2016, 7, 1–7. [Google Scholar] [CrossRef] [Green Version]
  30. Watts, D.J.; Strogatz, S.H. Collective dynamics of ‘small-world’ networks. Nature 1998, 393, 440–442. [Google Scholar] [CrossRef]
  31. Nie, T.; Guo, Z.; Zhao, K.; Lu, Z.M. Using mapping entropy to identify node centrality in complex networks. Phys. A Stat. Mech. Appl. 2016, 453, 290–297. [Google Scholar] [CrossRef]
  32. Li, M.; Zhang, H.; Wang, J.; Pan, Y. A new essential protein discovery method based on the integration of protein-protein interaction and gene expression data. BMC Syst. Biol. 2012, 6, 15. [Google Scholar] [CrossRef] [PubMed] [Green Version]
  33. Turpin, A.; Scholer, F. User performance versus precision measures for simple search tasks. In Proceedings of the International ACM SIGIR Conference on Research and Development in Information Retrieval, Seattle, WA, USA, 6–11 August 2006. [Google Scholar]
  34. Kunegis, J. KONECT: The Koblenz network collection. In Proceedings of the 22nd International Conference on World Wide Web, Rio de Janeiro, Brazil, 13–17 May 2013; Association for Computing Machinery: Rio de Janeiro, Brazil, 2013; pp. 1343–1350. [Google Scholar]
  35. Zachary, W.W. An Information Flow Model for Conflict and Fission in Small Groups. Anthropol. Res. 1977, 33, 452–473. [Google Scholar] [CrossRef] [Green Version]
  36. Rossi, R.; Ahmed, N. The network data repository with interactive graph analytics and visualization. In Proceedings of the Twenty-Ninth AAAI Conference on Artificial Intelligence, Austin, TX, USA, 25–30 January 2015. [Google Scholar]
  37. Pellis, L.; Ball, F.; Bansal, S.; Eames, K.; House, T.; Isham, V.; Trapman, P.J. Eight challenges for network epidemic models. Epidemics 2015, 10, 58–62. [Google Scholar] [CrossRef] [PubMed]
  38. Salavati, C.; Abdollahpouri, A.; Manbari, Z. Ranking nodes in complex networks based on local structure and improving closeness centrality. Neurocomputing 2019, 336, 36–45. [Google Scholar] [CrossRef]
  39. Castellano, C.; Pastor-Satorras, R.J. Thresholds for epidemic spreading in networks. Phys. Rev. Lett. 2010, 105, 218701. [Google Scholar] [CrossRef] [Green Version]
  40. Ruhi, N.A.; Hassibi, B. SIRS epidemics on complex networks: Concurrence of exact Markov chain and approximated models. In Proceedings of the Conference on Decision and Control, Osaka, Japan, 15–18 December 2015. [Google Scholar]
  41. Biometrika, M.G. A new measure of rank correlation. Biometrika 1938, 30, 81–93. [Google Scholar]
  42. Schneider, C.; Moreira, A.; Andrade, J.; Havlin, S.; America, H.J. Mitigation of malicious attacks on networks. Proc. Natl. Acad. Sci. USA 2011, 108, 3838–3841. [Google Scholar] [CrossRef] [Green Version]
  43. Dereich, S.; Probability, P.M. Random networks with sublinear preferential attachment: The giant component. Ann. Probab. 2013, 41, 329–384. [Google Scholar] [CrossRef] [Green Version]
  44. Albert, R.; Jeong, H.; Barabási, A.L. Error and attack tolerance of complex networks. Nature 2000, 406, 378–382. [Google Scholar] [CrossRef] [Green Version]
Figure 1. Susceptible–infected–removed (SIR) epidemic model.
Entropy 24 00275 g001
Figure 2. Variation in the percentage of different state nodes in the SIR model.
Entropy 24 00275 g002
Figure 3. Susceptible–infected–removed–susceptible (SIRS) epidemic model.
Entropy 24 00275 g003
Figure 4. Performance comparison of the critical indicators in the SIR model for different values of β (infection rate). Each subgraph (ai) of the graph represents a real network; the network name is at the top of the graph and the vertical dashed line inside the graph indicates the prevalence threshold of that network. The performance of the node propagation entropy, PE, is highlighted in red, and the performance of the node propagation entropy, PE(N2), is highlighted in green. The higher the τ value, the better the performance of the corresponding centrality methods.
Entropy 24 00275 g004
Figure 5. Performance comparison of the critical indicators in the SIRS model for different values of β (infection rate). Each subgraph (af) of the graph represents a real network; the network name is at the top of the graph, the vertical dashed line inside the graph indicates the prevalence threshold of that network, and the performance of the node PE metric is highlighted in red. The higher the τ value, the better the performance of the corresponding centrality methods.
Entropy 24 00275 g005
Figure 6. Downward trend of the maximum connectivity coefficient of the critical indicators for different values of f (the proportion of removed nodes to the overall number of nodes). The horizontal coordinate denotes the node removal ratio f, and the vertical coordinate denotes the largest connectivity coefficient value, r, after the removal of the node. Each subgraph (ah) of the graph demonstrates the results of an experiment on a real network. The subgraph is ordered in increments by the total number of network nodes. At the same node removal scale, f, the more noticeable the maximum connectivity coefficient downtrend is, the more important the removed node is deemed to be. The graphs show that the downward trend of PE on eight networks is faster than that of the other five indicators, illustrating that PE performed the best. In conclusion, the PE indicator has the highest practical value.
Entropy 24 00275 g006
Table 1. Accuracy comparison of important proteins identified by ten different centrality indicators.
NetworkPEK − Shell + +DCBCCCECVoteRankH-IndexGINLGC
Saccharomyces0.3750.4040.4020.350.3540.3670.3510.4050.3640.404
Table 2. Topological features of the twelve actual networks used in the study.
Networknm<c><k>d
AdjNoun1124250.1737.5890.068
Train642430.5617.5930.120
Karate34780.2554.5880.139
Ca_Sandi_Auth861240.4142.8830.034
Email-Enron1436230.4348.7130.061
Dolphins621590.3085.1290.084
Polbooks1054410.3487.5890.068
Bio_celegansneural29723000.311150.053
Crime138014760.0092.140.002
Yeast187022770.0942.4350.001
Netscience146127420.6943.7530.001
Uspowergrid494165940.082.6690.001
Note: n, total number of nodes in each network; m, total number of connected edges in each network; c = i n c i n is the average clustering coefficient of each network; k = i n k i n is the average degree of each network; and d = 2 m n n 1 is the network density.
Table 3. Performance of the SIR model for ten indicators under a prevalence threshold, β, of nine networks. The best-performing results are highlighted in bold.
NetworkPEK − Shell + +DCBCCECPE(N2)H-IndexGINLGC
AdjNoun0.8940.7800.8280.6410.8660.9250.8440.7160.9050.827
Train0.8920.7400.8300.5580.7630.7610.8490.6610.8570.809
Ca_Sandi_Auth0.8580.5550.5720.4280.6580.7720.8080.4330.7760.578
Email − Enron0.8540.7680.8220.4880.6760.8530.8440.7030.8520.827
Dolphins0.9090.7130.7470.5410.6520.7070.8980.5770.8560.75
Polbooks0.8640.7150.7620.3620.3780.6010.8020.6110.7370.775
Crime0.8690.5960.6480.6540.8540.7860.8570.5820.8610.647
Netscience0.7510.4710.5400.3780.3370.6560.7300.4240.5510.539
Yeast0.7480.4070.5030.4740.6720.6060.6890.4600.6940.503
Table 4. Performance of the SIRS model for nine indicators under the prevalence threshold, β, of nine networks. The best-performing results are highlighted in bold.
NetworkPEK − Shell + +DCBCCCECH-IndexGINLGC
Train0.7700.6760.7220.4770.7180.6960.6350.7620.716
Dolphins0.8020.6460.6910.4970.5960.6720.5250.7680.688
Polbooks0.7450.6410.6760.3410.3520.5500.5220.6700.671
Crime0.8750.5920.6490.6510.8530.7750.5820.8680.649
Netscience0.7440.4730.5520.3780.3410.6440.4310.5490.551
Yeast0.7470.4000.4950.4680.6680.6100.4730.6920.495
Table 5. Robustness (R) values for six indicators of eight networks. The best-performing results are highlighted in bold.
Network.PEK − Shell + +CCECH − IndexGIN
Ca_Sandi_Auth0.0820.2100.1310.1640.1430.112
AdjNoun0.3150.3730.3290.3380.3160.333
Email − Enron0.3190.3860.3250.3910.3240.347
Bio_celegansneural0.3510.3870.3980.3890.3640.374
Crime0.1680.2910.2460.2900.1800.247
Netscience0.0930.6250.1860.4340.4080.172
Yeast0.0650.1630.1320.2130.0840.123
Uspowergrid0.0730.2000.1970.2940.0970.165
Publisher’s Note: MDPI stays neutral with regard to jurisdictional claims in published maps and institutional affiliations.