2.1. Start-Up
Much has been written about the survival of start-up companies. Usually this is directed to reasons why such companies fail and do not manage to survive the so-called valley of death in which companies fail due to inadequate working capital. Many other reasons can lead to failure, poor management, marketing, etc. Here, we are not concerned with these micro details rather we shall explore the mortality from a physics perspective looking for general features which characterize the mortality of all companies. For our purposes, a useful dataset is provided at LinkedIn in a paper by McIntyre [
6]. Here, can be found survival data for cohorts of companies from their start-up year of 1994 through to 2021. More data is provided for similar cohorts beginning in 1995 and all years through to 2020. Each dataset consisted of over 500,000 companies ensuring good statistics. Earlier data for the period 1947–1954 is given by Steidl [
7]. Steidl differentiates between manufacturing, retail and service industries. We show in
Figure 2, survival probabilities for both data sets. The broad trend is similar but clearly the data for 1947–1954 falls more steeply than that for more recent years.
From this data for the survival probability,
σ(
t), we can compute numerically the ‘force of mortality’, or more simply the mortality,
μ(
t). By definition this is the conditional probability that given a person is alive at time
t, they will die in within the time interval [
t,
t + Δ
t]. It is equivalent to the rate of death conditional on life at time
t. It follows from this formal definition that it is equal to the ratio of the unconditional survival probability density and the survival probability at time
t:
The Steindl data is fitted extremely well by a hyperbolic function as can be seen on
Figure 3. For the average values we find
. This allows us to compute the mortality directly by simple differentiation. Thus
However, from the figure it is readily seen that neither an exponential nor a hyperbolic function fits the McIntyre data and a simple first order difference procedure was used to compute annual values for the mortality which does however follow a hyperbolic function over much of the timescale. Thus, both McIntyre and Steindl data sets decay in a similar way following closely the hyperbolic trend
. Decaying with a power law of −1, the Steindl data follow the value observed for human mortality. The more recent data decays more slowly.
However, it may be seen in
Figure 3 that for the recent McIntyre data there is hint of a minimum in the mortality versus time after approximately 20 years which is roughly the same as the minimum observed for humans. Such a minimum is not yet evident in the data of Steindl which only available for up to 10 years.
2.2. Mortality of Mature Companies
Having easy access to the UK FTSE100 index we chose to begin here. Comparing the composition for the FTSE 100 when it was first established in 1984 with that in 2021 we can establish 53 companies missing from the 2021 index. The company pages on Wikipedia then provides dates for both birth and death.
At this point a word of caution is in order. Within this list some companies did die in the sense of going bankrupt. However, others were taken over or merged into another company. Here, we did not differentiate between these different modes of ‘death’. Takeovers and mergers were simply regarded as a point of death. Clearly a takeover or merger ‘deaths is different in nature to a simple bankruptcy. In a sense such a death may not be dissimilar to deaths which occur in some biological systems such as that of a caterpillar as it becomes a butterfly. However, our dataset here is small and we leave further investigation of this point for another study for which a larger index or examination of multiple indices is required.
The lifetime of our 53 companies varies from 13 to 259 years. The one with the shortest lifetime is an oil company; the longest is a brewery. In between we see many types of company. For example: food production, electronics and telephone companies, banks and investment trusts.
Figure 4 shows the survival probability of the 53 companies. This was computed simply using the data sets.
Unlike the data for early-stage companies, the survival probability shown in
Figure 4 for the set of mature companies is clearly not smooth. Applying the route used previously to compute the mortality leads to a result which exhibits a number of anomalous sharp peaks which remain despite extensive smoothing of the data. One of us (PR) is grateful to an anonymous referee for pointing out the folly of this procedure. To work around this problem we followed a different procedure. From the data for the survival probability, we first computed the negative of the logarithm. Numerical derivatives were then computed from the resulting data using the central difference approximation yielding the mortality. This procedure has the added benefit of avoiding the numerical division by the survival probability, thus:
The result is shown in
Figure 5. The dots are computed data points and whilst there is scatter, the solid curve which an exponential fit corresponding to Gompertz behaviour fits reasonably well.
Finally,
Figure 6 shows both sets of data (start-up and mature companies together in the manner of
Figure 1 for human mortality.) The left-hand curve for small companies is plotted on a log-log scale; the mature company data is shown on a log-linear scale. The ordinate scales are identical.
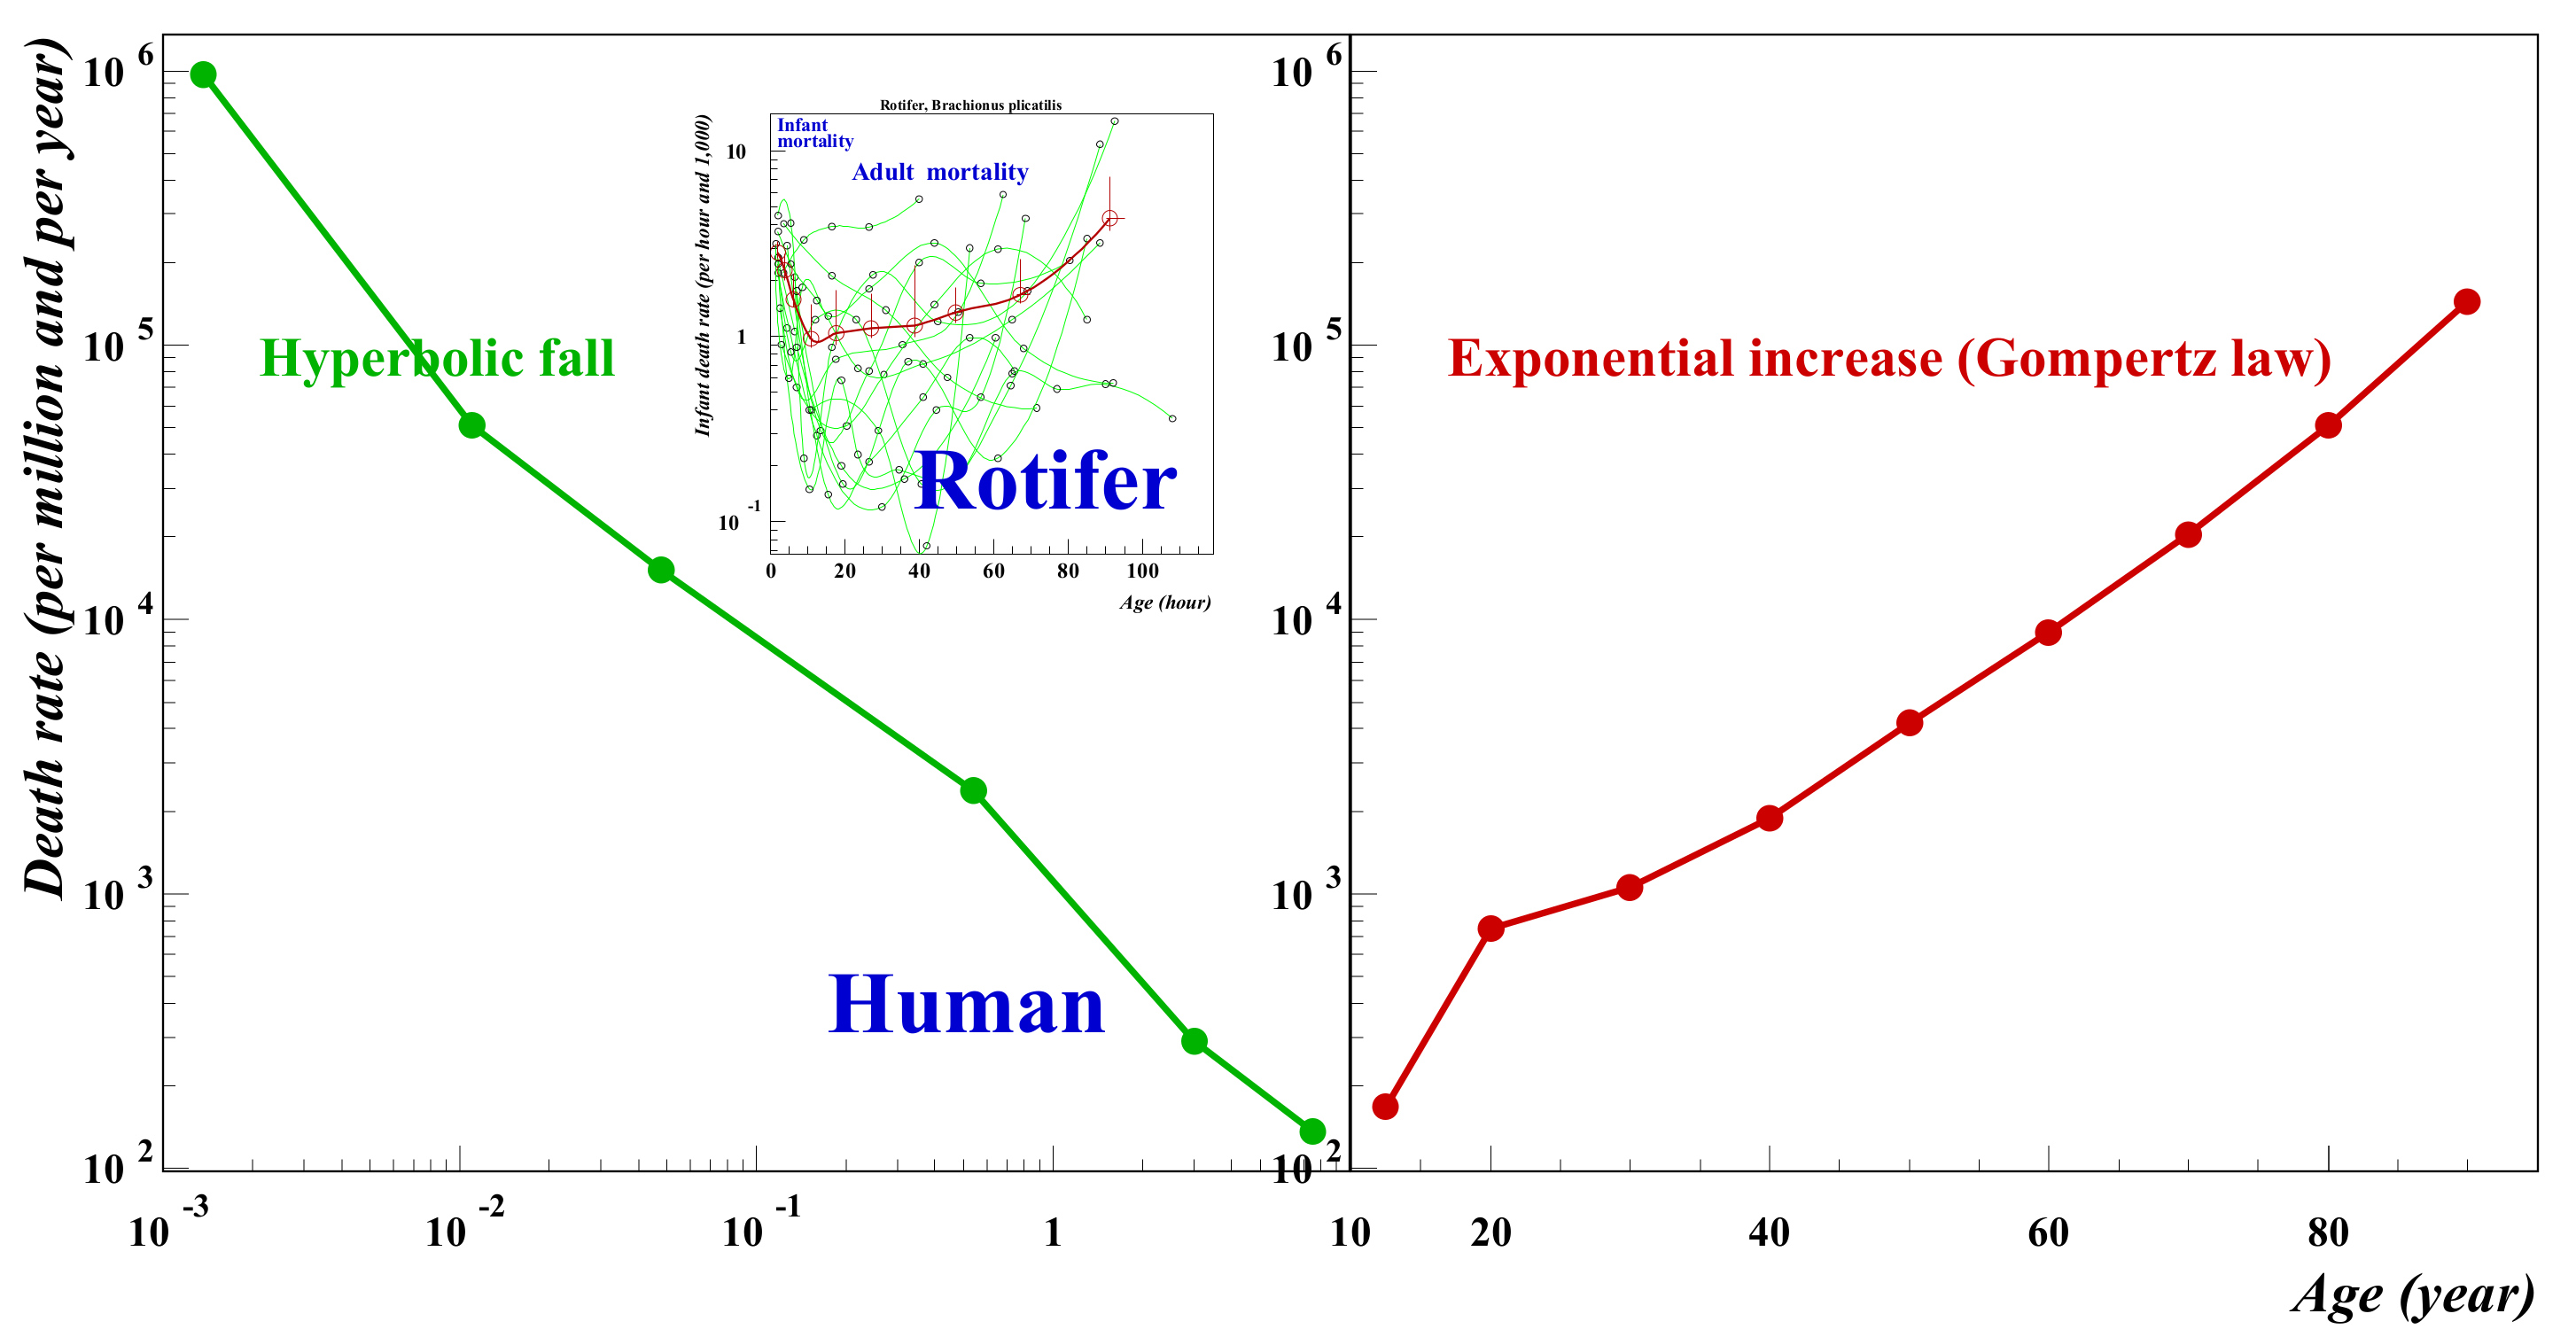
The general trend follows that for human mortality shown in
Figure 1. Start-up or early life mortality falls in a hyperbolic fashion; mature mortality trends upwards in the manner of Gompertz. From
Figure 3, we have noted that the minimum for the more recent start-up company data seems to be around 25 years. However, from the figure it is clear there is a gap between where the deathrate appears to rise (~20–30 years) for the early-stage companies and the level at which mature companies has reached at the same age. However, the earlier data from Steindl falls more steeply and assuming no change in the trend the gap could be better closed with a minimum between the mortalities of early stage and mature companies of around 30–40 years. Why might the McIntyre data be so different? We know from studies of human mortality that data from different time eras can behave in this way. For example, modern medicine reduced substantially the mortality for babies with congenital defects. Here, we have two data sets for small companies taken from quite different time eras. The period 1947–1954 was a period of reconstruction after World War 2 and the nature of small companies then depended on large amounts of capital investment as indeed had been the case since the industrial revolution. However, with the advent of modern computers, the situation changed. Since the 1990s it has been to start up a company with little capital being dependent more on knowledge and computers than intensive amounts of capital. Microsoft for example was set up by Bill Gates in his garage and Google began as an undergraduate project. Using a biological term, we might say we are comparing two different species of company before and after the 1990. We would see similar discrepancies comparing say, human infant mortality with the mortality of adult elephants. Ideally, we should have data for a cohort of similar companies which have evolved in similar environments. Our FTSE100 data is taken over an era extending from the late 20th century back to the 17th century. Therefore, it seems not unreasonable to compare against this mature data with the earlier Steindl data than the McIntyre data. Perhaps even earlier data for the start-up companies might trend even more steeply downwards. A much larger group of similar mature companies might be collected from US data. The S&P 500 perhaps although the time period will be more limited going back perhaps only to the middle of the 19th century. More time needs to elapse before we shall see sufficient data for mature companies to compare with the McIntyre data.
An interesting point is that, whereas for humans medical advances have led to a decrease in mortality, for companies, it seem over time the mortality of early stage companies has increased. The opportunity to set up a company with little capital makes it easier to begin a business, but then perhaps it is also easier too to stop trading. Finally, we note in passing that based on the data we have and extrapolating the trend beyond the maximum data point to where it reaches a value of unity, the results predict a maximum company life time of 283 years. This assumes no takeovers or mergers—which we have seen is not the case. Nevertheless, it will be interesting—for others!—to see if this outcome holds in the modern world.


