
Composite Multivariate Multi-Scale Permutation Entropy and Laplacian Score Based Fault Diagnosis of Rolling Bearing


Abstract
:1. Introduction
2. Introduction of CMMPE Method
2.1. The Multi-Scale Permutation Entropy (MPE) Method
2.2. The Multivariate Multi-Scale Permutation Entropy (MMPE) Method
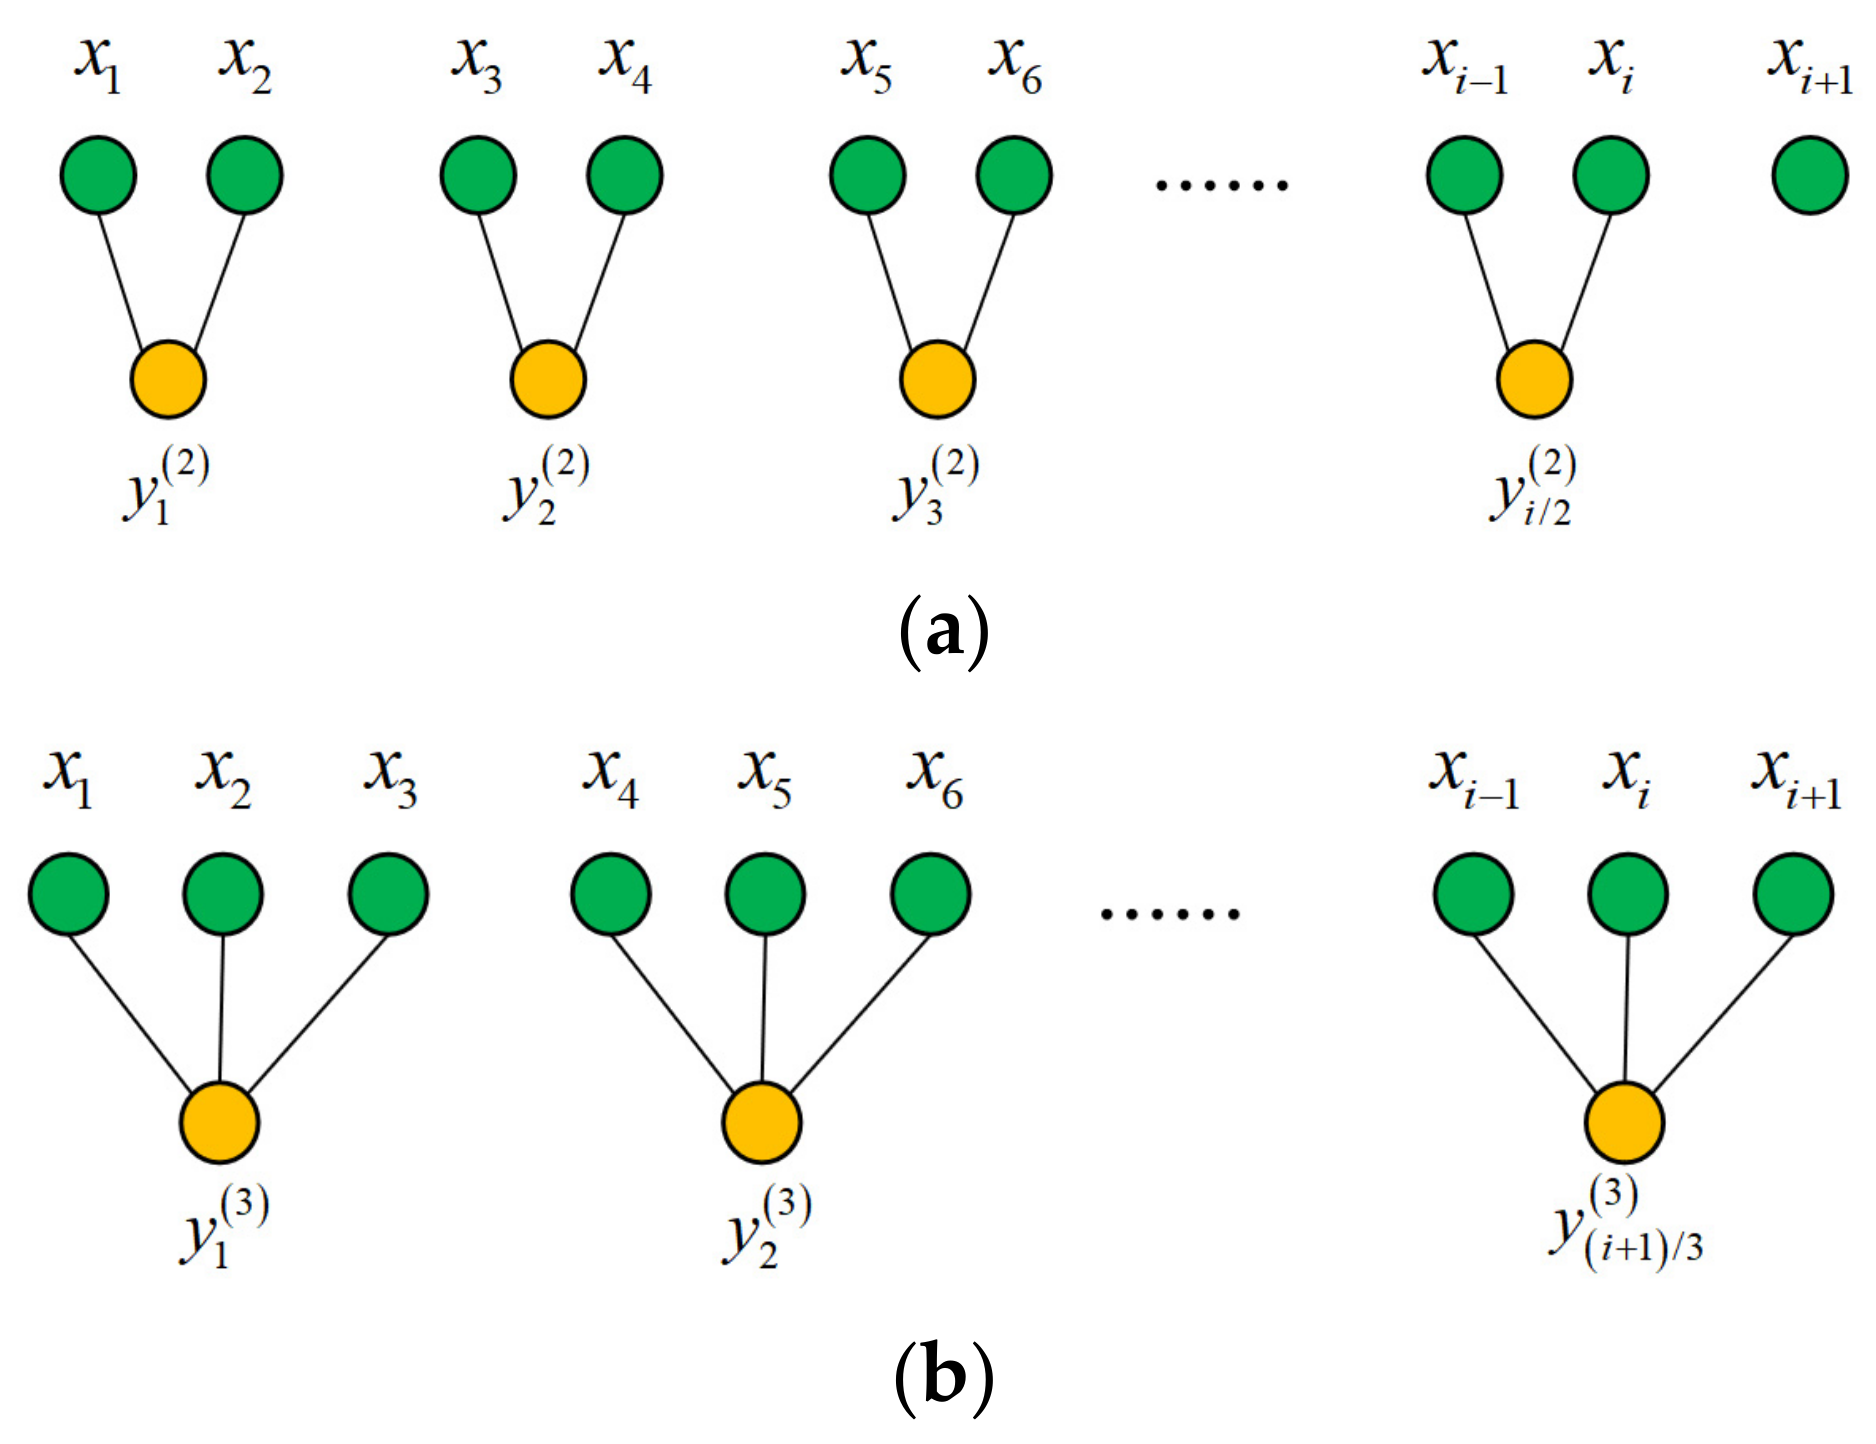
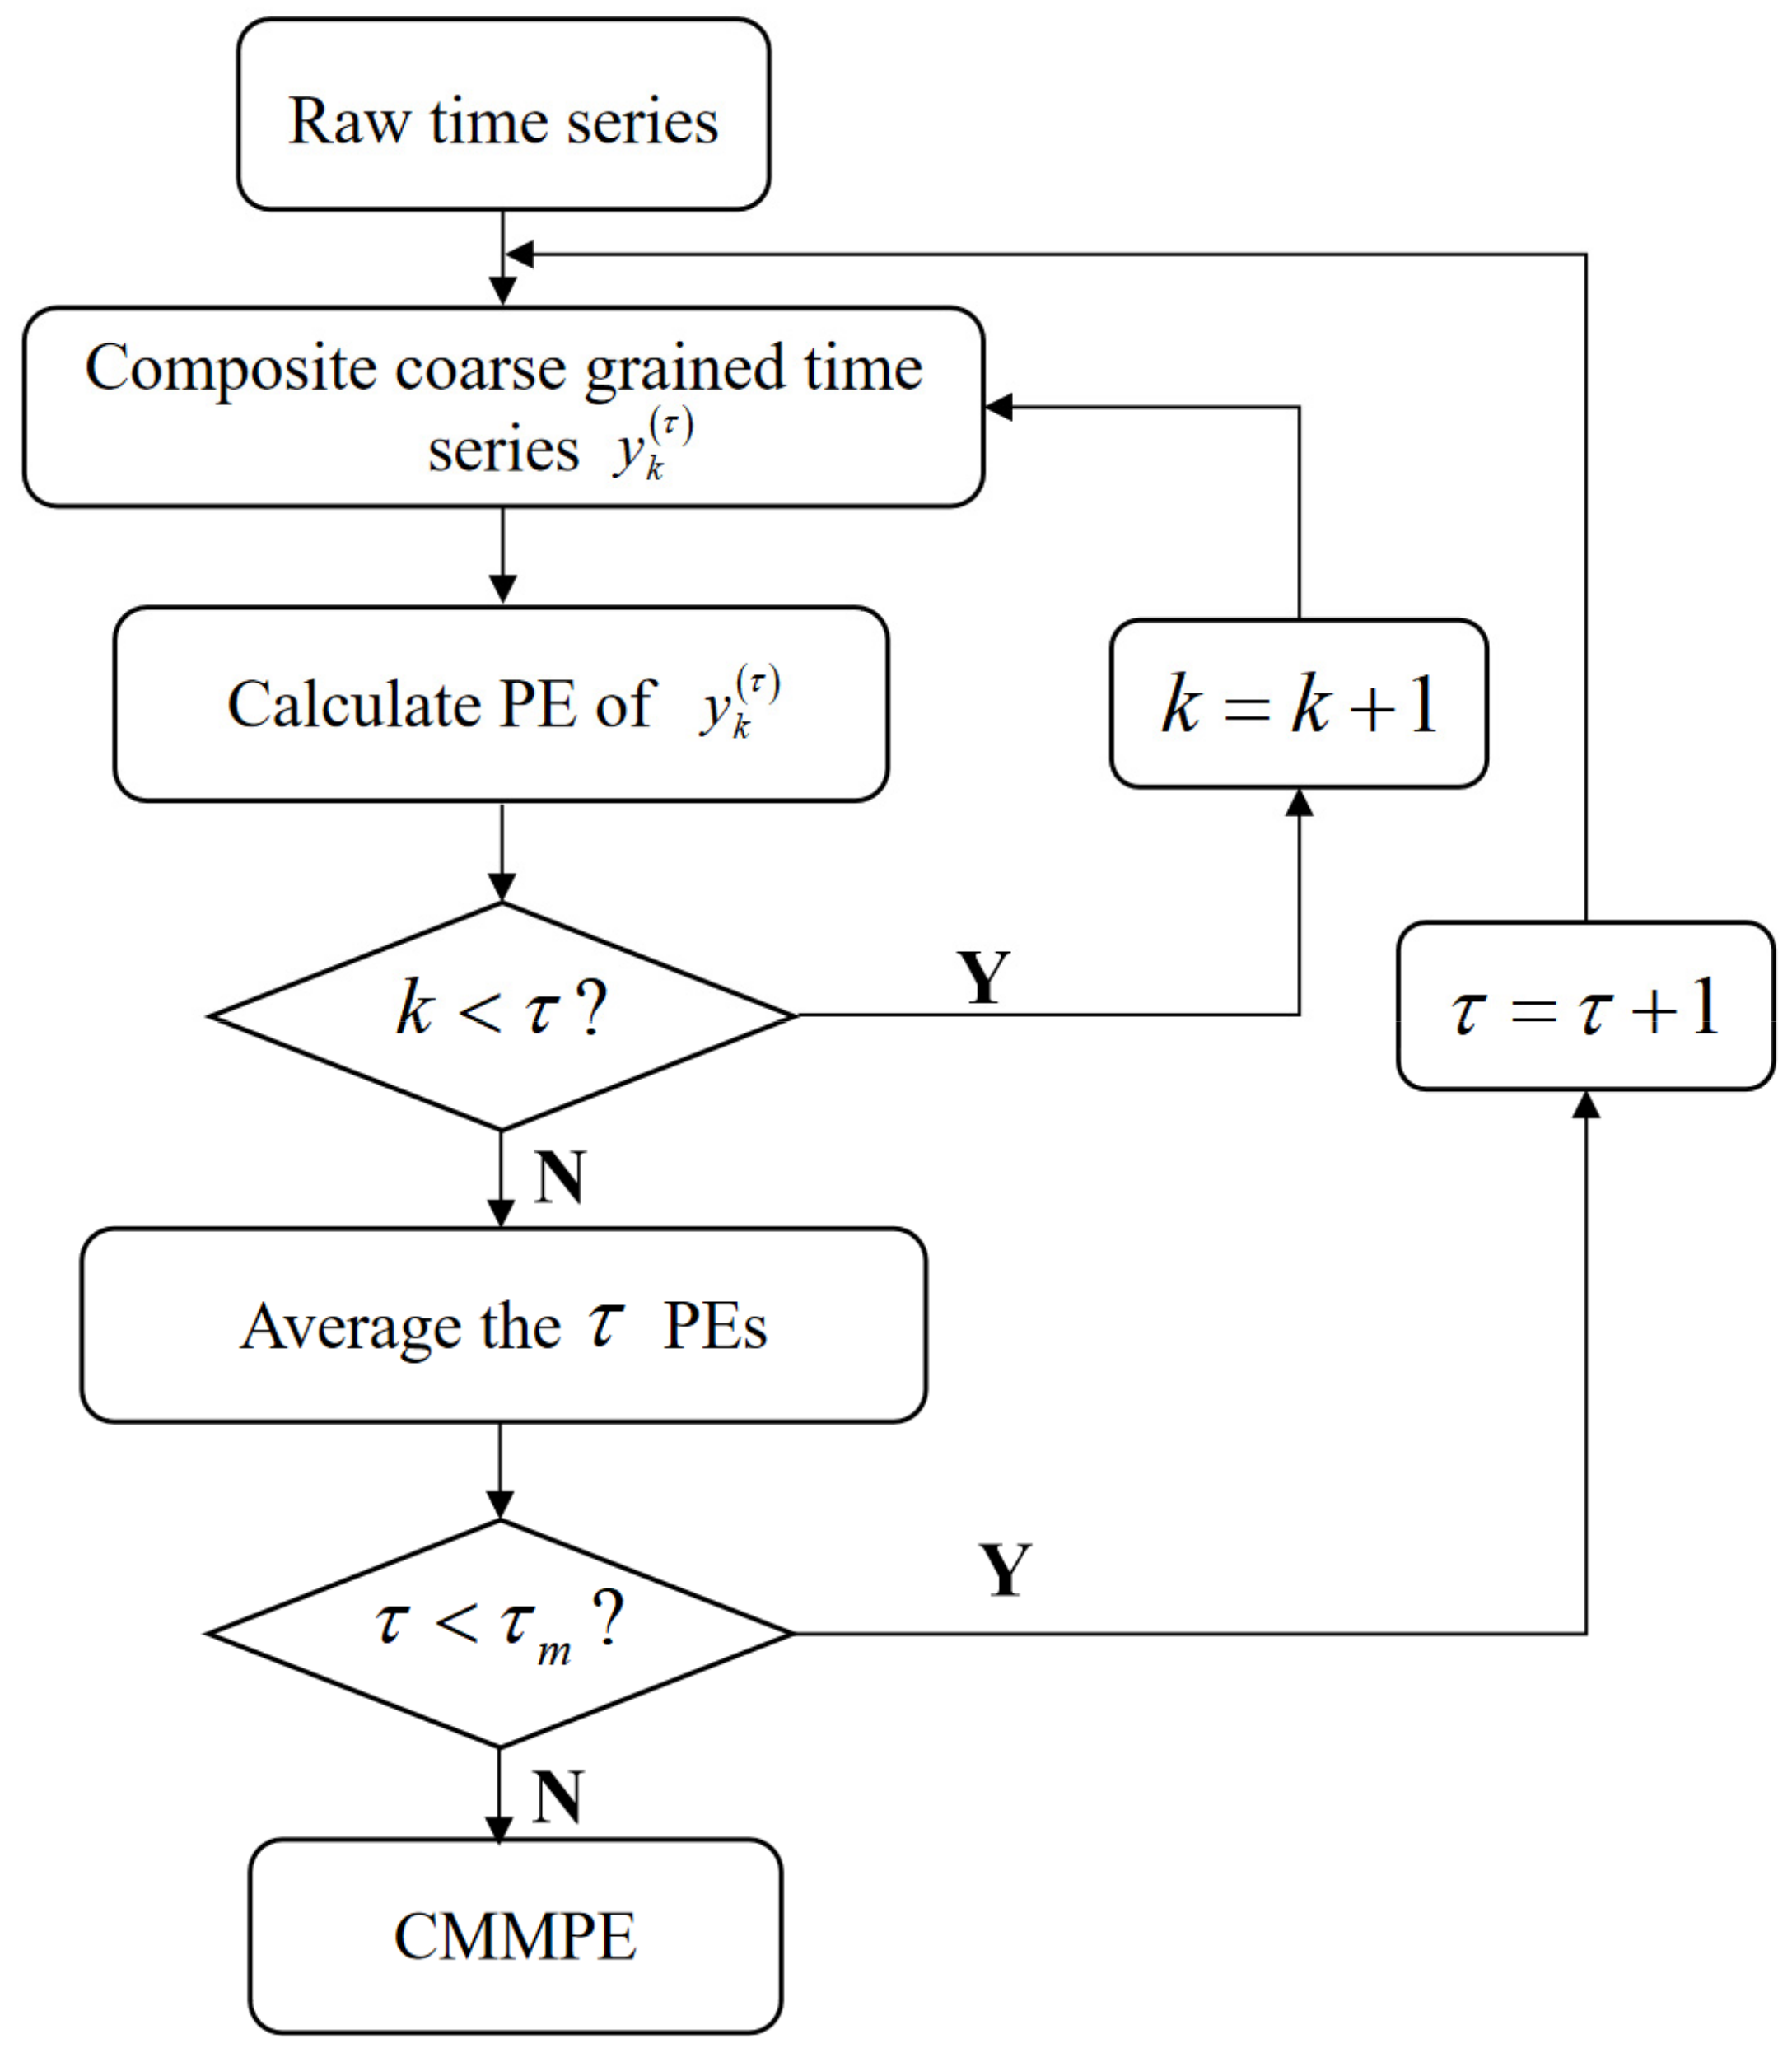
2.3. The Introduction of the Proposed CMMPE Method
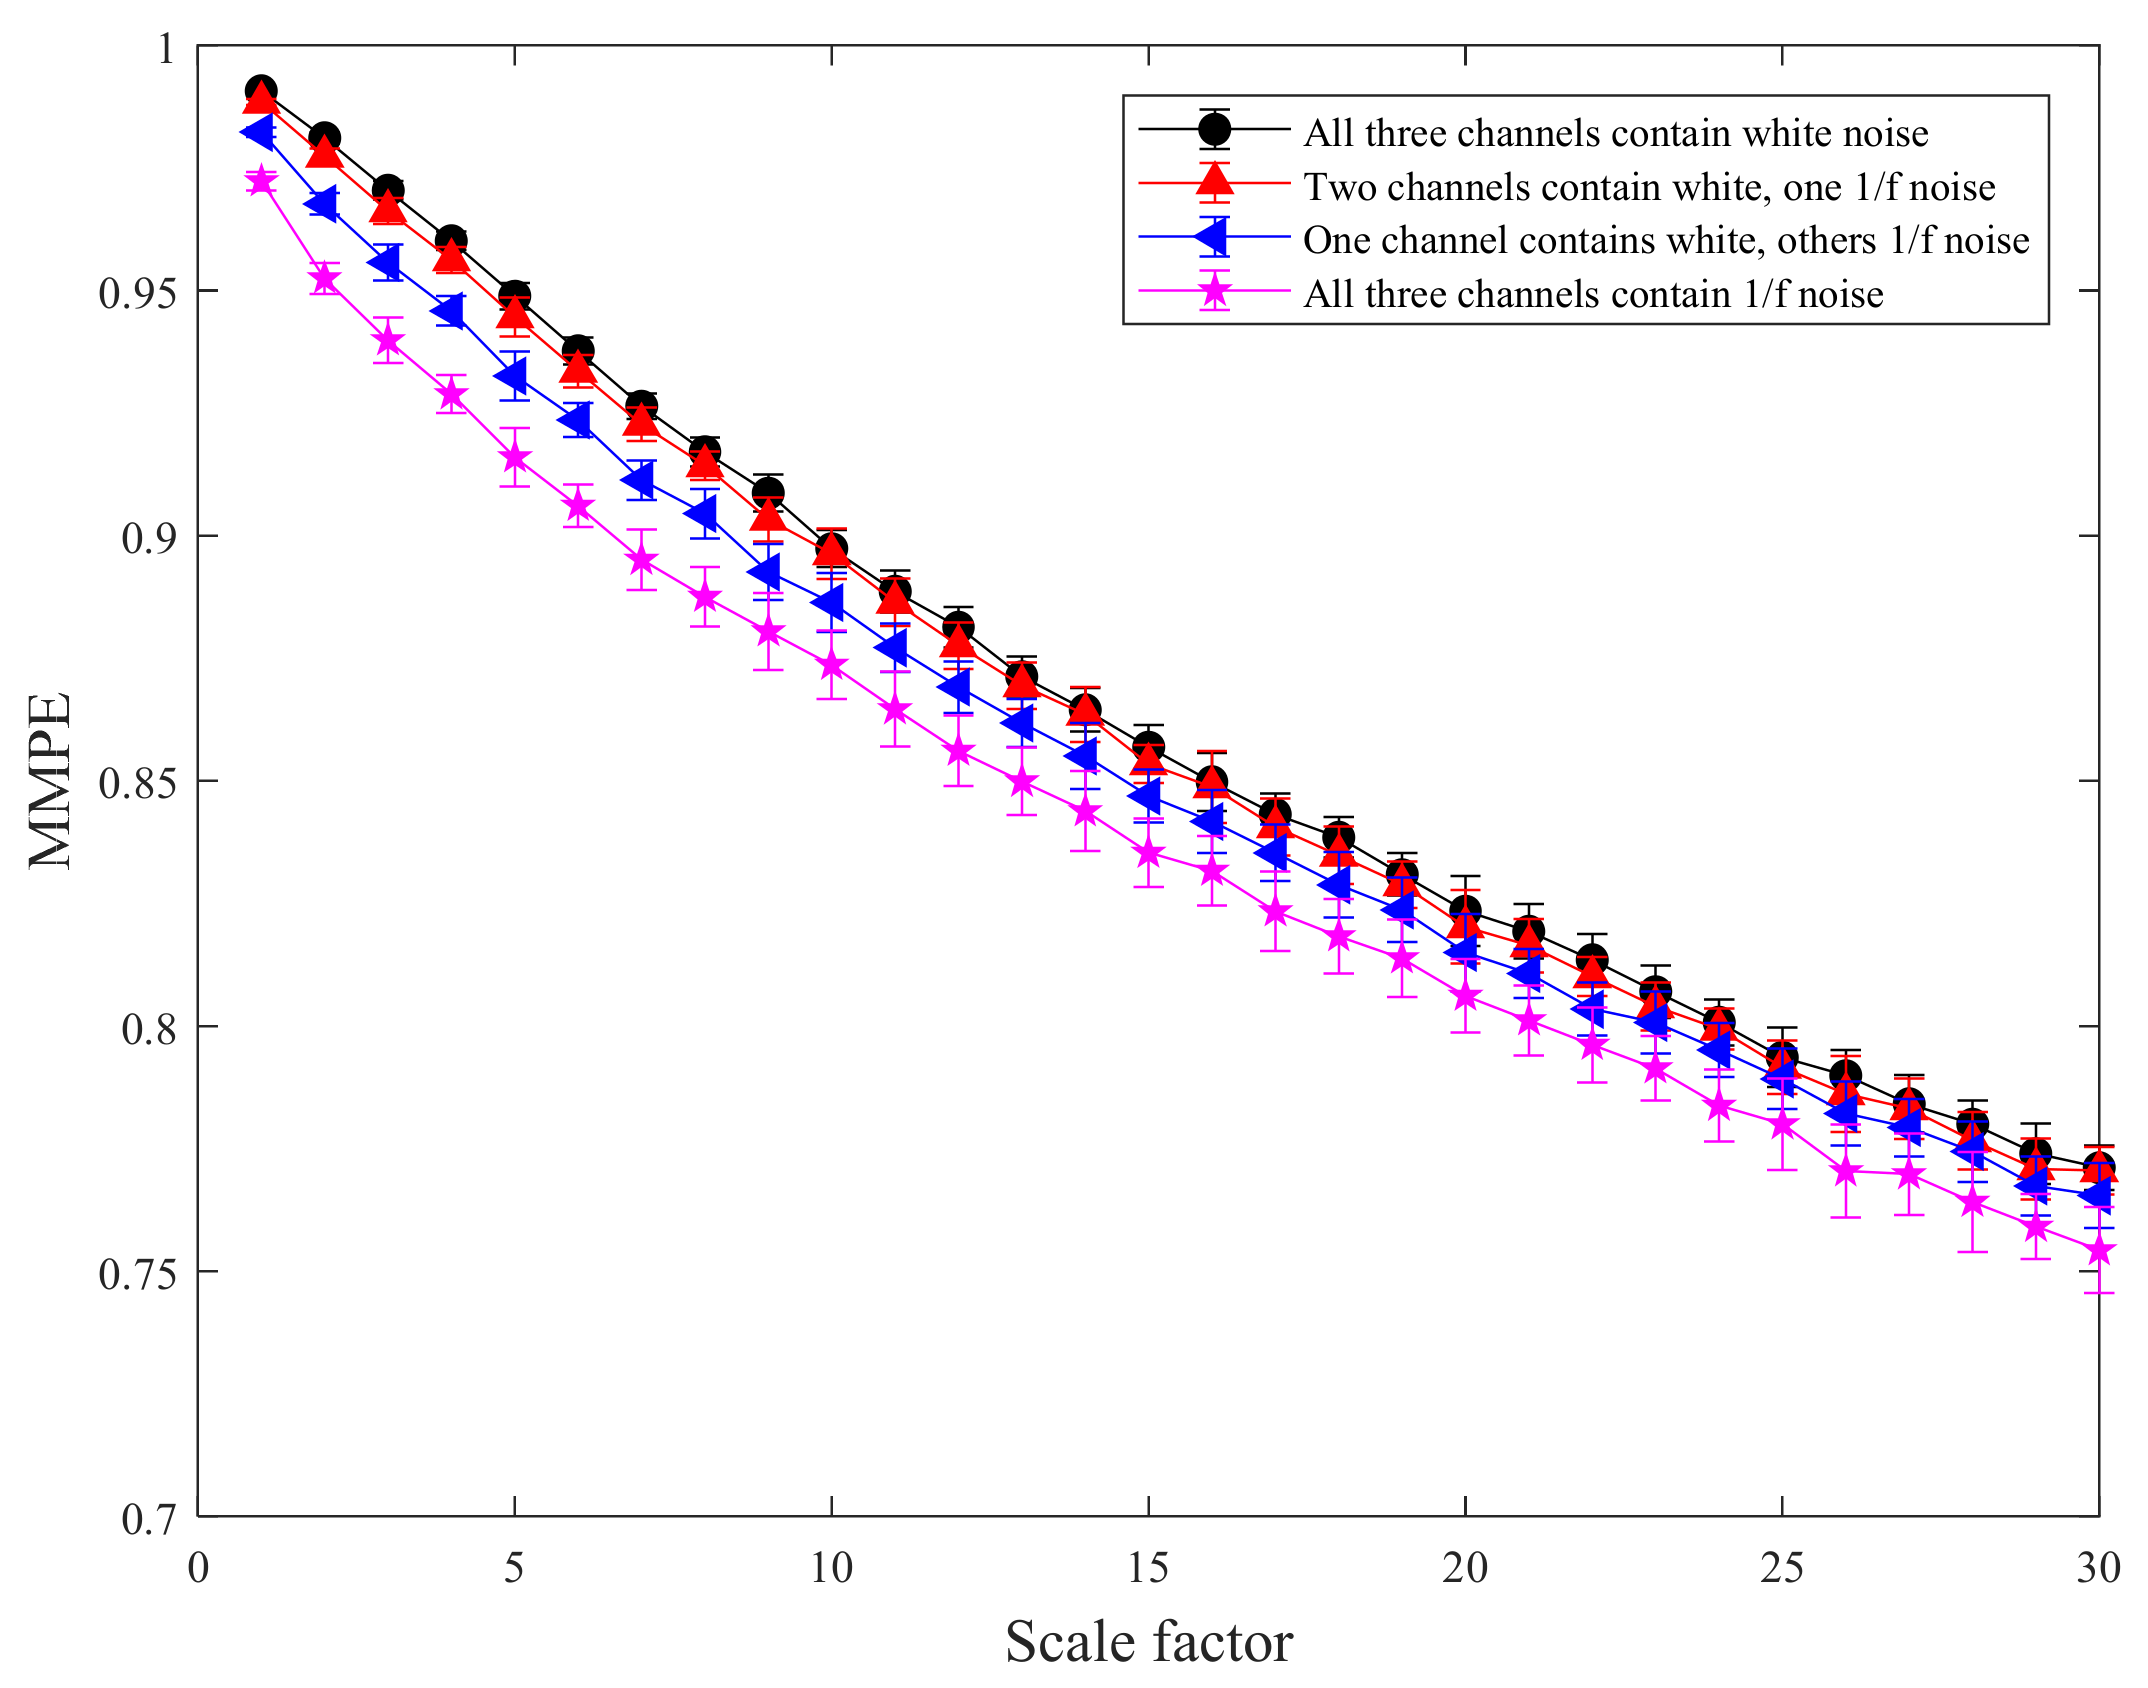
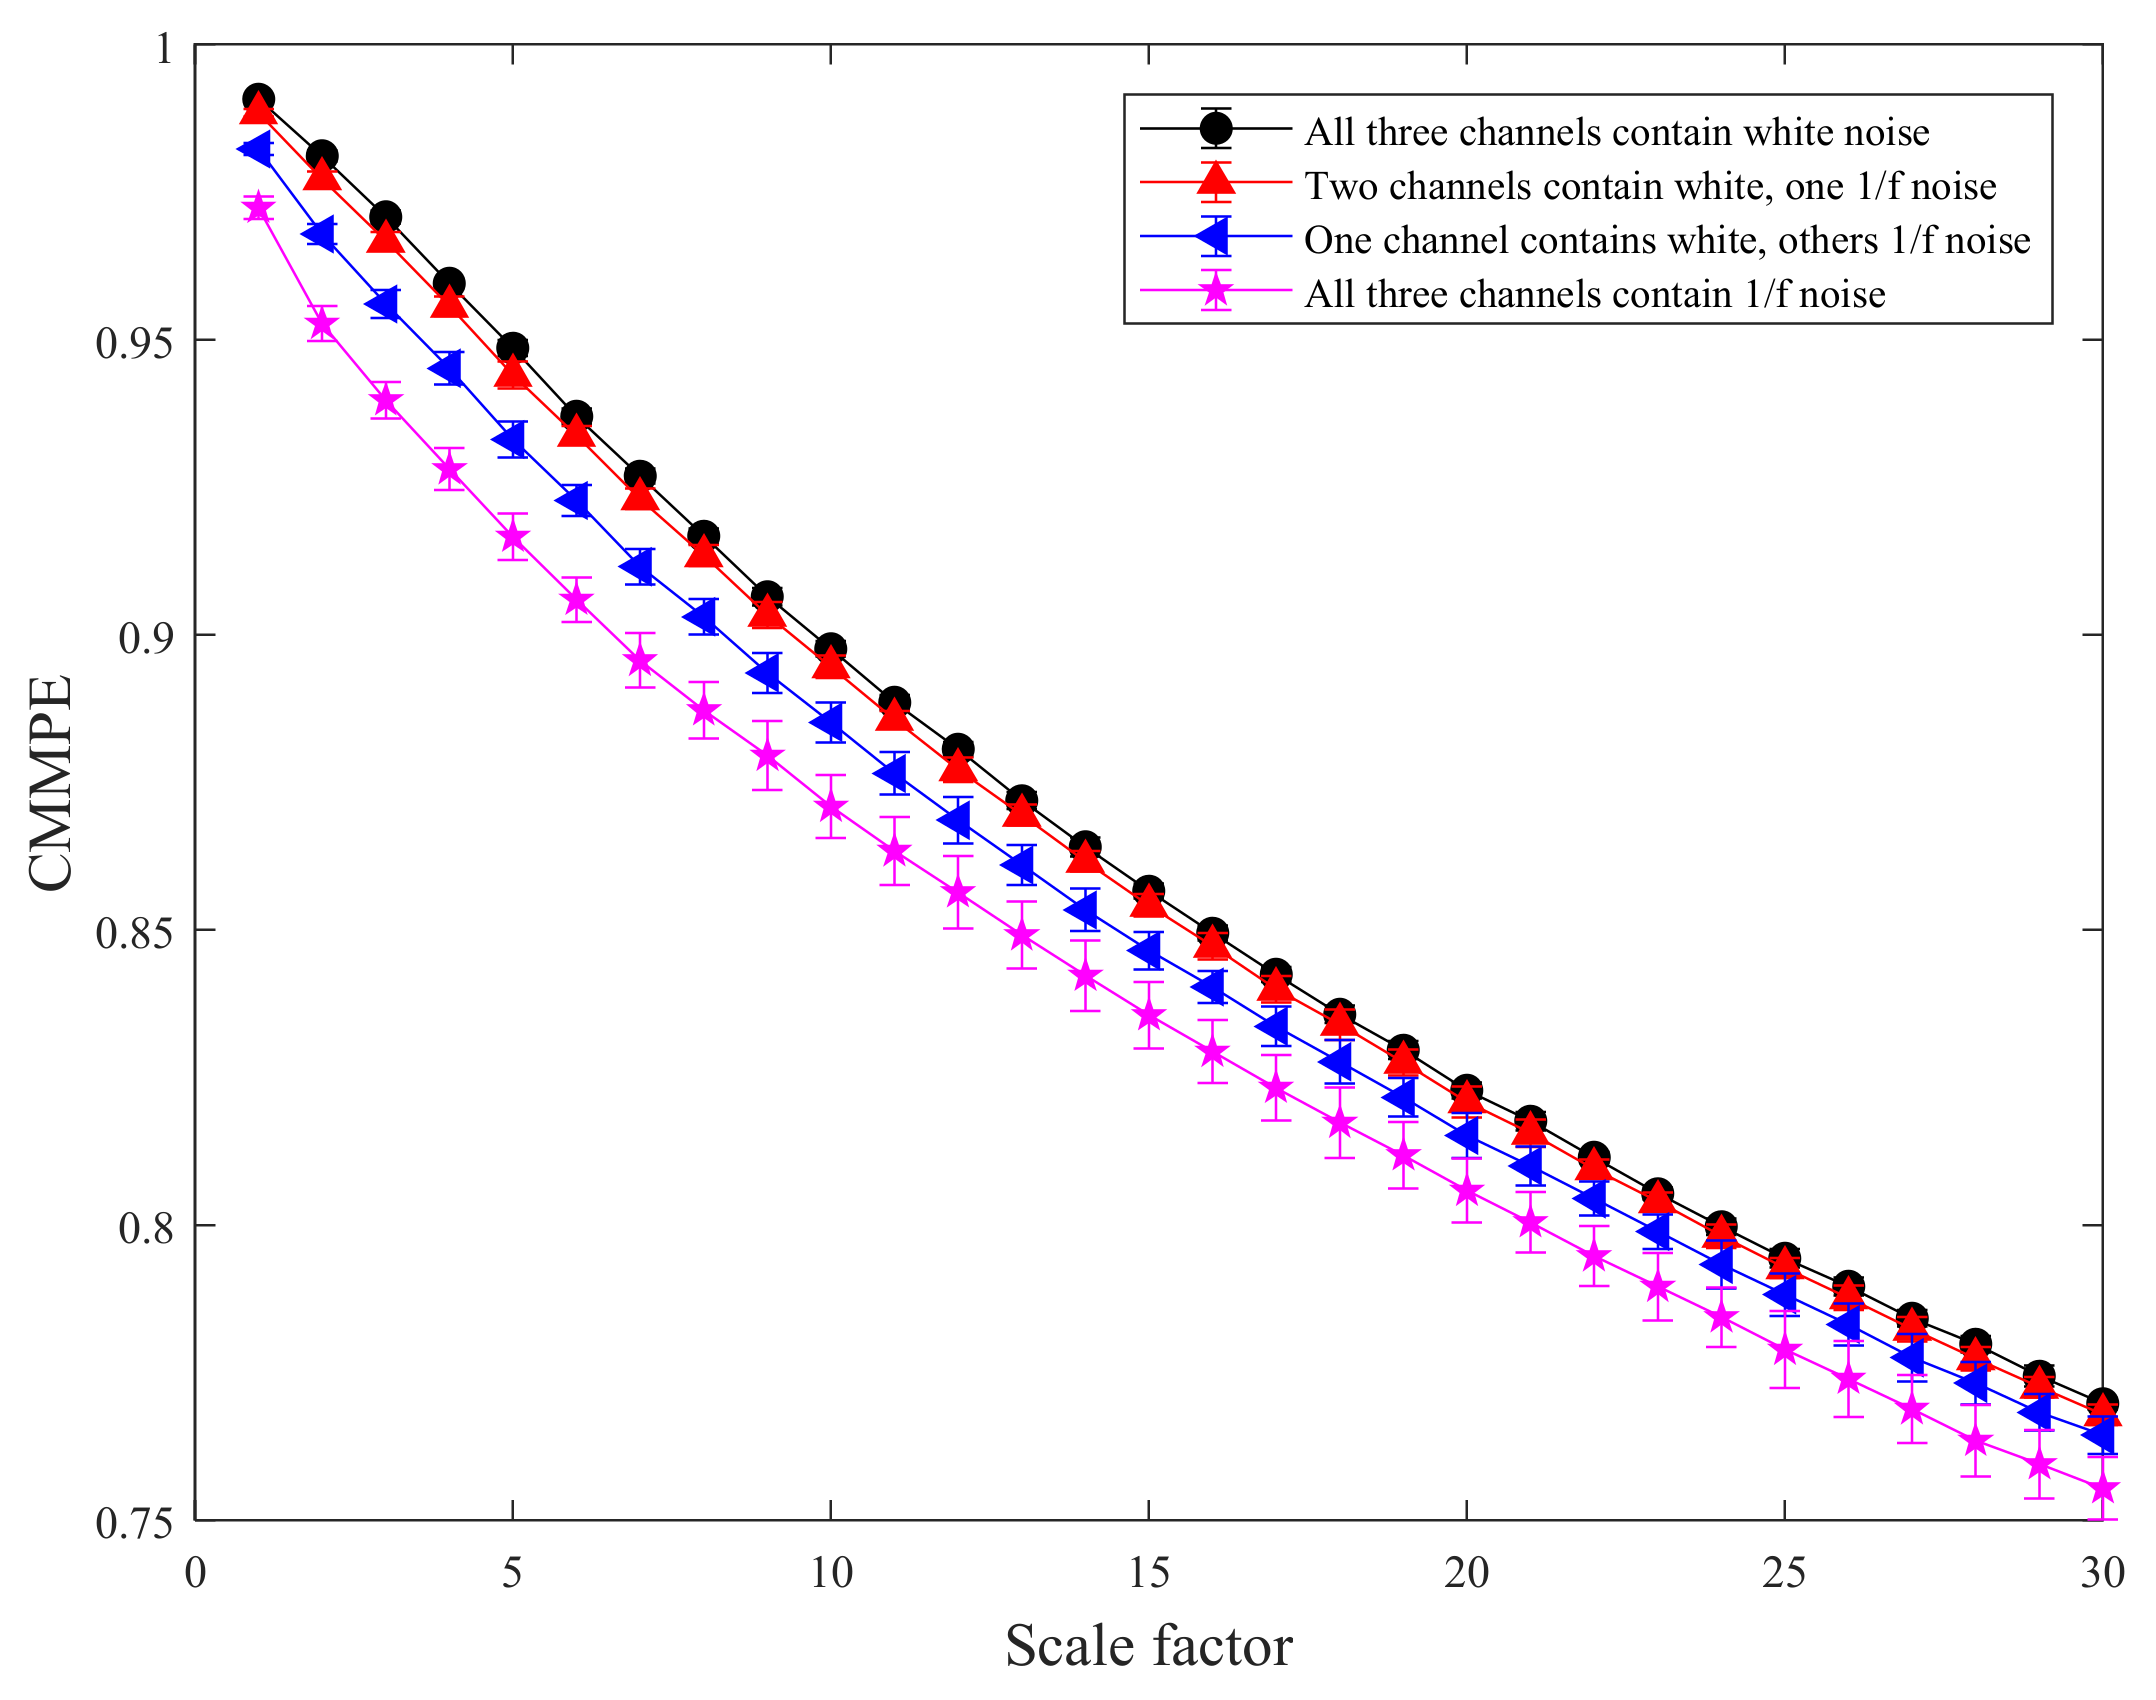
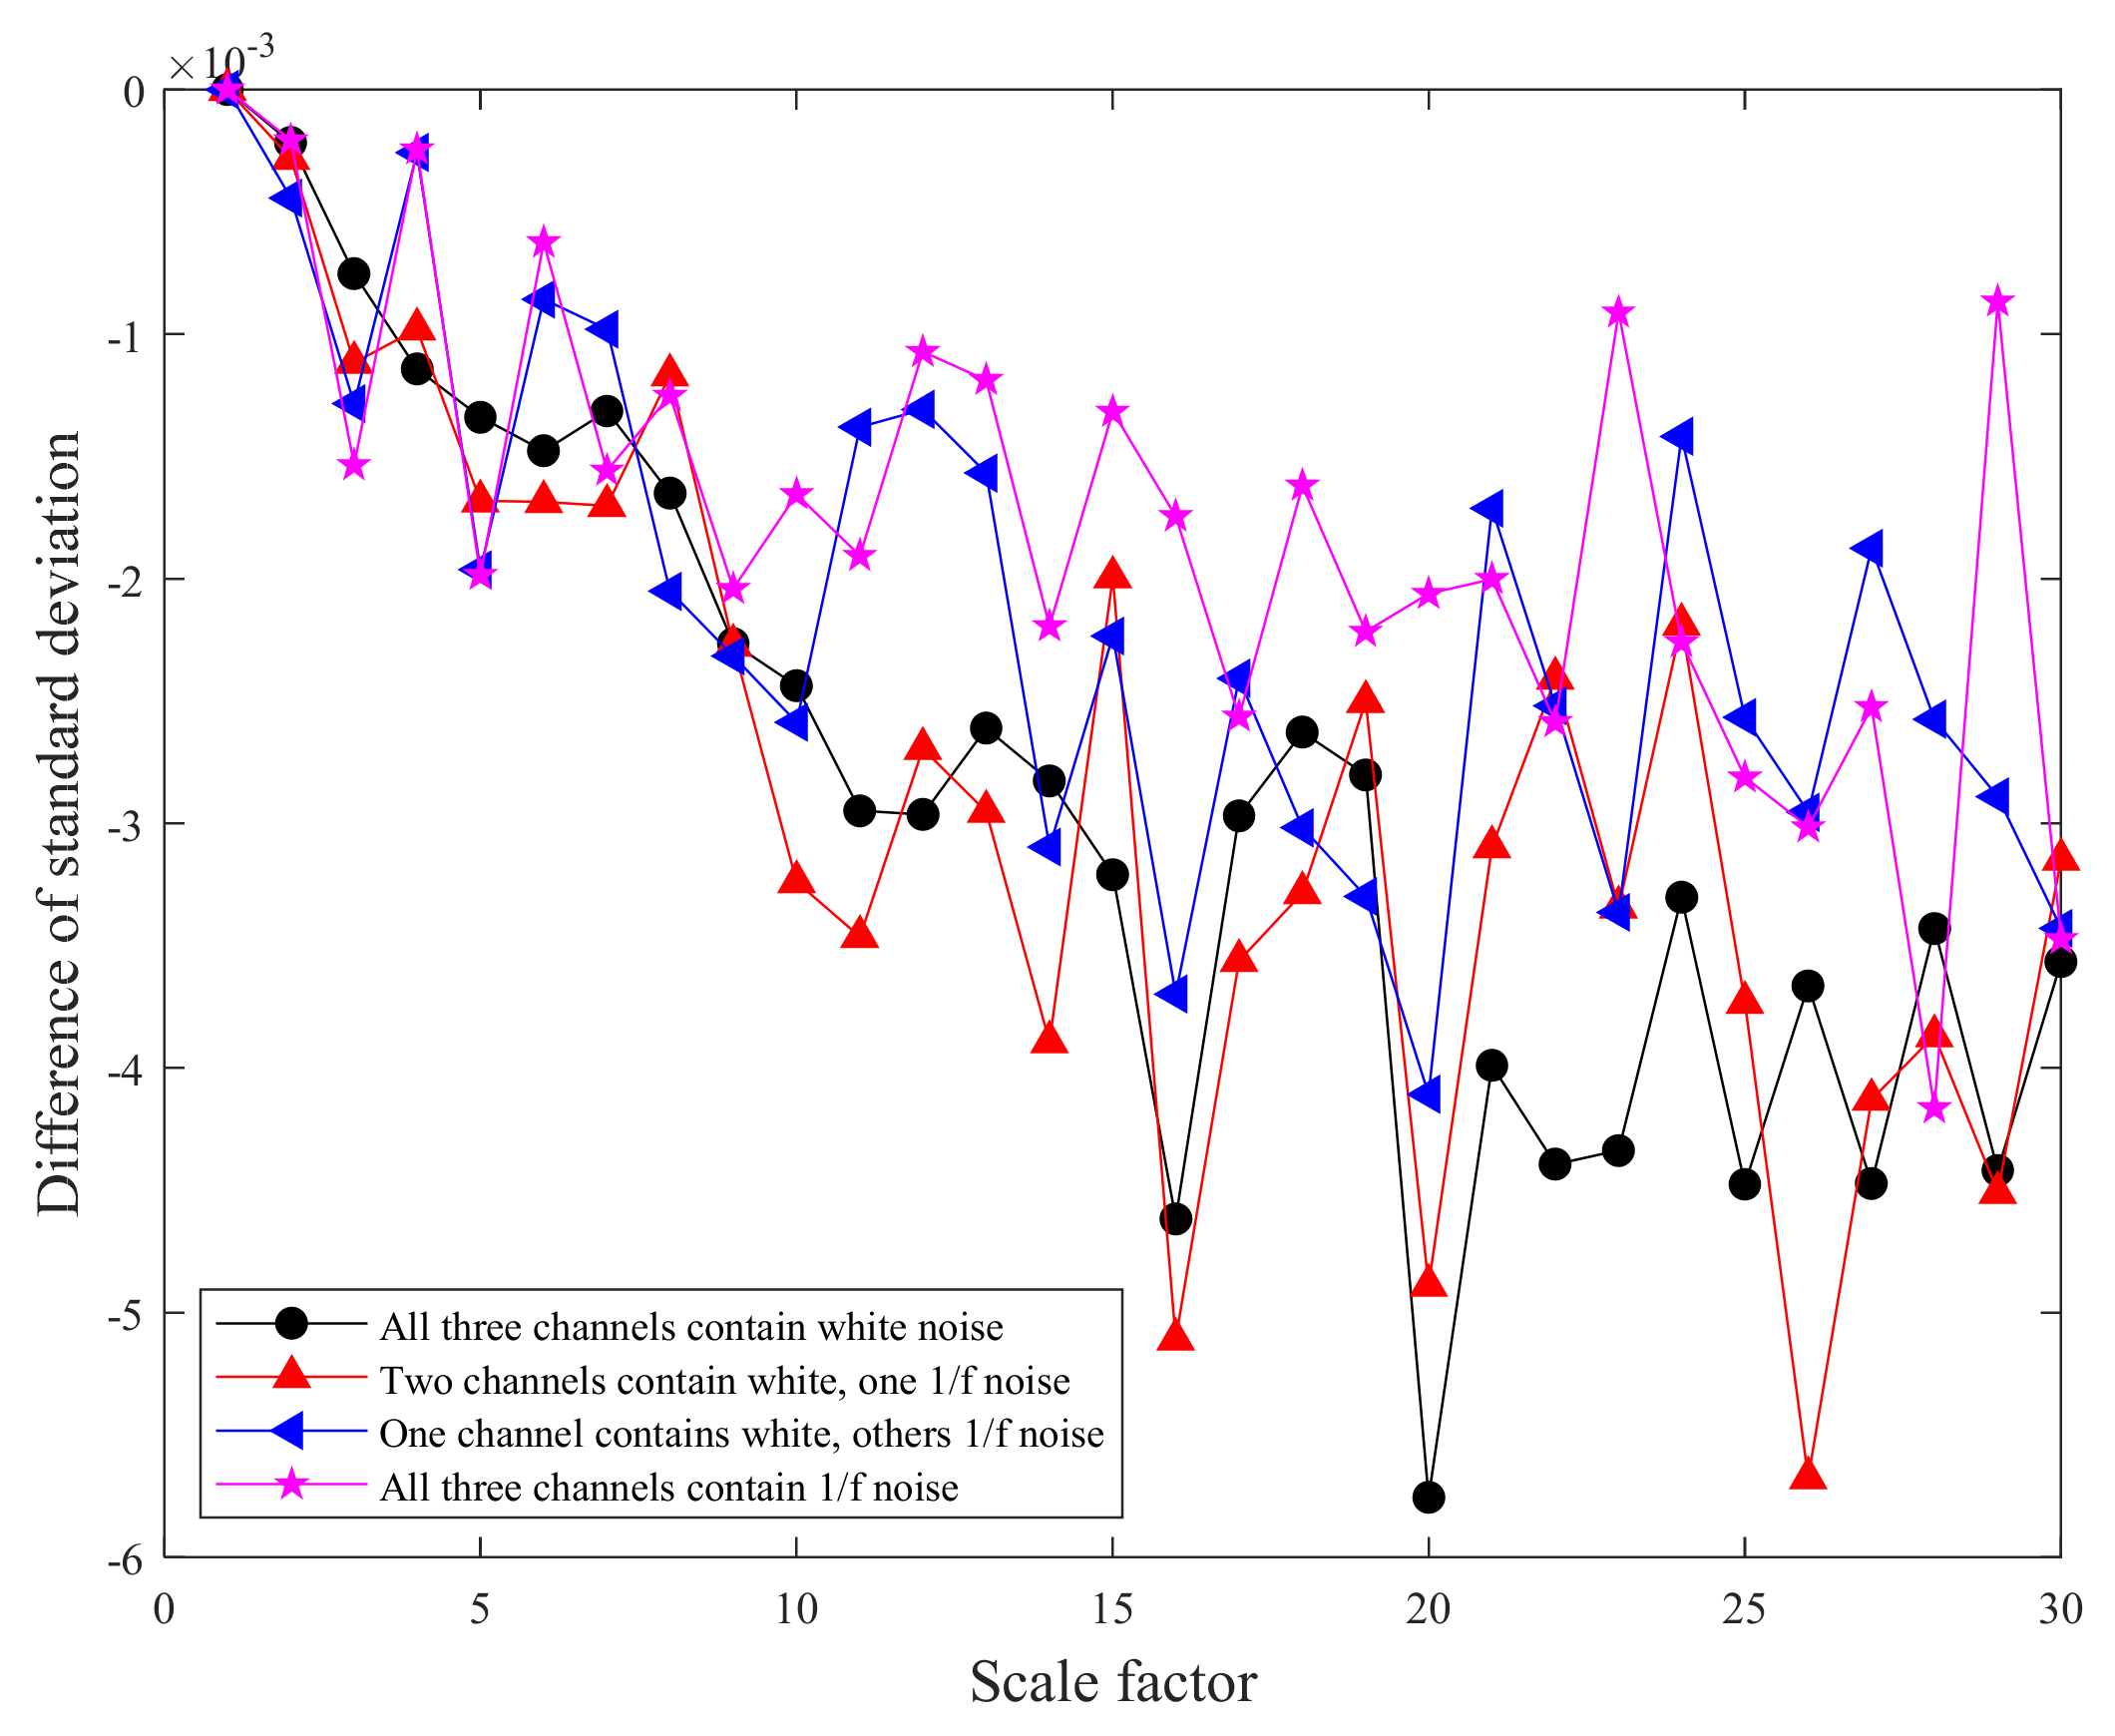
3. The Analysis of Simulated Signal
4. The CMMPE, LS, and BA-SVM Based Intelligent Fault Diagnosis Method
4.1. Laplacian Score for Feature Selection
4.2. The Bat Optimization Algorithm Based Support Vector Machine
4.3. The Proposed Fault Diagnosis Method of Rolling Bearing
- (1)
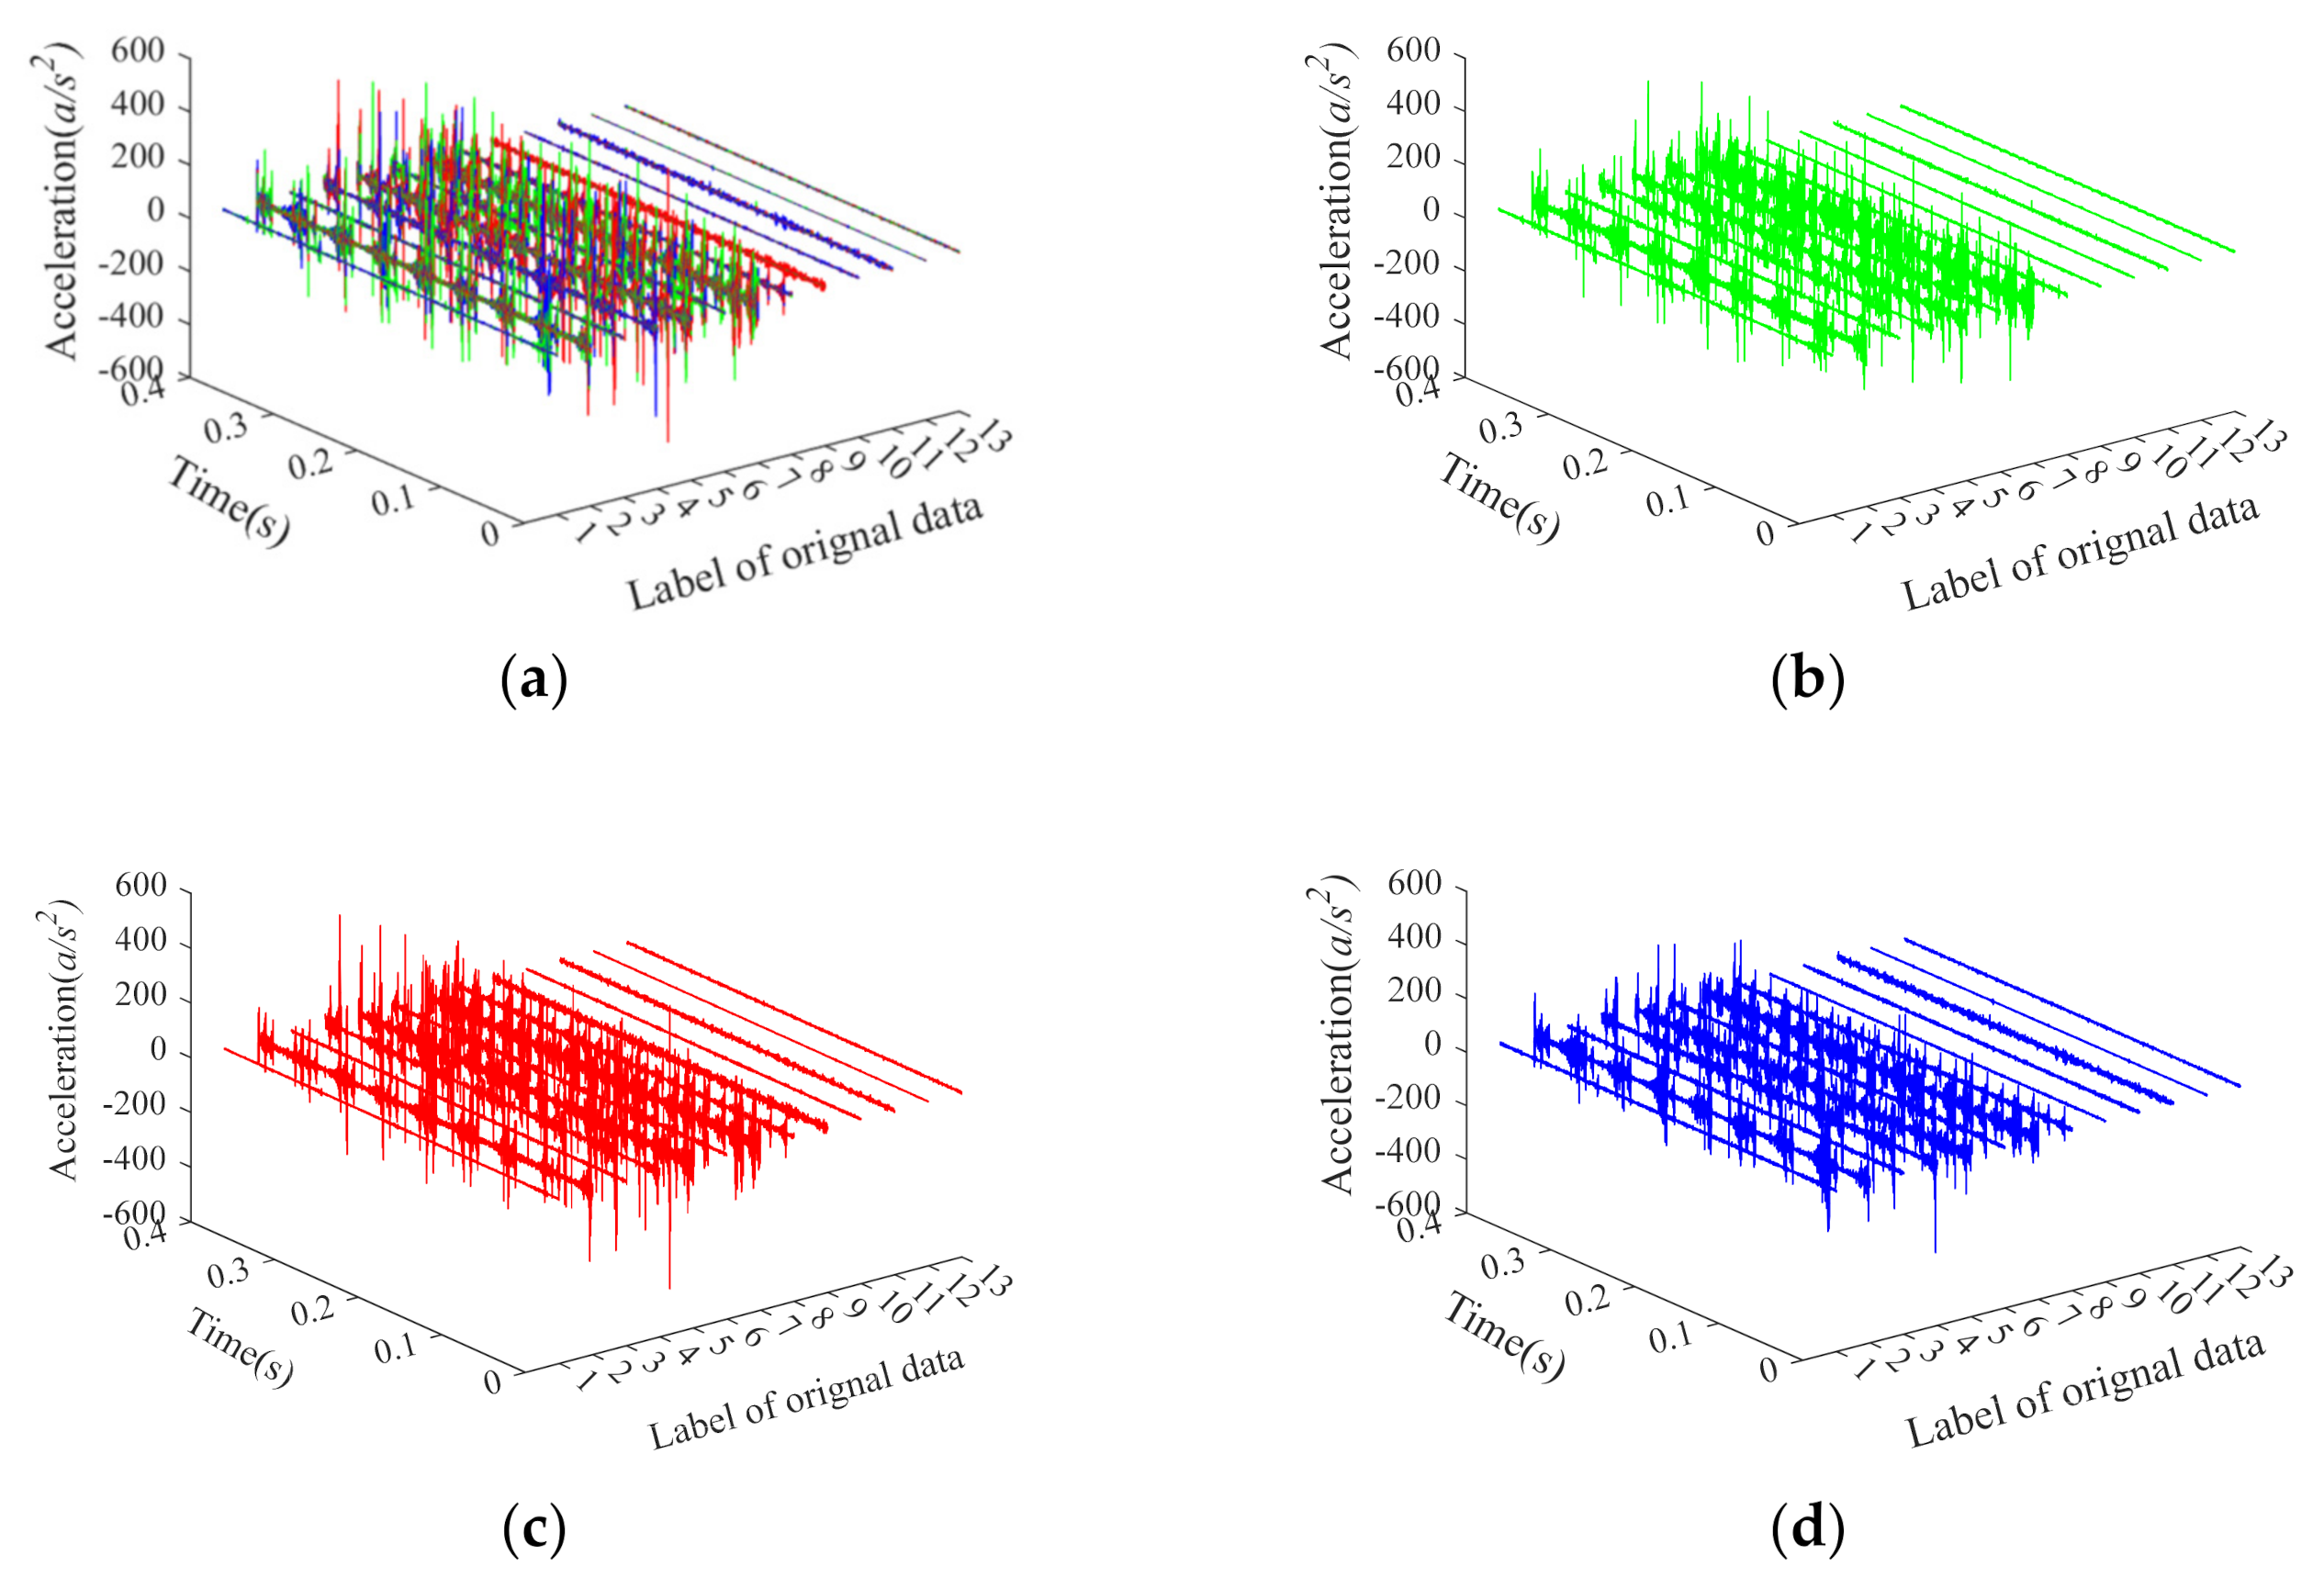
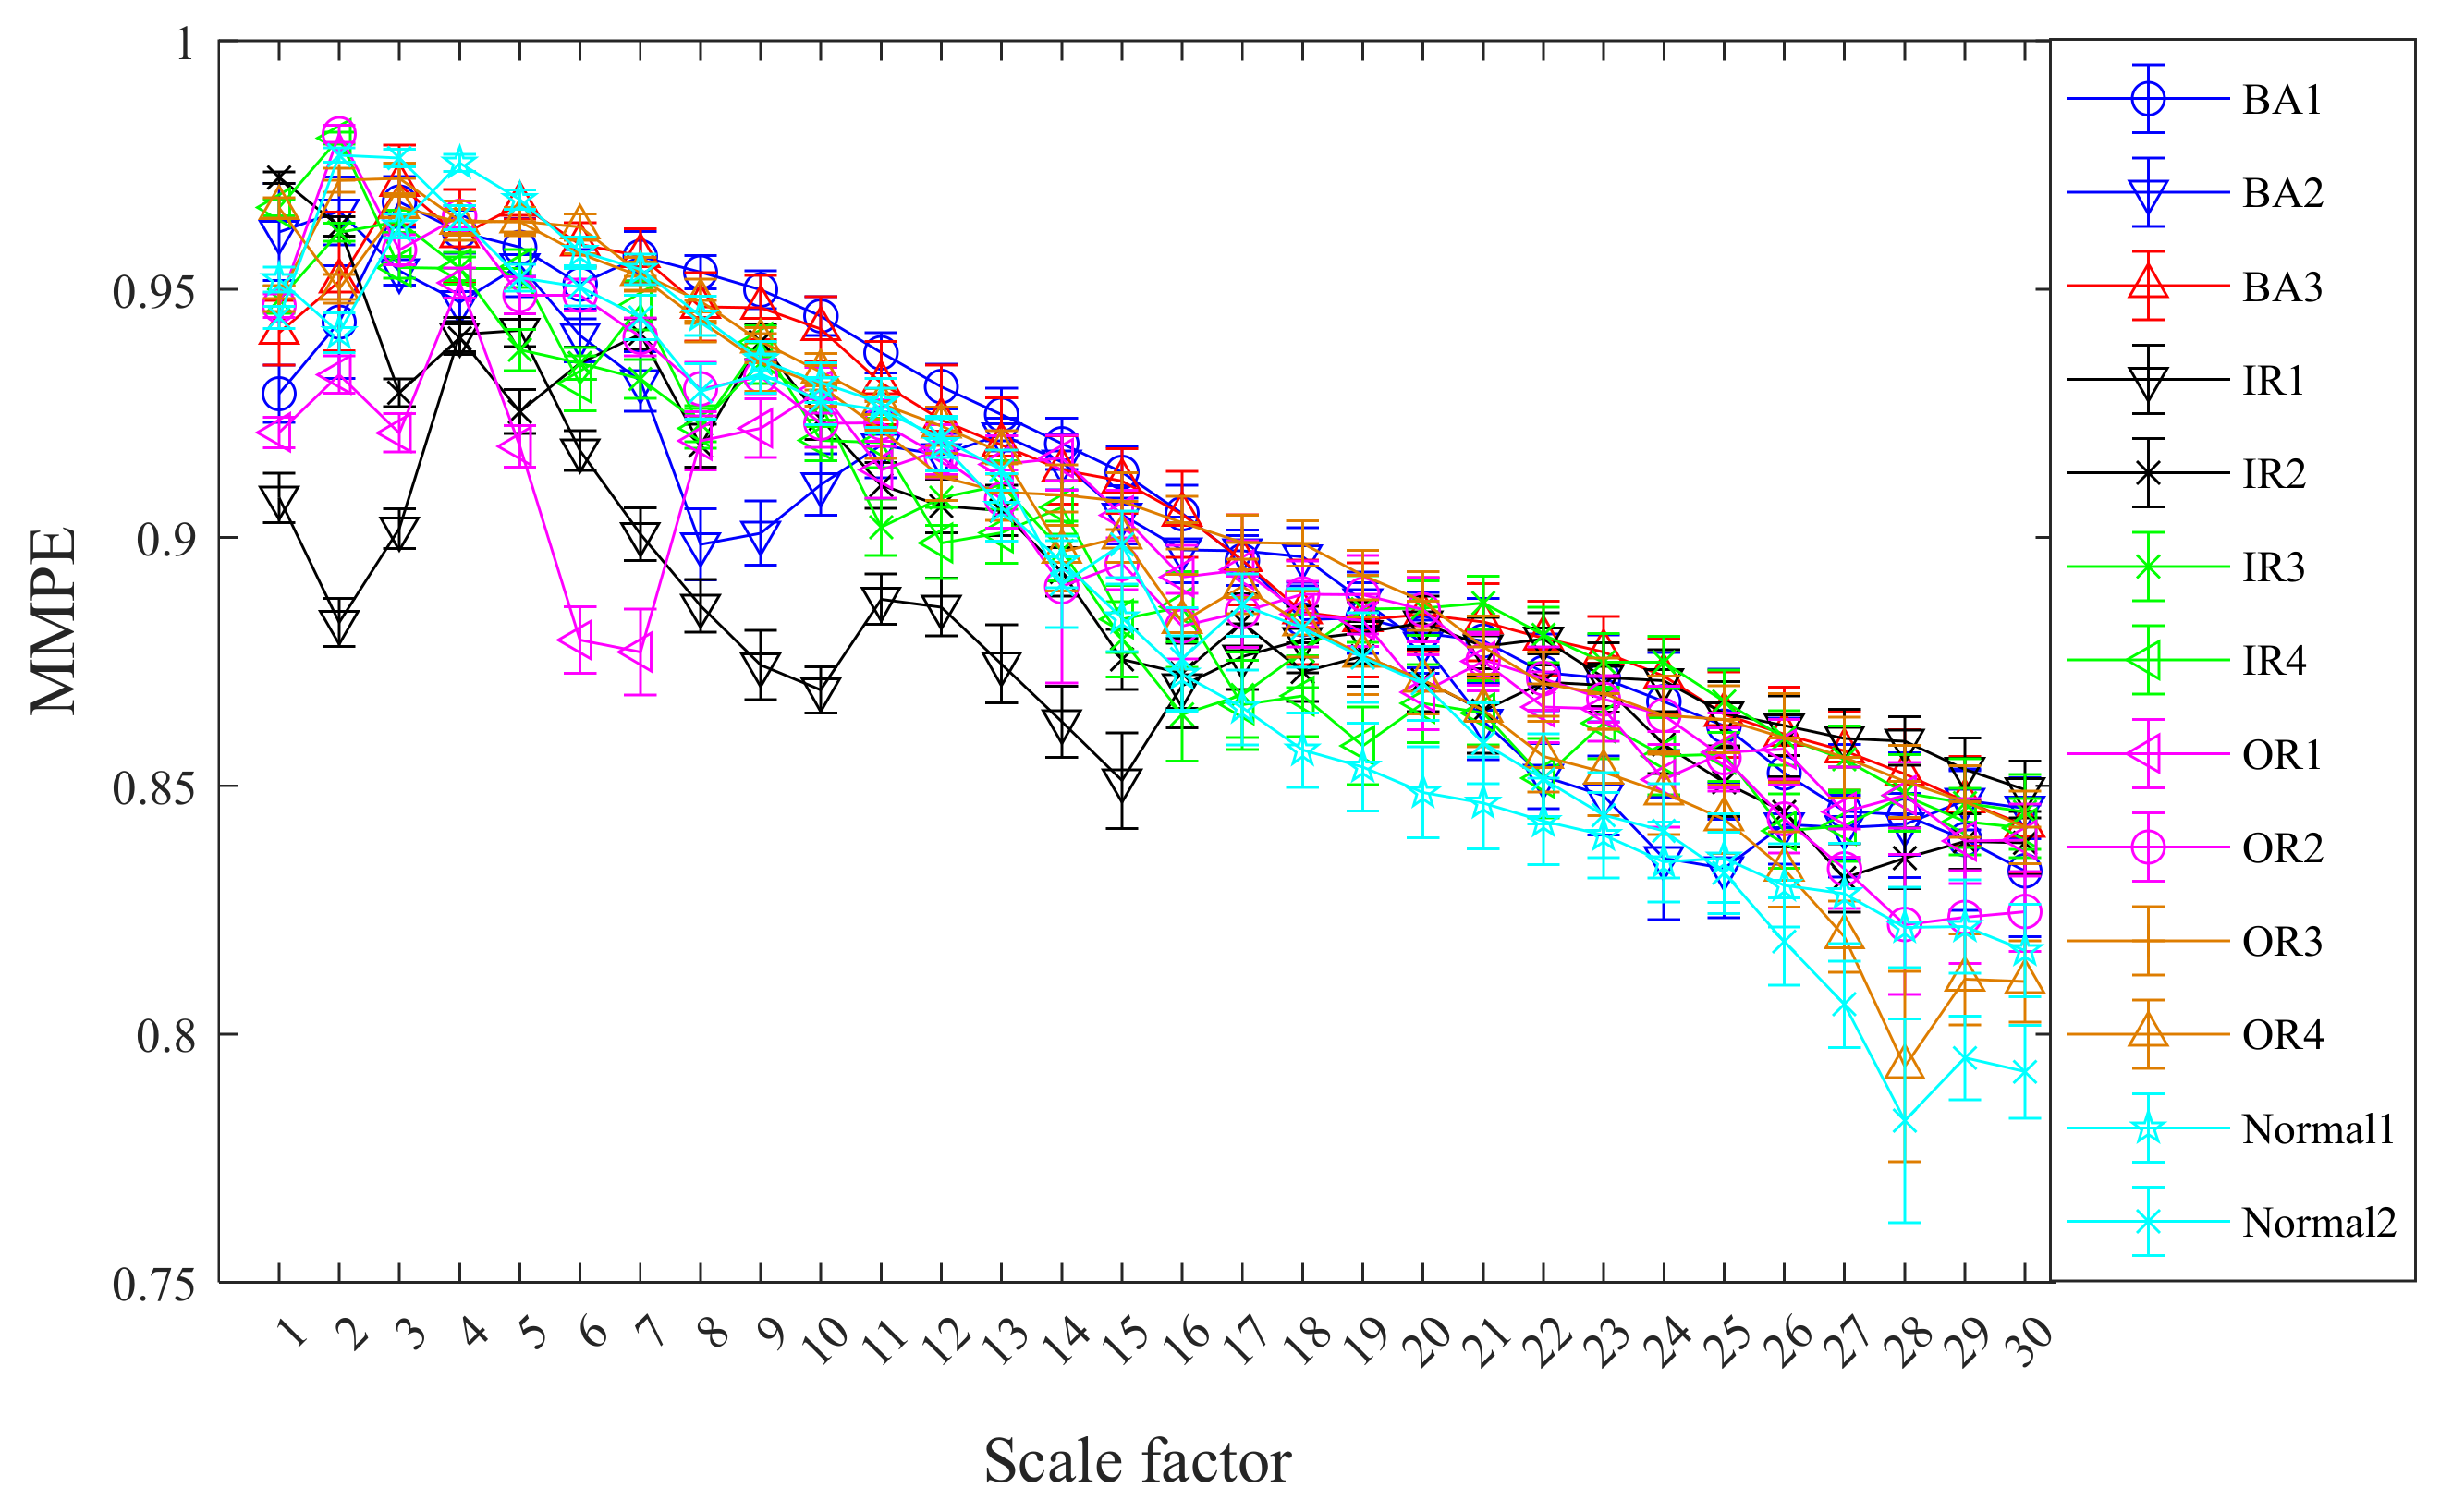
- For given K categories of rolling bearings (K = 13 in this paper), N samples are selected for each type, and each sample contains M-channel (M = 3 in this paper) signals. Each the sample data is then analyzed by CMMPE under a scale factor of S (S = 30 in this paper), and the CMMPE values will be taken as a representation of sample information to form the original feature sets .
- (2)
- Type i samples from N samples are randomly selected as the training feature, noted as , and then the remaining samples are selected as the testing feature sets, noted as .
- (3)
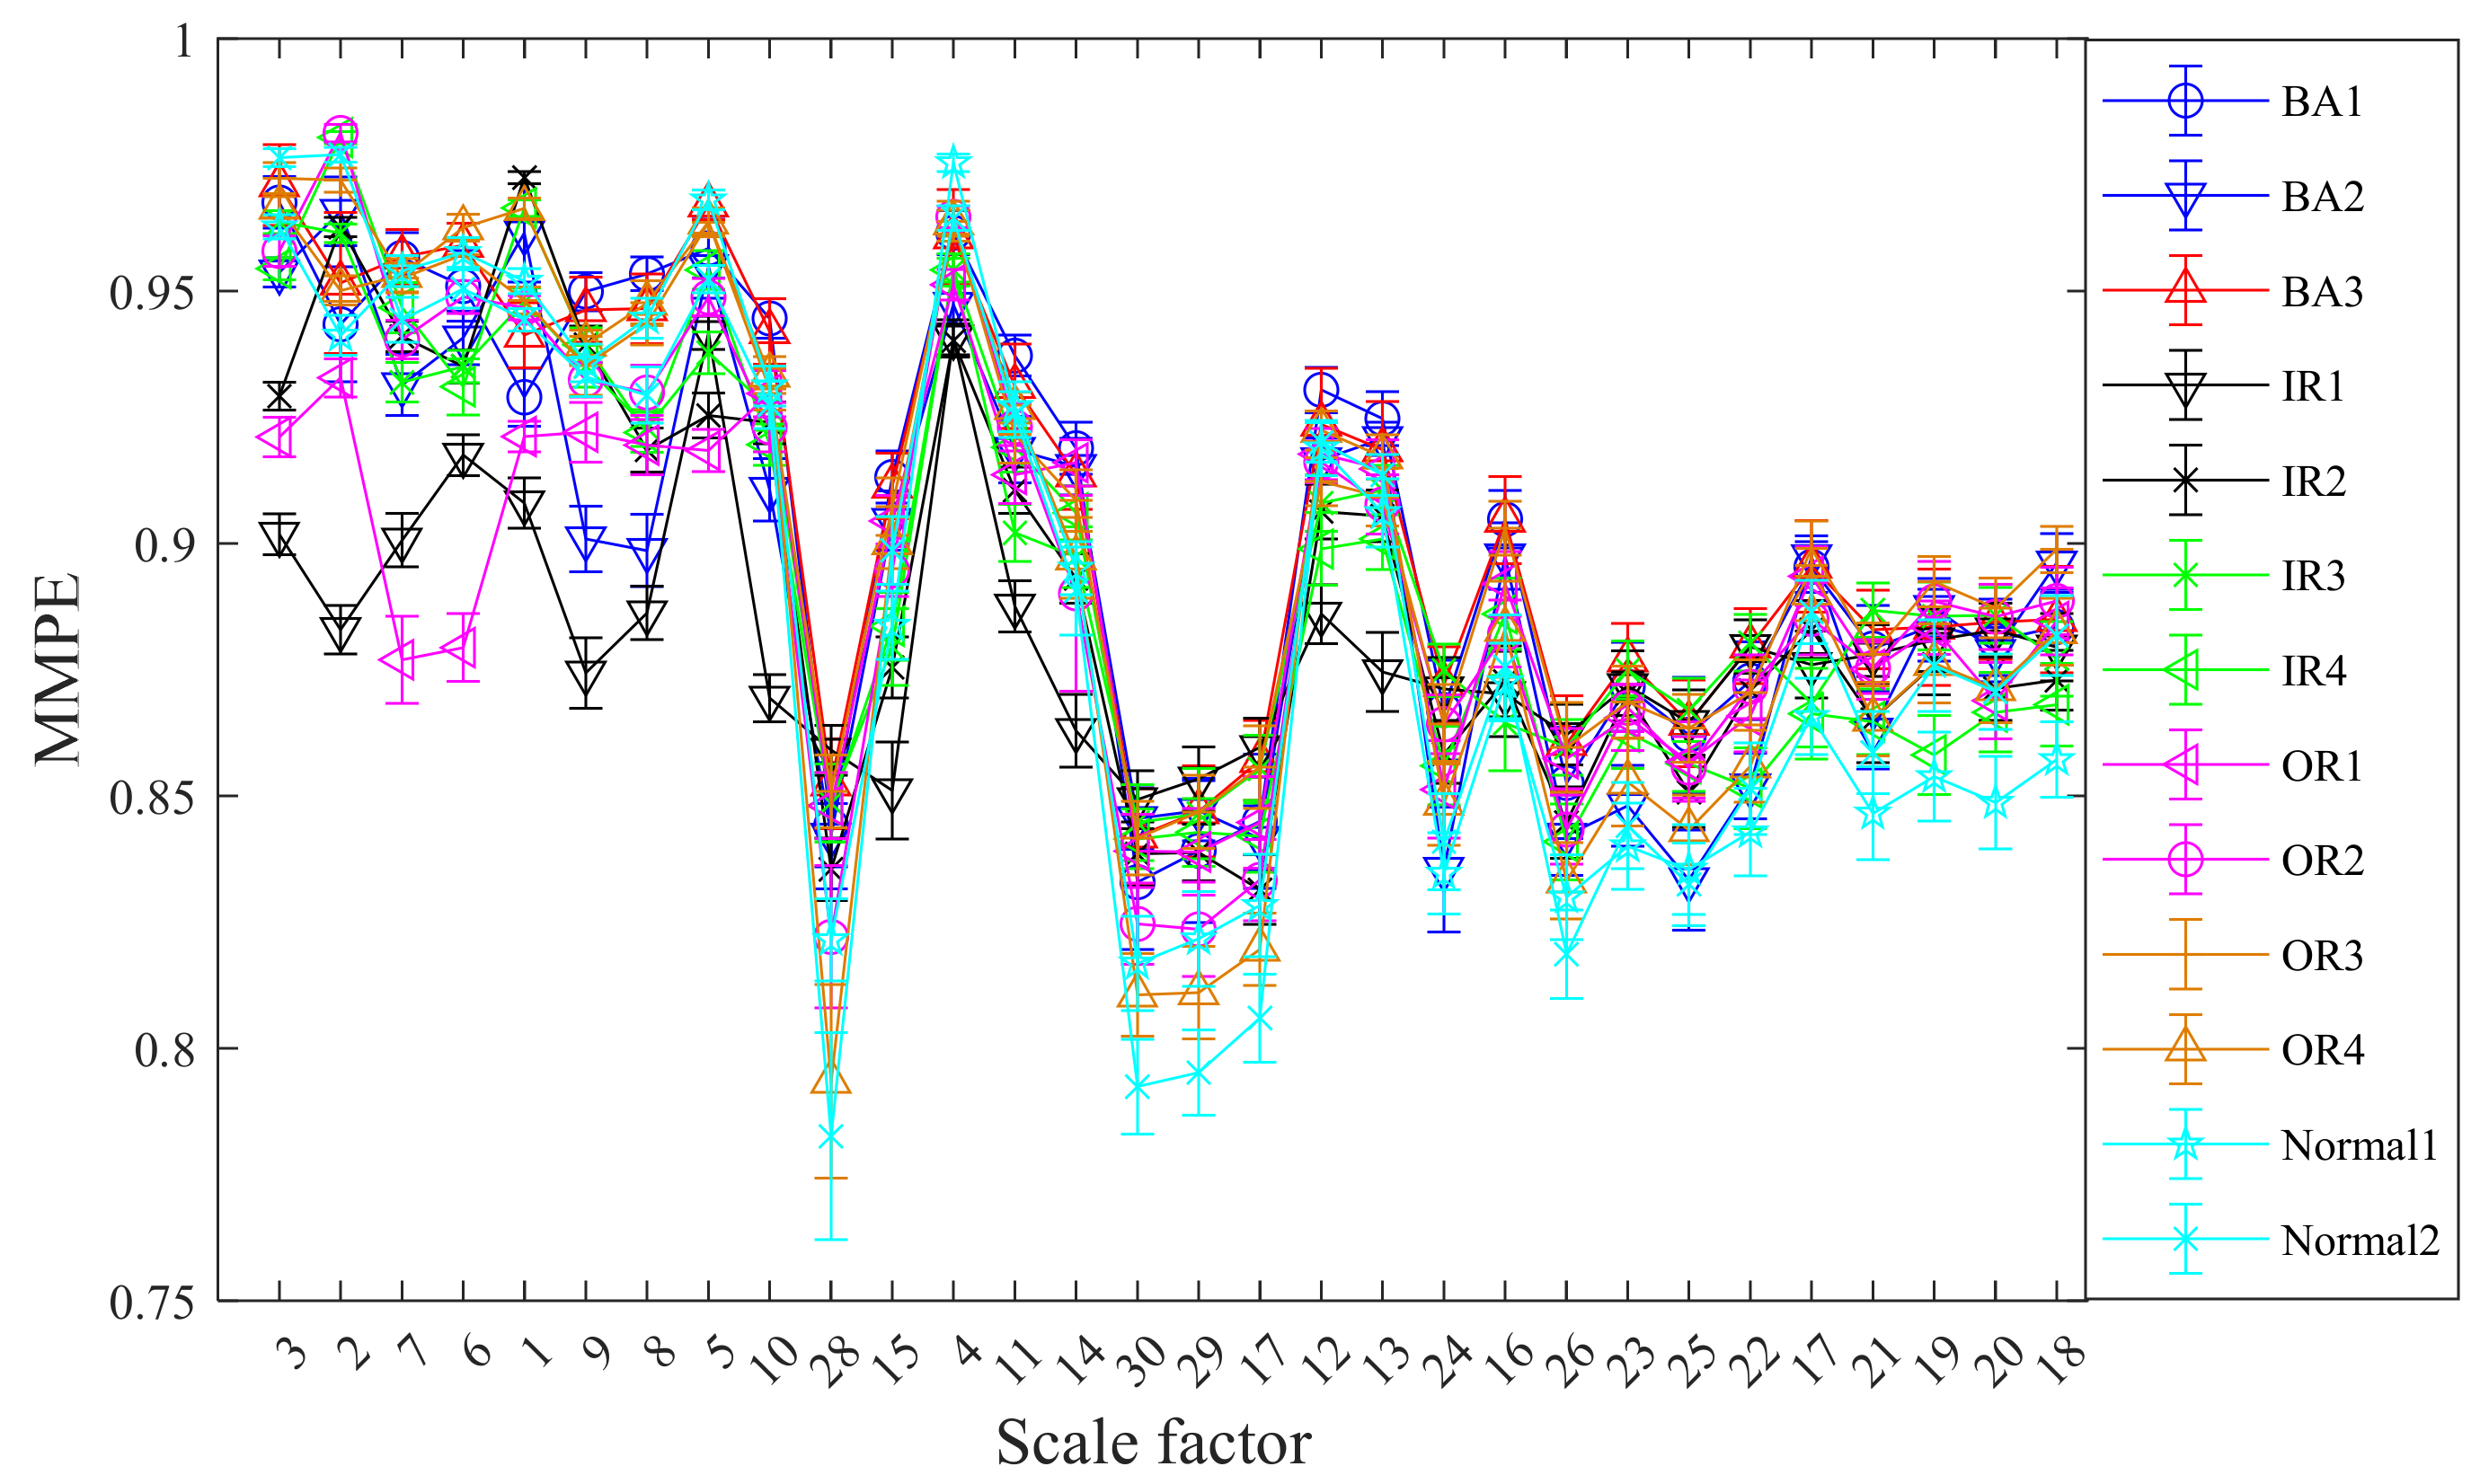
- LS is applied to rearrange the raw training features from low to high on the basis of their LS scores, and the first several sensitive features are selected to rebuild the training feature sets. Accordingly, the testing sets are also rearranged as the sensitive fault testing sets according to the LS scores.
- (4)
- The sensitive sets of training samples are put into the BA-SVM based multi-classifier for training.
- (5)
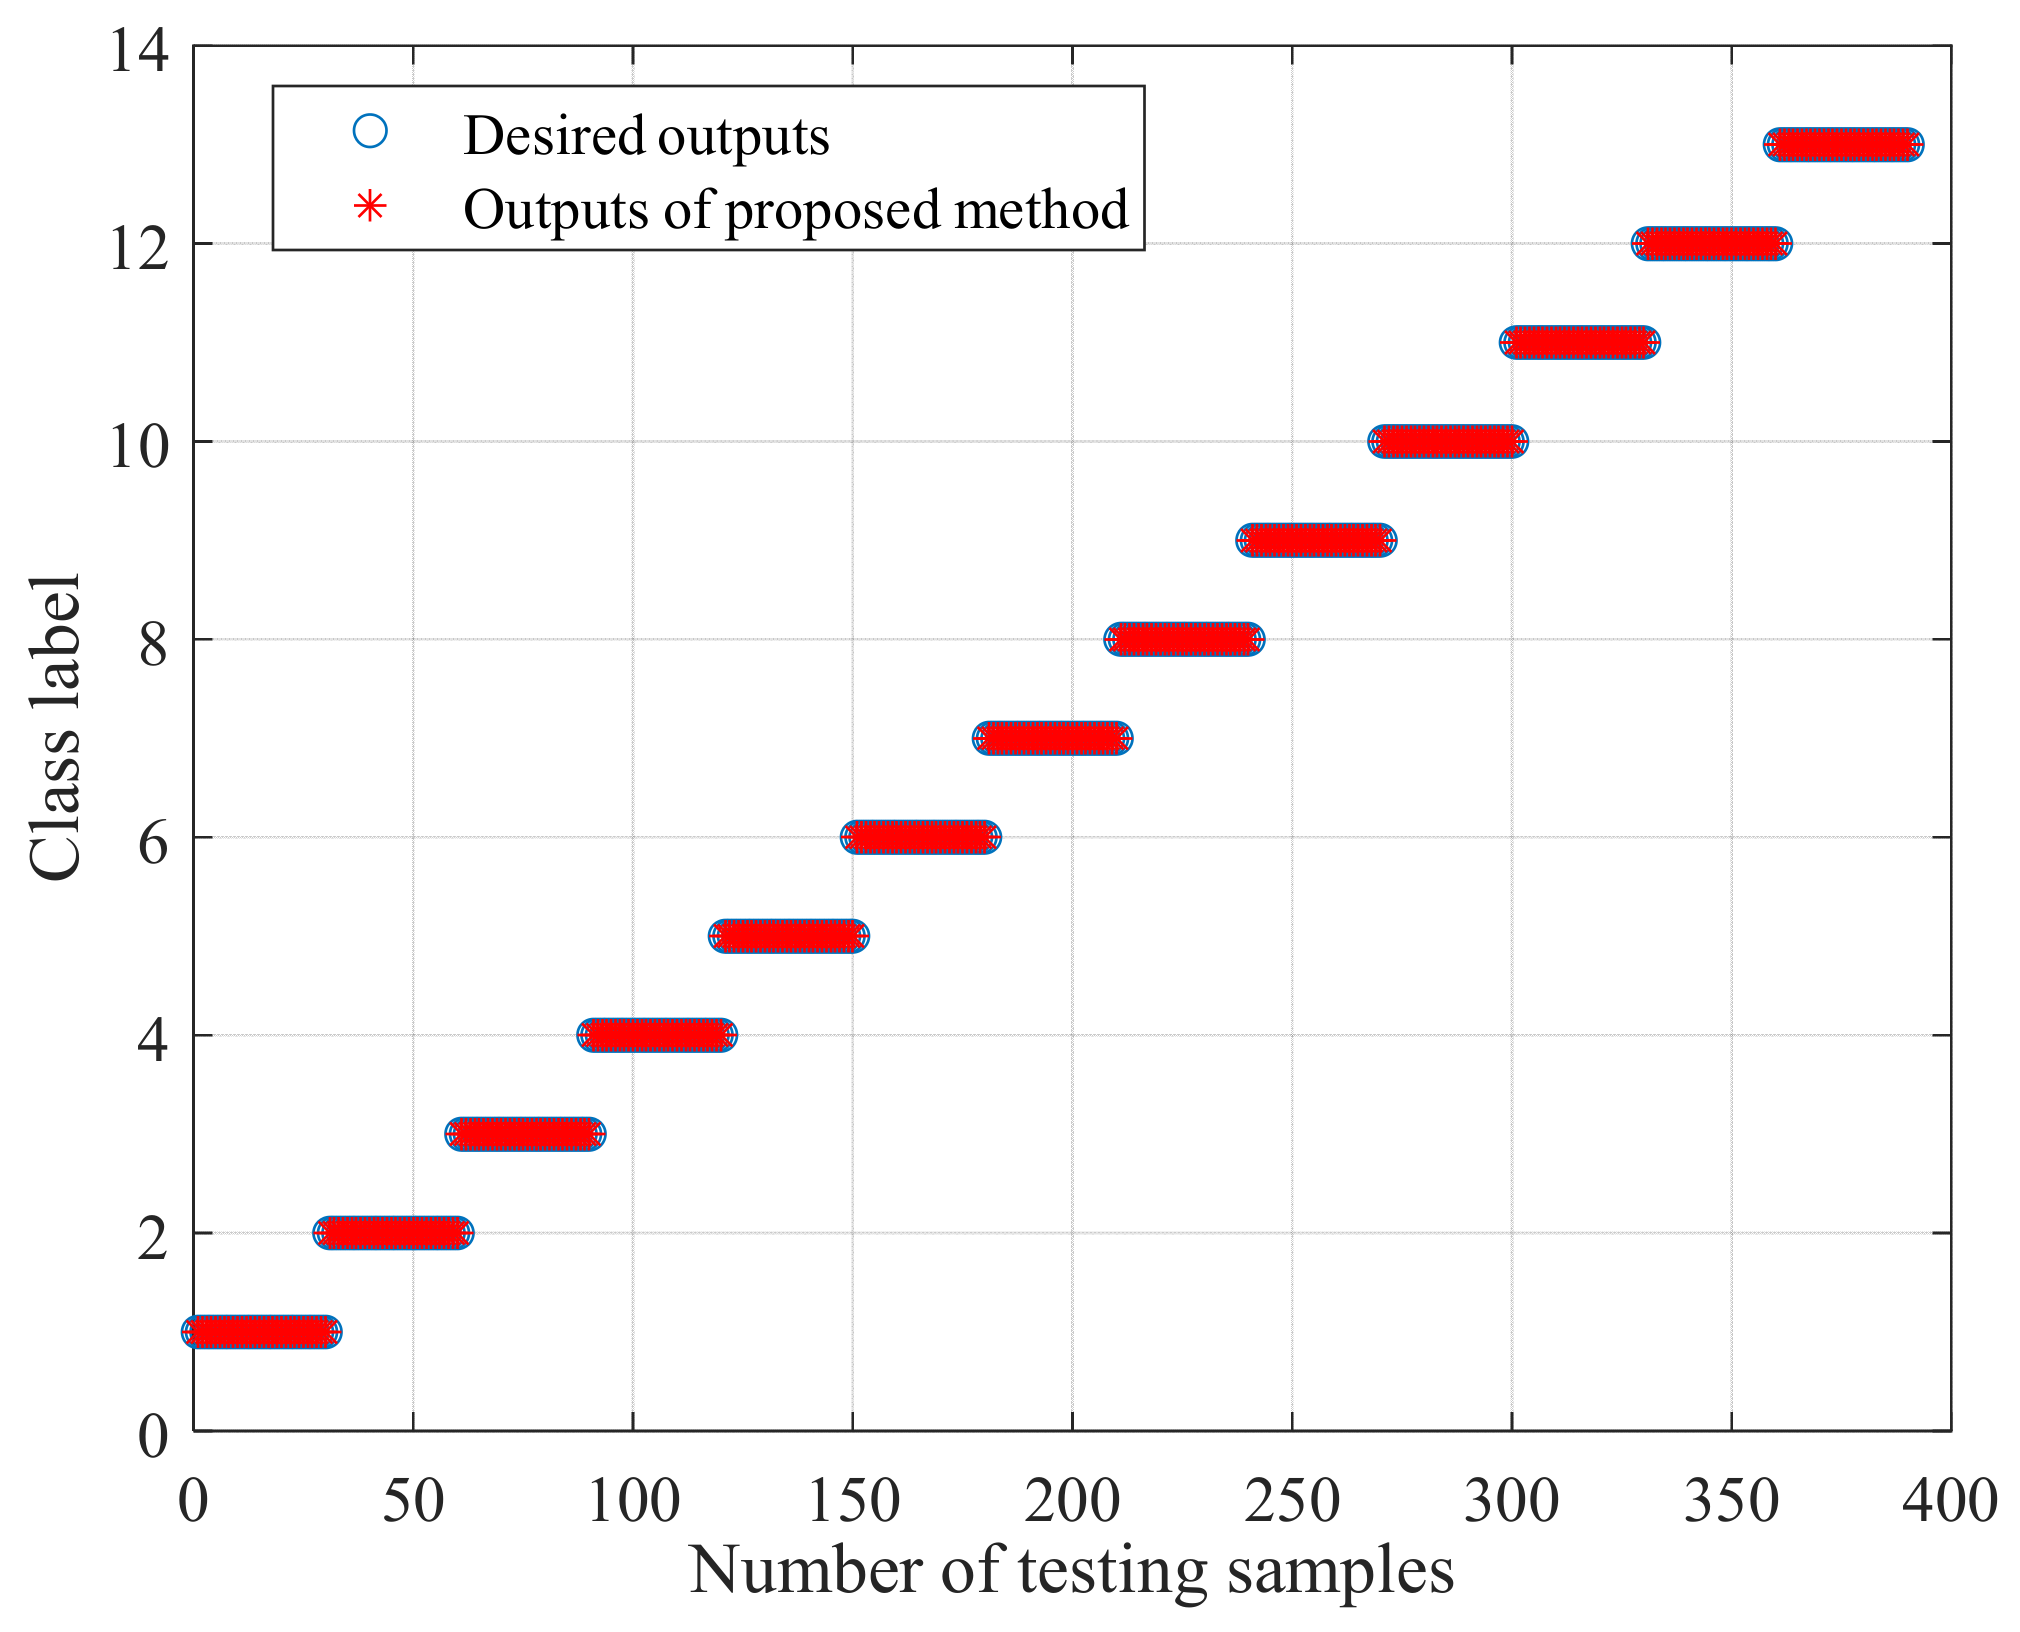
- The sensitive sets of testing samples are input to the trained multi-classifier to intelligently recognize fault categories according to the outputs.
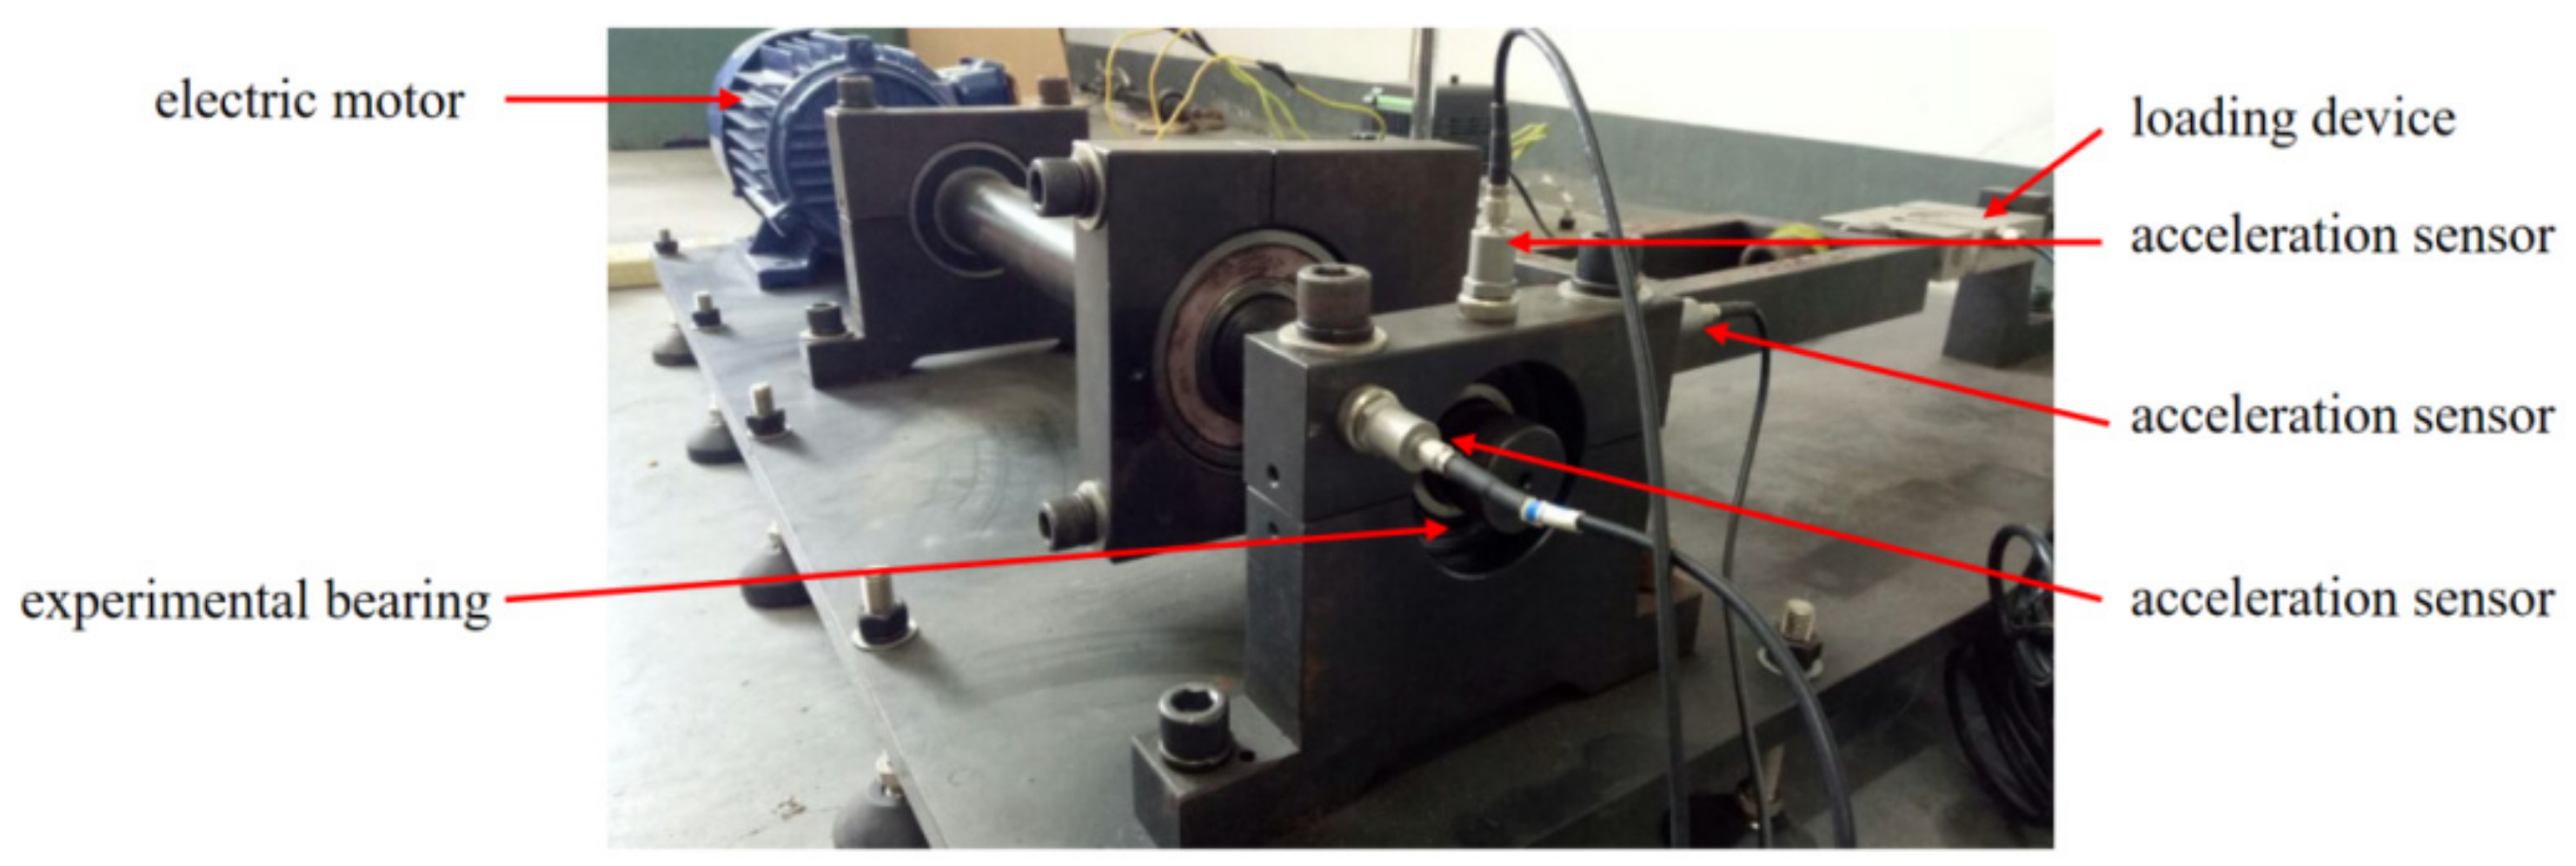
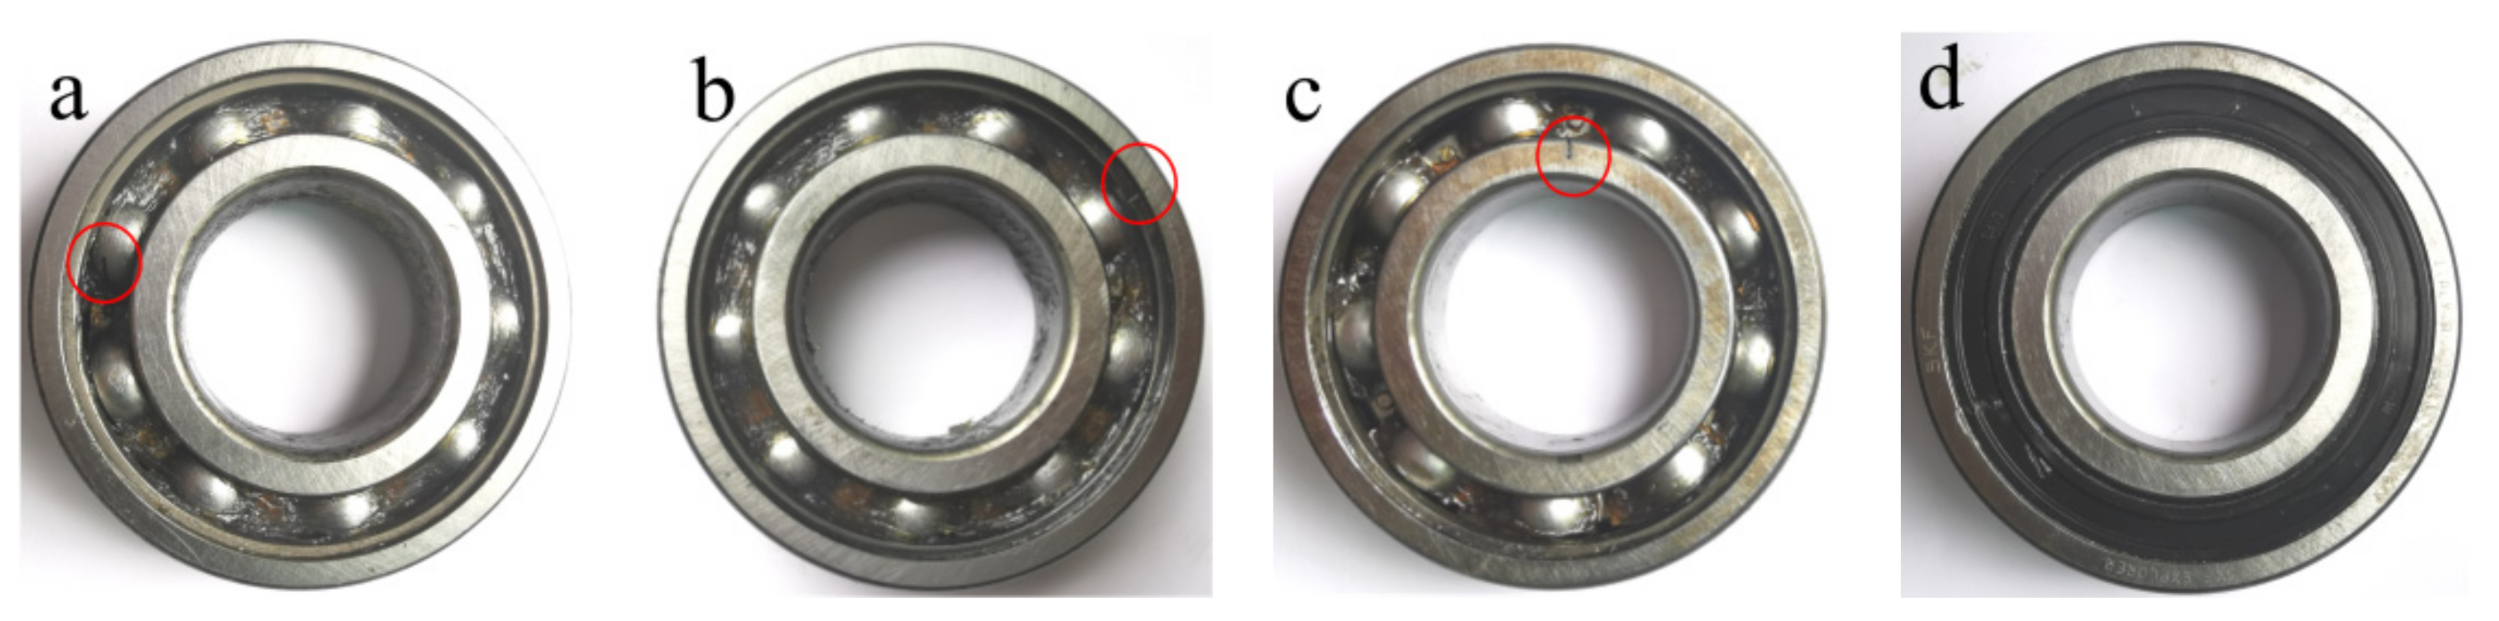
4.4. Analysis of Rolling Bearing Test Data
5. Conclusions
Author Contributions
Funding
Institutional Review Board Statement
Informed Consent Statement
Data Availability Statement
Acknowledgments
Conflicts of Interest
References
- Zheng, J.; Pan, H.; Tong, J.; Liu, Q. Generalized refined composite multiscale fuzzy entropy and multi-cluster feature selection based intelligent fault diagnosis of rolling bearing. ISA Trans. 2021; in press. [Google Scholar] [CrossRef]
- Ying, W.; Zheng, J.; Pan, H.; Liu, Q. Permutation entropy-based improved uniform phase empirical mode decomposition for mechanical fault diagnosis. Digit. Signal Processing 2021, 117, 103167. [Google Scholar] [CrossRef]
- Wang, X.; Zheng, J.; Pan, H.; Liu, Q.; Wang, C. Maximum envelope-based autogram and symplectic geometry mode decomposition based gear fault diagnosis method. Measurement 2021, 174, 108575. [Google Scholar] [CrossRef]
- Shen, C.; Wang, X.; Wang, D.; Li, Y.; Zhu, J.; Gong, M. Dynamic Joint Distribution Alignment Network for Bearing Fault Diagnosis Under Variable Working Conditions. IEEE Trans. Instrum. Meas. 2021, 70, 1–13. [Google Scholar] [CrossRef]
- Li, Y.; Wang, S.; Yang, Y.; Deng, Z. Multiscale symbolic fuzzy entropy: An entropy denoising method for weak feature extraction of rotating machinery. Mech. Syst. Signal Processing 2022, 162, 108052. [Google Scholar] [CrossRef]
- Bandt, C.; Pompe, B. Permutation entropy: A natural complexity measure for time series. Phys. Rev. Lett. 2002, 88, 174102. [Google Scholar] [CrossRef]
- Richman, J.S.; Moorman, J.R. Physiological time-series analysis using approximate entropy and sample entropy. Am. J. Physiol.-Heart Circ. Physiol. 2000, 278, H2039–H2049. [Google Scholar] [CrossRef] [Green Version]
- Chen, W.; Wang, Z.; Xie, H.; Yu, W. Characterization of surface EMG signal based on fuzzy entropy. IEEE Trans. Neural Syst. Rehabil. Eng. 2007, 15, 266–272. [Google Scholar] [CrossRef] [PubMed]
- Yan, R.; Liu, Y.; Gao, R.X. Permutation entropy: A nonlinear statistical measure for status characterization of rotary machines. Mech. Syst. Signal Processing 2012, 29, 474–484. [Google Scholar] [CrossRef]
- Zheng, J.D.; Cheng, J.S.; Yang, Y. A rolling bearing fault diagnosis method based on LCD and permutation entropy. J. Vib. Meas. Diagn. 2014, 34, 802–806. [Google Scholar]
- Bian, J.; Huo, C.; Tang, G.; Gao, J.; Lin, L. Fault classification of rolling bearing based on LMD-sample entropy and LS-SVM. In Proceedings of the 2016 Prognostics and System Health Management Conference (PHM-Chengdu), Chengdu, China, 19–21 October 2016; pp. 1–6. [Google Scholar]
- Yang, W.C.; Zhang, P.L.; Ren, G.Q. Bearing fault diagnosis based on fuzzy entropy and LS-SVM. J. Mech. Strength 2014, 36, 666–670. [Google Scholar]
- Caesarendra, W.; Tjahjowidodo, T. A review of feature extraction methods in vibration-based condition monitoring and its application for degradation trend estimation of low-speed slew bearing. Machines 2017, 5, 21. [Google Scholar] [CrossRef]
- Caesarendra, W.; Kosasih, B.; Tieu, K.; Moodie, C.A.S. An application of nonlinear feature extraction-A case study for low speed slewing bearing condition monitoring and prognosis. In Proceedings of the 2013 IEEE/ASME International Conference on Advanced Intelligent Mechatronics, Wollongong, NSW, Australia, 9–12 July 2013; pp. 1713–1718. [Google Scholar]
- Wu, Z.; Huang, N.E. Ensemble empirical mode decomposition: A noise-assisted data analysis method. Adv. Adapt. Data Anal. 2009, 1, 1–41. [Google Scholar] [CrossRef]
- Žvokelj, M.; Zupan, S.; Prebil, I. Non-linear multivariate and multiscale monitoring and signal denoising strategy using kernel principal component analysis combined with ensemble empirical mode decomposition method. Mech. Syst. Signal Processing 2011, 25, 2631–2653. [Google Scholar] [CrossRef]
- Dwyer, R. Detection of non-Gaussian signals by frequency domain kurtosis estimation[C]//ICASSP’83. In Proceedings of the IEEE International Conference on Acoustics, Speech, and Signal Processing, Boston, MA, USA, 14–16 April 1983; Volume 8, pp. 607–610. [Google Scholar]
- Antoni, J.; Randall, R.B. The spectral kurtosis: Application to the vibratory surveillance and diagnostics of rotating machines. Mech. Syst. Signal Processing 2006, 20, 308–331. [Google Scholar] [CrossRef]
- Costa, M.; Goldberger, A.L.; Peng, C.K. Multiscale entropy analysis of complex physiologic time series. Phys. Rev. Lett. 2002, 89, 068102. [Google Scholar] [CrossRef] [Green Version]
- Aziz, W.; Arif, M. Multiscale permutation entropy of physiological time series. In Proceedings of the 2005 Pakistan Section Multitopic Conference, Karachi, Pakistan, 24–25 December 2005; pp. 1–6. [Google Scholar]
- Zheng, J.; Cheng, J.; Yang, Y.; Luo, S. A rolling bearing fault diagnosis method based on multi-scale fuzzy entropy and variable predictive model-based class discrimination. Mech. Mach. Theory 2014, 78, 187–200. [Google Scholar] [CrossRef]
- Wang, X.; Si, S.; Li, Y. Variational embedding multiscale diversity entropy for fault diagnosis of large-scale machinery. IEEE Trans. Ind. Electron. 2021, 69, 3109–3119. [Google Scholar] [CrossRef]
- Xu, M.Q.; Li, Y.B.; Zhao, H.Y.; Zhang, S.Y. Application of MSE-EEMD Method in Gear Fault Diagnosis. Appl. Mech. Mater. 2014, 530–531, 261–265. [Google Scholar] [CrossRef]
- Le, D.H.; Cheng, J.; Yang, Y.; Pham, M. Gear fault diagnosis method based on local characteristic-scale decomposition multi-scale permutation entropy and radial basis function network. J. Comput. Theor. Nanosci. 2017, 14, 5054–5063. [Google Scholar] [CrossRef]
- Ahmed, M.U.; Li, L.; Cao, J.; Mandic, D.P. Multivariate multiscale entropy for brain consciousness analysis. In Proceedings of the 2011 Annual International Conference of the IEEE Engineering in Medicine and Biology Society, Boston, MA, USA, 30 August–3 September 2011; pp. 810–813. [Google Scholar]
- Zhang, Y.; Shang, P. The complexity–entropy causality plane based on multivariate multiscale distribution entropy of traffic time series. Nonlinear Dyn. 2019, 95, 617–629. [Google Scholar] [CrossRef]
- Ahmed, M.U.; Mandic, D.P. Multivariate multiscale entropy: A tool for complexity analysis of multichannel data. Phys. Rev. E 2011, 84, 061918. [Google Scholar] [CrossRef] [PubMed] [Green Version]
- Morabito, F.C.; Labate, D.; La Foresta, F.; Yu, H.; Chen, Y.; Wang, J. Multivariate multi-scale permutation entropy for complexity analysis of Alzheimer’s disease EEG. Entropy 2012, 14, 1186–1202. [Google Scholar] [CrossRef] [Green Version]
- He, X.; Cai, D.; Niyogi, P. Laplacian score for feature selection. In Advances in Neural Information Processing Systems; MIT Press: Cambridge, MA, USA, 2005; pp. 507–514. [Google Scholar]
- Tharwat, A.; Hassanien, A.E.; Elnaghi, B.E. A BA-based algorithm for parameter optimization of support vector machine. Pattern Recognit. Lett. 2017, 93, 13–22. [Google Scholar] [CrossRef]
- Zheng, J.; Pan, H.; Yang, S.; Cheng, J. Generalized composite multiscale permutation entropy and Laplacian score based rolling bearing fault diagnosis. Mech. Syst. Signal Processing 2018, 99, 229–243. [Google Scholar] [CrossRef]


| Fault Categories | Fault Degree (mm) | Load (kN) | Rotation Speed (r/min) | Number of Training Samples | Number of Testing Samples | Type Labels |
|---|---|---|---|---|---|---|
| BA1 | 0.2 | 5 | 900 | 20 | 30 | 1 |
| BA2 | 0.4 | 5 | 900 | 20 | 30 | 2 |
| BA3 | 0.2 | 0 | 1500 | 20 | 30 | 3 |
| OR1 | 0.2 | 5 | 900 | 20 | 30 | 4 |
| OR2 | 0.3 | 5 | 900 | 20 | 30 | 5 |
| OR3 | 0.2 | 0 | 1500 | 20 | 30 | 6 |
| OR4 | 0.3 | 0 | 1500 | 20 | 30 | 7 |
| IR1 | 0.3 | 5 | 900 | 20 | 30 | 8 |
| IR2 | 0.4 | 5 | 900 | 20 | 30 | 9 |
| IR3 | 0.3 | 0 | 1500 | 20 | 30 | 10 |
| IR4 | 0.4 | 0 | 1500 | 20 | 30 | 11 |
| Normal1 | 0 | 5 | 900 | 20 | 30 | 12 |
| Normal2 | 0 | 0 | 1500 | 20 | 30 | 13 |
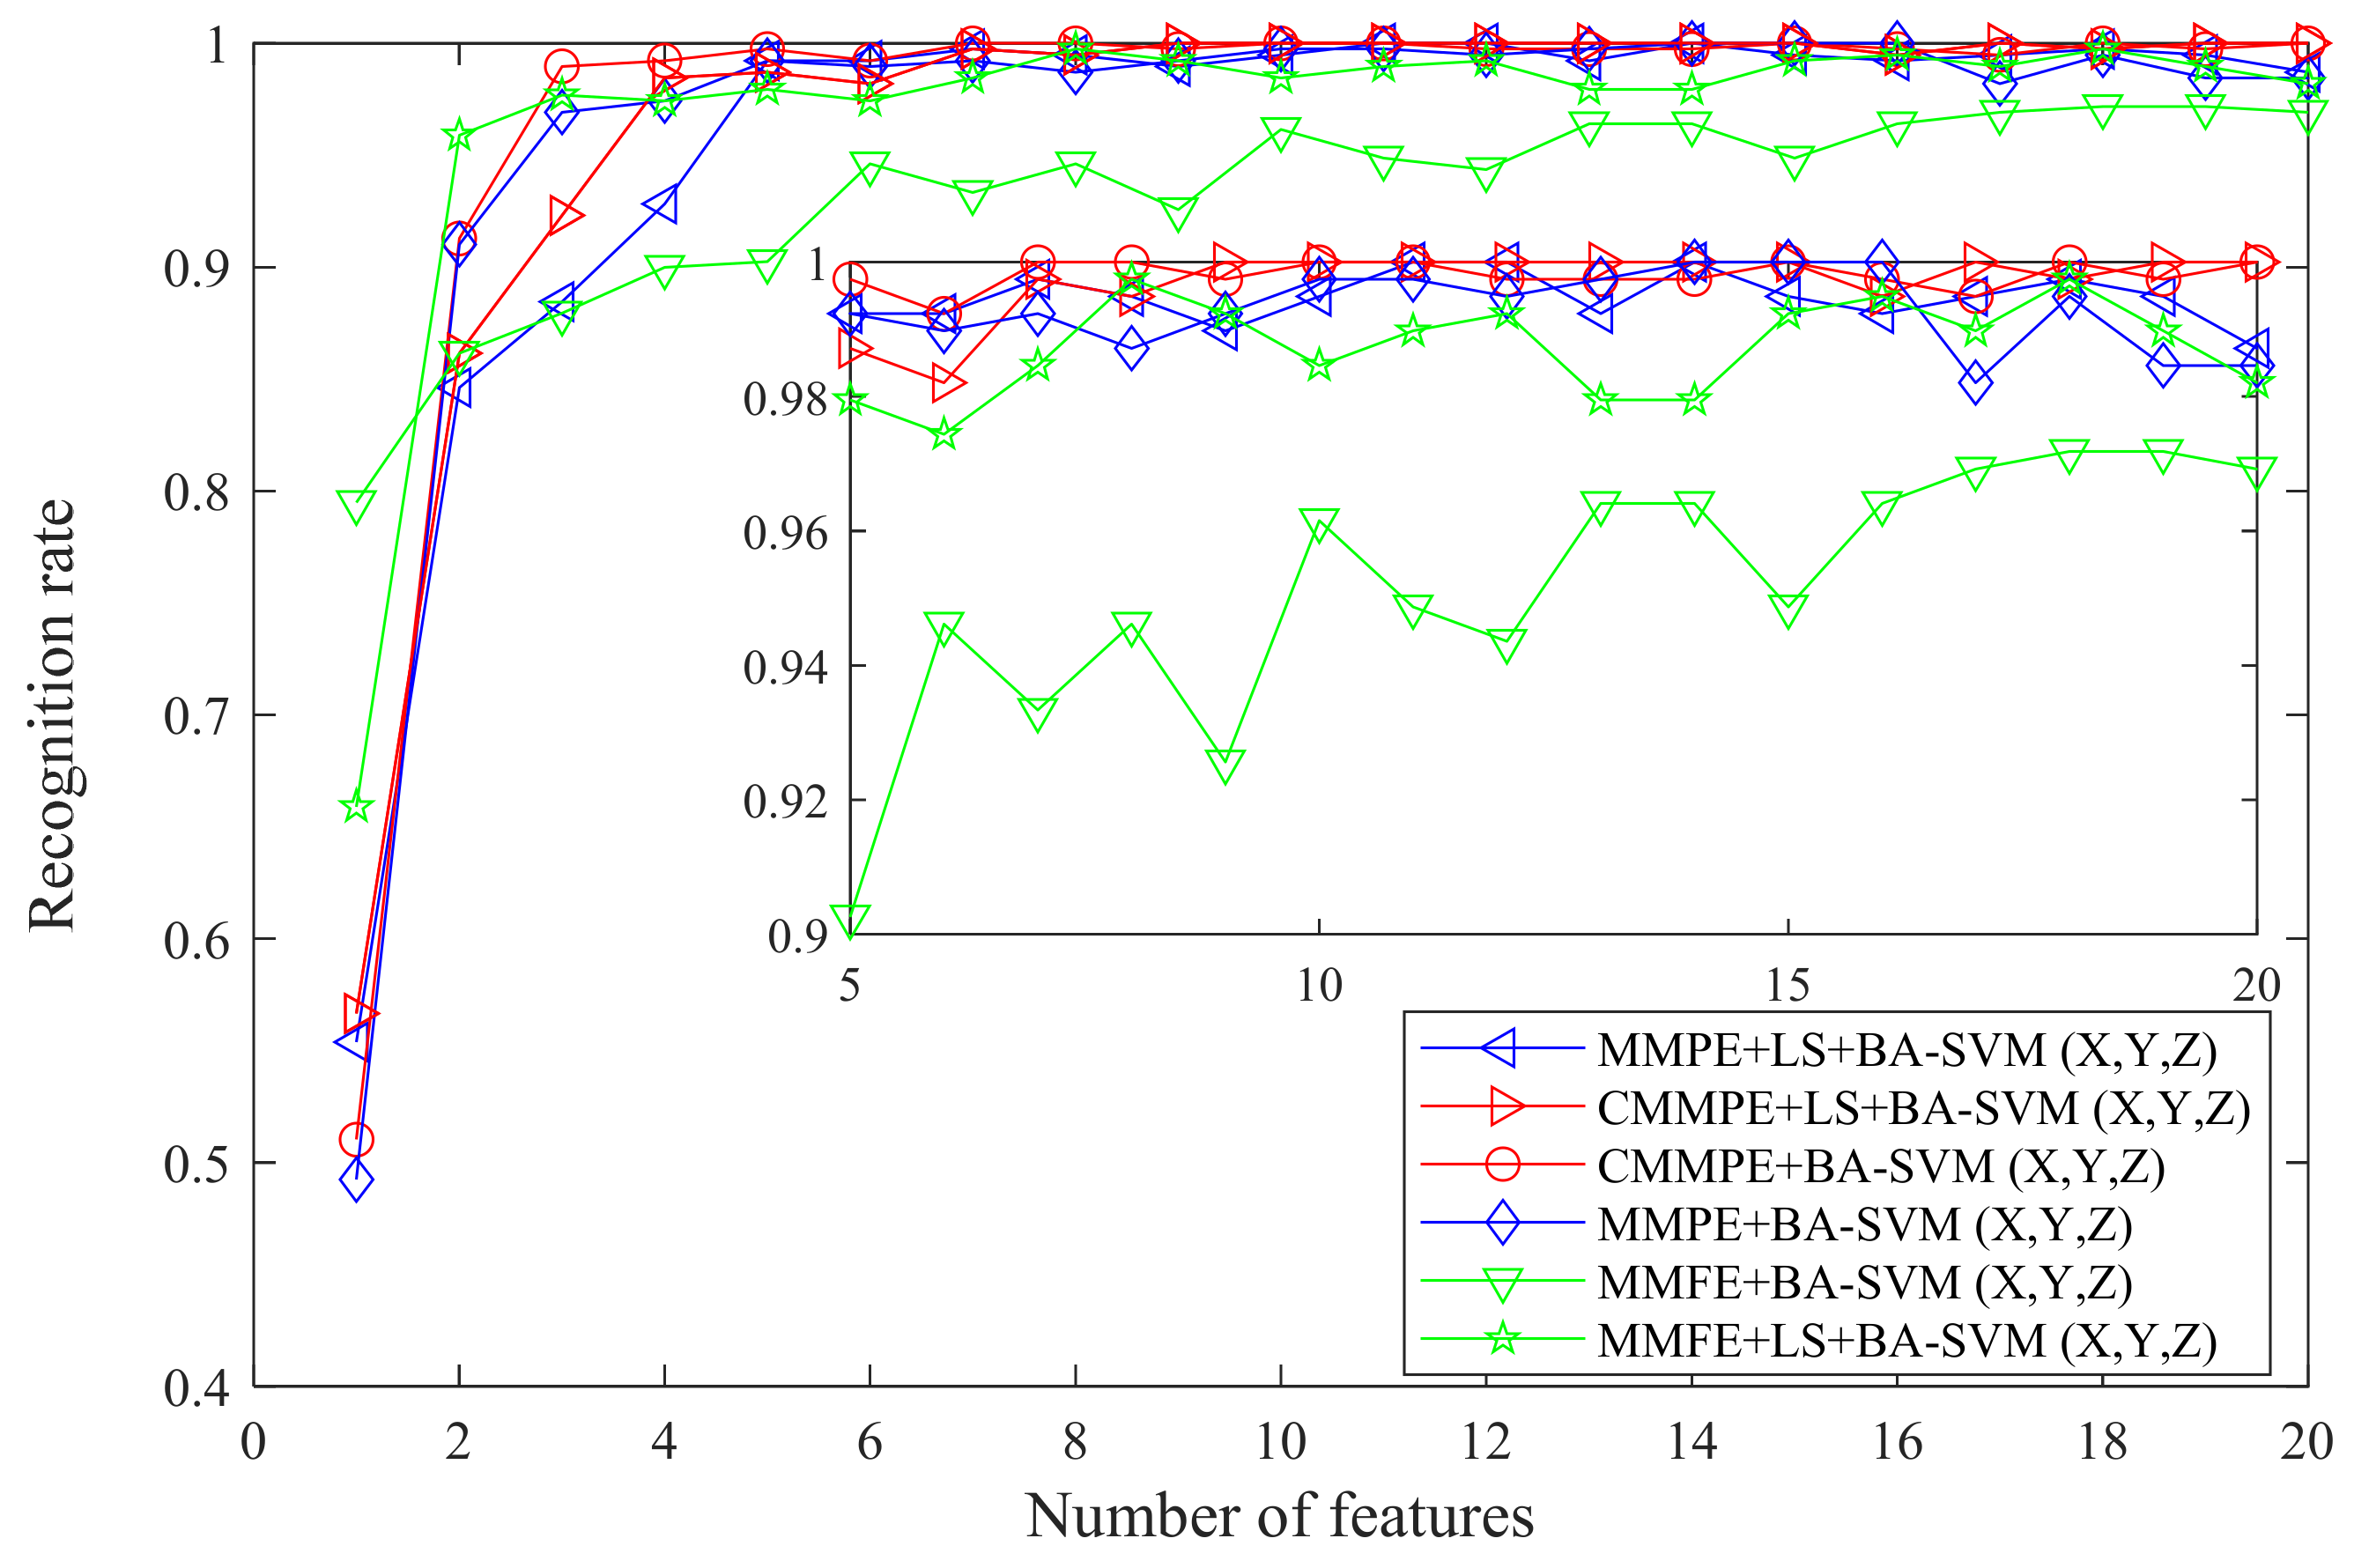
| Number of Features Used | 1 | 2 | 3 | 4 | 5 | 6 | 7 | 8 | 9 | 10 |
| CMMPE+LS+BA-SVM | 56.67 | 86.15 | 92.31 | 98.46 | 98.72 | 98.21 | 99.74 | 99.49 | 100 | 100 |
| CMMPE+BA-SVM | 51.03 | 91.28 | 98.97 | 99.23 | 99.74 | 99.23 | 100 | 100 | 99.74 | 100 |
| MMPE+LS+BA-SVM | 55.38 | 84.62 | 88.46 | 92.82 | 99.23 | 99.23 | 99.74 | 99.49 | 98.97 | 99.49 |
| MMPE+BA-SVM | 49.23 | 91.03 | 96.92 | 97.44 | 99.23 | 98.97 | 99.23 | 98.72 | 99.23 | 99.74 |
| MMFE+LS+BA-SVM | 65.90 | 95.90 | 97.69 | 97.44 | 97.95 | 97.44 | 98.46 | 99.74 | 99.23 | 98.46 |
| MMFE+BA-SVM | 79.49 | 86.15 | 87.95 | 90.00 | 90.26 | 94.62 | 93.33 | 94.62 | 92.56 | 96.15 |
| 11 | 12 | 13 | 14 | 15 | 16 | 17 | 18 | 19 | 20 | |
| CMMPE+LS+BA-SVM | 100 | 100 | 100 | 100 | 100 | 99.49 | 100 | 99.74 | 100 | 100 |
| CMMPE+BA-SVM | 100 | 99.74 | 99.74 | 99.74 | 100 | 99.74 | 99.49 | 100 | 99.74 | 100 |
| MMPE+LS+BA-SVM | 100 | 99.74 | 99.74 | 99.74 | 100 | 99.74 | 99.49 | 100 | 99.74 | 100 |
| MMPE+BA-SVM | 100 | 100 | 99.23 | 100 | 99.49 | 99.63 | 99.49 | 99.74 | 99.49 | 98.72 |
| MMFE+LS+BA-SVM | 98.97 | 99.23 | 97.95 | 97.95 | 99.23 | 99.49 | 98.97 | 99.74 | 98.97 | 98.21 |
| MMFE+BA-SVM | 94.87 | 94.36 | 96.41 | 96.41 | 94.87 | 96.41 | 96.92 | 97.18 | 97.18 | 96.92 |
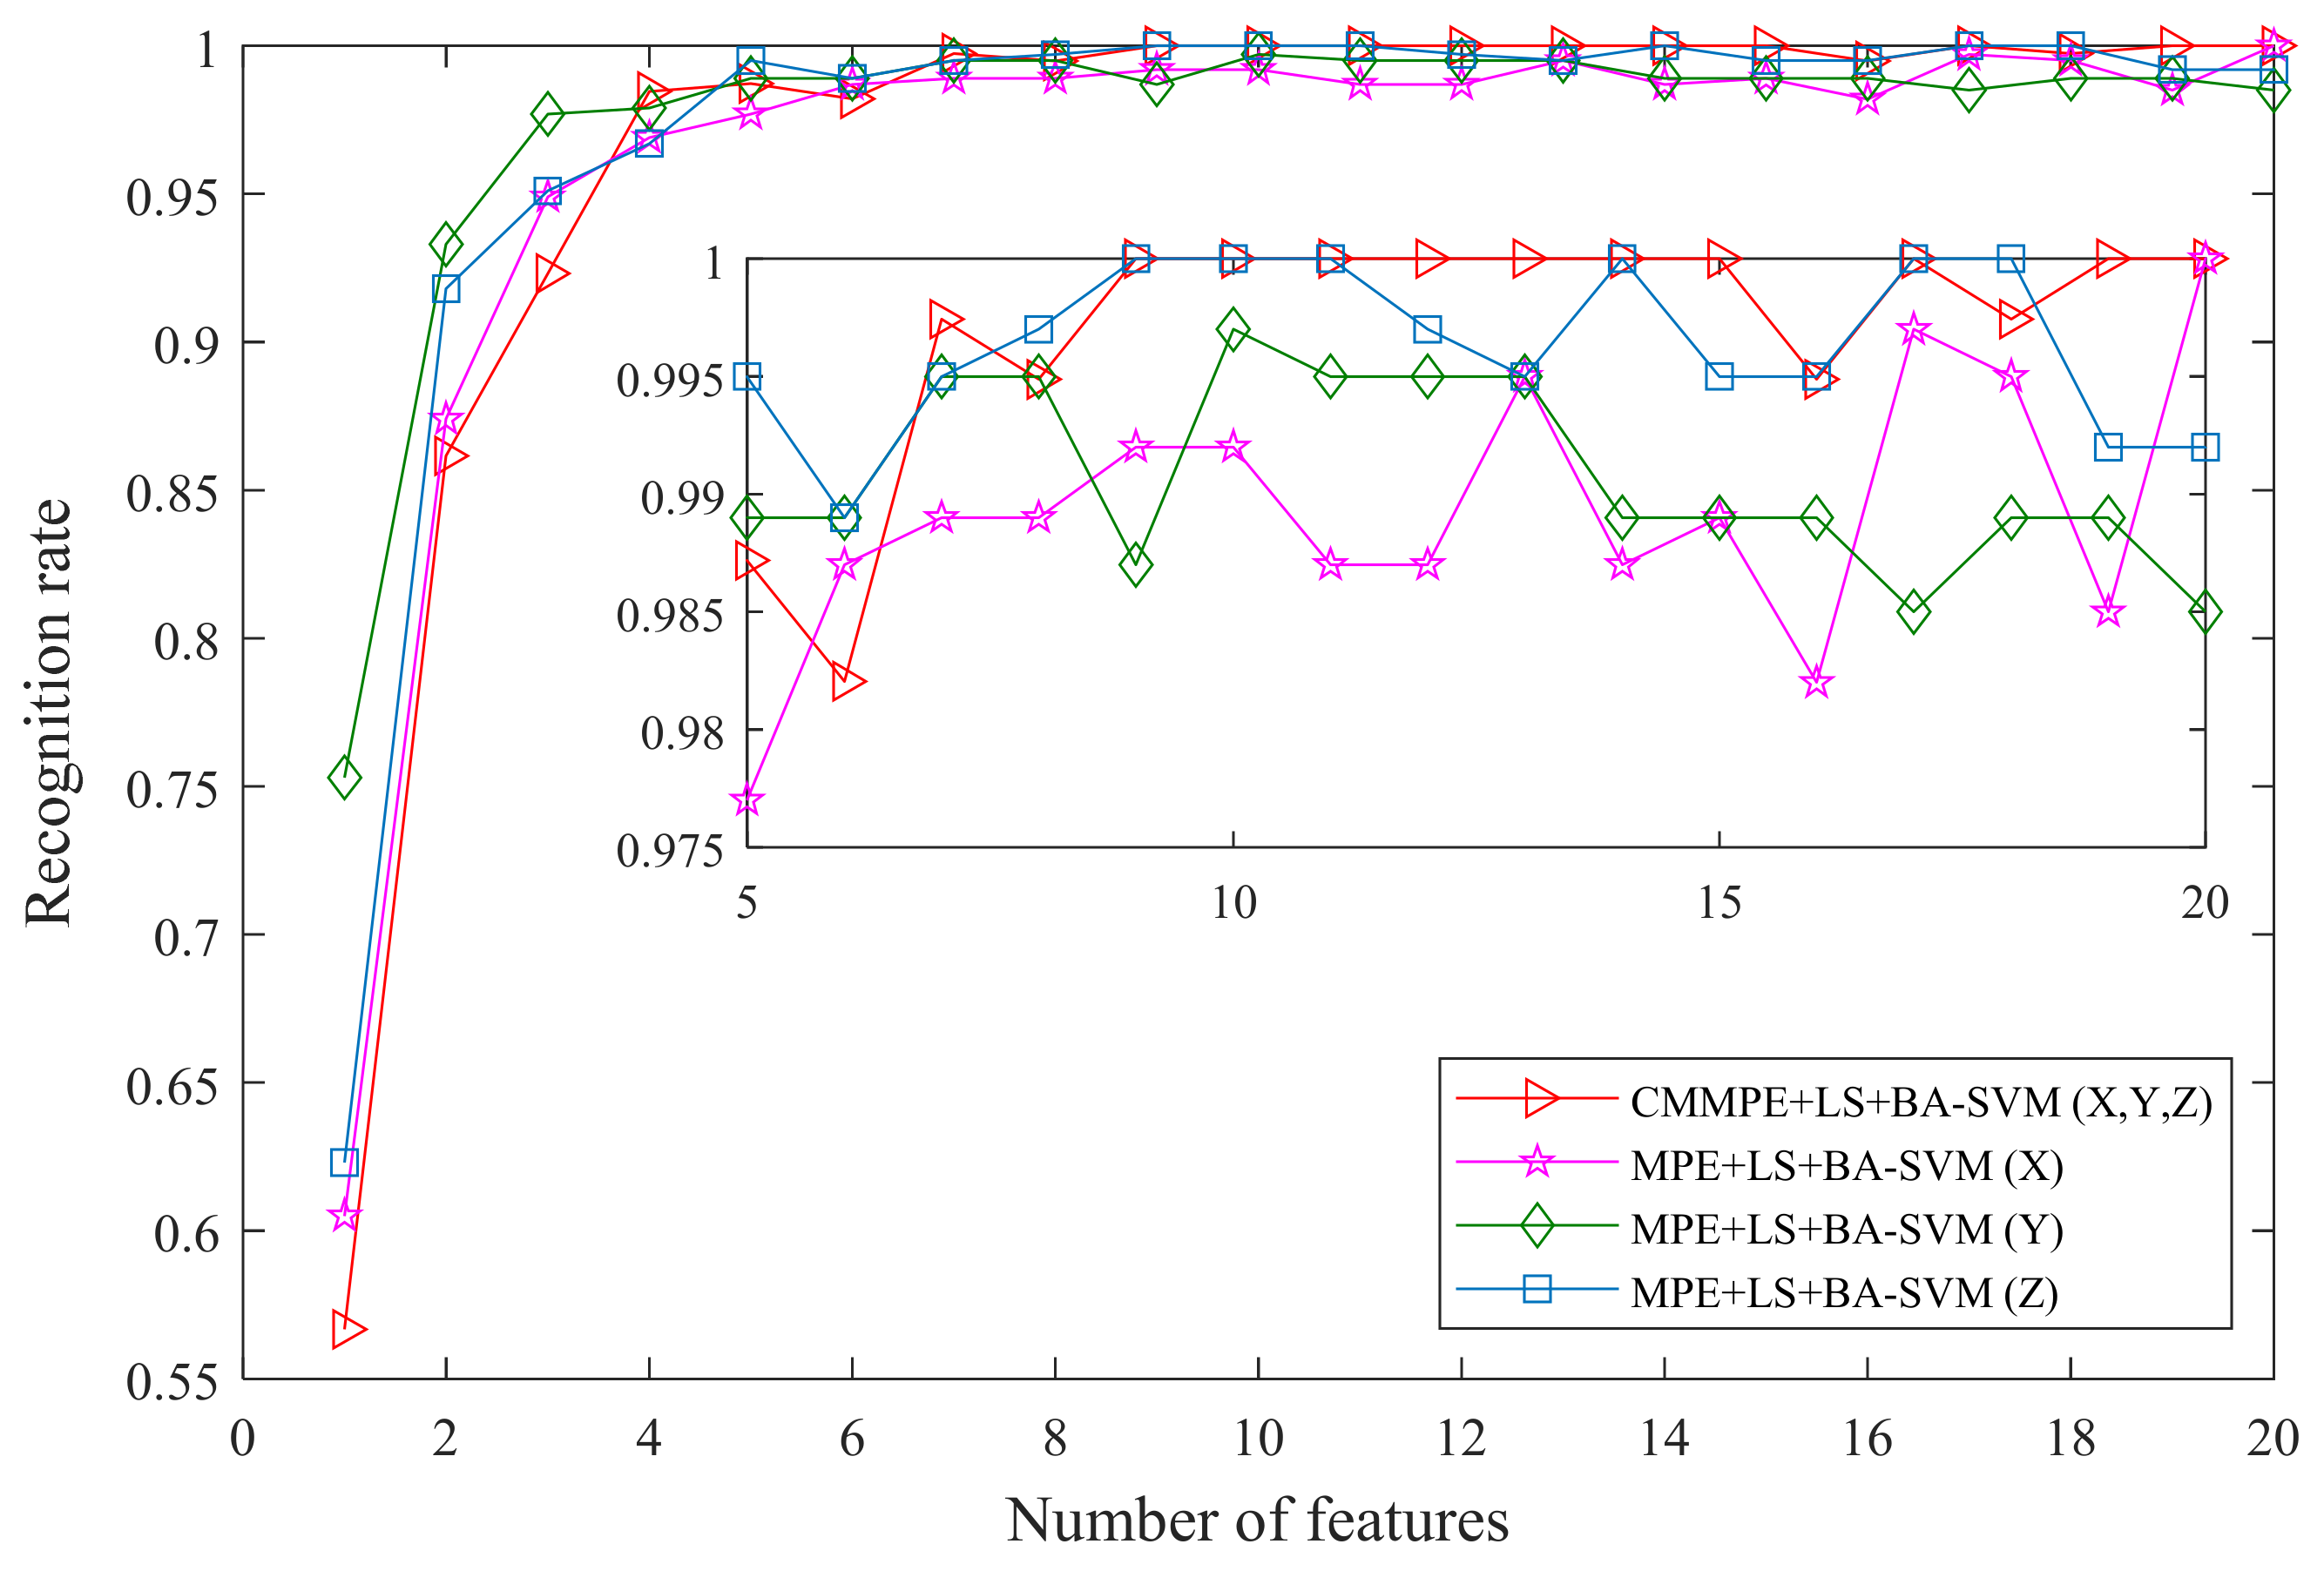
| Number of Features Used | 1 | 2 | 3 | 4 | 5 | 6 | 7 | 8 | 9 | 10 |
| MPE+LS+BA-SVM (X) | 62.82 | 83.85 | 94.36 | 97.69 | 97.44 | 96.92 | 98.97 | 99.74 | 98.72 | 99.49 |
| MPE+LS+BA-SVM (Y) | 73.85 | 97.95 | 98.72 | 99.74 | 99.23 | 99.49 | 99.74 | 98.97 | 99.49 | 99.49 |
| MPE+LS+BA-SVM (Z) | 63.08 | 92.05 | 96.41 | 97.18 | 99.23 | 99.49 | 99.23 | 99.74 | 99.49 | 100 |
| 11 | 12 | 13 | 14 | 15 | 16 | 17 | 18 | 19 | 20 | |
| MPE+LS+BA-SVM (X) | 99.23 | 98.72 | 100 | 98.72 | 98.97 | 99.49 | 98.21 | 99.23 | 99.74 | 98.97 |
| MPE+LS+BA-SVM (Y) | 99.74 | 98.97 | 99.23 | 99.74 | 99.23 | 98.97 | 98.72 | 99.23 | 99.23 | 99.23 |
| MPE+LS+BA-SVM (Z) | 99.74 | 99.74 | 99.49 | 99.74 | 99.74 | 99.74 | 99.74 | 100 | 99.74 | 98.72 |
Publisher’s Note: MDPI stays neutral with regard to jurisdictional claims in published maps and institutional affiliations. |
© 2022 by the authors. Licensee MDPI, Basel, Switzerland. This article is an open access article distributed under the terms and conditions of the Creative Commons Attribution (CC BY) license (https://creativecommons.org/licenses/by/4.0/).
Share and Cite
Ying, W.; Tong, J.; Dong, Z.; Pan, H.; Liu, Q.; Zheng, J. Composite Multivariate Multi-Scale Permutation Entropy and Laplacian Score Based Fault Diagnosis of Rolling Bearing. Entropy 2022, 24, 160. https://doi.org/10.3390/e24020160
Ying W, Tong J, Dong Z, Pan H, Liu Q, Zheng J. Composite Multivariate Multi-Scale Permutation Entropy and Laplacian Score Based Fault Diagnosis of Rolling Bearing. Entropy. 2022; 24(2):160. https://doi.org/10.3390/e24020160
Chicago/Turabian StyleYing, Wanming, Jinyu Tong, Zhilin Dong, Haiyang Pan, Qingyun Liu, and Jinde Zheng. 2022. "Composite Multivariate Multi-Scale Permutation Entropy and Laplacian Score Based Fault Diagnosis of Rolling Bearing" Entropy 24, no. 2: 160. https://doi.org/10.3390/e24020160
APA StyleYing, W., Tong, J., Dong, Z., Pan, H., Liu, Q., & Zheng, J. (2022). Composite Multivariate Multi-Scale Permutation Entropy and Laplacian Score Based Fault Diagnosis of Rolling Bearing. Entropy, 24(2), 160. https://doi.org/10.3390/e24020160