
Using Convolutional Neural Network and a Single Heartbeat for ECG Biometric Recognition


Abstract
1. Introduction
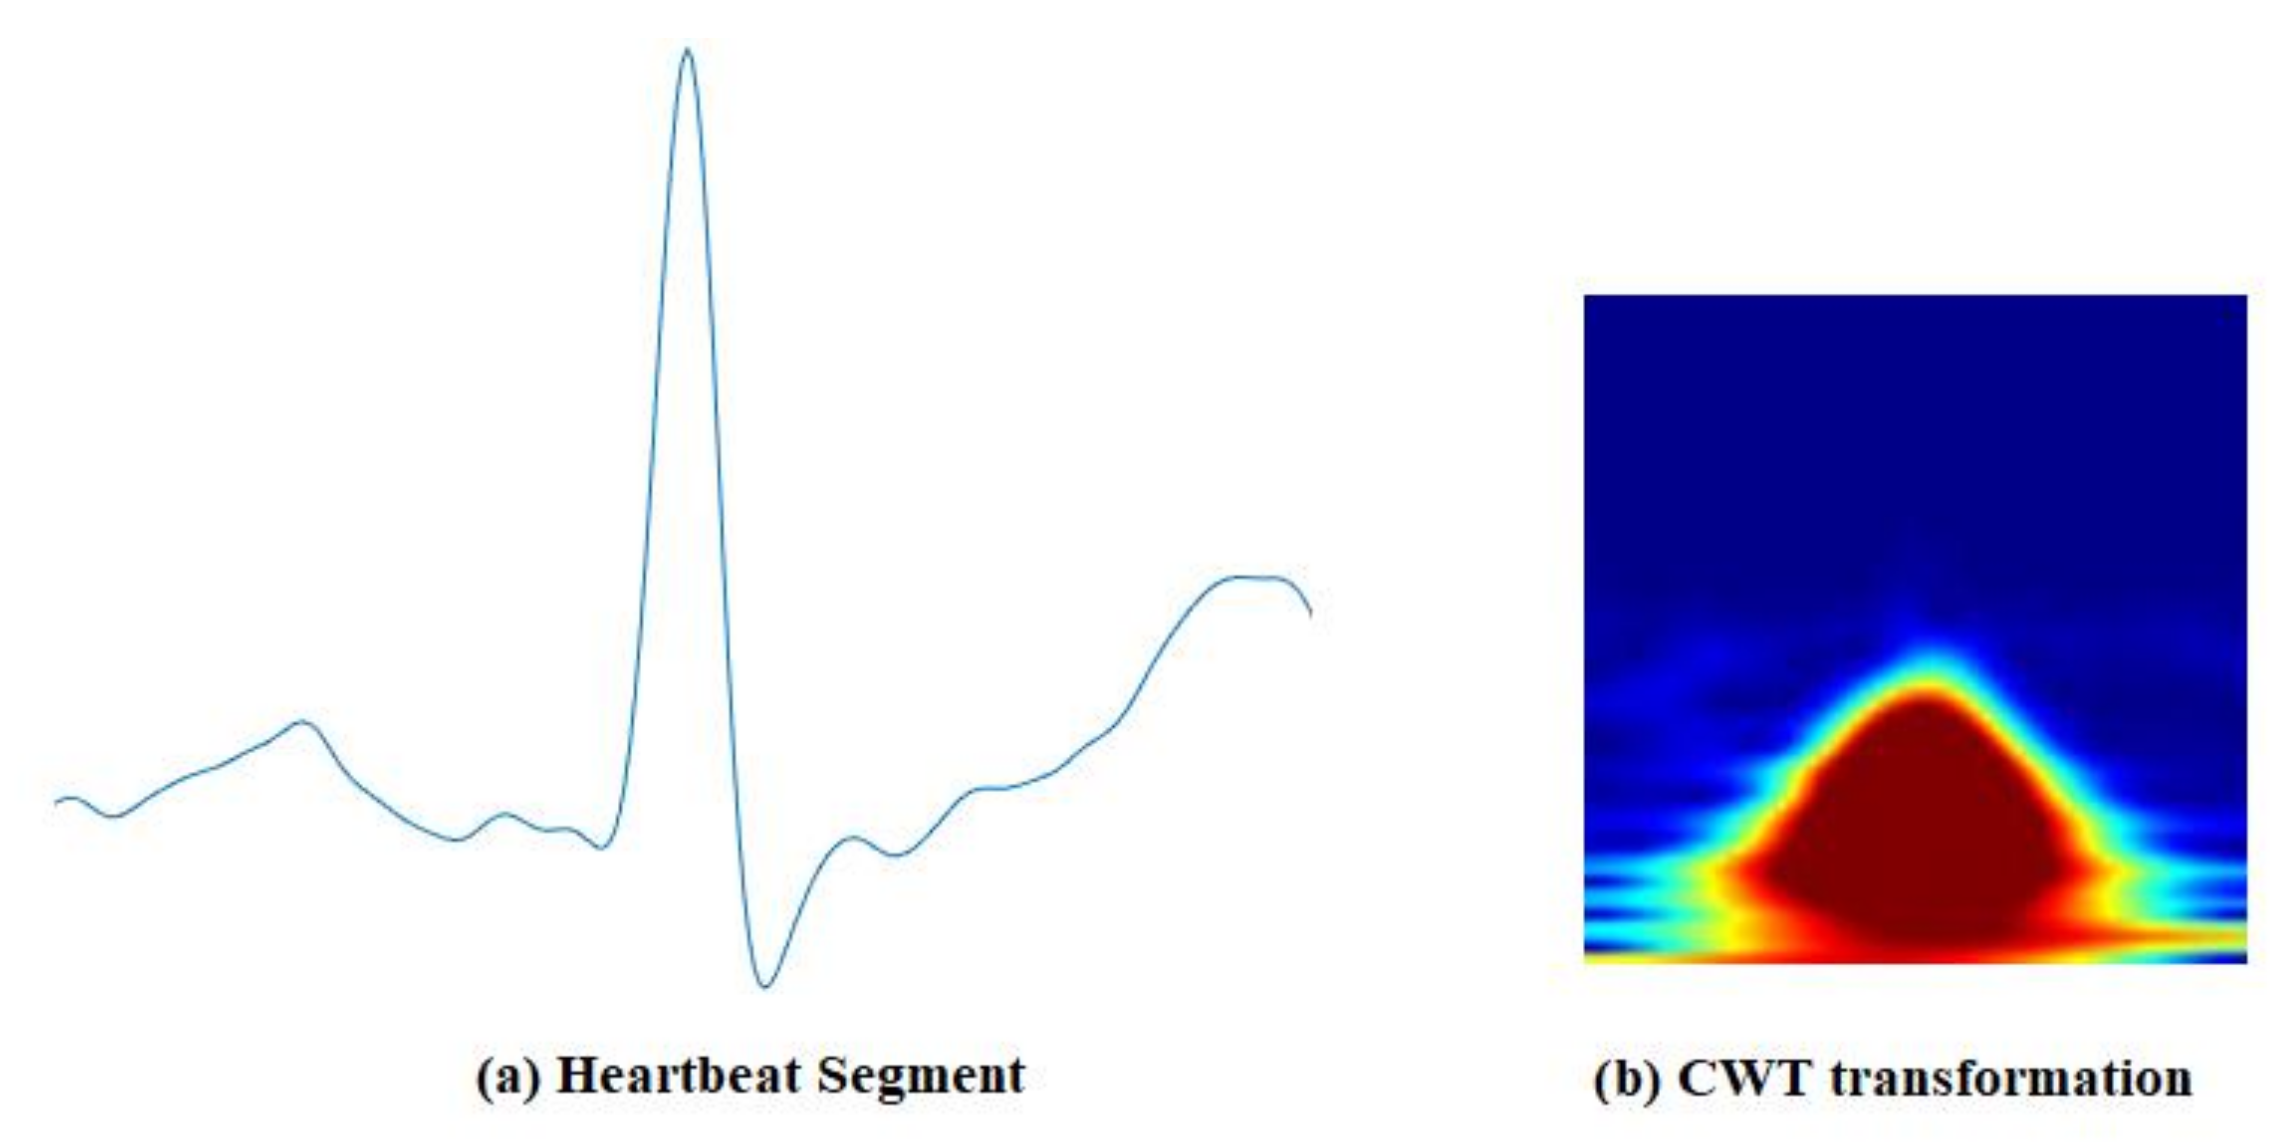
- We investigate the effectiveness of time–frequency domain representation of a short segment of an ECG signal (0.5-second window around the R-peak) for improved biometric recognition. The significance of this finding is that it improves the acceptability of an ECG signal as a biometric modality, which can be used for a liveness test.
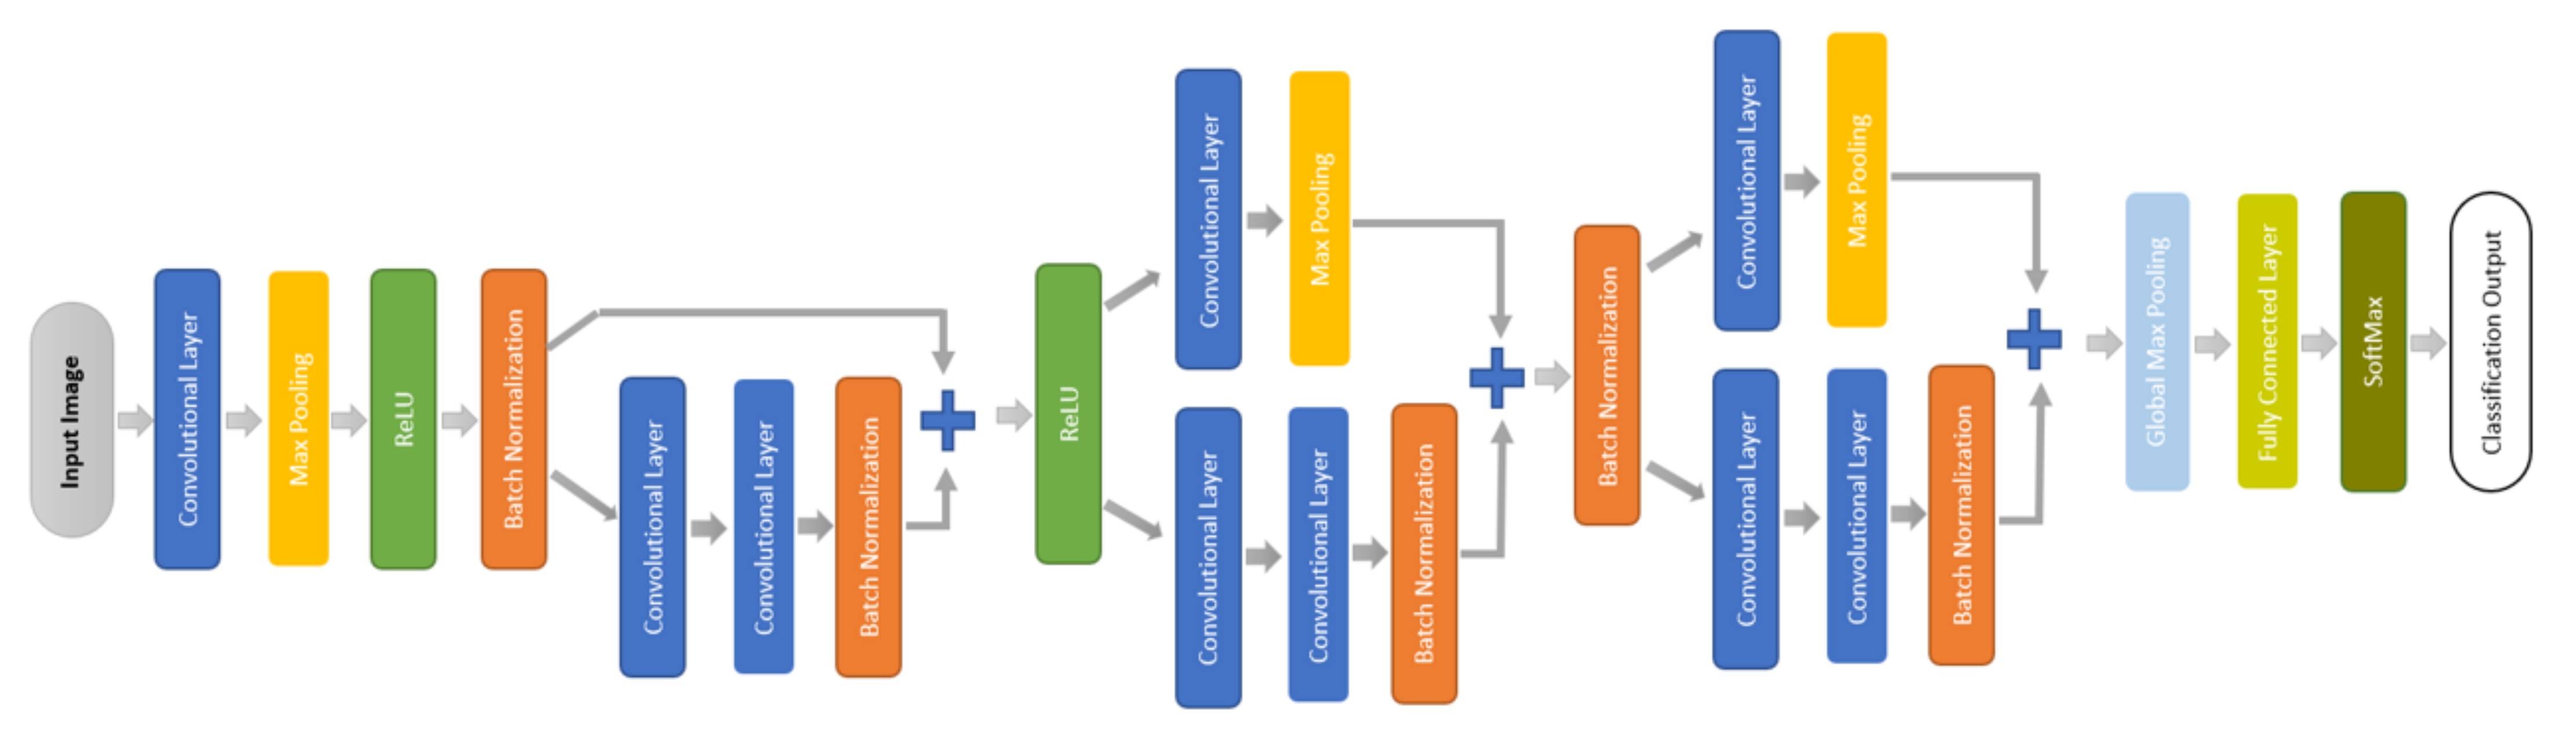
- A small convolutional network (CNN) is designed to learn less complex decision boundaries in the transferred domain to achieve better generalization capability and at the same time to avoid overfitting.
- This study investigates the effects of different types of segments of ECG signal, such as fixed-length, variable-length, blind, and feature-dependent segments, on the deep learning-based ECG recognition process.
- The effectiveness of the short segment is also investigated, using a multisession database to ensure its viability in biometric recognition over time. The viability of a short segment can help to develop a robust, reliable, and acceptable authentication system. It can also make this modality practical to fuse with other modalities, especially the fingerprint, to improve the robustness and security of biometrics in general [25,31].
2. Related Works
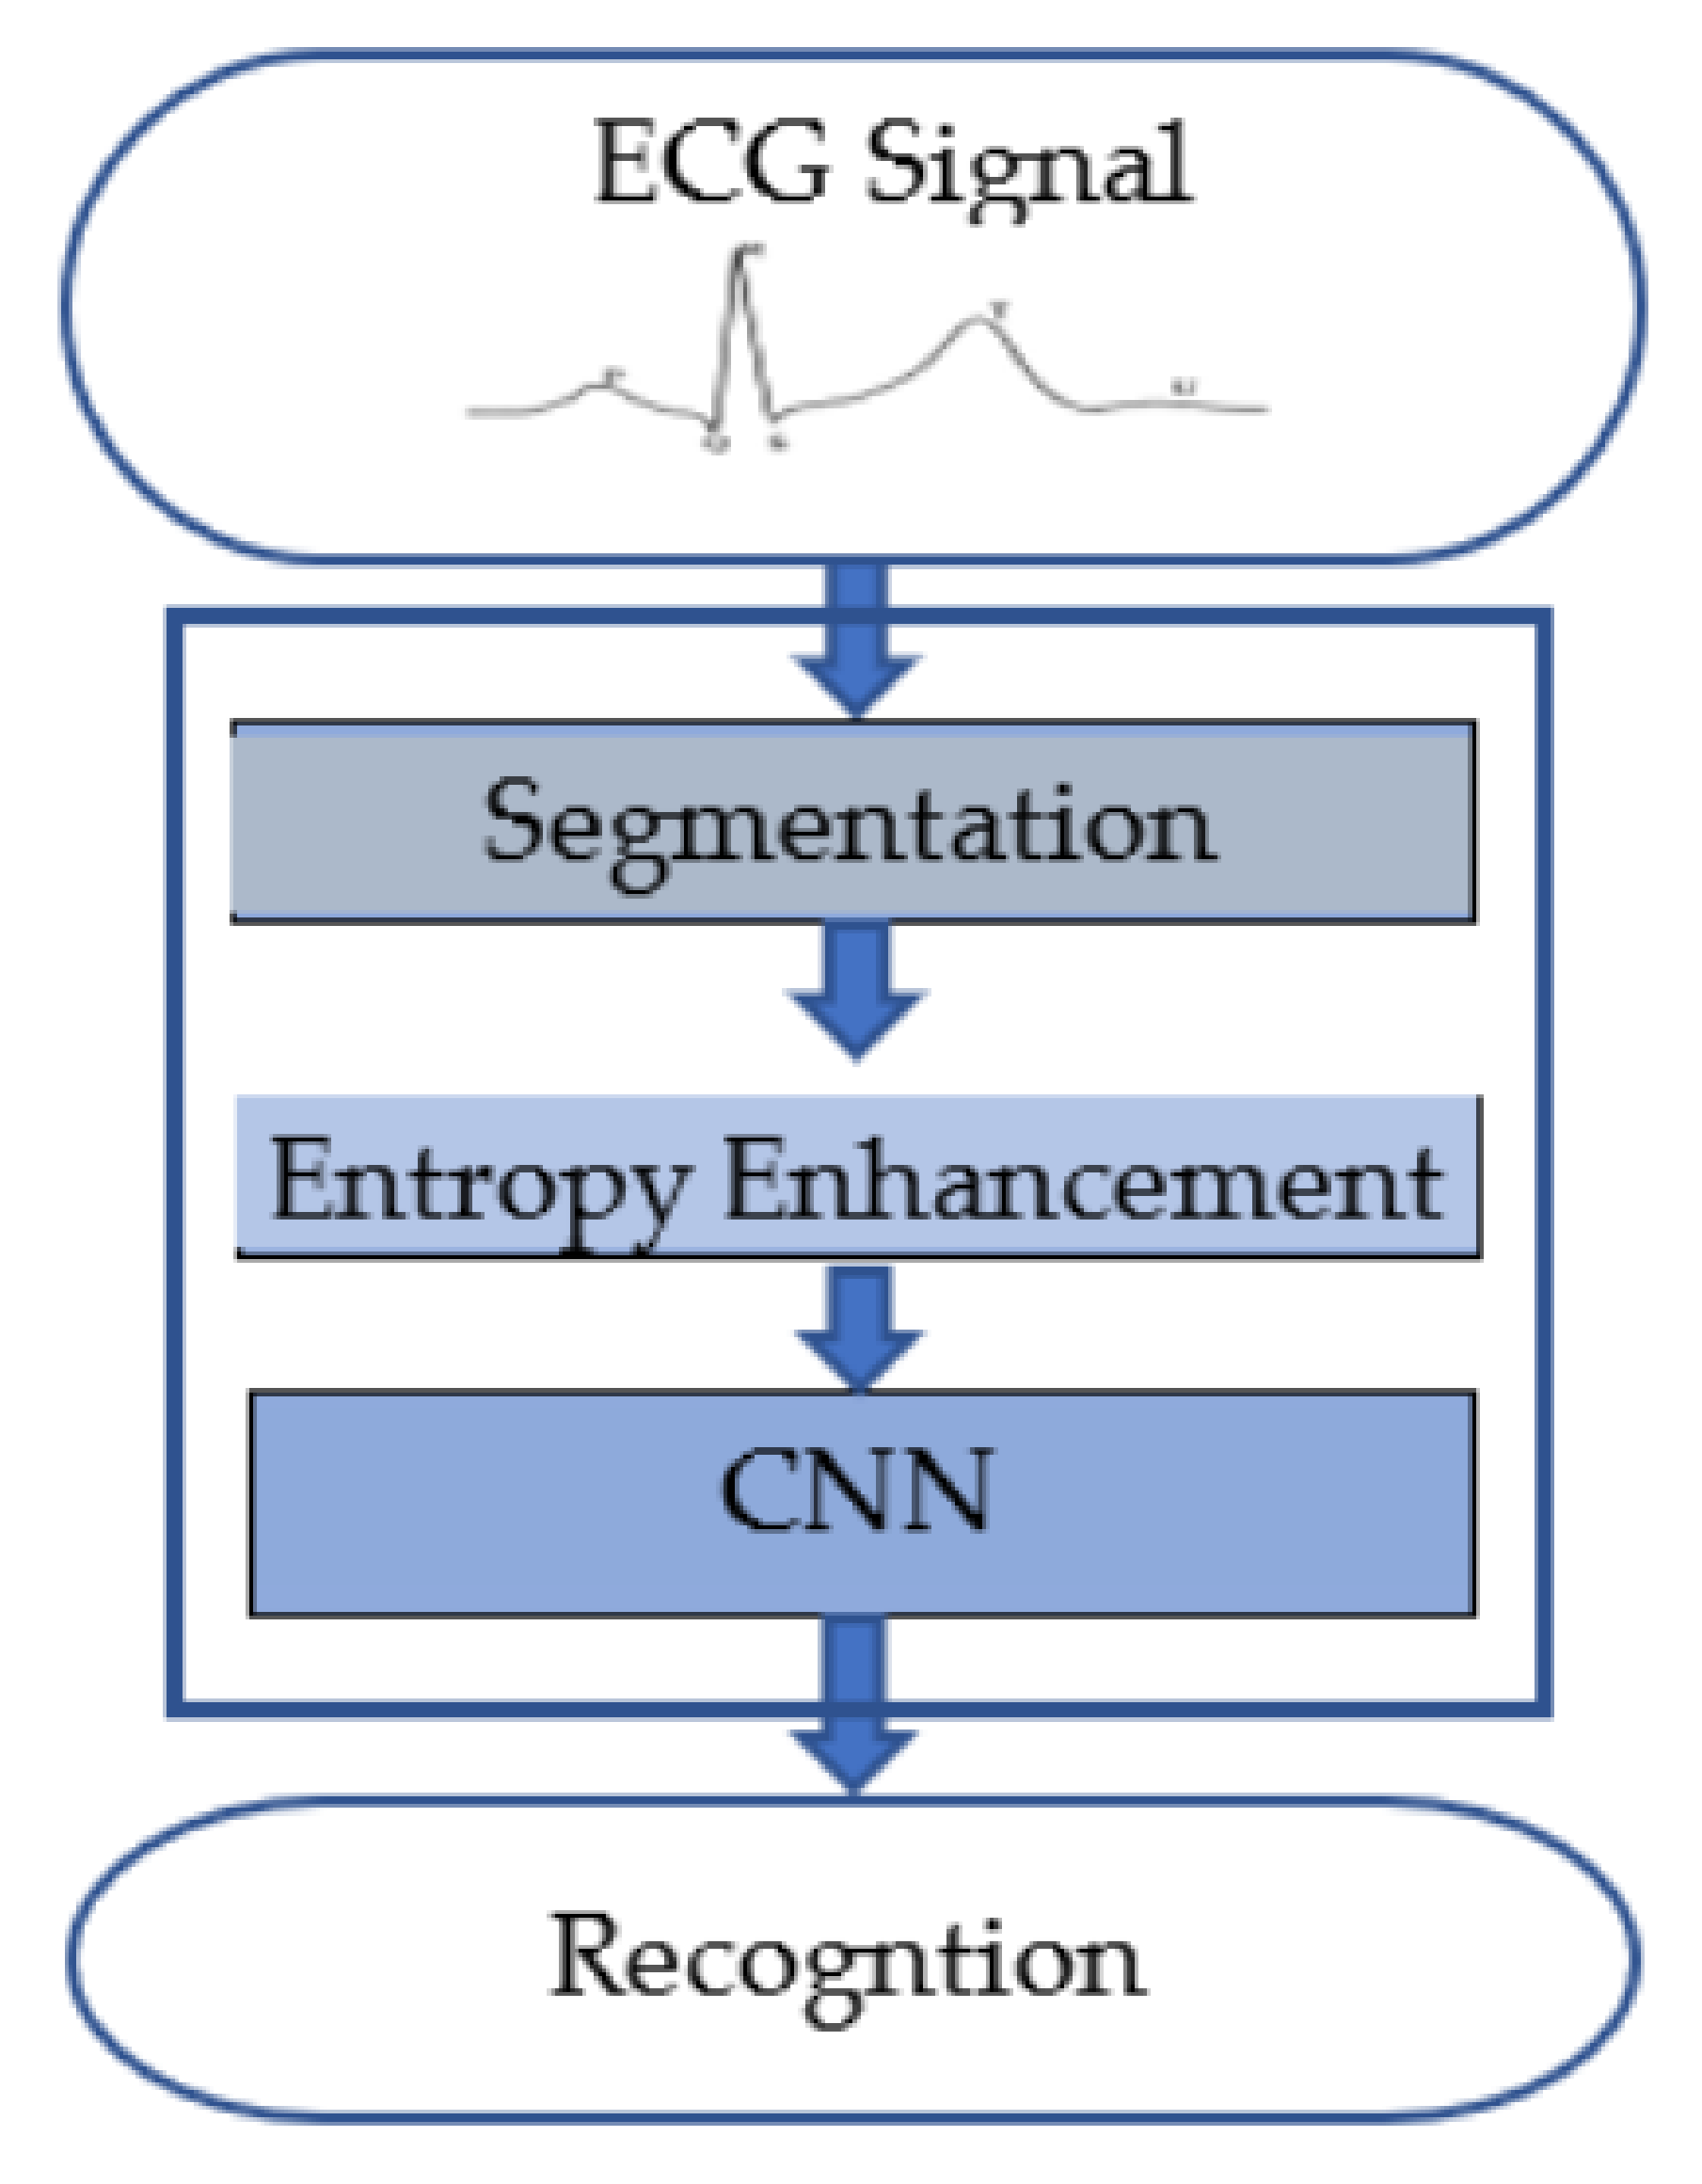
3. Method
3.1. Segmentation of an ECG Signal
3.2. Entropy Enhancement
3.3. Deep Learning
4. Experiments
4.1. Datasets
4.2. Equipment
- Intel® Core i5-8600K CPU @ 3.60 GHz 6-core machine;
- 240 GB of DDR4 RAM;
- One GTX 1080 Ti GAMING OC 11 GB.
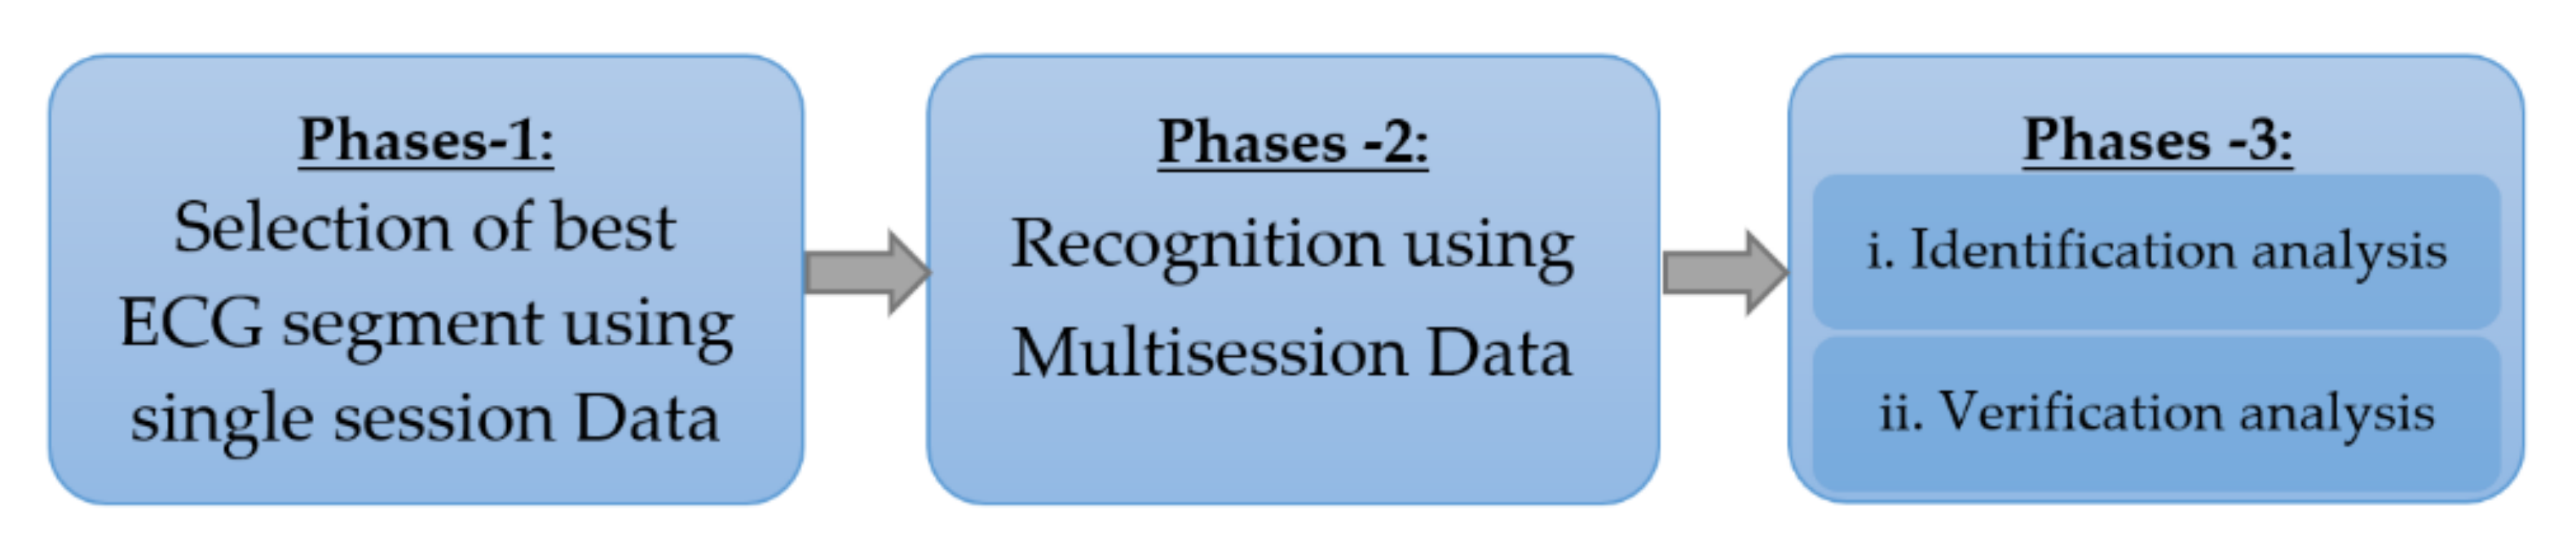
4.3. Experimental Protocol
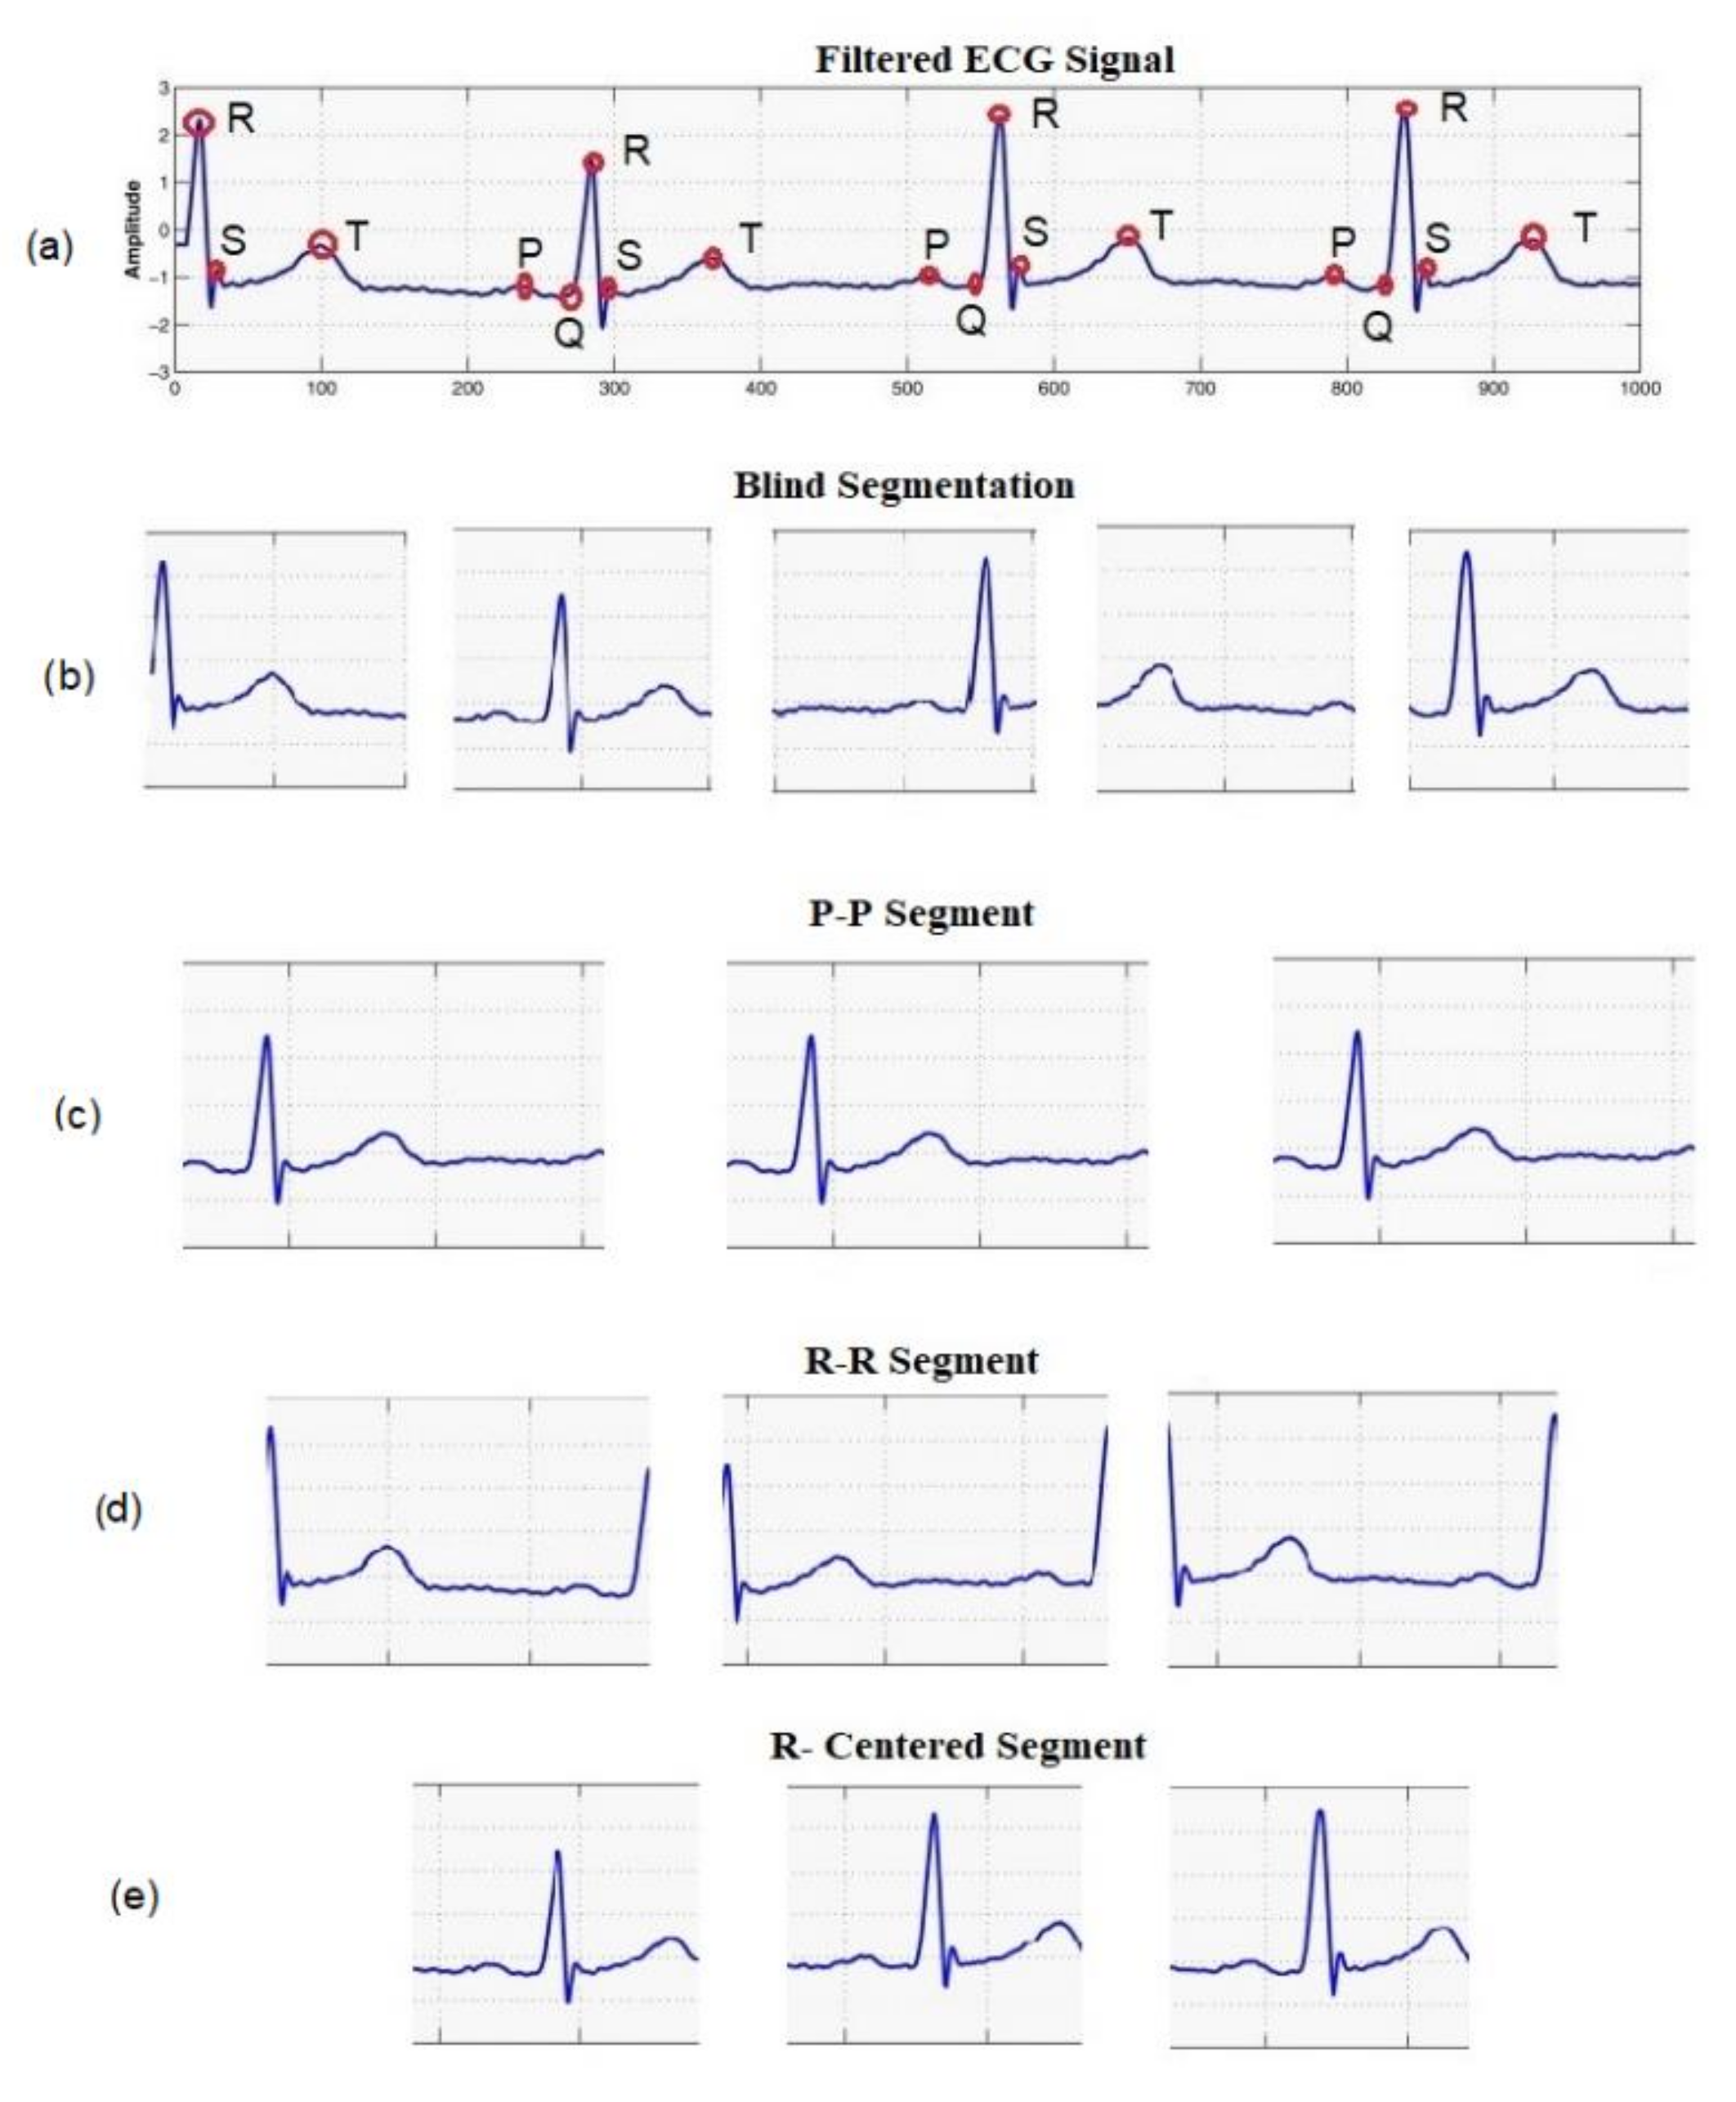
- Blind segmentation: A preprocessed signal is blindly divided into segments of equal durations. To examine the effect of different segment sizes, we performed segmentation with different window sizes, such as 0.5, 1, 1.5, 2, 2.5, and 3 s.
- Heartbeat segmentation: An ECG record is divided into segments based on different fiducial points, such as the P- and R-peaks in the QRS complex, producing the (i) R-centered segment, (ii) R-R segment, and (iii) P-P segment. We divided the signal using three different window sizes, 0.5, 0.75, and 1 s, around each R-peak in the R-centered segment. To balance the samples, only subjects in which the P-peak was detectable were considered in this phase. We selected 100 records with a detectable P-peak.
- Single session: To support the findings of phase-1 and to compare with other methods (using single-session data only), we used one record of each subject from ECG-ID in this scenario and divided them into training and test sets.
- Mixed session: We collected segments from ECG signals in different sessions and mixed them together before dividing them into training and test sets.
- Multisession: The training and test segments were collected from ECG signals in different sessions without mixing them. In the ECG-ID dataset, all subjects have at least two records, except subject 74. For subject 74, we used the same record for both sessions, but the segments were randomly divided into training and test segments. This resulted in 90 classifiable subjects.
4.4. Network Training and Testing
4.5. Evaluation
5. Results and Discussion
5.1. Effect of Length and Segmentation of Signal on Classification Performance
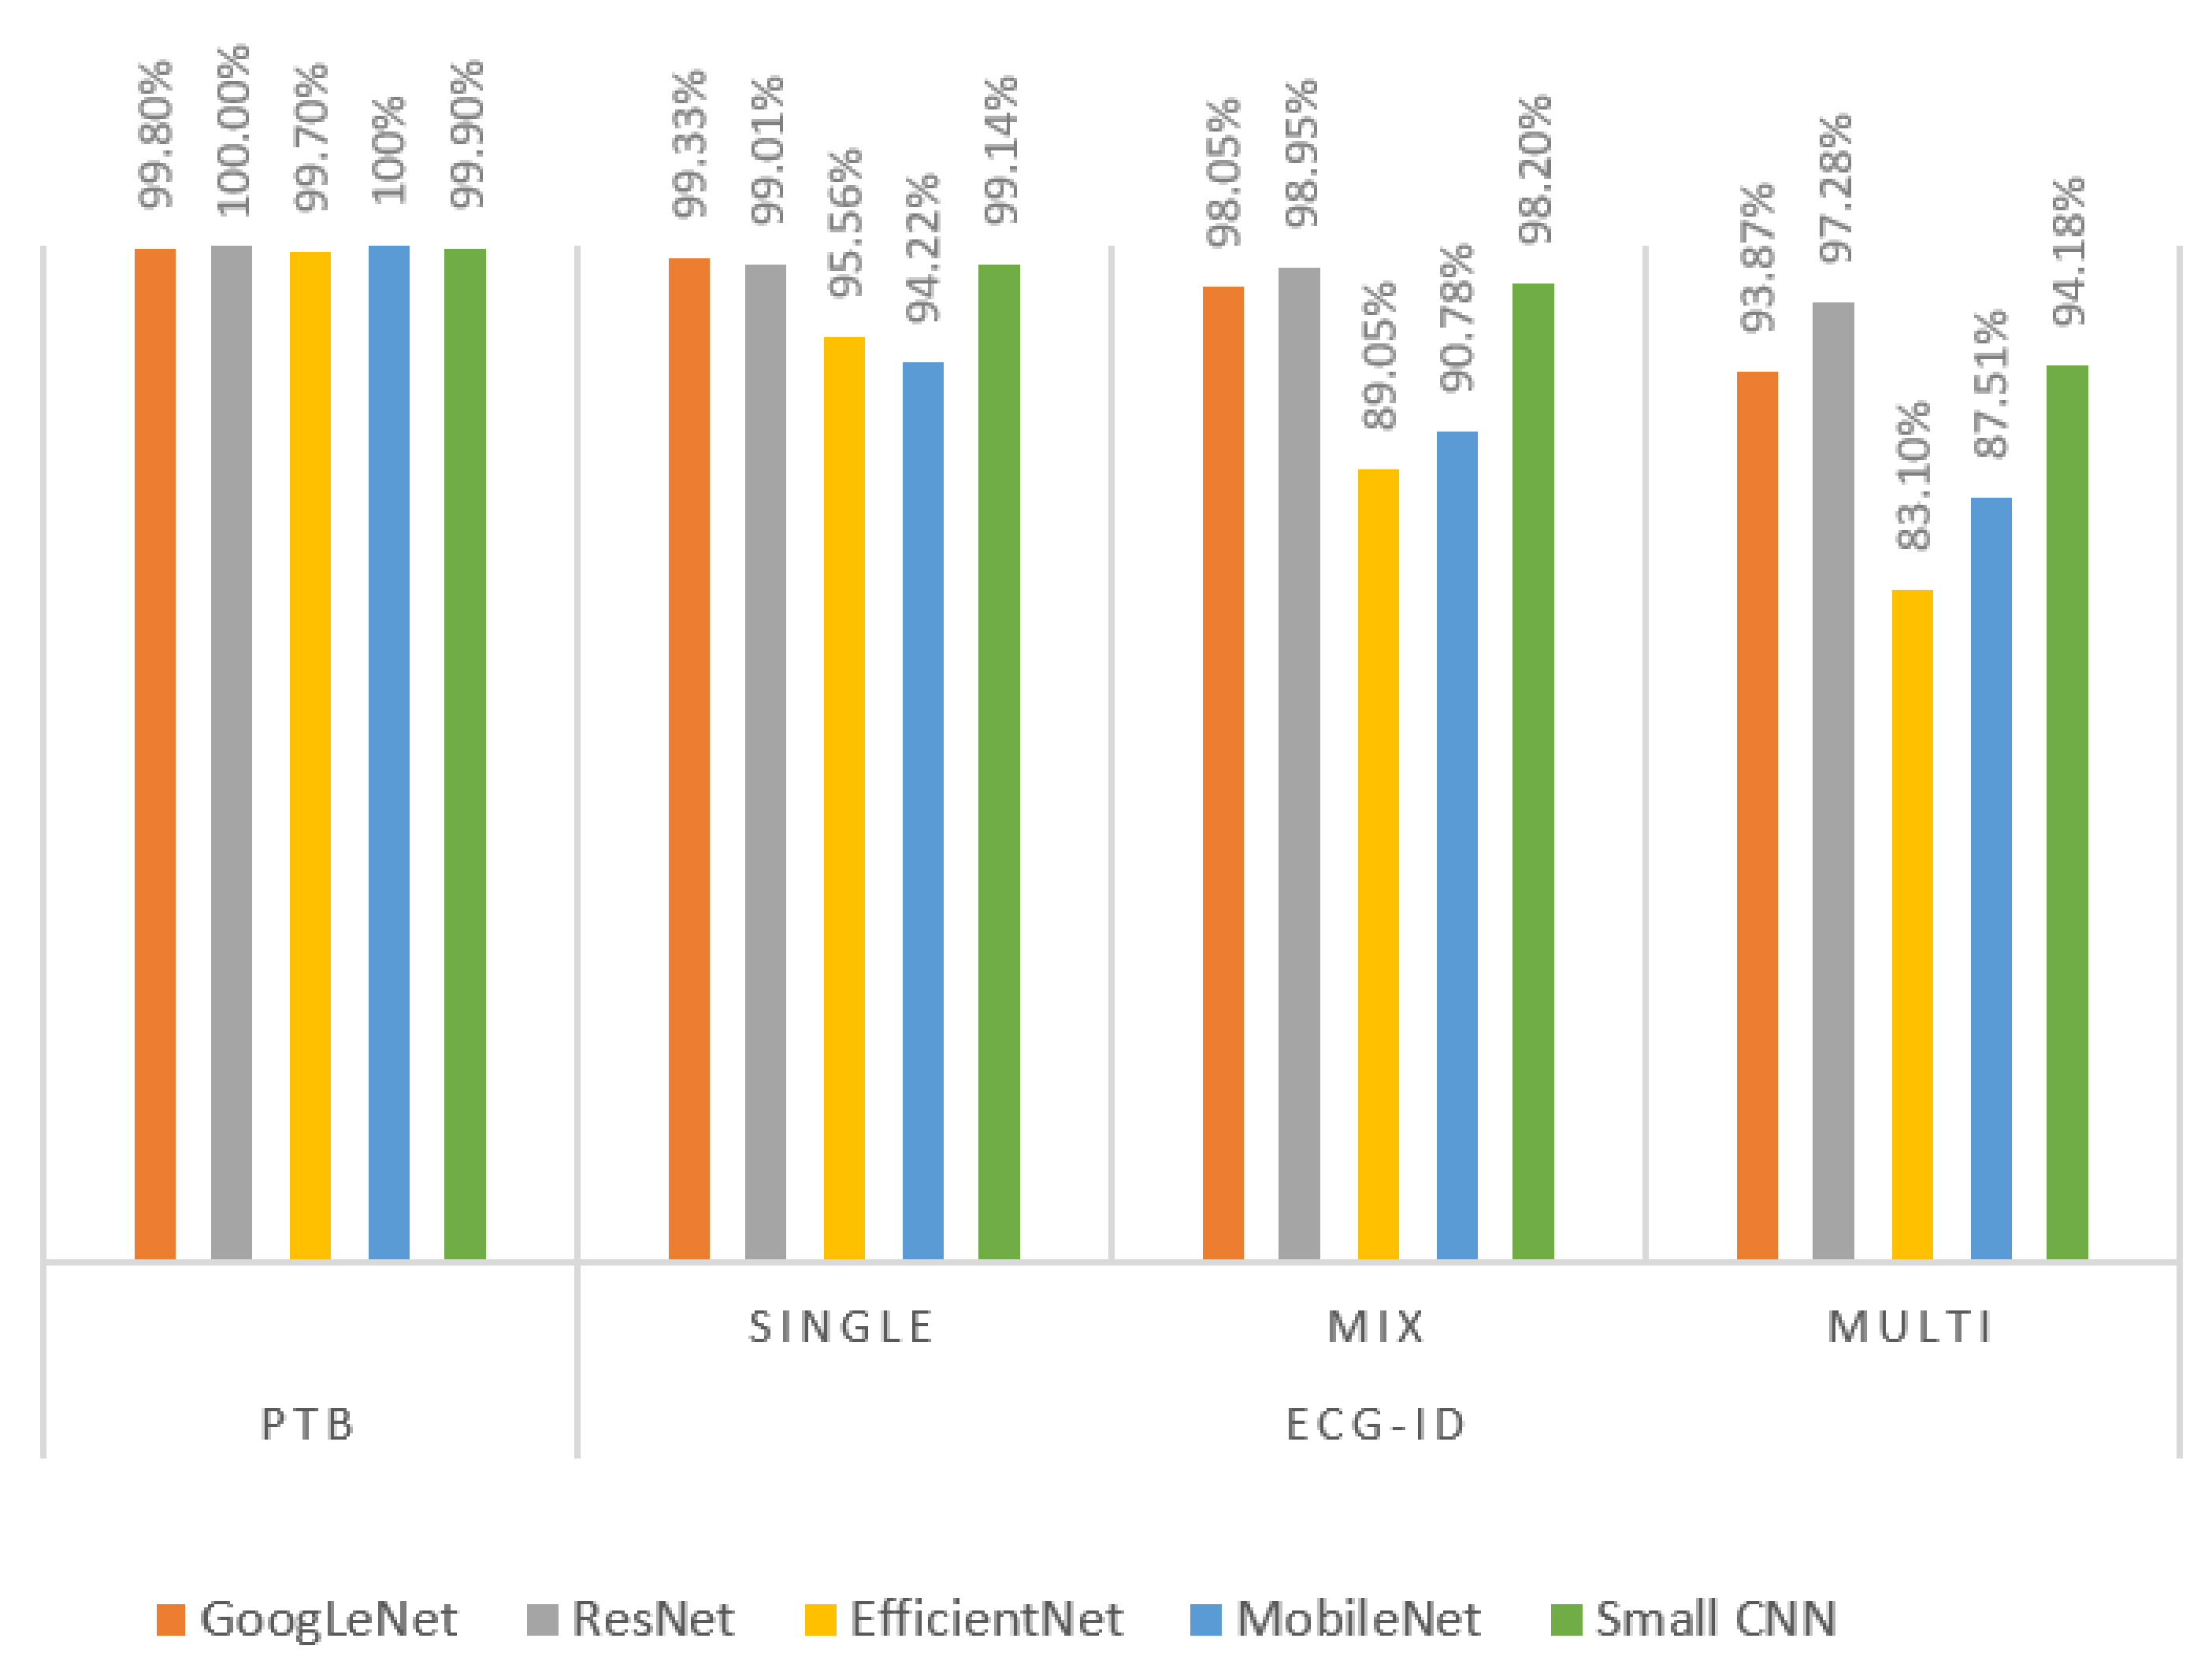
5.2. Biometric Recognition with Multisession Data
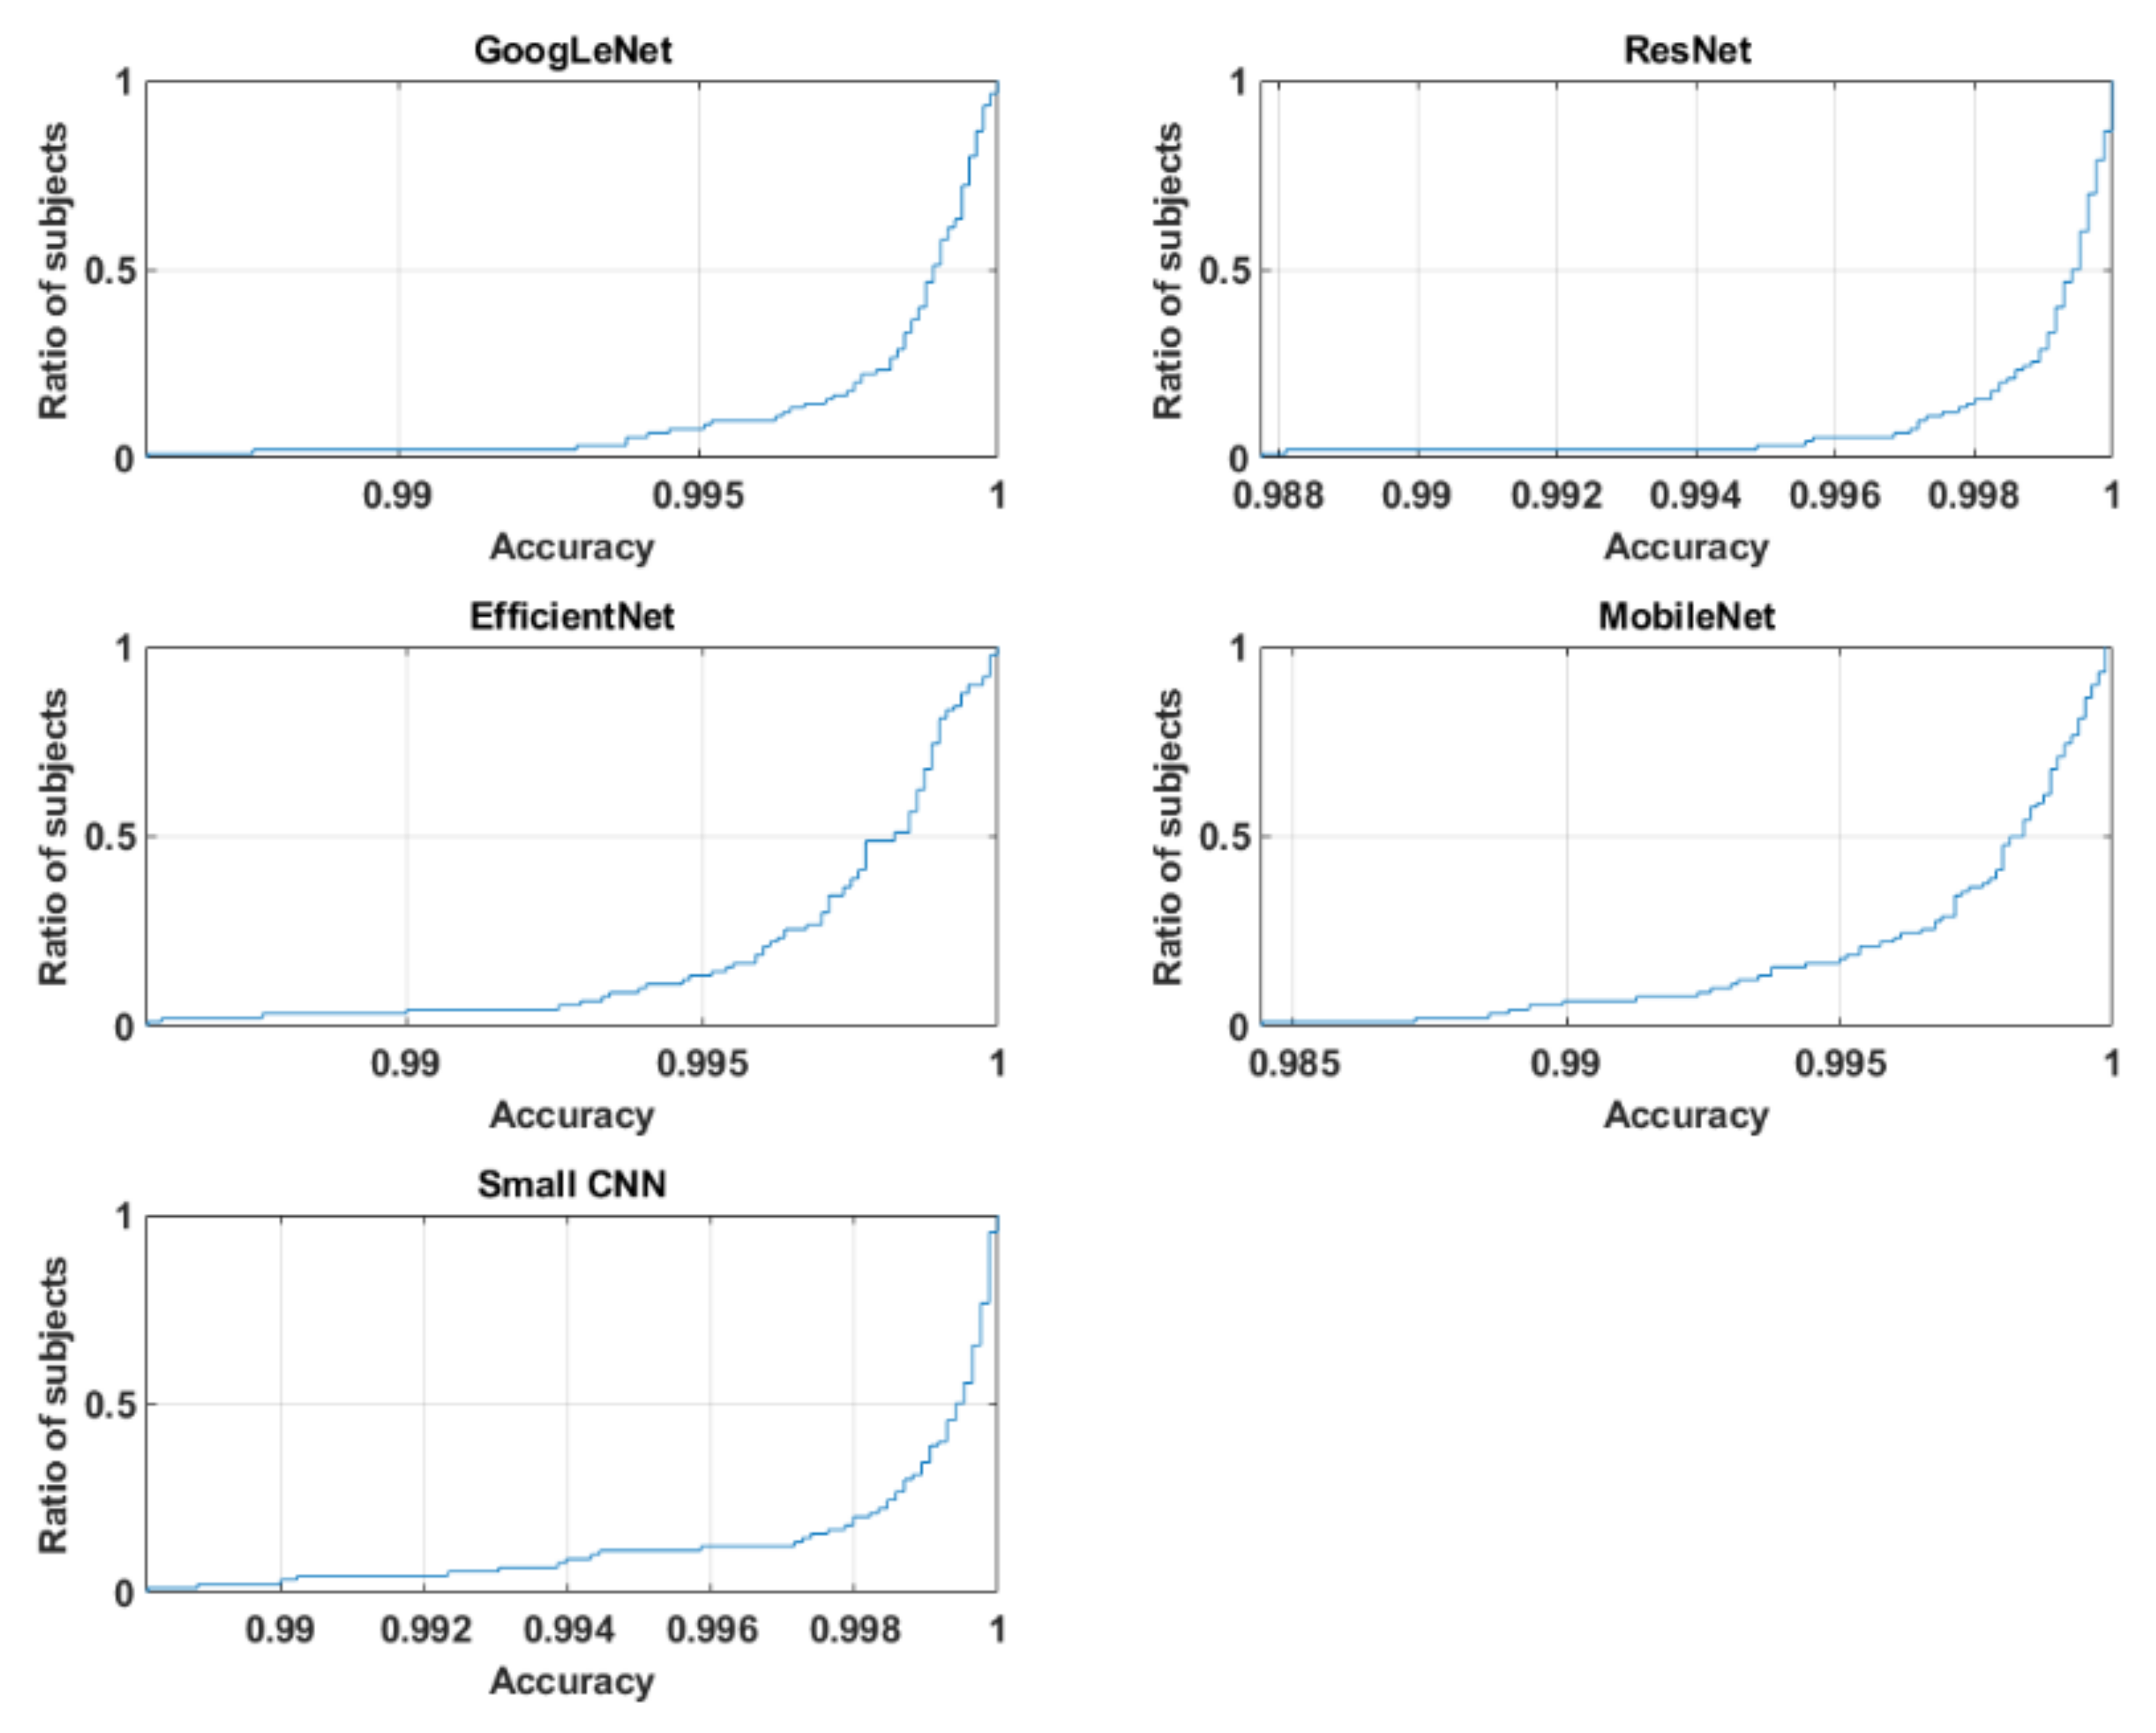
5.3. Analysis of Identification and Verification Performance for Multisession Data
5.4. Comparison with State-of-the-Art Methods
6. Conclusions
Author Contributions
Funding
Institutional Review Board Statement
Informed Consent Statement
Data Availability Statement
Conflicts of Interest
References
- Jalali, A.; Mallipeddi, R.; Lee, M. Sensitive Deep Convolutional Neural Network for Face Recognition at Large Standoffs with Small Dataset. Expert Syst. Appl. 2017, 87, 304–315. [Google Scholar] [CrossRef]
- Yu, Y.-F.; Dai, D.-Q.; Ren, C.-X.; Huang, K.-K. Discriminative Multi-Scale Sparse Coding for Single-Sample Face Recognition with Occlusion. Pattern Recognit. 2017, 66, 302–312. [Google Scholar] [CrossRef]
- Yang, W.; Wang, S.; Hu, J.; Zheng, G.; Valli, C. A Fingerprint and Finger-Vein Based Cancelable Multi-Biometric System. Pattern Recognit. 2018, 78, 242–251. [Google Scholar] [CrossRef]
- Lin, C.-H.; Chen, J.-L.; Tseng, C.Y. Optical Sensor Measurement and Biometric-Based Fractal Pattern Classifier for Fingerprint Recognition. Expert Syst. Appl. 2011, 38, 5081–5089. [Google Scholar] [CrossRef]
- Chevtchenko, S.F.; Vale, R.F.; Macario, V. Multi-Objective Optimization for Hand Posture Recognition. Expert Syst. Appl. 2018, 92, 170–181. [Google Scholar] [CrossRef]
- Ahmed, M.; Rasool, A.G.; Afzal, H.; Siddiqi, I. Improving Handwriting Based Gender Classification Using Ensemble Classifiers. Expert Syst. Appl. 2017, 85, 158–168. [Google Scholar] [CrossRef]
- He, S.; Schomaker, L. Deep Adaptive Learning for Writer Identification Based on Single Handwritten Word Images. Pattern Recognit. 2019, 88, 64–74. [Google Scholar] [CrossRef]
- Umer, S.; Sardar, A.; Dhara, B.C.; Rout, R.K.; Pandey, H.M. Person Identification Using Fusion of Iris and Periocular Deep Features. Neural Netw. 2020, 122, 407–419. [Google Scholar] [CrossRef] [PubMed]
- Varkarakis, V.; Bazrafkan, S.; Corcoran, P. Deep Neural Network and Data Augmentation Methodology for Off-Axis Iris Segmentation in Wearable Headsets. Neural Netw. 2020, 121, 101–121. [Google Scholar] [CrossRef]
- Das, S.; Muhammad, K.; Bakshi, S.; Mukherjee, I.; Sa, P.K.; Sangaiah, A.K.; Bruno, A. Lip Biometric Template Security Framework Using Spatial Steganography. Pattern Recognit. Lett. 2019, 126, 102–110. [Google Scholar] [CrossRef]
- Huang, Z.; Siniscalchi, S.M.; Lee, C.-H. Hierarchical Bayesian Combination of Plug-in Maximum a Posteriori Decoders in Deep Neural Networks-Based Speech Recognition and Speaker Adaptation. Pattern Recognit. Lett. 2017, 98, 1–7. [Google Scholar] [CrossRef]
- Jain, A.; Kanhangad, V. Gender Classification in Smartphones Using Gait Information. Expert Syst. Appl. 2018, 93, 257–266. [Google Scholar] [CrossRef]
- Ben, X.; Zhang, P.; Lai, Z.; Yan, R.; Zhai, X.; Meng, W. A General Tensor Representation Framework for Cross-View Gait Recognition. Pattern Recognit. 2019, 90, 87–98. [Google Scholar] [CrossRef]
- Standard, I. Information Technology—Biometric Presentation Attack Detection—Part 1: Framework; ISO: Geneva, Switzerland, 2016. [Google Scholar]
- Damaševičius, R.; Maskeliūnas, R.; Kazanavičius, E.; Woźniak, M. Combining Cryptography with EEG Biometrics. Comput. Intell. Neurosci. 2018, 2018, 1–11. [Google Scholar] [CrossRef]
- Goshvarpour, A.; Goshvarpour, A. Automatic EEG Classification during Rapid Serial Visual Presentation Task by a Novel Method Based on Dual-Tree Complex Wavelet Transform and Poincare Plot Indices. Biomed. Phys. Eng. Express 2018, 4, 065022. [Google Scholar] [CrossRef]
- Wu, S.-C.; Hung, P.-L.; Swindlehurst, A.L. ECG Biometric Recognition: Unlinkability, Irreversibility and Security. IEEE Internet Things J. 2021, 8, 487–500. [Google Scholar] [CrossRef]
- Srivastva, R.; Singh, A.; Singh, Y.N. PlexNet: A Fast and Robust ECG Biometric System for Human Recognition. Inf. Sci. 2021, 558, 208–228. [Google Scholar] [CrossRef]
- Islam, M.S.; Alajlan, N.; Bazi, Y.; Hichri, H.S. HBS: A Novel Biometric Feature Based on Heartbeat Morphology. IEEE Trans. Inf. Technol. Biomed. 2012, 16, 445–453. [Google Scholar] [CrossRef]
- Islam, M.S.; Alajlan, N. Biometric Template Extraction from a Heartbeat Signal Captured from Fingers. Multimed. Tools Appl. 2017, 76, 12709–12733. [Google Scholar] [CrossRef]
- AlDuwaile, D.; Islam, M.S. Single Heartbeat ECG Biometric Recognition Using Convolutional Neural Network. In Proceedings of the 2020 International Conference on Advanced Science and Engineering (ICOASE), Kurdistan, Iraq, 23–24 December 2020. [Google Scholar]
- Tripathi, K.P. A Comparative Study of Biometric Technologies with Reference to Human Interface. Int. J. Comput. Appl. 2011, 14, 10–15. [Google Scholar] [CrossRef]
- Nguyen, K.; Fookes, C.; Sridharan, S.; Tistarelli, M.; Nixon, M. Super-Resolution for Biometrics: A Comprehensive Survey. Pattern Recognit. 2018, 78, 23–42. [Google Scholar] [CrossRef]
- Labati, R.D.; Muñoz, E.; Piuri, V.; Sassi, R.; Scotti, F. Deep-ECG: Convolutional Neural Networks for ECG Biometric Recognition. Pattern Recognit. Lett. 2019, 126, 78–85. [Google Scholar] [CrossRef]
- M Jomaa, R.; Mathkour, H.; Bazi, Y.; Islam, M.S. End-to-End Deep Learning Fusion of Fingerprint and Electrocardiogram Signals for Presentation Attack Detection. Sensors 2020, 20, 2085. [Google Scholar] [CrossRef] [PubMed]
- Islam, S.; Ammour, N.; Alajlan, N.; Abdullah-Al-Wadud, M. Selection of Heart-Biometric Templates for Fusion. IEEE Access 2017, 5, 1753–1761. [Google Scholar] [CrossRef]
- Ranjan, A. Permanence of Ecg Biometric: Experiments Using Convolutional Neural Networks. In Proceedings of the 2019 International Conference on Biometrics (ICB), Houston, TX, USA, 28 September–1 October 2019; pp. 1–6. [Google Scholar]
- Pinto, J.R.; Cardoso, J.S.; Lourenço, A. Evolution, Current Challenges, and Future Possibilities in ECG Biometrics. IEEE Access 2018, 6, 34746–34776. [Google Scholar] [CrossRef]
- Goldberger, A.L.; Amaral, L.A.; Glass, L.; Hausdorff, J.M.; Ivanov, P.C.; Mark, R.G.; Mietus, J.E.; Moody, G.B.; Peng, C.-K.; Stanley, H.E. PhysioBank, PhysioToolkit, and PhysioNet: Components of a New Research Resource for Complex Physiologic Signals. Circulation 2000, 101, e215–e220. [Google Scholar] [CrossRef] [PubMed]
- Lugovaya, T.S. Biometric Human Identification Based on Electrocardiogram. Master’s Thesis, Faculty of Computing Technologies and Informatics, Electrotechnical University “LETI”, Saint Petersburg, Russia, June 2005. [Google Scholar]
- Alajlan, N.; Islam, M.S.; Ammour, N. Fusion of Fingerprint and Heartbeat Biometrics Using Fuzzy Adaptive Genetic Algorithm. In Proceedings of the World Congress on Internet Security (WorldCIS-2013), London, UK, 9–12 December 2013; pp. 76–81. [Google Scholar]
- Hong, P.-L.; Hsiao, J.-Y.; Chung, C.-H.; Feng, Y.-M.; Wu, S.-C. ECG Biometric Recognition: Template-Free Approaches Based on Deep Learning. In Proceedings of the 2019 41st Annual International Conference of the IEEE Engineering in Medicine and Biology Society (EMBC), Berlin, Germany, 23–27 July 2019; pp. 2633–2636. [Google Scholar]
- Liu, J.; Yin, L.; He, C.; Wen, B.; Hong, X.; Li, Y. A Multiscale Autoregressive Model-Based Electrocardiogram Identification Method. IEEE Access 2018, 6, 18251–18263. [Google Scholar] [CrossRef]
- Paiva, J.S.; Dias, D.; Cunha, J.P. Beat-ID: Towards a Computationally Low-Cost Single Heartbeat Biometric Identity Check System Based on Electrocardiogram Wave Morphology. PLoS ONE 2017, 12, e0180942. [Google Scholar] [CrossRef] [PubMed]
- Salloum, R.; Kuo, C.-C.J. ECG-Based Biometrics Using Recurrent Neural Networks. In Proceedings of the 2017 IEEE International Conference on Acoustics, Speech and Signal Processing (ICASSP), New Orleans, LA, USA, 5–9 March 2017; pp. 2062–2066. [Google Scholar]
- Zhang, Q.; Zhou, D.; Zeng, X. HeartID: A Multiresolution Convolutional Neural Network for ECG-Based Biometric Human Identification in Smart Health Applications. IEEE Access 2017, 5, 11805–11816. [Google Scholar] [CrossRef]
- Zhao, Z.; Zhang, Y.; Deng, Y.; Zhang, X. ECG Authentication System Design Incorporating a Convolutional Neural Network and Generalized S-Transformation. Comput. Biol. Med. 2018, 102, 168–179. [Google Scholar] [CrossRef]
- Da Silva Luz, E.J.; Moreira, G.J.; Oliveira, L.S.; Schwartz, W.R.; Menotti, D. Learning Deep Off-the-Person Heart Biometrics Representations. IEEE Trans. Inf. Forensics Secur. 2017, 13, 1258–1270. [Google Scholar] [CrossRef]
- Li, Y.; Pang, Y.; Wang, K.; Li, X. Toward Improving ECG Biometric Identification Using Cascaded Convolutional Neural Networks. Neurocomputing 2020, 391, 83–95. [Google Scholar] [CrossRef]
- Kim, J.S.; Kim, S.H.; Pan, S.B. Personal Recognition Using Convolutional Neural Network with ECG Coupling Image. J. Ambient Intell. Humaniz. Comput. 2020, 11, 1923–1932. [Google Scholar] [CrossRef]
- Choi, H.-S.; Lee, B.; Yoon, S. Biometric Authentication Using Noisy Electrocardiograms Acquired by Mobile Sensors. IEEE Access 2016, 4, 1266–1273. [Google Scholar] [CrossRef]
- Plataniotis, K.N.; Hatzinakos, D.; Lee, J.K. ECG Biometric Recognition without Fiducial Detection. In Proceedings of the 2006 Biometrics Symposium: Special Session on Research at the Biometric Consortium Conference, Baltimore, MD, USA, 19–21 September 2006; pp. 1–6. [Google Scholar]
- Krasteva, V.; Jekova, I.; Abächerli, R. Biometric Verification by Cross-Correlation Analysis of 12-Lead ECG Patterns: Ranking of the Most Reliable Peripheral and Chest Leads. J. Electrocardiol. 2017, 50, 847–854. [Google Scholar] [CrossRef]
- Pinto, J.R.; Cardoso, J.S.; Lourenço, A.; Carreiras, C. Towards a Continuous Biometric System Based on ECG Signals Acquired on the Steering Wheel. Sensors 2017, 17, 2228. [Google Scholar] [CrossRef]
- Wahabi, S.; Pouryayevali, S.; Hari, S.; Hatzinakos, D. On Evaluating ECG Biometric Systems: Session-Dependence and Body Posture. IEEE Trans. Inf. Forensics Secur. 2014, 9, 2002–2013. [Google Scholar] [CrossRef]
- Tan, R.; Perkowski, M. Toward Improving Electrocardiogram (ECG) Biometric Verification Using Mobile Sensors: A Two-Stage Classifier Approach. Sensors 2017, 17, 410. [Google Scholar] [CrossRef] [PubMed]
- Komeili, M.; Louis, W.; Armanfard, N.; Hatzinakos, D. Feature Selection for Nonstationary Data: Application to Human Recognition Using Medical Biometrics. IEEE Trans. Cybern. 2017, 48, 1446–1459. [Google Scholar] [CrossRef]
- Zhai, X.; Tin, C. Automated ECG Classification Using Dual Heartbeat Coupling Based on Convolutional Neural Network. IEEE Access 2018, 6, 27465–27472. [Google Scholar] [CrossRef]
- Ihsanto, E.; Ramli, K.; Sudiana, D.; Gunawan, T.S. Fast and Accurate Algorithm for ECG Authentication Using Residual Depthwise Separable Convolutional Neural Networks. Appl. Sci. 2020, 10, 3304. [Google Scholar] [CrossRef]
- Bento, N.; Belo, D.; Gamboa, H. ECG Biometrics Using Spectrograms and Deep Neural Networks. Int. J. Mach. Learn. Comput 2019, 10, 259–264. [Google Scholar] [CrossRef]
- Lynn, H.M.; Pan, S.B.; Kim, P. A Deep Bidirectional GRU Network Model for Biometric Electrocardiogram Classification Based on Recurrent Neural Networks. IEEE Access 2019, 7, 145395–145405. [Google Scholar] [CrossRef]
- Chu, Y.; Shen, H.; Huang, K. ECG Authentication Method Based on Parallel Multi-Scale One-Dimensional Residual Network with Center and Margin Loss. IEEE Access 2019, 7, 51598–51607. [Google Scholar] [CrossRef]
- Islam, M.S.; Alajlan, N. An Efficient QRS Detection Method for ECG Signal Captured from Fingers. In Proceedings of the 2013 IEEE International Conference on Multimedia and Expo Workshops (ICMEW), San Jose, CA, USA, 15–19 July 2013; pp. 1–5. [Google Scholar]
- Islam, M.S.; Alajlan, N. Augmented-Hilbert Transform for Detecting Peaks of a Finger-ECG Signal. In Proceedings of the 2014 IEEE Conference on Biomedical Engineering and Sciences (IECBES), Sarawak, Malaysia, 8–10 December 2014; pp. 864–867. [Google Scholar]
- Takahashi, K.; Murakami, T. A Measure of Information Gained through Biometric Systems. Image Vis. Comput. 2014, 32, 1194–1203. [Google Scholar] [CrossRef]
- Jomaa, R.M.; Islam, M.S.; Mathkour, H. Enhancing the Information Content of Fingerprint Biometrics with Heartbeat Signal. In Proceedings of the 2015 World Symposium on Computer Networks and Information Security (WSCNIS), Hammamet, Tunisia, 19–21 September 2015; pp. 1–5. [Google Scholar]
- Byeon, Y.-H.; Pan, S.-B.; Kwak, K.-C. Intelligent Deep Models Based on Scalograms of Electrocardiogram Signals for Biometrics. Sensors 2019, 19, 935. [Google Scholar] [CrossRef] [PubMed]
- Sukiennik, P.; Białasiewicz, J.T. Cross-Correlation of Bio-Signals Using Continuous Wavelet Transform and Genetic Algorithm. J. Neurosci. Methods 2015, 247, 13–22. [Google Scholar] [CrossRef]
- Pan, S.J.; Yang, Q. A Survey on Transfer Learning. IEEE Trans. Knowl. Data Eng. 2009, 22, 1345–1359. [Google Scholar] [CrossRef]
- Szegedy, C.; Liu, W.; Jia, Y.; Sermanet, P.; Reed, S.; Anguelov, D.; Erhan, D.; Vanhoucke, V.; Rabinovich, A. Going Deeper with Convolutions. In Proceedings of the IEEE Conference on Computer Vision and Pattern Recognition, Boston, MA, USA, 7–12 June 2015; pp. 1–9. [Google Scholar]
- He, K.; Zhang, X.; Ren, S.; Sun, J. Deep Residual Learning for Image Recognition. In Proceedings of the IEEE Conference on Computer Vision and Pattern Recognition, Las Vegas, NV, USA, 27–30 June 2016; pp. 770–778. [Google Scholar]
- Tan, M.; Le, Q. Efficientnet: Rethinking Model Scaling for Convolutional Neural Networks. In Proceedings of the International Conference on Machine Learning, Long Beach, CA, USA, 9–15 June 2019; pp. 6105–6114. [Google Scholar]
- Howard, A.G.; Zhu, M.; Chen, B.; Kalenichenko, D.; Wang, W.; Weyand, T.; Andreetto, M.; Adam, H. Mobilenets: Efficient Convolutional Neural Networks for Mobile Vision Applications. arXiv 2017, arXiv:1704.04861. [Google Scholar]
- Gui, Q.; Jin, Z.; Xu, W. Exploring EEG-Based Biometrics for User Identification and Authentication. In Proceedings of the 2014 IEEE Signal Processing in Medicine and Biology Symposium (SPMB), Philadelphia, PA, USA, 13 December 2014; pp. 1–6. [Google Scholar]
- Jomaa, R.M.; Islam, M.S.; Mathkour, H. Improved Sequential Fusion of Heart-Signal and Fingerprint for Anti-Spoofing. In Proceedings of the 2018 IEEE 4th International Conference on Identity, Security, and Behavior Analysis (ISBA), Marina Square, Singapore, 10–12 January 2018; pp. 1–7. [Google Scholar]
- Islam, M.S.; Alajlan, N. Model-Based Alignment of Heartbeat Morphology for Enhancing Human Recognition Capability. Comput. J. 2015, 58, 2622–2635. [Google Scholar] [CrossRef]
- Islam, M.S.; Alajlan, N.; Malek, S. Resampling of ECG Signal for Improved Morphology Alignment. Electron. Lett. 2012, 48, 427–429. [Google Scholar] [CrossRef]


| RefeRence | Dataset | Subjects | Segmentation | Classification | Performance | |
|---|---|---|---|---|---|---|
| Type | Length | |||||
| [32] | PTB | 200 | HB | 0.66 s | CNN | Acc = 97.84% |
| [24] | PTB | 52 | Blind | 10 s | CNN | Acc = 100% |
| [36] | CEBSDB | 20 | Blind | 2 s | CNN | Acc = 99% |
| STDB | 28 | Acc = 90.3% | ||||
| MI-BIH | 47 | Acc = 91.1% | ||||
| NSRDB | 18 | Acc = 95.1% | ||||
| AFDB | 23 | Acc = 93.9% | ||||
| WECG | 22 | Acc = 95.5% | ||||
| VFDB | 22 | Acc = 86.6% | ||||
| FANTASIA | 20 | Acc = 97.2% | ||||
| [37] | ECG-ID | 90 | Blind | 3 s | CNN | Acc = 96.63% |
| [38] | CYBHi | 65 | HB | 0.8 s | CNN | EER = 13% |
| UofTDB | 46 | 3.5 s | ||||
| [39] | CEBSDB | 20 | HB | 0.4 s | CNN | Acc = 93.1% |
| NSRDB | 18 | 1.5 s | Acc = 91.4% | |||
| STDB | 28 | 0.5 s | Acc = 92.7% | |||
| AFDB | 23 | 0.8 s | Acc = 89.7% | |||
| FANTASIA | 20 | 0.8 s | Acc = 99.9% | |||
| [27] | Privet | 800 | HB | 3 s | CNN | EER = 2% |
| [41] | Mix (PTB+MIT-BIH) | 175 | Blind | 15 s | SVM | Acc = 95.5% |
| [43] | Privet | 460 | HB | 0.2 s, 1 s | LDA | Acc = 91.6% |
| [34] | PTB | 10 | HB (RR interval) | - | SVM | Acc = 97.45% |
| [47] | TEOAE | 82 | HB | 11 s | SVM | EER = 6.9% |
| [45] | UofTDB | 1019 | HB | 6 s | Euclidean Distance | EER = 5% |
| [44] | Privet | 6 | HB | 0.65 s | SVM | Acc = 94.9% |
| [42] | PTB | 50 | Blind | 10 s | Euclidean Distance | Acc = 100% |
| [46] | MIT-BIH | 47 | HB | 0.5 s | Random Forest | Acc = 98% |
| NSRDB | 18 | 1.6 s | Acc = 99% | |||
| ECG-ID | 90 | 2 s | Acc = 91% | |||
| [50] | FANTASIA | 20 | Blind | 6 s | CNN | Acc = 99.98% |
| ECG-ID (Multi) | 90 | 4 s | Acc = 73% | |||
| ECG-ID (Single) | Acc = 94.23% | |||||
| [40] | PTB | 52 | HB (RR interval) | - | CNN | Acc = 98.45% |
| MIT-BIH | 18 | Acc = 99.2% | ||||
| [51] | ECG-ID | 90 | HB | 0.6 s | GRU | Acc =98.6% |
| MIT-BIH | 47 | 0.5 s | Acc = 98.4% | |||
| [52] | PTB | 52 | HB | 1.2 s | CNN | Acc =100% |
| ECG-ID | 90 | Acc = 98.24% | ||||
| MIT-BIH | 47 | Acc = 95.99% | ||||
| [49] | ECG-ID | 90 | HB | 0.5 s × 8 | CNN | Acc = 100% |
| MIT-BIH | 47 | 0.5 s × 6 | ||||
| [32] | ECG-ID | 89 | HB | 0.5 s × 9 | LSTMGRU | Acc = 100% |
| MIT-BIH | 47 | 0.6 s × 9 | ERR = 3.5% | |||
| [33] | Privet | 140 | HB (RR interval) | - | SVM | Acc = 93.15% |
| PTB | 50 | |||||
| Layer Number | Type | Input Size | Number of Filters | Size of Filters | Stride | Padding |
|---|---|---|---|---|---|---|
| 1 | Image Input | 224 × 224 × 3 | - | - | - | - |
| 2 | Convolution | 224 × 224 × 3 | 32 | 7 × 7 | 1 | 3 |
| 3 | Max Pooling | 224 × 224 × 32 | - | 2 × 2 | 2 | 1 |
| 4 | ReLU | 113 ×1 13 × 32 | - | - | - | - |
| 5 | Batch Normalization | 113 × 113 × 32 | - | - | - | - |
| 6 | Convolution | 113 × 113 × 32 | 32 | 3 × 3 | 1 | 1 |
| 7 | Convolution | 113 × 113 × 32 | 32 | 3 × 3 | 1 | 1 |
| 8 | Batch Normalization | 113 × 113 × 32 | - | - | - | - |
| 9 | Addition | 113 × 113 × 32 | - | - | - | - |
| 10 | ReLU | 113 × 113 × 32 | - | - | - | - |
| 11 | Convolution | 113 × 113 × 32 | 64 | 3 × 3 | 2 | 1 |
| 12 | Convolution | 57 × 57 × 64 | 64 | 3 × 3 | 2 | 1 |
| 13 | Batch Normalization | 29 × 29 × 64 | - | - | - | - |
| 14 | Convolution | 113 × 113 × 32 | 64 | 1 × 1 | 2 | 0 |
| 15 | Max Pooling | 57 × 57 × 64 | - | 2 × 2 | 2 | 1 |
| 16 | Addition | 57 × 57 × 64 | - | - | - | - |
| 17 | Batch Normalization | 57 × 57 × 64 | - | - | - | - |
| 18 | Convolution | 57 × 57 × 64 | 128 | 3 × 3 | 2 | 1 |
| 19 | Convolution | 15 × 15 × 128 | 128 | 3 × 3 | 2 | 1 |
| 20 | Batch Normalization | 8 × 8 × 28 | - | - | - | - |
| 21 | Convolution | 57 × 57 × 64 | 128 | 1 × 1 | 2 | 0 |
| 22 | Max Pooling | 15 × 15 × 128 | - | 2 × 2 | 2 | 1 |
| 23 | Addition | 8 × 8 × 28 | - | - | - | - |
| 24 | Global Max Pooling | 8 × 8 × 28 | ||||
| 25 | Fully Connected | 1 × 1 | Number of Class | - | - | 0 |
| 26 | Softmax | 1 × 1 | Softmax | - | - | - |
| 27 | Classification Output | - | - | - | - | - |
| Network | Number of Layers | Learnable Parameters | Average Training Time |
|---|---|---|---|
| GoogLeNet | 144 | 5.9 M | 132 min |
| ResNet | 71 | 4.8 M | 48 min |
| EfficientNet | 290 | 4.1 M | 112 min |
| MobileNet | 154 | 2.4 M | 53 min |
| Small CNN | 27 | 324 K | 37 min |
| Length of Signal (second) | Accuracy (%) | ||||
|---|---|---|---|---|---|
| GoogLeNet | ResNet | EfficientNet | MobileNet | Small CNN | |
| 0.5 | 61.81 | 74.6 | 75.33 | 80.3 | 76.06 |
| 1 | 97 | 87.2 | 57.30 | 61.3 | 97.84 |
| 1.5 | 98.10 | 92.7 | 62.10 | 63.7 | 98.82 |
| 2 | 98.14 | 93.2 | 63.05 | 64 | 98.90 |
| 2.5 | 97.61 | 93.9 | 62.12 | 63.54 | 96.0 |
| 3 | 95.77 | 94.9 | 58.03 | 60.86 | 93.0 |
| Segmentation | Length of Signal (seconds) | Accuracy (%) | ||||
|---|---|---|---|---|---|---|
| GoogLeNet | ResNet | EfficientNet | MobileNet | Small CNN | ||
| R-centered | 0.5 s | 99.90 | 100 | 99.70 | 100 | 99.90 |
| 0.75 s | 99.34 | 99.96 | 99.32 | 99.92 | 99.61 | |
| 1 s | 99.25 | 99.65 | 99.01 | 99.70 | 99.52 | |
| P-P | 1 HB | 98.50 | 97.39 | 92.1 | 93.9 | 97.86 |
| R-R | 1 HB | 98.83 | 99.30 | 96.98 | 97.5 | 98.0 |
| Session Scenario | Accuracy (%) | ||||
|---|---|---|---|---|---|
| GoogLeNet | ResNet | EfficientNet | MobileNet | Small CNN | |
| Single | 99.33 | 99.01 | 95.56 | 94.22 | 99.14 |
| Mix | 98.05 | 98.95 | 89.05 | 90.78 | 98.20 |
| Multi | 93.87 | 97.28 | 83.10 | 87.51 | 94.18 |
| Sessions | Accuracy (%) | |||||
|---|---|---|---|---|---|---|
| Testing | Training | GoogLeNet | ResNet | EfficientNet | MobileNet | Small CNN |
| S1 | S2 | 95.06 | 96.78 | 89.09 | 88.47 | 95.54 |
| S2 | S1 | 92.68 | 97.78 | 77.12 | 86.56 | 92.81 |
| Average | 93.87 | 97.28 | 83.10 | 87.51 | 94.18 | |
| Network | Mean Accuracy | Standard Deviation |
|---|---|---|
| Small CNN | 0.9511 | 0.1231 |
| ResNet | 0.9342 | 0.1720 |
| GoogLeNet | 0.9269 | 0.1359 |
| EfficientNet | 0.8909 | 0.1596 |
| MobileNet | 0.8847 | 0.1817 |
| Network | TRR | FRR | FAR | TAR | HTER |
|---|---|---|---|---|---|
| Small CNN | 0.9992 | 0.0008 | 0.0658 | 0.9342 | 0.033 |
| ResNet | 0.9994 | 0.0006 | 0.0489 | 0.9511 | 0.025 |
| GoogLeNet | 0.9991 | 0.0009 | 0.0731 | 0.9296 | 0.037 |
| EfficientNet | 0.9986 | 0.0014 | 0.1019 | 0.8909 | 0.052 |
| MobileNet | 0.9985 | 0.0015 | 0.1153 | 0.8847 | 0.058 |
| Network | Yates Correction | p |
|---|---|---|
| Small CNN | 0.000845 | 0.976815 |
| ResNet | 0.001136 | 0.973108 |
| GoogLeNet | 0.000760 | 0.978008 |
| EfficientNet | 0.000509 | 0.981998 |
| MobileNet | 0.000482 | 0.982490 |
| Refrance | Number of Subjects | Length of Signal (second) | Segmentation Method | Accuracy (%) |
|---|---|---|---|---|
| [32] | 200 | 0.66 | HB | 97.84 |
| [24] | 52 | 10 | Blind | 100 |
| [52] | 52 | 1.2 (2 HBs) | HB | 100 |
| GoogLeNet | 100 | 0.5 | HB | 99.76 |
| ResNet | 100 | |||
| EfficientNet | 99.70 | |||
| MobileNet | 100 | |||
| Small CNN | 99.83 |
| Refrance | Number of Subjects | Session | Length of Signal (seconds) | Segmentation Method | Accuracy (%) |
|---|---|---|---|---|---|
| [52] | 90 | Single | 1.2 (2 HBs) | HB | 98.24 |
| [37] | 50 | Multi | 3 | Blind | 96.63 |
| [49] | 90 | Multi | 0.5 × 1 | HB | 83.33 |
| 0.5 × 8 | 100 | ||||
| [50] | 90 | Mix | 4 | Blind | 94.23 |
| Multi | 73.54 | ||||
| GoogLeNet | 90 | Single | 0.5 (1 HB) | HB | 99.33 |
| ResNet | 99.01 | ||||
| EfficientNet | 95.56 | ||||
| MobileNet | 94.22 | ||||
| Small CNN | 99.14 | ||||
| GoogLeNet | 90 | Mix | 0.5 (1 HB) | HB | 98.05 |
| ResNet | 98.95 | ||||
| EfficientNet | 89.05 | ||||
| MobileNet | 90.78 | ||||
| Small CNN | 98.2 | ||||
| GoogLeNet | 90 | Multi | 0.5 (1 HB) | HB | 93.87 |
| ResNet | 97.28 | ||||
| EfficientNet | 83.10 | ||||
| MobileNet | 87.51 | ||||
| Small CNN | 94.18 |
Publisher’s Note: MDPI stays neutral with regard to jurisdictional claims in published maps and institutional affiliations. |
© 2021 by the authors. Licensee MDPI, Basel, Switzerland. This article is an open access article distributed under the terms and conditions of the Creative Commons Attribution (CC BY) license (https://creativecommons.org/licenses/by/4.0/).
Share and Cite
AlDuwaile, D.A.; Islam, M.S. Using Convolutional Neural Network and a Single Heartbeat for ECG Biometric Recognition. Entropy 2021, 23, 733. https://doi.org/10.3390/e23060733
AlDuwaile DA, Islam MS. Using Convolutional Neural Network and a Single Heartbeat for ECG Biometric Recognition. Entropy. 2021; 23(6):733. https://doi.org/10.3390/e23060733
Chicago/Turabian StyleAlDuwaile, Dalal A., and Md Saiful Islam. 2021. "Using Convolutional Neural Network and a Single Heartbeat for ECG Biometric Recognition" Entropy 23, no. 6: 733. https://doi.org/10.3390/e23060733
APA StyleAlDuwaile, D. A., & Islam, M. S. (2021). Using Convolutional Neural Network and a Single Heartbeat for ECG Biometric Recognition. Entropy, 23(6), 733. https://doi.org/10.3390/e23060733