
Pulse Coupled Neural Network-Based Multimodal Medical Image Fusion via Guided Filtering and WSEML in NSCT Domain


Abstract
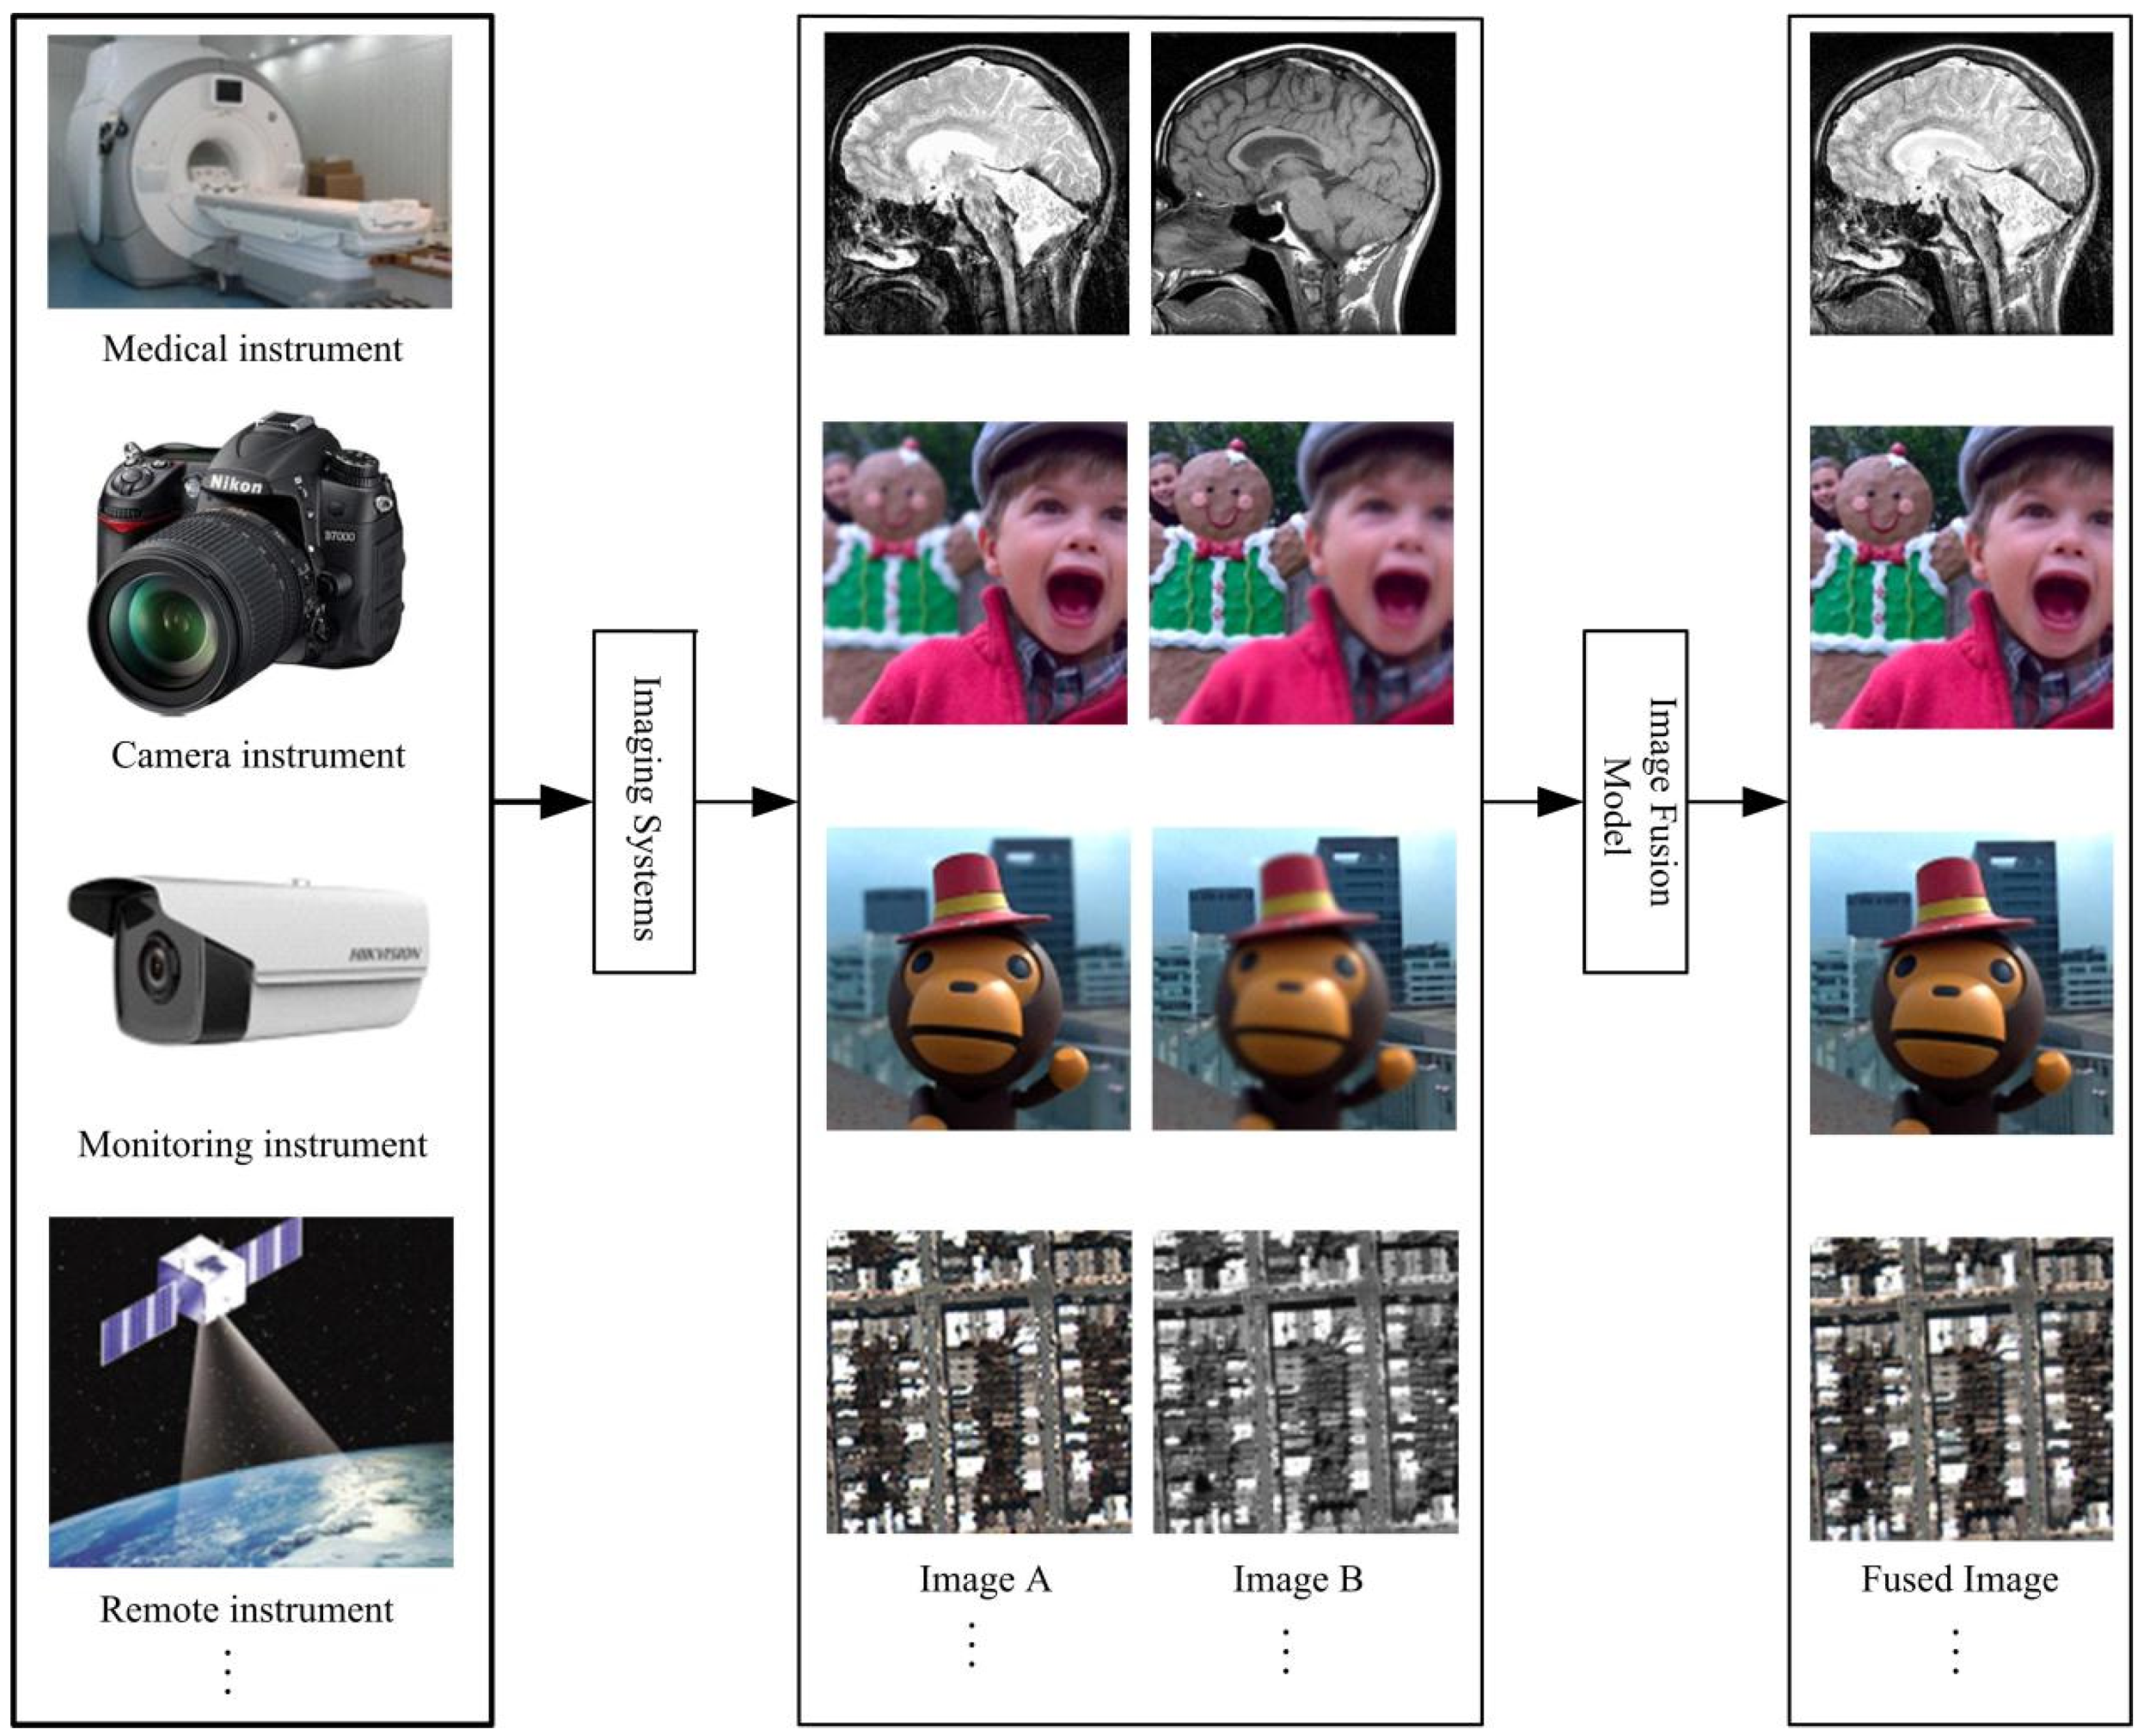
1. Introduction
2. Preliminaries
2.1. Non-Subsampled Contourlet Transform
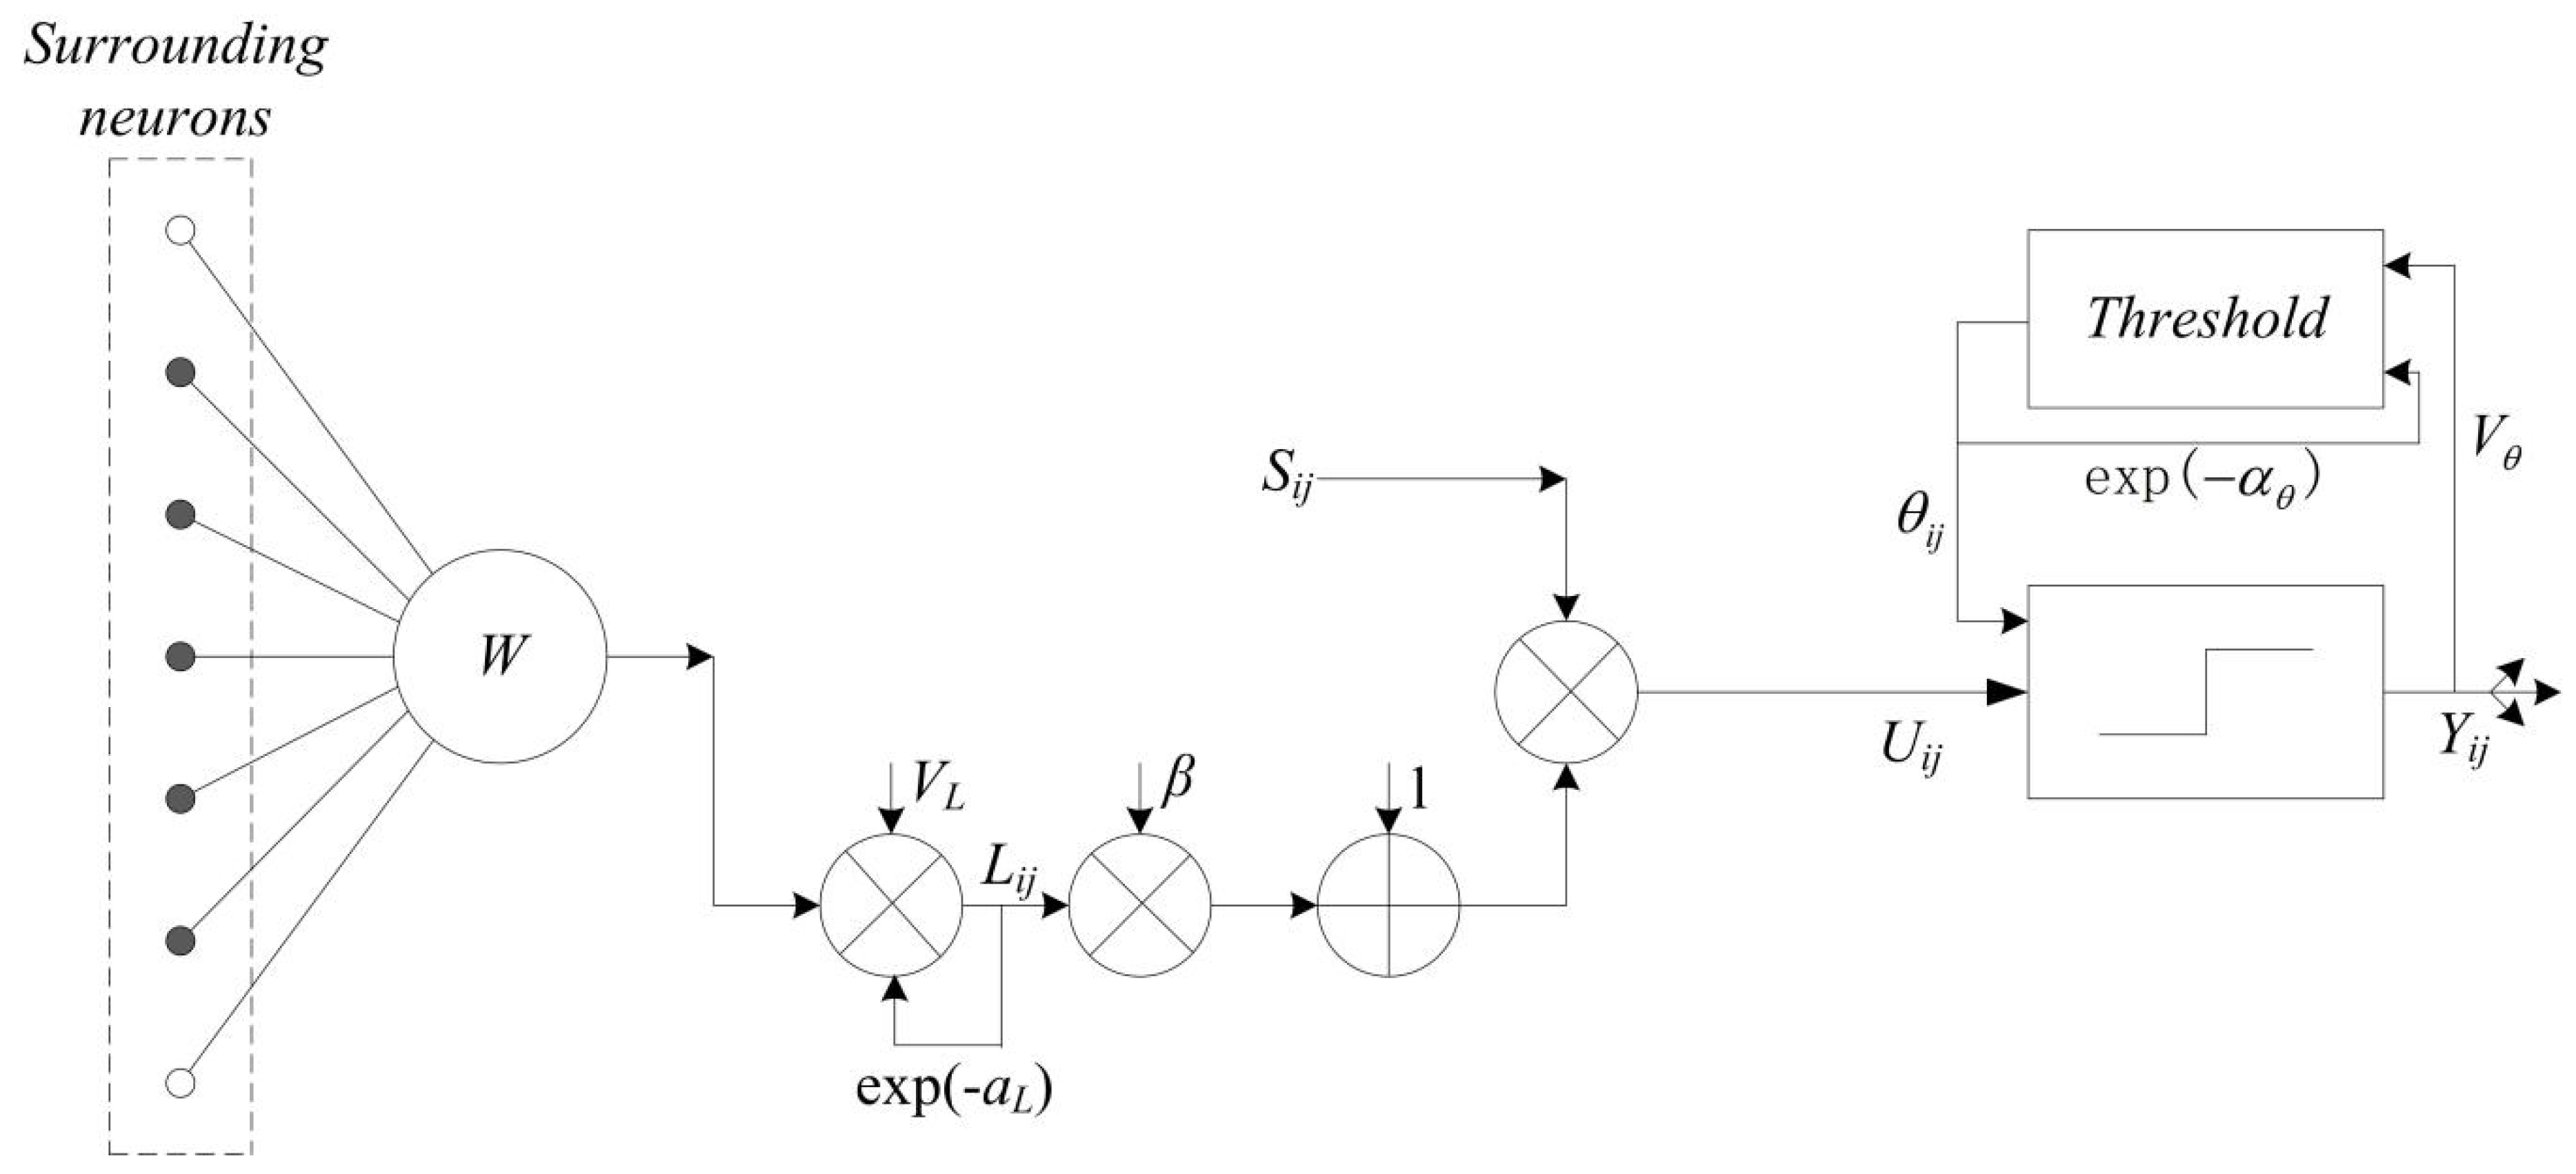
2.2. Pulse Coupled Neural Network
2.3. Guided Image Filter
3. Proposed Fusion Method
3.1. Overview
3.2. Detailed Fusion Algorithm
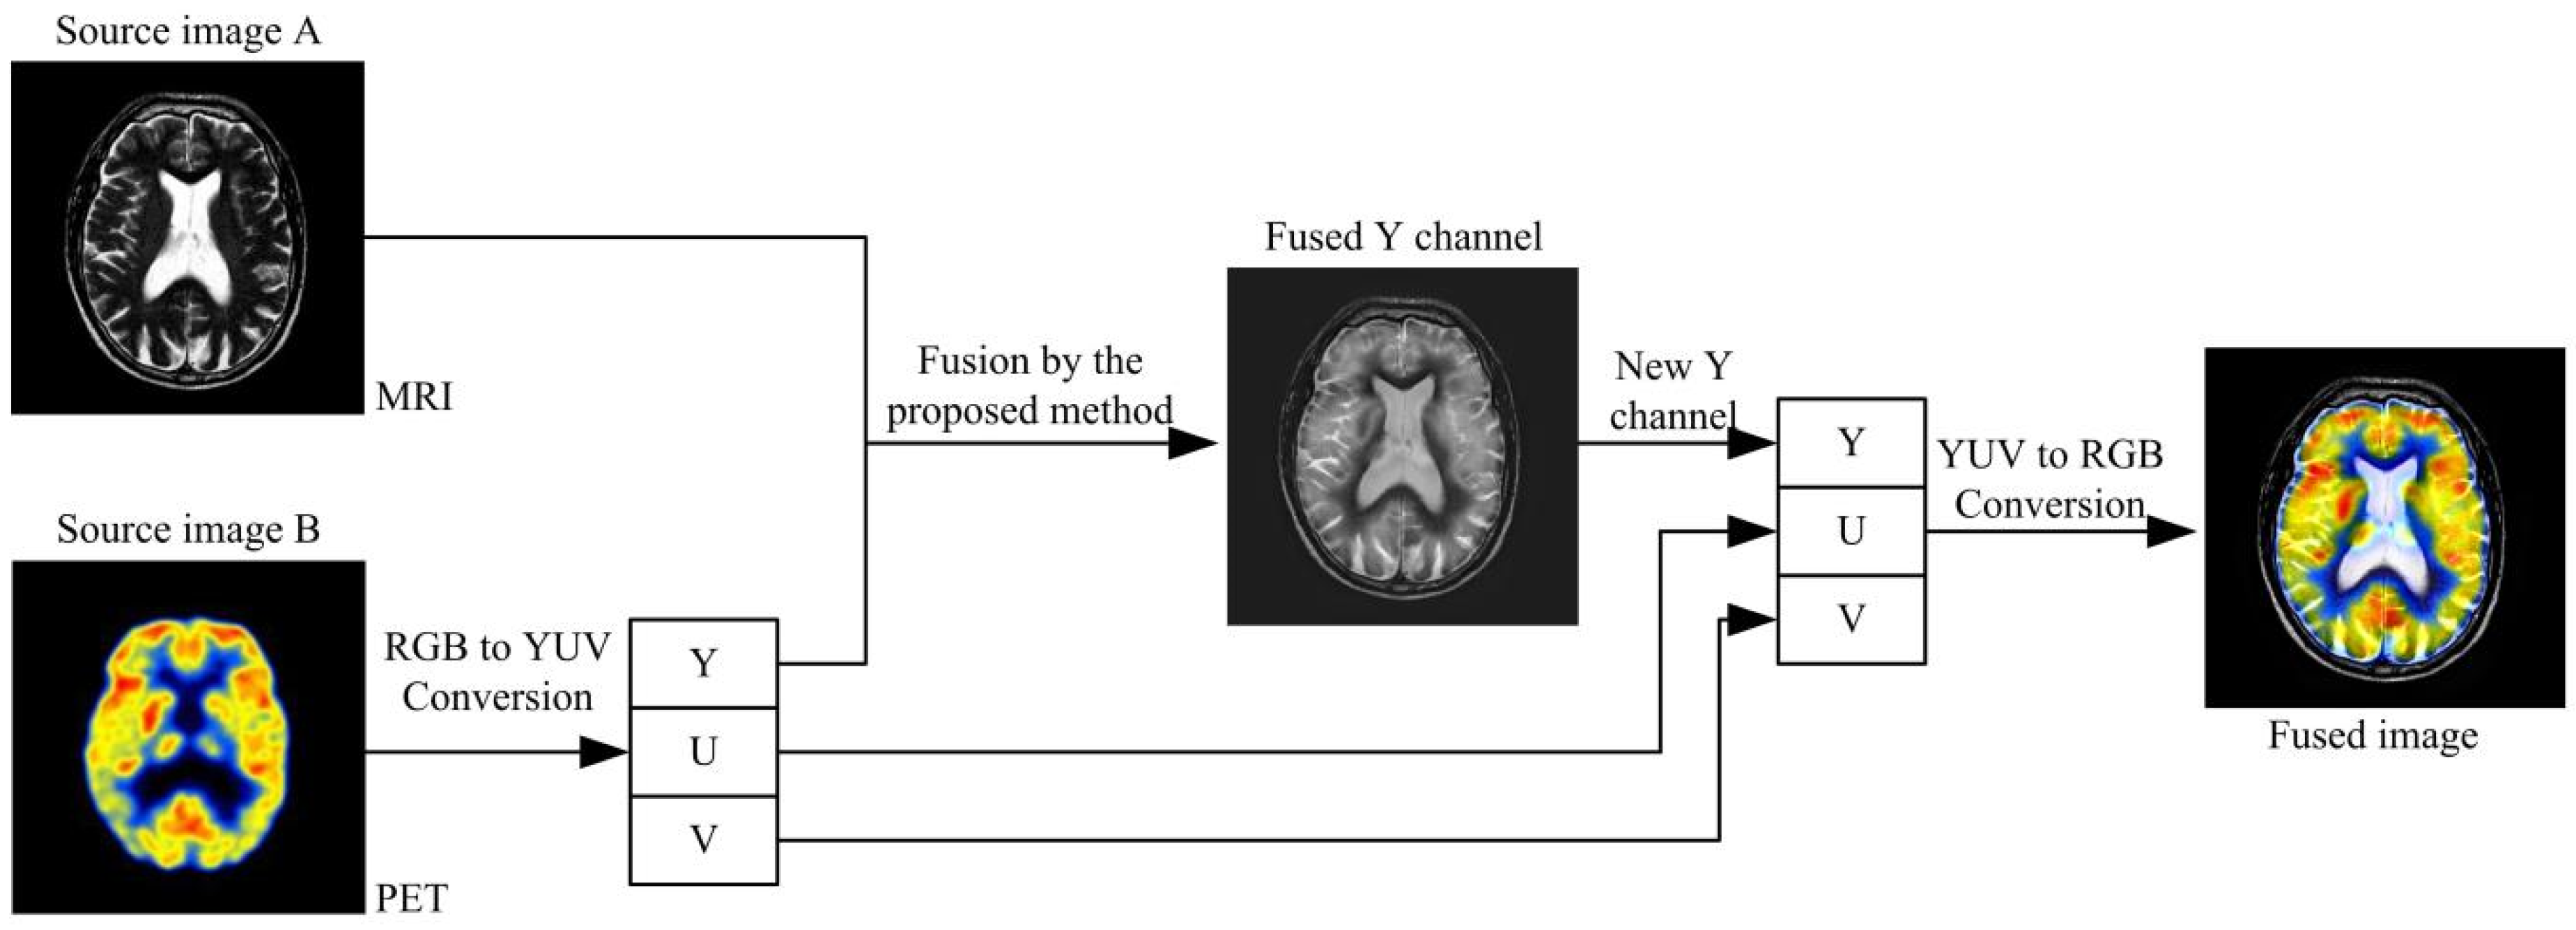
3.3. Extension to Color Image Fusion
4. Experimental Results and Discussions
4.1. Experimental Setup
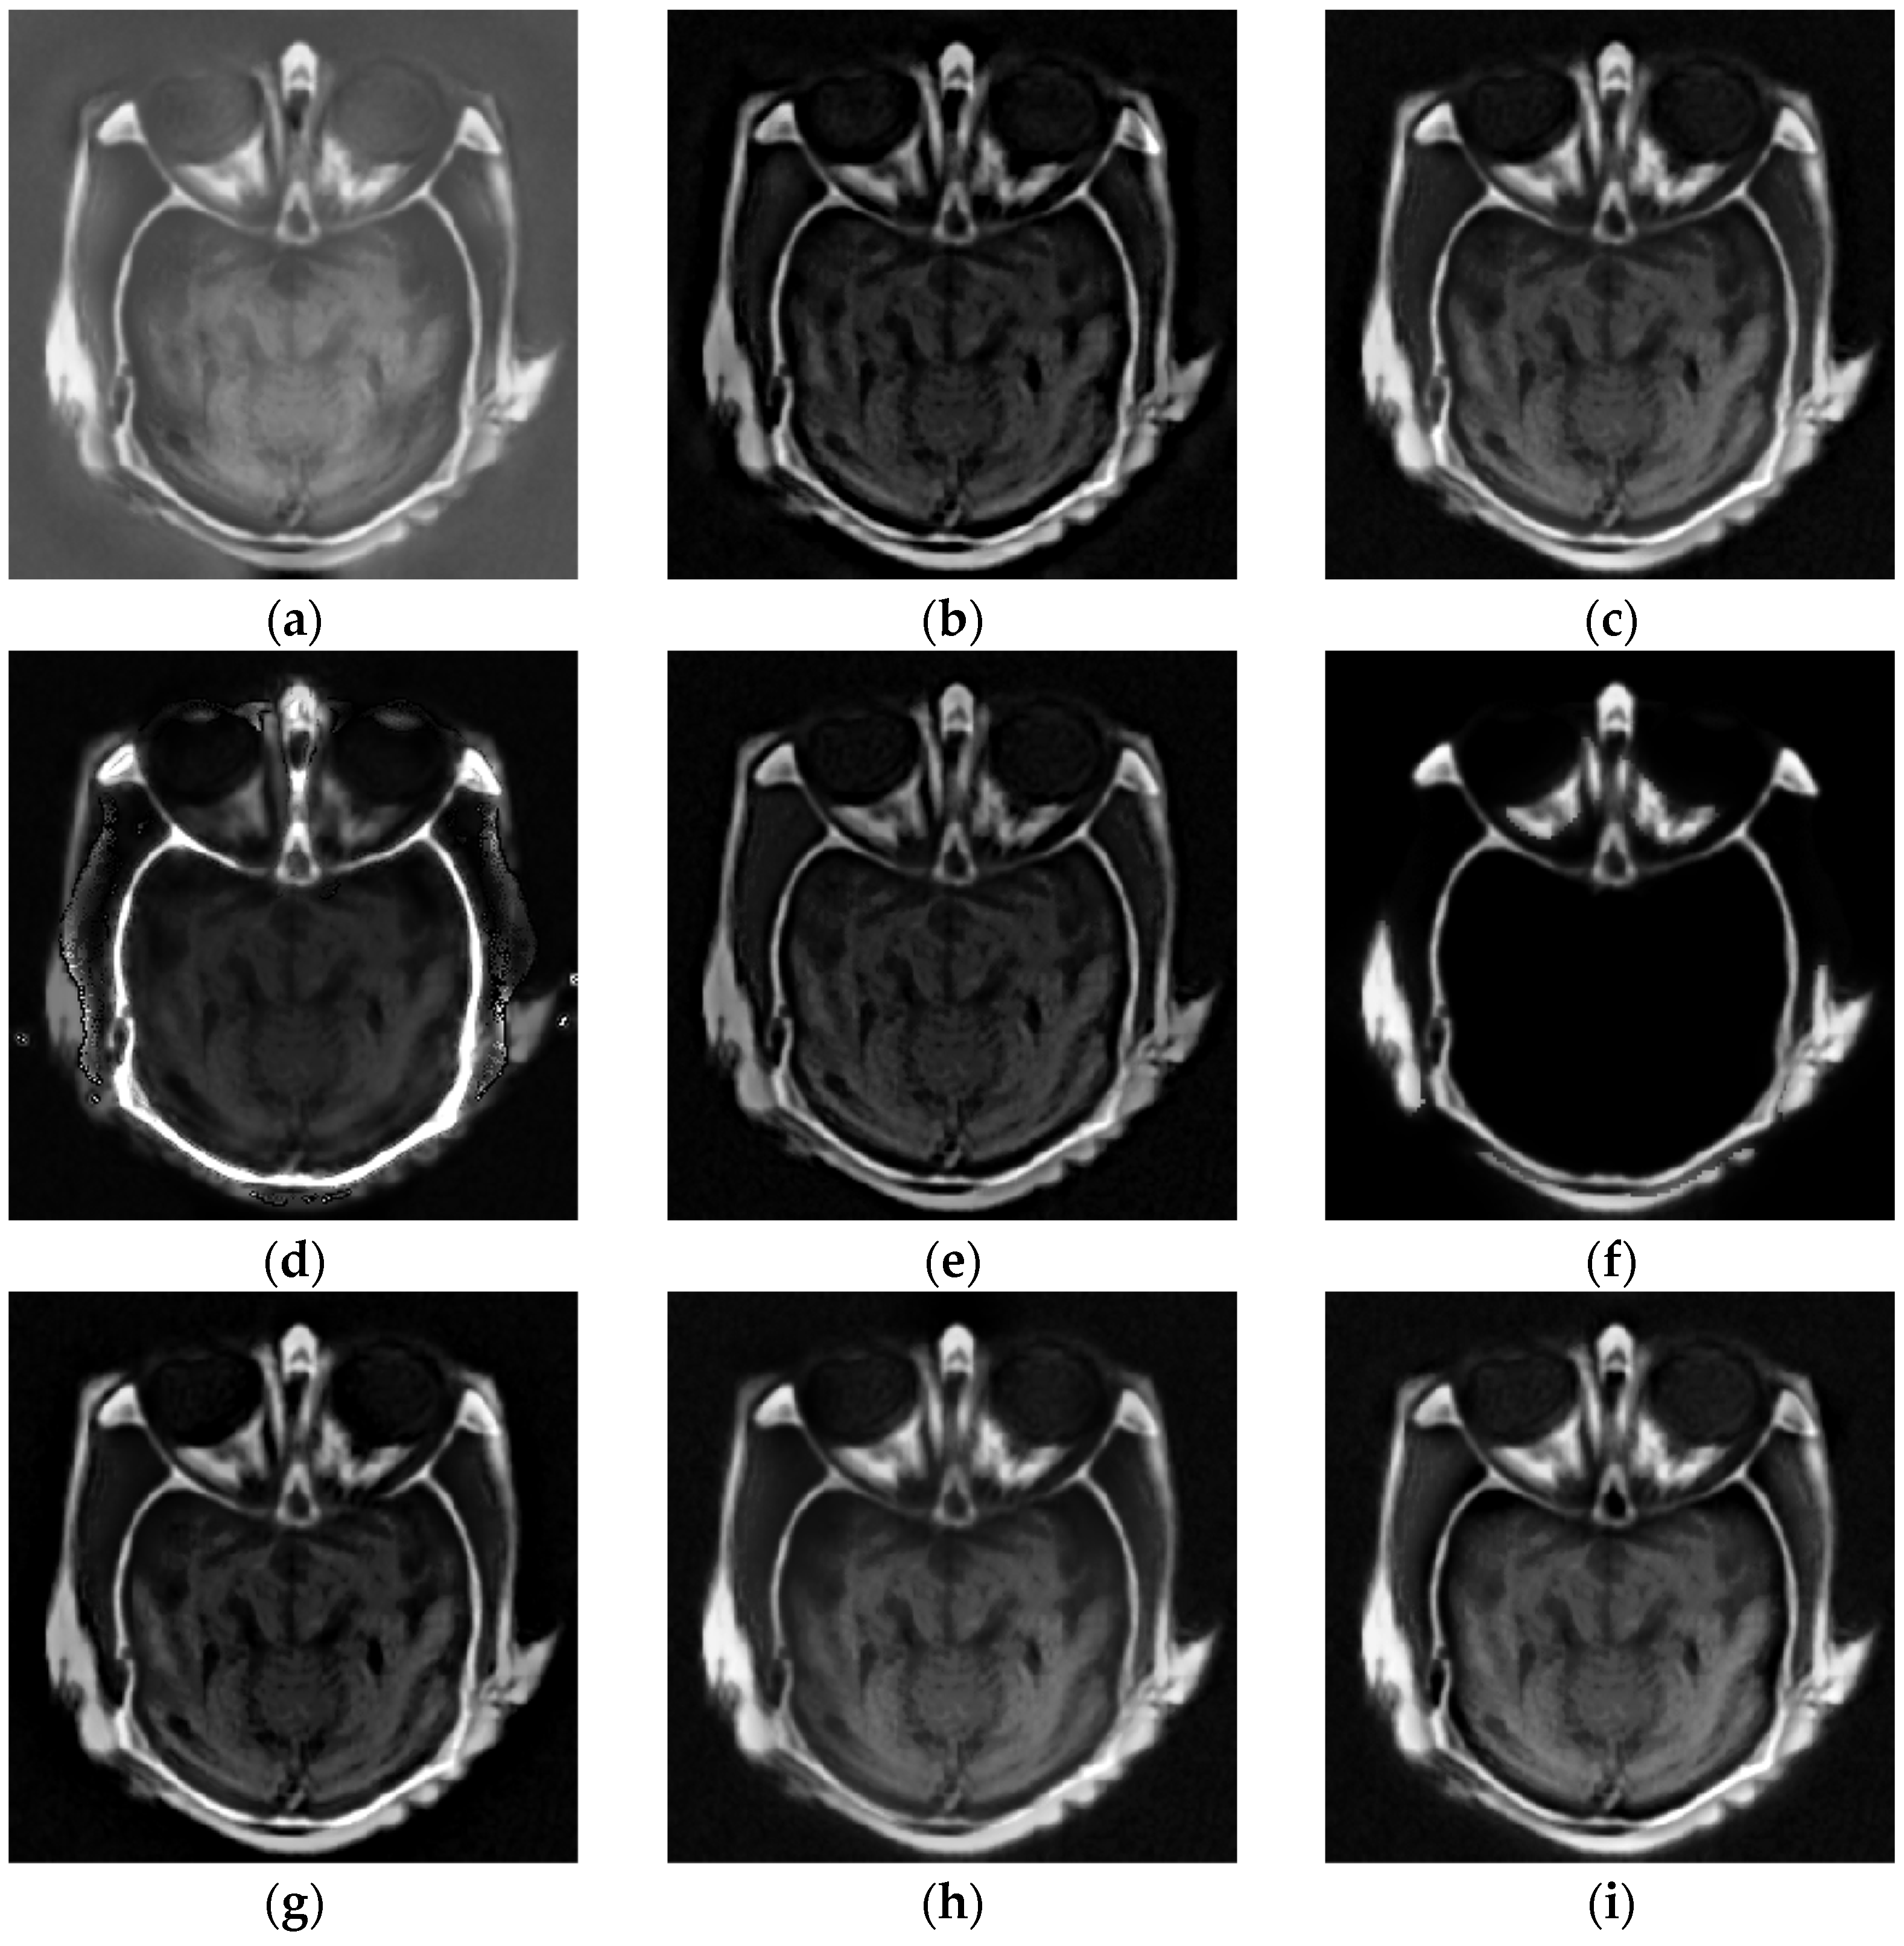
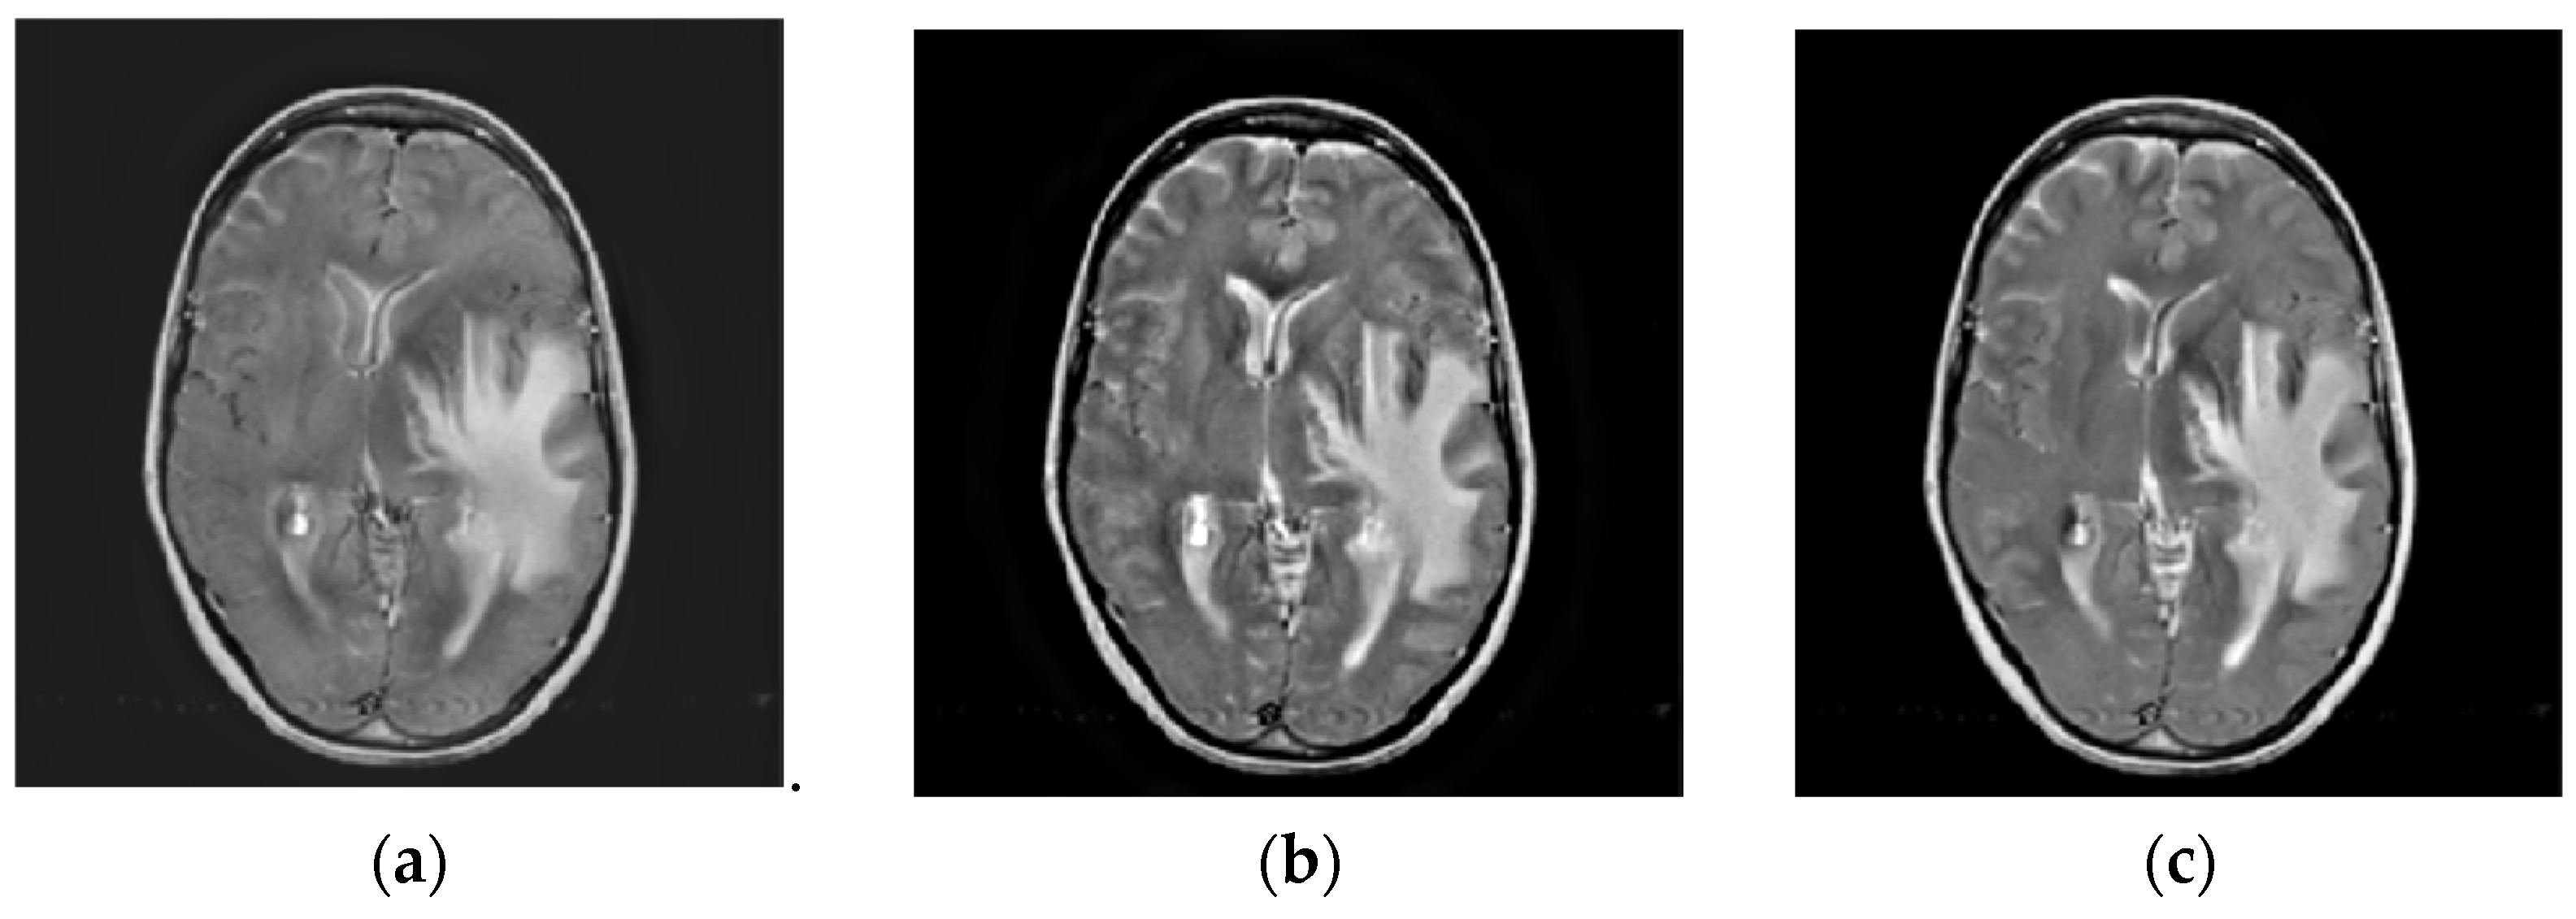
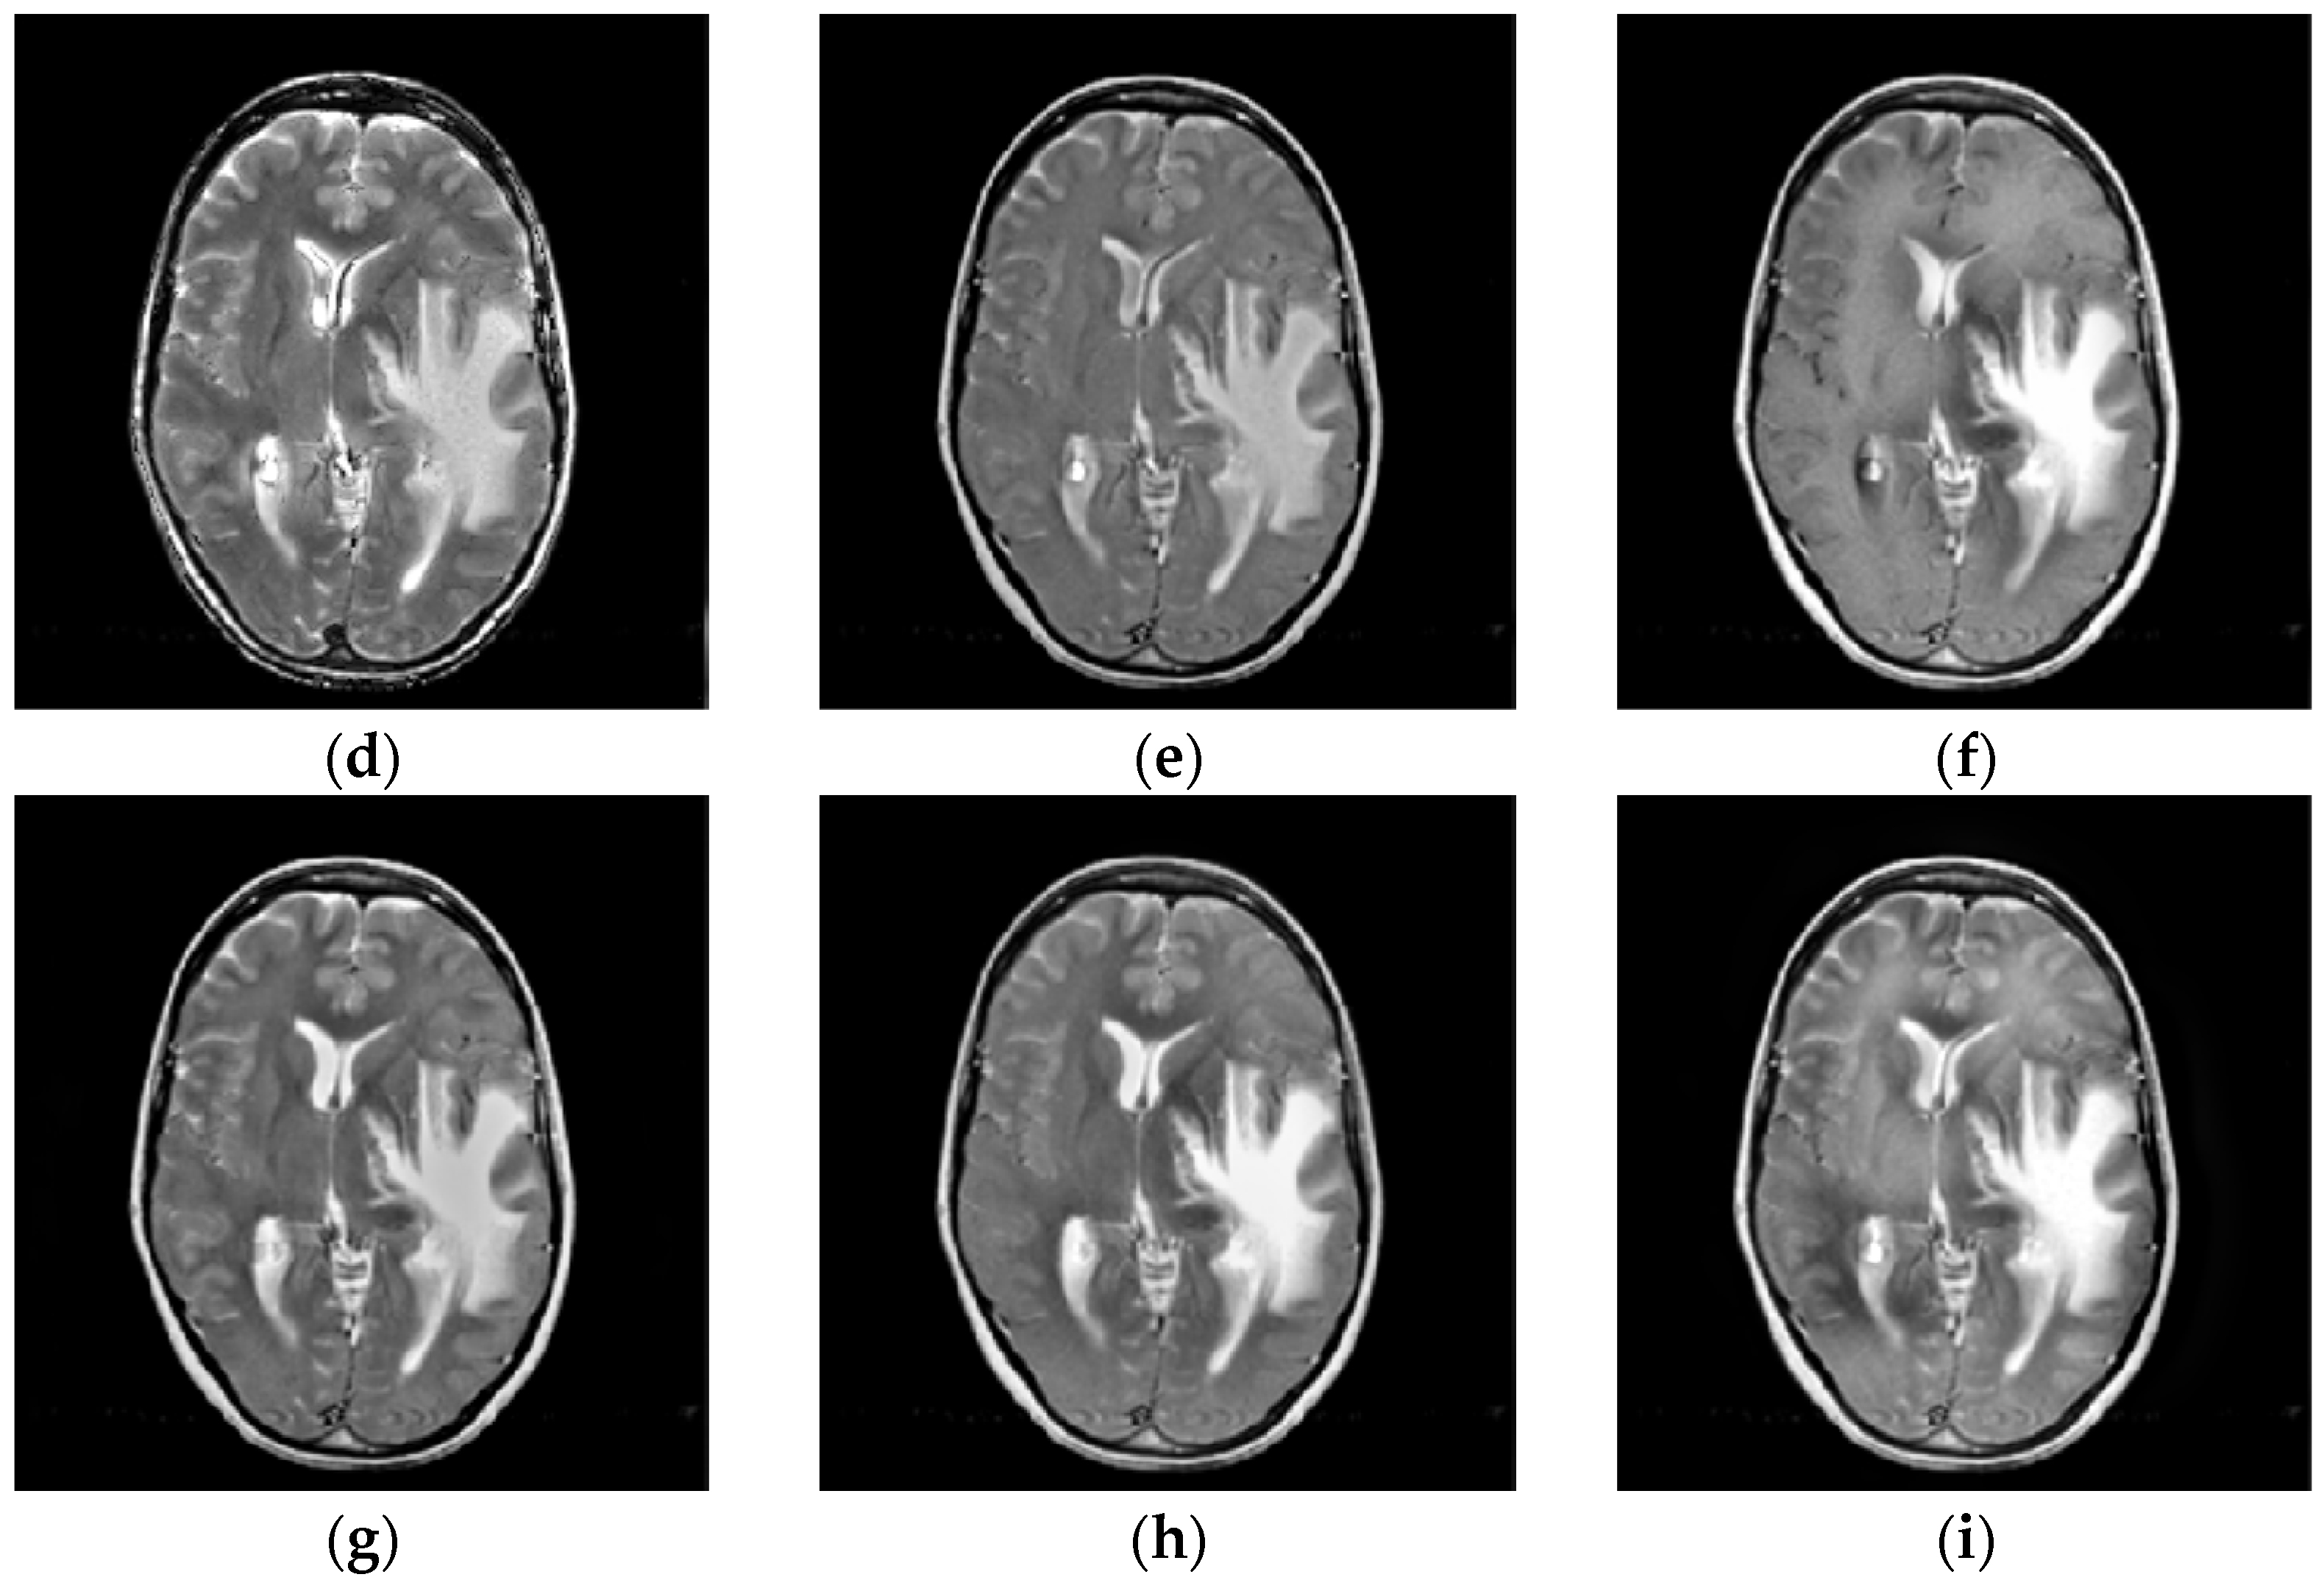
4.2. Comparison of Gray Image Fusion
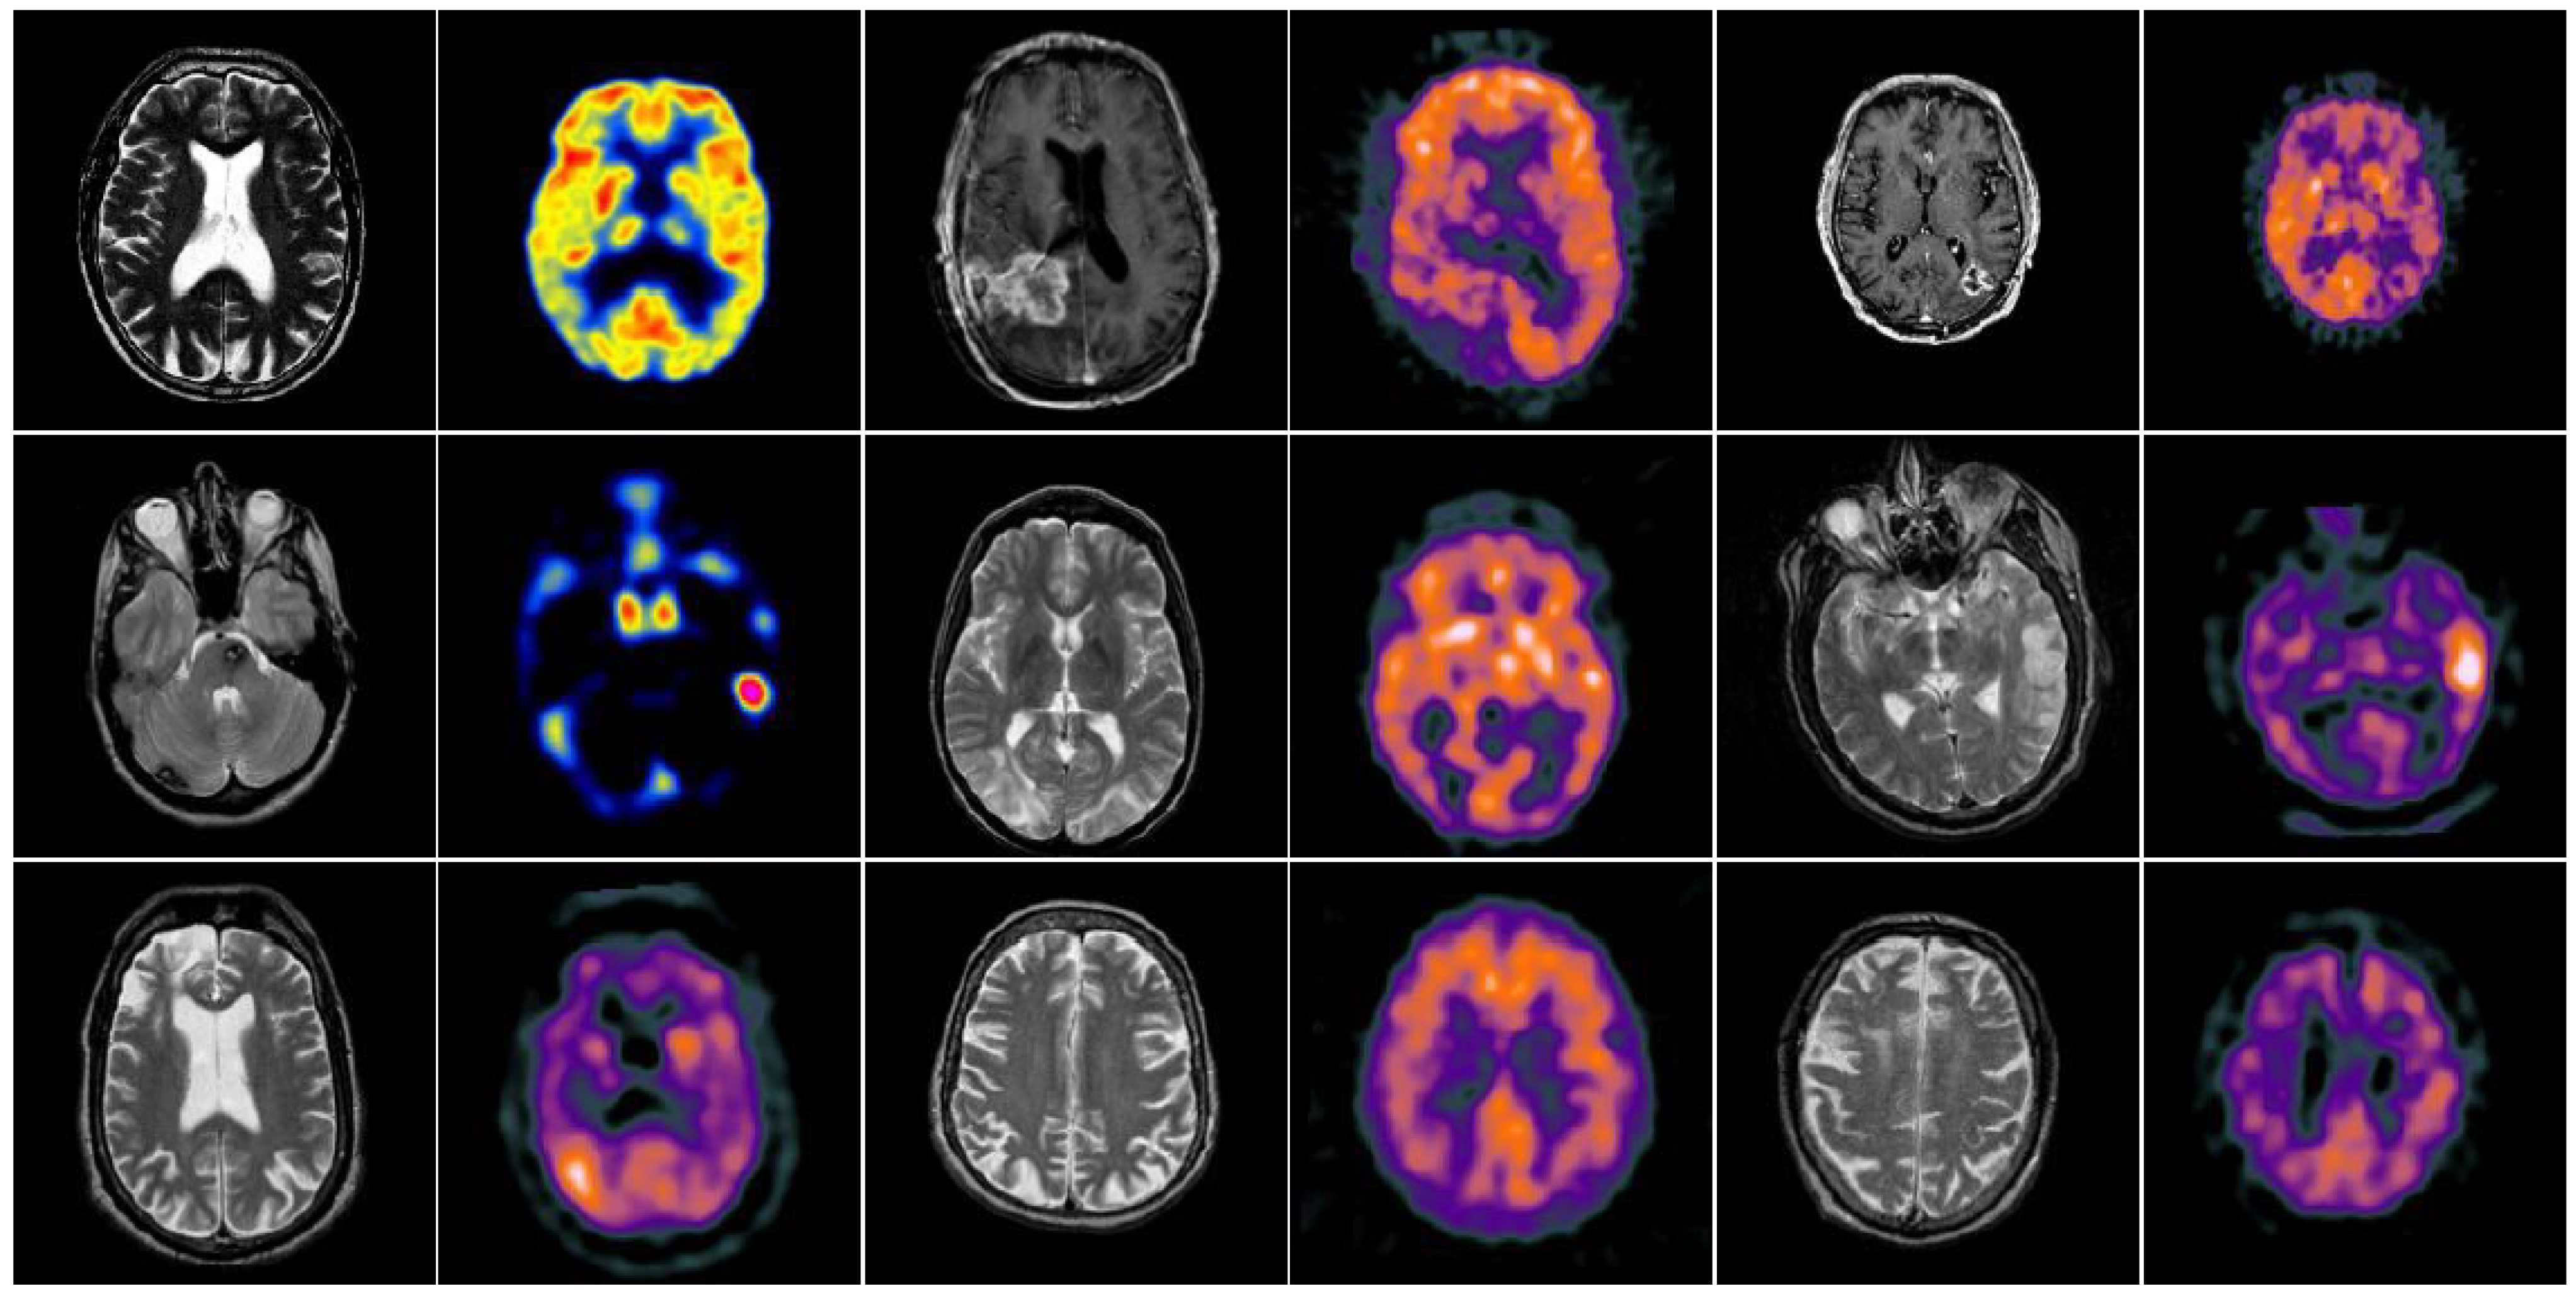
4.3. Comparison of Anatomical and Functional Image Fusion
5. Conclusions
Author Contributions
Funding
Institutional Review Board Statement
Informed Consent Statement
Data Availability Statement
Conflicts of Interest
Abbreviations
| PCNN | pulse coupled neural network |
| WSEML | weighted sum of eight-neighborhood-based modified Laplacian |
| GIF | guided image filtering |
| NSCT | nonsubsampled contourlet transform |
| CT | computed tomography |
| MRI | magnetic resonance imaging |
| PET | positron emission tomography |
| SPECT | single-photon emission CT |
| DWT | discrete wavelet transform |
| SWT | stationary wavelet transform |
| DTCWT | dual-tree complex wavelet transform |
| CVT | curvelet transform |
| CNT | contourlet transform |
| ST | shearlet transform |
| NSST | nonsubsampled shearlet transform |
| ANSST | adjustable nonsubsampled shearlet transform |
| CNN | convolutional neural network |
| MGA | multi-scale geometric analysis |
| PAPCNN | parameter-adaptive pulse coupled neural network |
| ISML | improved sum-modified-laplacian |
| DCNN | deep convolutional neural network |
| GFF | guided image filtering for image fusion |
| NSP | nonsubsampled pyramid |
| NSDFB | nonsubsampled directional filter bank |
| RP | ratio of low-pass pyramid |
| ASR | adaptive sparse representation |
| CSMCA | convolutional sparsity based morphological component analysis |
| SSID | single-scale structural image decomposition |
| VIFF | visual information fidelity |
| QW | weighted fusion quality index |
| API | average pixel intensity |
| SD | standard deviation |
| EN | entropy |
References
- Singh, S.; Anand, R.S. Multimodal medical image sensor fusion model using sparse K-SVD dictionary learning in nonsubsampled shearlet domain. IEEE Trans. Instrum. Meas. 2020, 69, 593–607. [Google Scholar] [CrossRef]
- Kong, W.; Miao, Q.; Lei, Y. Multimodal sensor medical image fusion based on local difference in non-subsampled domain. IEEE Trans. Instrum. Meas. 2019, 68, 938–951. [Google Scholar] [CrossRef]
- Wang, Z.; Cui, Z.; Zhu, Y. Multi-modal medical image fusion by Laplacian pyramid and adaptive sparse representation. Comput. Biol. Med. 2020, 123, 103823. [Google Scholar] [CrossRef] [PubMed]
- Zhang, L.; Zeng, G.; Wei, J. Multi-modality image fusion in adaptive-parameters SPCNN based on inherent characteristics of image. IEEE Sens. J. 2020, 20, 11820–11827. [Google Scholar] [CrossRef]
- Liu, Y.; Zhou, D.; Nie, R. Robust spiking cortical model and total-variational decomposition for multimodal medical image fusion. Biomed. Signal Process. Control 2020, 61, 101996. [Google Scholar] [CrossRef]
- Zhang, Y.; Liu, Y.; Sun, P. IFCNN: A general image fusion framework based on convolutional neural network. Inf. Fusion 2020, 54, 99–118. [Google Scholar] [CrossRef]
- Ma, J.; Liang, P.; Yu, W. Infrared and visible image fusion via detail preserving adversarial learning. Inf. Fusion 2020, 54, 2020. [Google Scholar] [CrossRef]
- Liu, Y.; Wang, L.; Cheng, J. Multi-focus image fusion: A survey of the state of the art. Inf. Fusion 2020, 64, 71–91. [Google Scholar] [CrossRef]
- Liu, Y.; Chen, X.; Wang, Z. Deep learning for pixel-level image fusion: Recent advances and future prospects. Inf. Fusion 2018, 42, 158–173. [Google Scholar] [CrossRef]
- Talal, T.; Attiya, G. Satellite image fusion based on modified central force optimization. Multimed. Tools Appl. 2020, 79, 21129–21154. [Google Scholar] [CrossRef]
- Liu, S.; Chen, J.; Rahardja, S. A new multi-focus image fusion algorithm and its efficient implementation. IEEE Trans. Circuits Syst. Video Technol. 2020, 30, 1374–1384. [Google Scholar] [CrossRef]
- Singh, R.; Srivastava, R. Multimodal medical image fusion in dual tree complex wavelet transform domain using maximum and average fusion rules. J. Med. Imaging Health Inform. 2012, 2, 168–173. [Google Scholar] [CrossRef]
- Liu, Y.; Liu, S.; Wang, Z. A general framework for image fusion based on multi-scale transform and sparse representation. Inf. Fusion 2015, 24, 147–164. [Google Scholar] [CrossRef]
- Do, M.N.; Vetterli, M. The contourlet transform: An efficient directional multiresolution image representation. IEEE Trans. Image Process. 2005, 14, 2091–2106. [Google Scholar] [CrossRef]
- Li, B.; Peng, H. Multi-focus image fusion based on dynamic threshold neural P systems and surfacelet transform. Knowl. Based Syst. 2020, 196, 105794. [Google Scholar] [CrossRef]
- Qu, X.; Yan, J.; Xiao, H. Image fusion algorithm based on spatial frequency-motivated pulse coupled neural networks in nonsubsampled contourlet transform domain. Acta Autom. Sin. 2008, 34, 1508–1514. [Google Scholar] [CrossRef]
- Guo, K.; Labate, D. Optimally sparse multidimensional representation using shearlets. Siam J. Math. Anal. 2007, 39, 298–318. [Google Scholar] [CrossRef]
- Li, L.; Wang, L.; Wang, Z. A novel medical image fusion approach based on nonsubsampled shearlet transform. J. Med. Imaging Health Inform. 2019, 9, 1815–1826. [Google Scholar] [CrossRef]
- Vishwakarma, A.; Bhuyan, M.K. Image fusion using adjustable non-subsampled shearlet transform. IEEE Trans. Instrum. Meas. 2019, 68, 3367–3378. [Google Scholar] [CrossRef]
- Iqbal, M.; Riaz, M. A multifocus image fusion using highlevel DWT components and guided filter. Multimed. Tools Appl. 2020, 79, 12817–12828. [Google Scholar]
- Wang, Z.; Li, X.; Duan, H. Multifocus image fusion using convolutional neural networks in the discrete wavelet transform domain. Multimed. Tools Appl. 2019, 78, 34483–34512. [Google Scholar] [CrossRef]
- Aishwarya, N.; Bennila, T.C. Visible and Infrared image fusion using DTCWT and adaptive combined clustered dictionary. Infrared Phys. Technol. 2018, 93, 300–309. [Google Scholar] [CrossRef]
- Mao, Q.; Zhu, Y.; Lv, C. Image fusion based on multiscale transform and sparse representation to enhance terahertz images. Opt. Express 2020, 28, 25293–25307. [Google Scholar] [CrossRef] [PubMed]
- Chen, C.; He, X.; Guo, B. A pixel-level fusion method for multi-source optical remote sensing image combining the principal component analysis and curvelet transform. Earth Sci. Inform. 2020, 13, 1005–1013. [Google Scholar] [CrossRef]
- Li, W.; Lin, Q.; Wang, K. Improving medical image fusion method using fuzzy entropy and nonsubsampling contourlet transform. Int. J. Imaging Syst. Technol. 2020, 30, 204–214. [Google Scholar] [CrossRef]
- Wu, C.; Chen, L. Infrared and visible image fusion method of dual NSCT and PCNN. PLoS ONE 2020, 15, e0239535. [Google Scholar]
- Li, L.; Si, Y.; Wang, L. A novel approach for multi-focus image fusion based on SF-PAPCNN and ISML in NSST domain. Multimed. Tools Appl. 2020, 79, 24303–24328. [Google Scholar] [CrossRef]
- Xing, C.; Wang, M.; Dong, C. Using taylor expansion and convolutional sparse representation for image fusion. Neurocomputing 2020, 402, 437–455. [Google Scholar] [CrossRef]
- Liu, Y.; Wang, Z. Simultaneous image fusion and denoising with adaptive sparse representation. IET Image Process. 2015, 9, 347–357. [Google Scholar] [CrossRef]
- Liu, Y.; Chen, X.; Peng, H. Multi-focus image fusion with a deep convolutional neural network. Inf. Fusion 2017, 36, 191–207. [Google Scholar] [CrossRef]
- Li, S.; Kang, X.; Hu, J. Image fusion with guided filtering. IEEE Trans. Image Process. 2013, 22, 2864–2875. [Google Scholar]
- Da, A.; Zhou, J.; Do, M. The nonsubsampled contourlet transform: Theory, design, and applications. IEEE Trans. Image Process. 2006, 15, 3089–3101. [Google Scholar]
- He, K.; Sun, J.; Tang, X. Guided image filtering. IEEE Trans. Pattern Anal. Mach. Intell. 2013, 35, 1397–1409. [Google Scholar] [CrossRef]
- Yin, M.; Liu, X.; Liu, Y. Medical image fusion with parameter-adaptive pulse coupled neural network in nonsubsampled shearlet transform domain. IEEE Trans. Instrum. Meas. 2019, 68, 49–64. [Google Scholar] [CrossRef]
- Liu, Y.; Chen, X.; Ward, R. Medical image fusion via convolutional sparsity based morphological component analysis. IEEE Signal Process. Lett. 2019, 26, 485–489. [Google Scholar] [CrossRef]
- Li, H.; Qi, X.; Xie, W. Fast infrared and visible image fusion with structural decomposition. Knowl. Based Syst. 2020, 204, 106182. [Google Scholar] [CrossRef]
- Han, Y.; Cai, Y.; Cao, Y. A new image fusion performance metric based on visual information fidelity. Inf. Fusion 2013, 14, 127–135. [Google Scholar] [CrossRef]
- Li, L.; Ma, H.; Jia, Z. A novel multiscale transform decomposition based multi-focus image fusion framework. Multimed. Tools Appl. 2021, 80, 12389–12409. [Google Scholar] [CrossRef]
- Li, L.; Si, Y. Enhancement of hyperspectral remote sensing images based on improved fuzzy contrast in nonsubsampled shearlet transform domain. Multimed. Tools Appl. 2019, 78, 18077–18094. [Google Scholar] [CrossRef]
- Zhang, H.; Le, Z.; Shao, Z.; Xu, H.; Ma, J. MFF-GAN: An unsupervised generative adversarial network with adaptive and gradient joint constraints for multi-focus image fusion. Inf. Fusion 2021, 66, 40–53. [Google Scholar] [CrossRef]
- Li, L.; Si, Y. Brain image enhancement approach based on singular value decomposition in nonsubsampled shearlet transform domain. J. Med. Imaging Health Inform. 2020, 10, 1785–1794. [Google Scholar] [CrossRef]
- Liu, Z.; Blasch, E. Objective assessment of multiresolution image fusion algorithms for context enhancement in night vision: A comparative study. IEEE Trans. Pattern Anal. Mach. Intell. 2012, 34, 94–109. [Google Scholar] [CrossRef] [PubMed]
- Wang, L.; Li, B.; Tian, L. EGGDD: An explicit dependency model for multi-modal medical image fusion in shift-invariant shearlet transform domain. Inf. Fusion 2014, 19, 29–37. [Google Scholar] [CrossRef]
- Kumar, B.K.S. Image fusion based on pixel significance using cross bilateral filter. Signal Image Video Process. 2015, 9, 1193–1204. [Google Scholar] [CrossRef]
- Du, J.; Li, W. Two-scale image decomposition based image fusion using structure tensor. Int. J. Imaging Syst. Technol. 2020, 30, 271–284. [Google Scholar] [CrossRef]
- Ma, J.; Zhou, Y. Infrared and visible image fusion via gradientlet filter. Comput. Vis. Image Underst. 2020, 197, 103016. [Google Scholar] [CrossRef]
- Xu, H.; Ma, J.; Zhang, X. MEF-GAN: Multi-exposure image fusion via generative adversarial networks. IEEE Trans. Image Process. 2020, 29, 7203–7216. [Google Scholar] [CrossRef]
- Chen, J.; Li, X.; Luo, L. Infrared and visible image fusion based on target-enhanced multiscale transform decomposition. Inf. Sci. 2020, 508, 64–78. [Google Scholar] [CrossRef]


| Categories | Methods |
|---|---|
| Multiscale transform decomposition | discrete wavelet transform (DWT) [10], stationary wavelet transform (SWT) [11], dual-tree complex wavelet transform (DTCWT) [12], curvelet transform (CVT) [13], contourlet transform (CNT) [14], |
| surfacelet transform [15], non-subsampled contourlet transform (NSCT) [16], shearlet transform (ST) [17], nonsubsampled shearlet transform (NSST) [18], adjustable non-subsampled shearlet transform (ANSST) [19] | |
| Sparse representation | convolutional sparse representation [28], |
| adaptive sparse representation (ASR) [29] | |
| Deep learning | deep convolutional neural network (DCNN) [30] |
| Edge-preserving filter | guided image filtering [31] |
| Methods | Parameter Setting |
|---|---|
| NSCT [16] | PCNN is set as , , , , , , , and ; the NSCT decomposition direction numbers are [4, 4, 4, 4]. |
| DTCWT [12] | L = 4 |
| GFF [31] | |
| RP [13] | L = 4 |
| ASR [29] | dictionary size: 256, , the number of sub-dictionaries: 7 |
| DCNN [30] | patch size = 16 × 16, convolutional layer: kernel size = 3 × 3, stride = 1, max-pooling layer: kernel size = 2 × 2, stride = 2 |
| CSMCA [35] | |
| SSID [36] | r = 15 |
| Proposed | PCNN is set as , , , , , , , and ; the NSCT decomposition direction numbers are [4, 4, 4, 4], |
| VIFF | QW | API | SD | EN | Time/s | |
|---|---|---|---|---|---|---|
| NSCT | 0.3440 | 0.7833 | 40.3719 | 49.9211 | 6.6284 | 23.3362 |
| DTCWT | 0.3747 | 0.7481 | 32.5113 | 42.9503 | 6.2258 | 0.2269 |
| GFF | 0.4863 | 0.8337 | 50.1930 | 53.7113 | 6.7920 | 0.2579 |
| RP | 0.2256 | 0.5289 | 36.4669 | 51.5819 | 6.0500 | 0.2034 |
| ASR | 0.3744 | 0.7526 | 31.5150 | 40.0483 | 6.1778 | 91.1108 |
| DCNN | 0.2398 | 0.6949 | 22.3834 | 52.2447 | 3.4737 | 75.3303 |
| CSMCA | 0.4752 | 0.8030 | 37.2620 | 50.7438 | 6.3268 | 200.6023 |
| SSID | 0.4423 | 0.7988 | 51.2897 | 52.4270 | 6.6580 | 0.1608 |
| Proposed | 0.4594 | 0.8438 | 53.2905 | 55.1511 | 6.8000 | 17.9221 |
| VIFF | QW | API | SD | EN | Time/s | |
|---|---|---|---|---|---|---|
| NSCT | 0.4728 | 0.8324 | 56.2619 | 69.6178 | 5.2291 | 22.4744 |
| DTCWT | 0.4830 | 0.8326 | 52.1862 | 65.5521 | 4.9310 | 0.1799 |
| GFF | 0.4850 | 0.8448 | 54.5311 | 65.9081 | 5.3836 | 0.2404 |
| RP | 0.3582 | 0.5464 | 55.5456 | 70.0442 | 4.5744 | 0.1278 |
| ASR | 0.4680 | 0.8164 | 51.5346 | 63.9370 | 4.1560 | 87.0228 |
| DCNN | 0.4638 | 0.8279 | 60.4476 | 74.8379 | 4.5250 | 78.8741 |
| CSMCA | 0.4940 | 0.8444 | 53.2322 | 67.4899 | 4.3896 | 205.1055 |
| SSID | 0.5122 | 0.8426 | 55.8888 | 70.3751 | 4.5738 | 0.0721 |
| Proposed | 0.5151 | 0.8492 | 60.6443 | 75.1231 | 5.0524 | 18.5094 |
| VIFF | QW | API | SD | EN | Time/s | |
|---|---|---|---|---|---|---|
| NSCT | 0.5210 | 0.7761 | 59.8996 | 65.1086 | 6.1218 | 23.7192 |
| DTCWT | 0.5181 | 0.7713 | 54.4182 | 59.9131 | 5.7897 | 0.1778 |
| GFF | 0.5095 | 0.7813 | 60.0666 | 62.8036 | 6.0636 | 0.2568 |
| RP | 0.3701 | 0.5758 | 58.8046 | 64.2301 | 5.6415 | 0.1428 |
| ASR | 0.4824 | 0.7584 | 53.6929 | 57.2958 | 5.3715 | 106.4758 |
| DCNN | 0.5439 | 0.7674 | 65.3528 | 73.7230 | 5.1390 | 80.0550 |
| CSMCA | 0.5473 | 0.7822 | 56.8599 | 63.2075 | 5.4745 | 199.1734 |
| SSID | 0.5970 | 0.7934 | 66.2517 | 70.0540 | 5.6540 | 0.0848 |
| Proposed | 0.6121 | 0.8072 | 70.5363 | 74.2915 | 5.9685 | 19.0577 |
| VIFF | QW | API | SD | EN | Time/s | |
|---|---|---|---|---|---|---|
| NSCT | 0.2651 | 0.7986 | 43.1364 | 64.8996 | 4.7648 | 28.2017 |
| DTCWT | 0.5901 | 0.8250 | 43.4533 | 62.9923 | 4.6493 | 0.1937 |
| GFF | 0.1899 | 0.8075 | 33.8746 | 64.0359 | 4.4073 | 0.2377 |
| RP | 0.8443 | 0.8471 | 45.8674 | 68.7058 | 4.7289 | 0.1570 |
| ASR | 0.3150 | 0.7602 | 42.9496 | 61.1235 | 4.1997 | 85.6910 |
| DCNN | 0.2016 | 0.8049 | 36.4412 | 63.0764 | 4.5451 | 80.3691 |
| CSMCA | 0.3088 | 0.7926 | 44.4419 | 63.9466 | 4.5383 | 193.1375 |
| SSID | 0.3675 | 0.6837 | 53.5451 | 74.4686 | 4.6702 | 0.0806 |
| Proposed | 0.3905 | 0.7737 | 57.7310 | 80.6245 | 4.9169 | 20.5294 |
| VIFF | QW | API | SD | EN | Time/s | |
|---|---|---|---|---|---|---|
| NSCT | 0.5016 | 0.8946 | 39.8883 | 56.0495 | 4.7101 | 26.5087 |
| DTCWT | 0.7396 | 0.9034 | 35.7573 | 50.1217 | 4.7462 | 0.2026 |
| GFF | 0.4947 | 0.8995 | 38.8141 | 55.1386 | 4.6584 | 0.2475 |
| RP | 0.6223 | 0.7878 | 38.4400 | 53.6370 | 4.6522 | 0.1562 |
| ASR | 0.4688 | 0.8342 | 35.2421 | 48.2889 | 4.3736 | 92.3286 |
| DCNN | 0.4952 | 0.8936 | 39.6507 | 56.7982 | 4.6641 | 79.5171 |
| CSMCA | 0.3801 | 0.6798 | 29.8909 | 42.2079 | 4.1895 | 186.4474 |
| SSID | 0.5425 | 0.8690 | 41.1085 | 56.0659 | 4.6606 | 0.0828 |
| Proposed | 0.5484 | 0.8968 | 43.7113 | 59.6273 | 4.8847 | 19.3064 |
Publisher’s Note: MDPI stays neutral with regard to jurisdictional claims in published maps and institutional affiliations. |
© 2021 by the authors. Licensee MDPI, Basel, Switzerland. This article is an open access article distributed under the terms and conditions of the Creative Commons Attribution (CC BY) license (https://creativecommons.org/licenses/by/4.0/).
Share and Cite
Li, L.; Ma, H. Pulse Coupled Neural Network-Based Multimodal Medical Image Fusion via Guided Filtering and WSEML in NSCT Domain. Entropy 2021, 23, 591. https://doi.org/10.3390/e23050591
Li L, Ma H. Pulse Coupled Neural Network-Based Multimodal Medical Image Fusion via Guided Filtering and WSEML in NSCT Domain. Entropy. 2021; 23(5):591. https://doi.org/10.3390/e23050591
Chicago/Turabian StyleLi, Liangliang, and Hongbing Ma. 2021. "Pulse Coupled Neural Network-Based Multimodal Medical Image Fusion via Guided Filtering and WSEML in NSCT Domain" Entropy 23, no. 5: 591. https://doi.org/10.3390/e23050591
APA StyleLi, L., & Ma, H. (2021). Pulse Coupled Neural Network-Based Multimodal Medical Image Fusion via Guided Filtering and WSEML in NSCT Domain. Entropy, 23(5), 591. https://doi.org/10.3390/e23050591