
Spatial Correlation Network and Regional Differences for the Development of Digital Economy in China


Abstract
:1. Introduction
2. Literature Review
3. Data and Methods
3.1. Index System of Digital Economy
3.2. Digital Economy Data
3.3. Index of Indicators
3.4. Theil Index and Subgroup Decomposition
3.5. Kernel Density Estimation
3.6. Network Analysis
4. Results
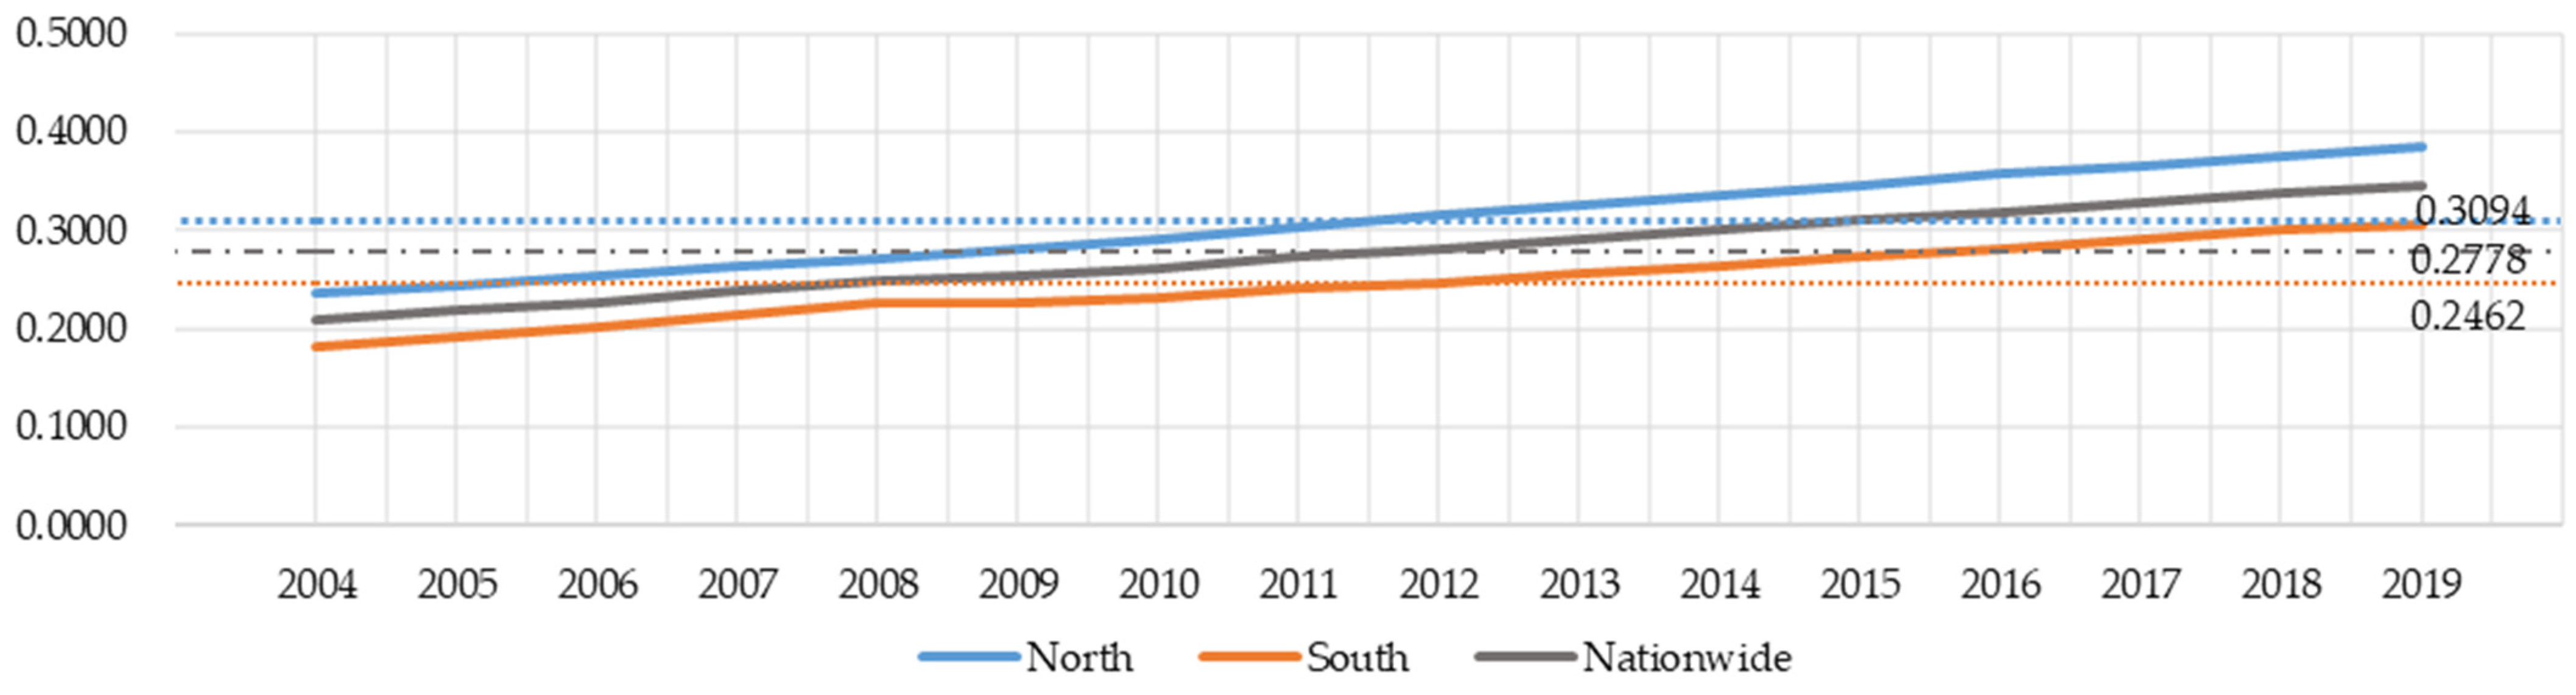
4.1. Measurement of Development Levels of Two Regions
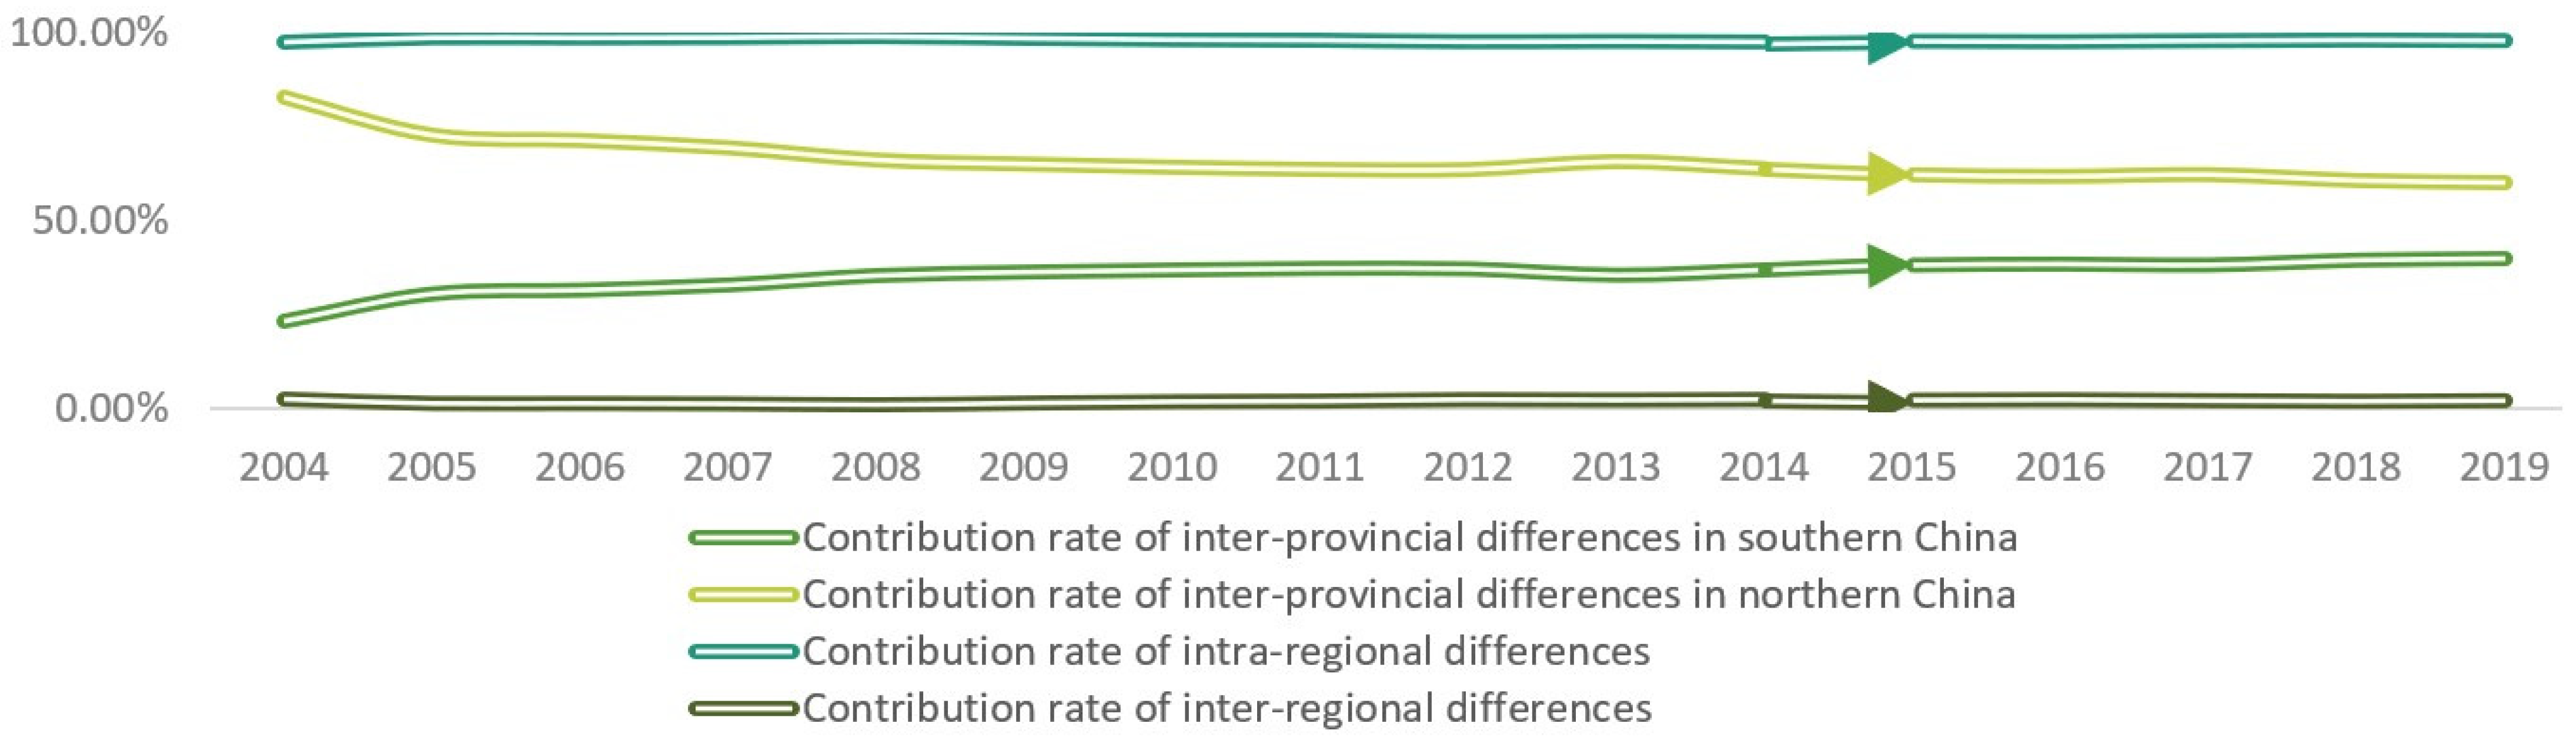
4.2. Results of Theil Index and Subgroup Decomposition
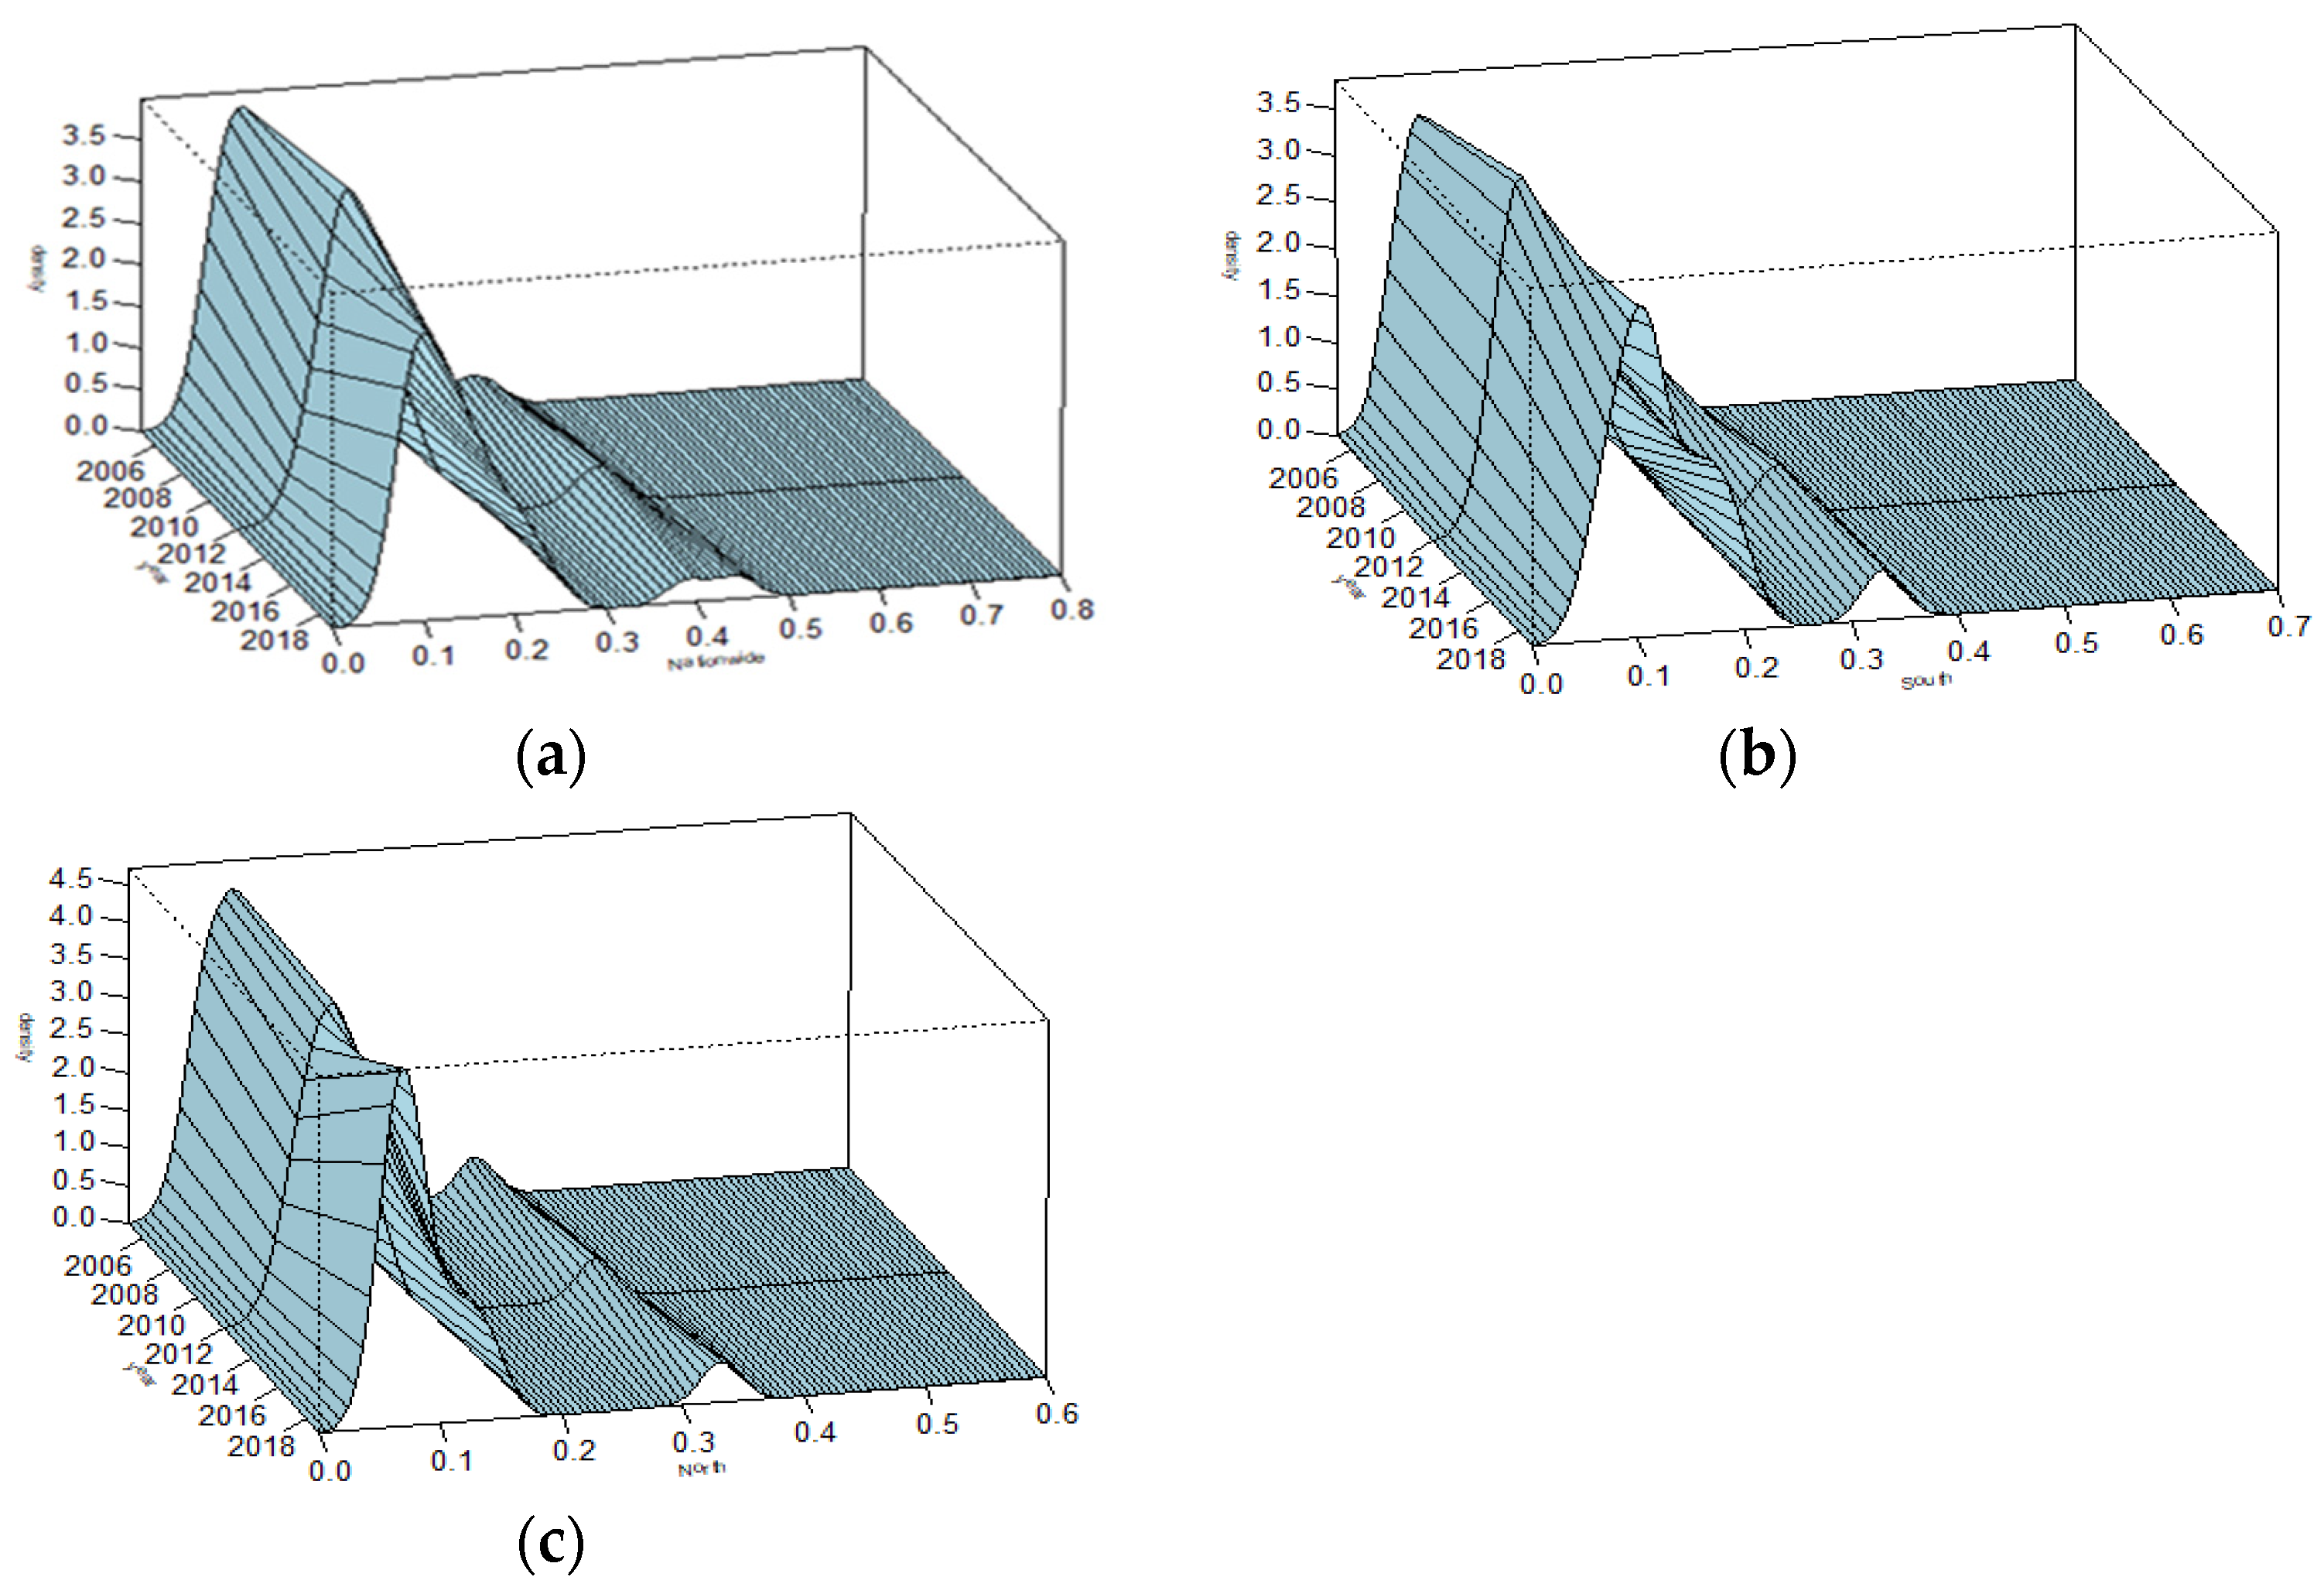
4.3. Results of Kernel Density Estimation
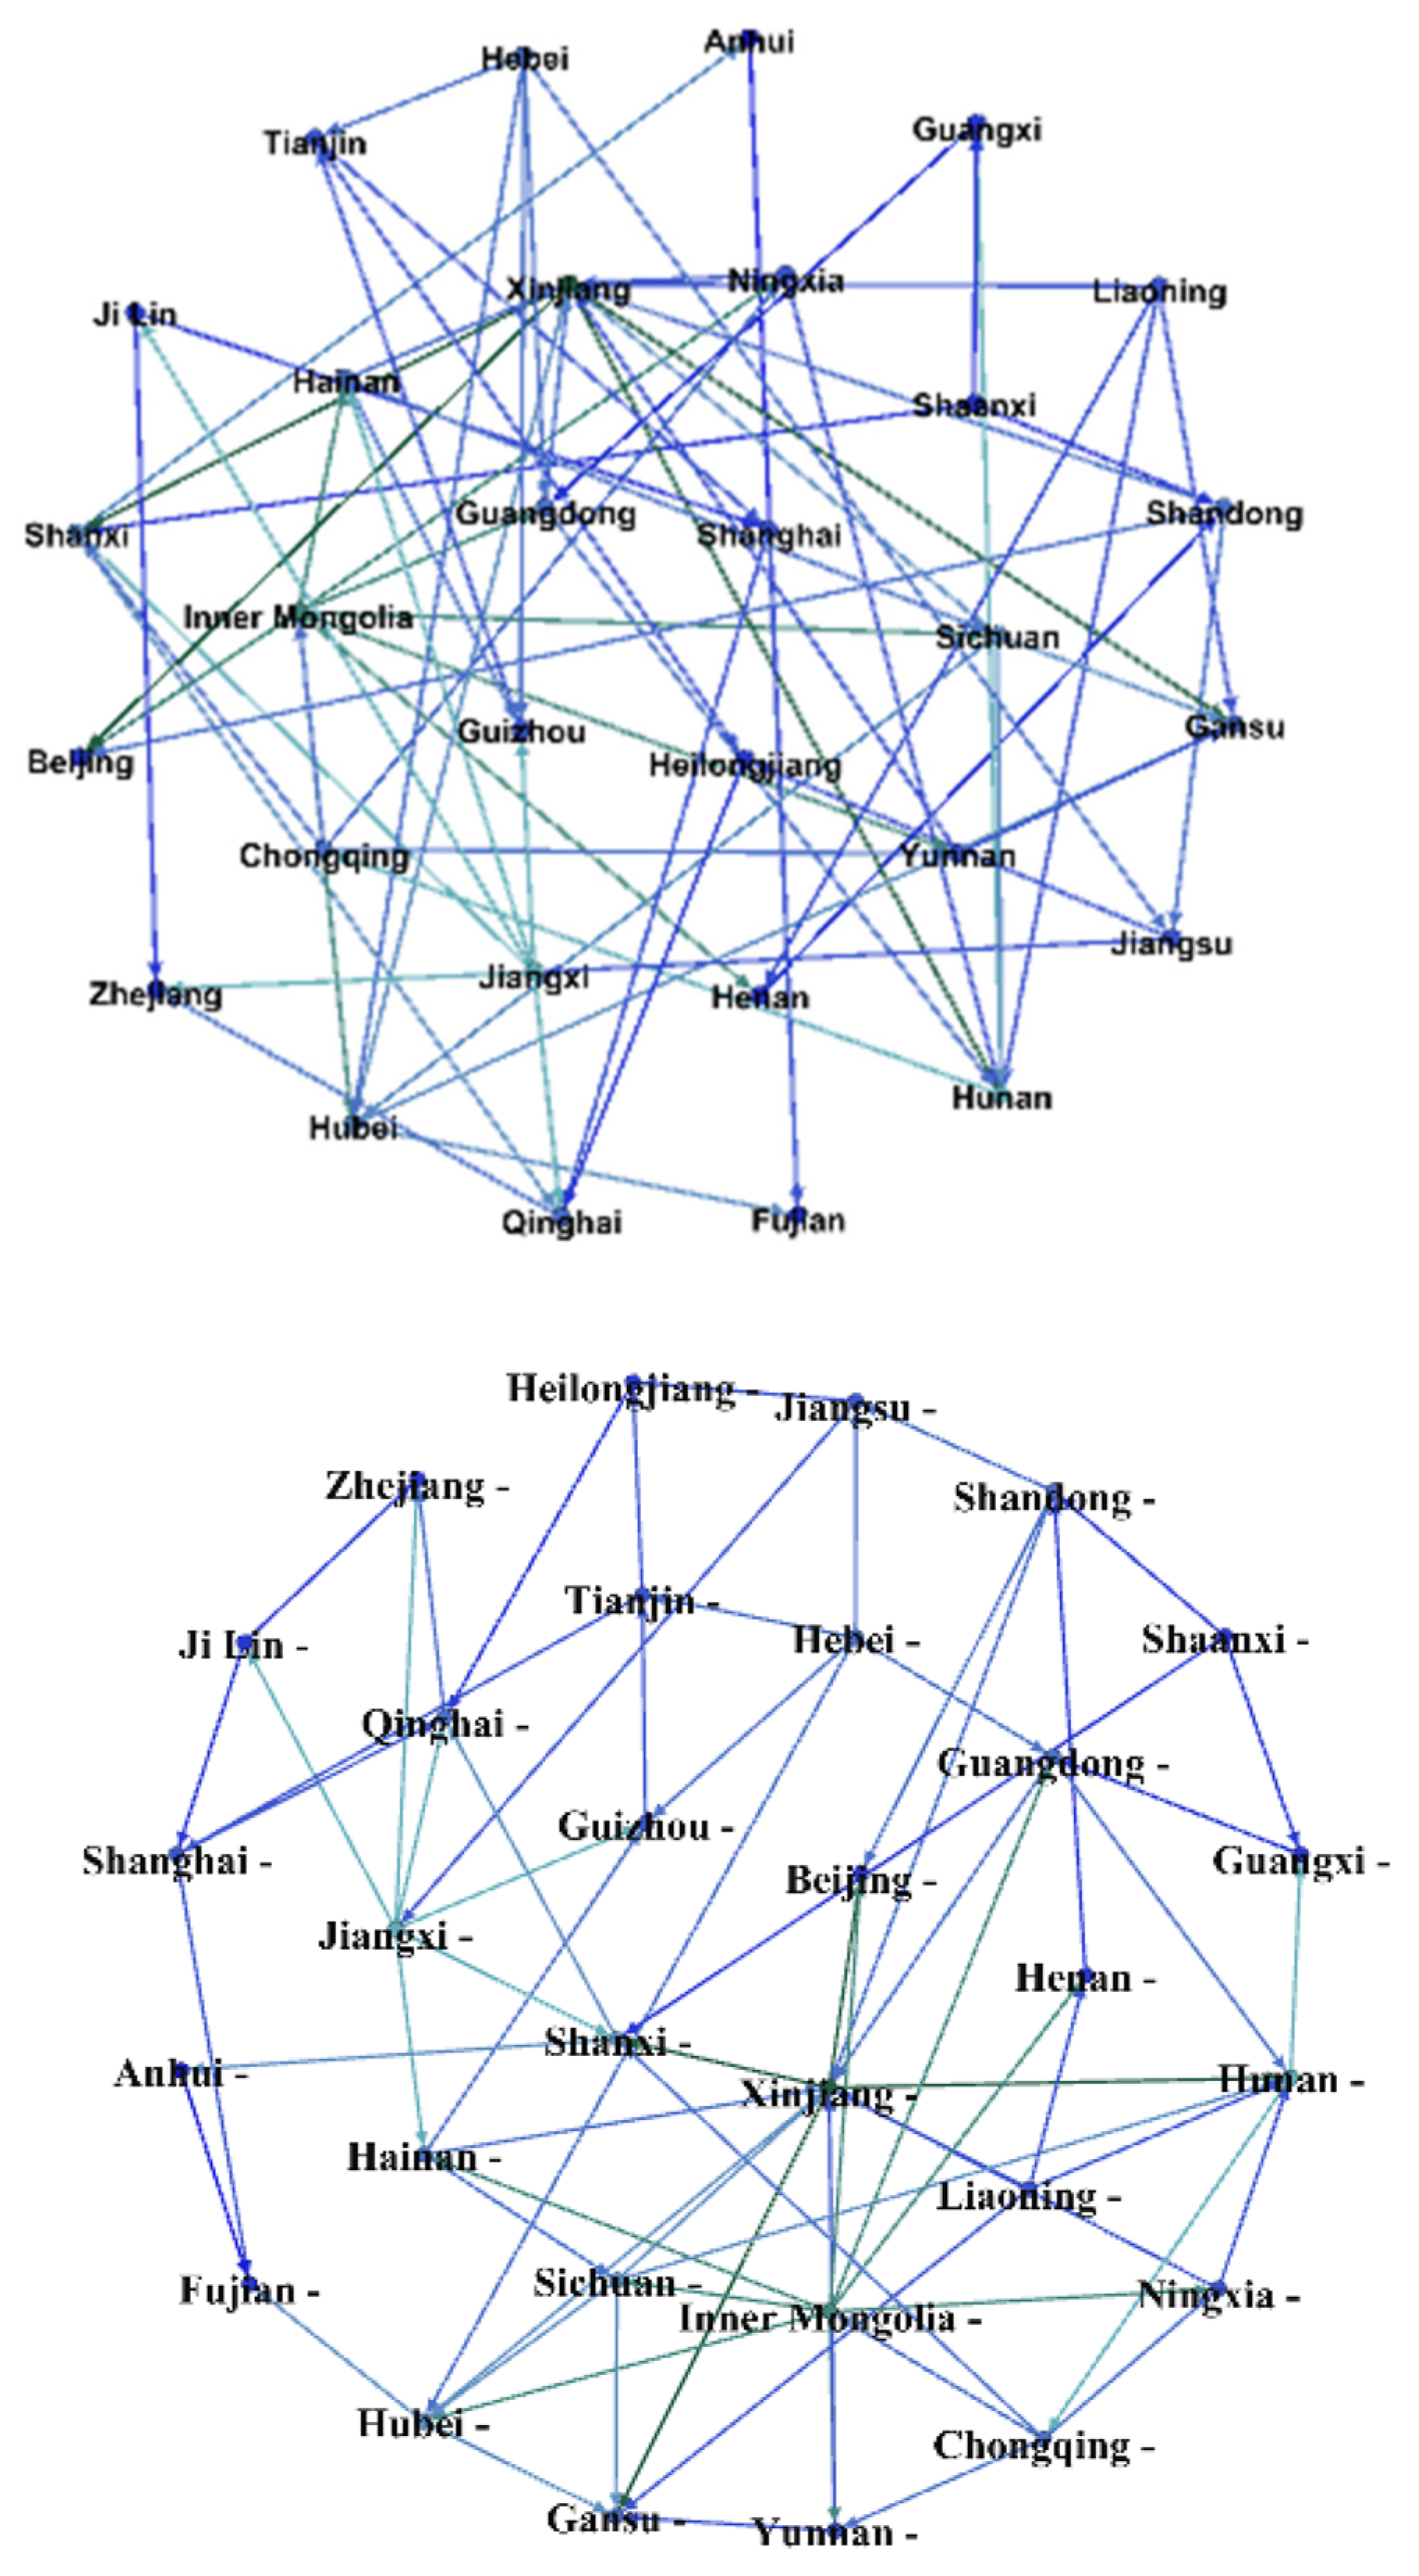
4.4. Results of Network Analysis
5. Conclusions and Discussion
Author Contributions
Funding
Institutional Review Board Statement
Informed Consent Statement
Data Availability Statement
Conflicts of Interest
Appendix A

| Second-Level Indicators | 2013 | 2014 | 2015 | 2016 | 2017 | 2018 |
|---|---|---|---|---|---|---|
| Optical density | 13.09 | 14.38 | 16.40 | 18.25 | 21.24 | 22.44 |
| Mobile phone base station density | 2869.05 | 2922.62 | 3036.90 | 3113.10 | 3482.14 | 3892.86 |
| Port access per square kilometre | 706.43 | 690.42 | 940.77 | 1061.90 | 1082.14 | 1226.13 |
| Number of websites per capita | 2.08 | 2.12 | 2.37 | 2.80 | 3.25 | 3.34 |
| Ratio of RD expenditure in GDP of information industry | 0.02 | 0.02 | 0.02 | 0.03 | 0.03 | 0.03 |
| The proportion of fixed asset investment in the information industry in the total fixed asset investment of the whole society | 0.03 | 0.03 | 0.03 | 0.03 | 0.03 | 0.05 |
| Ratio of technology market turnover to GDP | 0.14 | 0.15 | 0.15 | 0.15 | 0.16 | 0.15 |
| The proportion of information industry employees in the employed population | 0.05 | 0.05 | 0.06 | 0.06 | 0.06 | 0.06 |
| Software revenue as a percentage of GDP | 0.21 | 0.22 | 0.24 | 0.25 | 0.28 | 0.29 |
| E-Commerce sales per capita | 35,307.80 | 41,879.18 | 48,505.30 | 55,346.07 | 84,687.70 | 84,778.09 |
| Number of enterprises in information industry | 34,519 | 34,669 | 31,346 | 31,523 | 31,778 | 31,534 |
| The proportion of telecommunication business in GDP | 0.03 | 0.03 | 0.04 | 0.02 | 0.03 | 0.05 |
| Mobile phone penetration | 159.53 | 189.46 | 181.73 | 178.06 | 172.85 | 186.11 |
| Internet penetration | 22.71 | 22.42 | 22.66 | 21.90 | 24.96 | 29.66 |
| Number of 100 people using computers in industrial enterprises | 57 | 61 | 62 | 66 | 67 | 70 |
| The number of websites owned by 100 enterprises | 59 | 60 | 63 | 64 | 65 | 64 |
| The proportion of enterprises with e-commerce activities | 7.50 | 12.60 | 17.10 | 18.00 | 19.00 | 20.70 |
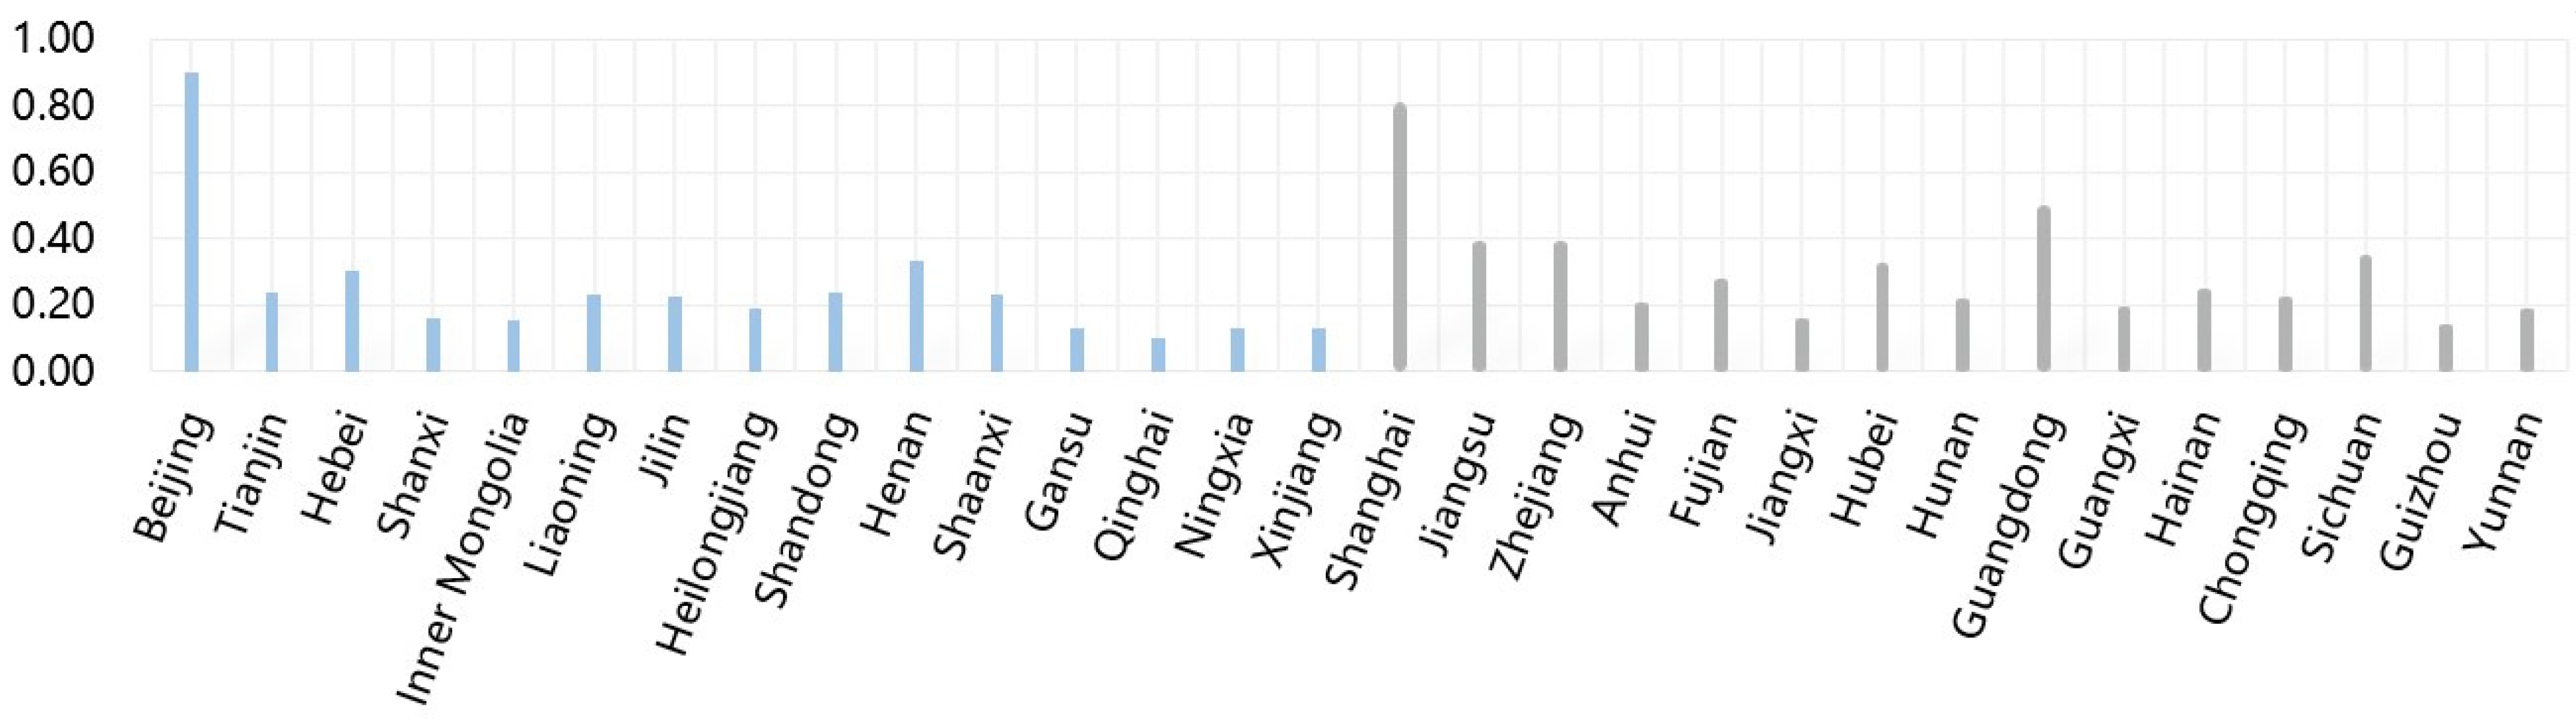
| Province | 2004 | 2005 | 2006 | 2007 | 2008 | 2009 | 2010 | 2011 | 2012 | 2013 | 2014 | 2015 | 2016 | 2017 | 2018 | 2019 |
|---|---|---|---|---|---|---|---|---|---|---|---|---|---|---|---|---|
| Beijing | 0.8149 | 0.8043 | 0.8285 | 0.8522 | 0.8613 | 0.8619 | 0.8505 | 0.8828 | 0.8860 | 0.9476 | 0.9287 | 0.9396 | 0.9508 | 0.9890 | 0.9949 | 0.9956 |
| Tianjin | 0.2026 | 0.2097 | 0.2153 | 0.2190 | 0.2243 | 0.2240 | 0.2317 | 0.2336 | 0.2359 | 0.2414 | 0.2425 | 0.2482 | 0.2476 | 0.2491 | 0.2605 | 0.2658 |
| Hebei | 0.1820 | 0.1918 | 0.2150 | 0.2395 | 0.2692 | 0.2808 | 0.2937 | 0.3026 | 0.3136 | 0.3290 | 0.3385 | 0.3582 | 0.3602 | 0.3783 | 0.3881 | 0.3915 |
| Shanxi | 0.0954 | 0.0975 | 0.1100 | 0.1301 | 0.1496 | 0.1461 | 0.1550 | 0.1635 | 0.1722 | 0.1828 | 0.1850 | 0.1862 | 0.1907 | 0.1961 | 0.2103 | 0.2102 |
| Inner Mongolia | 0.0757 | 0.0981 | 0.1013 | 0.1034 | 0.1347 | 0.1461 | 0.1542 | 0.1598 | 0.1618 | 0.1734 | 0.1792 | 0.1809 | 0.1811 | 0.1923 | 0.2084 | 0.2091 |
| Liaoning | 0.1874 | 0.1960 | 0.2022 | 0.2183 | 0.2203 | 0.2206 | 0.2215 | 0.2286 | 0.2376 | 0.2383 | 0.2427 | 0.2457 | 0.2579 | 0.2609 | 0.2699 | 0.2047 |
| Jilin | 0.1853 | 0.1954 | 0.1988 | 0.2081 | 0.2153 | 0.2153 | 0.2297 | 0.2335 | 0.2301 | 0.2322 | 0.2364 | 0.2375 | 0.2384 | 0.2395 | 0.2403 | 0.2411 |
| Heilongjiang | 0.1355 | 0.1394 | 0.1651 | 0.1714 | 0.1831 | 0.1834 | 0.1948 | 0.1926 | 0.1973 | 0.2020 | 0.2135 | 0.1905 | 0.2145 | 0.2147 | 0.2145 | 0.2190 |
| Shandong | 0.1691 | 0.1723 | 0.1719 | 0.1760 | 0.1818 | 0.1817 | 0.1972 | 0.2199 | 0.2337 | 0.2564 | 0.2799 | 0.2818 | 0.2923 | 0.3136 | 0.3375 | 0.3569 |
| Henan | 0.2430 | 0.2585 | 0.2685 | 0.2762 | 0.2872 | 0.2910 | 0.3075 | 0.3200 | 0.3281 | 0.3394 | 0.3693 | 0.3921 | 0.3995 | 0.4120 | 0.4138 | 0.4319 |
| Shaanxi | 0.1604 | 0.1960 | 0.1940 | 0.2154 | 0.2181 | 0.2187 | 0.2201 | 0.2293 | 0.2309 | 0.2353 | 0.2528 | 0.2538 | 0.2579 | 0.2646 | 0.2675 | 0.3111 |
| Gansu | 0.0831 | 0.0912 | 0.0988 | 0.0957 | 0.1096 | 0.1096 | 0.1184 | 0.1296 | 0.1227 | 0.1340 | 0.1399 | 0.1453 | 0.1573 | 0.1679 | 0.1826 | 0.2197 |
| Qinghai | 0.0184 | 0.0380 | 0.0443 | 0.0479 | 0.0797 | 0.0797 | 0.0516 | 0.0623 | 0.0720 | 0.0665 | 0.0898 | 0.1794 | 0.1940 | 0.1883 | 0.2266 | 0.2001 |
| Ningxia | 0.1129 | 0.1234 | 0.1282 | 0.1287 | 0.1307 | 0.1277 | 0.1273 | 0.1277 | 0.1292 | 0.1294 | 0.1281 | 0.1240 | 0.1315 | 0.1385 | 0.1474 | 0.1551 |
| Xinjiang | 0.0600 | 0.0758 | 0.0811 | 0.1170 | 0.1280 | 0.1281 | 0.1294 | 0.1389 | 0.1391 | 0.1423 | 0.1462 | 0.1516 | 0.1516 | 0.1527 | 0.1673 | 0.1911 |
| Shanghai | 0.7122 | 0.7231 | 0.7264 | 0.7810 | 0.7858 | 0.8018 | 0.8075 | 0.8106 | 0.8292 | 0.8454 | 0.8491 | 0.8550 | 0.8554 | 0.8626 | 0.8700 | 0.8758 |
| Jiangsu | 0.3052 | 0.3163 | 0.3469 | 0.3586 | 0.3631 | 0.3729 | 0.3734 | 0.3828 | 0.3866 | 0.3995 | 0.4166 | 0.4411 | 0.4479 | 0.4583 | 0.4624 | 0.4681 |
| Zhejiang | 0.3110 | 0.3196 | 0.3354 | 0.3496 | 0.3517 | 0.3615 | 0.3654 | 0.3762 | 0.3892 | 0.4032 | 0.4111 | 0.4305 | 0.4589 | 0.4715 | 0.4732 | 0.4993 |
| Anhui | 0.1192 | 0.1258 | 0.1365 | 0.1432 | 0.1485 | 0.1582 | 0.1653 | 0.1691 | 0.2022 | 0.2454 | 0.2578 | 0.2605 | 0.2779 | 0.2847 | 0.2945 | 0.3151 |
| Fujian | 0.2195 | 0.2274 | 0.2122 | 0.2233 | 0.2291 | 0.2499 | 0.2526 | 0.2621 | 0.2826 | 0.3077 | 0.3179 | 0.3287 | 0.3299 | 0.3385 | 0.3421 | 0.3510 |
| Jiangxi | 0.0764 | 0.0780 | 0.0853 | 0.0835 | 0.0918 | 0.0805 | 0.0909 | 0.1474 | 0.1777 | 0.1986 | 0.2117 | 0.2266 | 0.2306 | 0.2371 | 0.2437 | 0.2541 |
| Hubei | 0.2385 | 0.2417 | 0.2683 | 0.2812 | 0.3118 | 0.3281 | 0.3352 | 0.3412 | 0.3299 | 0.3355 | 0.3460 | 0.3554 | 0.3669 | 0.3719 | 0.3869 | 0.3962 |
| Hunan | 0.1348 | 0.1350 | 0.1450 | 0.1492 | 0.1524 | 0.1694 | 0.1983 | 0.2270 | 0.2370 | 0.2419 | 0.2592 | 0.2695 | 0.2799 | 0.2808 | 0.2953 | 0.3027 |
| Guangdong | 0.4558 | 0.4650 | 0.4621 | 0.4708 | 0.4779 | 0.4825 | 0.4913 | 0.4960 | 0.5037 | 0.5127 | 0.5246 | 0.5265 | 0.5362 | 0.5386 | 0.5412 | 0.5445 |
| Guangxi | 0.1075 | 0.1275 | 0.1385 | 0.1486 | 0.1596 | 0.1696 | 0.1798 | 0.1897 | 0.1926 | 0.2030 | 0.2170 | 0.2122 | 0.2421 | 0.2612 | 0.2981 | 0.3128 |
| Hainan | 0.2184 | 0.2261 | 0.2349 | 0.2363 | 0.2382 | 0.2418 | 0.2428 | 0.2438 | 0.2478 | 0.2504 | 0.2526 | 0.2632 | 0.2642 | 0.2707 | 0.2760 | 0.2845 |
| Chongqing | 0.1489 | 0.1641 | 0.1551 | 0.1546 | 0.1799 | 0.1805 | 0.1901 | 0.2117 | 0.2320 | 0.2269 | 0.2485 | 0.2585 | 0.2822 | 0.2994 | 0.3216 | 0.3220 |
| Sichuan | 0.2572 | 0.2731 | 0.2813 | 0.2859 | 0.2934 | 0.3207 | 0.3386 | 0.3465 | 0.3592 | 0.3659 | 0.3791 | 0.3812 | 0.3999 | 0.4094 | 0.4398 | 0.4429 |
| Guizhou | 0.0738 | 0.0818 | 0.1098 | 0.1152 | 0.1184 | 0.1286 | 0.1386 | 0.1494 | 0.1510 | 0.1511 | 0.1539 | 0.1630 | 0.1738 | 0.1795 | 0.1870 | 0.2011 |
| Yunnan | 0.1543 | 0.1578 | 0.1609 | 0.1646 | 0.1754 | 0.1763 | 0.1805 | 0.1955 | 0.1989 | 0.2019 | 0.2050 | 0.2070 | 0.2108 | 0.2133 | 0.2155 | 0.2219 |
References
- Zhang, Y.T.; Zhou, W.X. Microstructural Characteristics of the Weighted and Directed International Crop Trade Networks. Entropy 2021, 23, 1250. [Google Scholar] [CrossRef]
- Xing, L.Z.; Ai, X.; Ren, J.Q.; Wang, D.W. Network-Based Driving Force of National Economic Development: A Social Capital Perspective. Entropy 2021, 23, 1276. [Google Scholar] [CrossRef]
- Yan, Y.; Wu, B.Y.; Tian, T.H.; Zhang, H. Development of Stock Networks Using Part Mutual Information and Australian Stock Market Data. Entropy 2020, 22, 773. [Google Scholar] [CrossRef]
- Tapscott, D. The Digital Economy: Promise and Peril in the Age of Networked Intelligence; McGraw-Hill: New York, NY, USA, 1997; ISBN 0-07-063342-8. [Google Scholar]
- Aniela, B.; Marian, Z.; Badea, D.N. Economic growth and digital skills: An overview on the eu-28 country clusters. Ann.-Econ. Ser. 2019, 6, 78–85. [Google Scholar]
- Goldfarb, A.; Tucker, C. Digital economics. J. Econ. Lit. 2019, 57, 3–43. [Google Scholar] [CrossRef] [Green Version]
- Solomon, E.M.; Klyton, A.V. The impact of digital technology usage on economic growth in Africa. Util. Policy 2020, 67, 101104. [Google Scholar] [CrossRef] [PubMed]
- Hu, A.G.; Zhou, S.J. A New Global Gap Between the Rich and the Poor: The Increasingly Widening “Digital Gap”. Soc. Sci. China 2002, 3, 34–48. [Google Scholar]
- Antonelli, C. The digital divide: Understanding the economics of new information and communication technology in the global economy. Inf. Econ. Policy 2003, 15, 173–199. [Google Scholar] [CrossRef]
- Kariyawasam, R. International economic law and the digital divide: A new silk road. Books 2007, 11, 391–701. [Google Scholar]
- Wu, X.Y.; Zhang, Y.J. An analysis of the status quo and international competitiveness of China’s digital economy. Sci. Res. Manag. 2021, 41, 250–258. [Google Scholar]
- He, Z.Y.; Zhang, X.; Wan, G.H. Digital Finance, Digital Divide, and Multidimensional Poverty. Stat. Res. 2020, 37, 79–89. [Google Scholar]
- Li, X.H. Development trend, problems and policy suggestions of digital economy in the period of the 14th five-year plan. People’s Trib. 2021, 1, 10–15. [Google Scholar]
- Grimes, S. The digital economy challenge facing peripheral rural areas. Prog. Hum. Geogr. 2003, 27, 174–193. [Google Scholar] [CrossRef]
- Vdovkina, E.; Shapovalova, S.; Poddubnova, S. The Impact of the Digital Economy on the Development of Cross-Border Areas. In Proceedings of the International Conference on Sustainable Development of Cross-Border Regions: Economic, Social and Security Challenges (ICSDCBR 2019), Barnaul, Russia, 18–19 April 2019; Available online: https://doi.org/10.2991/icsdcbr-19.2019.38 (accessed on 1 November 2019). [CrossRef] [Green Version]
- Leontyev, A.I.; Novikova, N.V. Implementation of the National Project “Digital Economy” in Regional Strategies. In Proceedings of the 2nd International Scientific and Practical Conference “Modern Management Trends and the Digital Economy: From Regional Development to Global Economic Growth” (MTDE 2020), Yekaterinburg, Russia, 16–17 April 2020; Available online: https://doi.org/10.2991/aebmr.k.200502.172 (accessed on 5 May 2020). [CrossRef]
- Li, S.T.; He, J.W.; Tang, Z.D. On the widening gap between North and South in China’s economic development from the division of labor in the value chain. China Econ. Rep. 2019, 2, 16–21. [Google Scholar]
- Bukh, R.; Heeks, R. Defining, conceptualizing and measuring the digital economy. Int. Organ. Res. J. 2018, 13, 143–172. [Google Scholar]
- Ma, H.T.; Meng, Z.L.; Yan, D.L.; Wang, H.L. Digital Economy: A new driving force for China’s innovation and growth. North China Power 2017, 6, 93. [Google Scholar]
- Zhang, L.L.; Liu, X.F.; Chen, Z. Strategic thinking on the development of digital economy in China. Mod. Manag. Sci. 2018, 5, 90–92. [Google Scholar]
- Lan, Q.X. Digital Economy: An Important Driving Force for the Development of the World Economy. Renmin Luntan·Xueshu Qianyan 2020, 8, 80–85. [Google Scholar]
- Luo, Z.L. Three Basic Attributes of the Development of Digital Economy in China. Renmin Luntan·Xueshu Qianyan 2020, 17, 8–14. [Google Scholar]
- Xiang, S.J.; Wu, W.J. The Latest Development of and the Inspiration from OECD Digital Economic Accounting Research. Stat. Res. 2018, 35, 3–15. [Google Scholar]
- Kang, T.X. The digital economy and accounting research. Stat. Decis. 2008, 5, 19–21. [Google Scholar]
- Etoundi, R.A.; Onana, F.; Olle, G.; Eteme, A.A. Development of the digital economy in Cameroon: Challenges and perspectives. Electron. J. Inf. Syst. Dev. Ctries. 2016, 76, 1–24. [Google Scholar] [CrossRef]
- Cai, Y.Z. Calculation of Added Value and Contribution of Digital Economy: Historical Evolution, Theoretical Basis and Method Framework. Seek. Truth 2018, 45, 65–71. [Google Scholar]
- Wen, J.; Yan, Z.J.; Cheng, Y. Digital Economy and Upgrading Regional Innovation Capacity. Inq. Into Econ. 2019, 11, 112–124. [Google Scholar]
- Shan, Z.G.; Xu, Q.Y.; Ma, C.J.; Tang, S.S.; Wang, W. Based on the theory of the three-dimension evaluation system of the digital economy development and prospects. Macroecon. Manag. 2020, 2, 48–55. [Google Scholar]
- Zhang, Z.Y.; Lin, C.; Zhong, C. Regional economy has changed from “East-West difference” to “North-South difference”. China Strateg. Emerg. Ind. 2018, 45, 88–89. [Google Scholar]
- Sheng, L.; Zhang, Z.Y. Research on the influencing factors of North-South economic differentiation in China—From the perspective of regional innovation ability difference. J. Cent. China Norm. Univ. 2021, 55, 727–740. [Google Scholar]
- Yang, H.M.; Jiang, L. Digital Economy, Spatial Effects and Total Factor Productivity. Stat. Res. 2021, 38, 3–15. [Google Scholar]
- Wang, J.; Zhu, J.; Luo, X. Development level and evolution measurement of China’s digital economy. Res. Quant. Econ. Tech. Econ. 2021, 38, 26–42. [Google Scholar]
- Wang, J.J.; She, G.J. Measurement and regional comparison of the development level of digital economy in China. China Bus. Mark. 2021, 35, 3–17. [Google Scholar]
- Yu, H.H. Study on Spatial Correlation of Digital Economy and Its Driving Factors in China. Stat. Inf. Forum 2021, 36, 23–34. [Google Scholar]
- Conceicao, P.; Galbraith, J.; Bradford, P. The Theil index in sequences of nested and hierarchic grouping structures: Implications for the measurement of inequality through time, with data aggregated at different levels of industrial classification. East. Econ. J. 2001, 27, 491–514. [Google Scholar]
- Parzen, E. On estimation of a probability density function and mode. Ann. Math. Stat. 1962, 33, 1065–1076. [Google Scholar] [CrossRef]
- Gong, J.G.; Li, Z.Y. Nonparametric Kernel Density Estimation and Copula. Appl. Stat. Manag. 2009, 28, 64–68. [Google Scholar]
- Taylor, C.C. Bootstrap choice of the smoothing parameter in kernel density estimation. Biometrika 1989, 76, 705–712. [Google Scholar] [CrossRef]
- Groenewold, N.; Lee, G.; Chen, A. Inter-regional spillovers in China: The importance of common shocks and the definition of the regions. China Econ. Rev. 2008, 19, 32–52. [Google Scholar] [CrossRef] [Green Version]
- Li, J.; Chen, S.; Wan, G.; Fu, C. Study on the Spatial Correlation and Explanation of Regional Economic Growth in China: Based on Analytic Network Process. Econ. Res. J. 2014, 49, 4–16. [Google Scholar]
- Freeman, L.C. Centrality in social networks: Conceptual clarification. Soc. Netw. 1979, 1, 215–239. [Google Scholar] [CrossRef] [Green Version]
- Zhong, C.P.; Liu, C.; Li, Y.J. Actively Respond to the “Digital Economy”: The Gap between China and the United States, Causes and Countermeasures. Econ. Rev. 2017, 4, 41–47. [Google Scholar]

| First-Level Indicators | Second-Level Indicators |
|---|---|
| Digital Infrastructure | Optical density |
| Mobile phone base station density | |
| Port access per square kilometer | |
| Number of websites per capita | |
| Digital Innovation Capability | Ratio of RD expenditure in GDP of information industry |
| The proportion of fixed asset investment in the information industry in the total fixed asset investment of the whole society | |
| Ratio of technology market turnover to GDP | |
| Digital Industry Scale | The proportion of information industry employees in the employed population |
| Software revenue as a percentage of GDP | |
| E-Commerce sales per capita | |
| Number of enterprises in information industry | |
| The proportion of telecommunication business in GDP | |
| Application of digital technology | Mobile phone penetration |
| Internet penetration | |
| Number of 100 people using computers in industrial enterprises | |
| The number of websites owned by 100 enterprises | |
| The proportion of enterprises with e-commerce activities |
| Region | Provinces |
|---|---|
| Northern region | Beijing, Tianjin, Hebei, Shanxi, Inner Mongolia, Liaoning, Jilin, Heilongjiang, Shandong, Henan, Shaanxi, Gansu, Qinghai, Ningxia, and Xinjiang |
| Southern region | Shanghai, Jiangsu, Zhejiang, Anhui, Fujian, Jiangxi, Hubei, Hunan, Guangdong, Guangxi, Hainan, Chongqing, Sichuan, Guizhou, and Yunnan |
| Level Indicators | Nationwide | South | North |
|---|---|---|---|
| Digital Infrastructure | 0.0442 | 0.0501 | 0.0411 |
| Digital Innovation Capability | 0.0696 | 0.0759 | 0.0652 |
| Digital Industry Scale | 0.1053 | 0.1192 | 0.0971 |
| Application of digital technology | 0.0903 | 0.1000 | 0.0829 |
| Region | Province | Benefit Related | Overflow Related | Related Total | Relative Degree Centrality | Betweenness Centrality |
|---|---|---|---|---|---|---|
| South | Shanghai | 2 | 2 | 4 | 0.138 | 7.250 |
| Jiangsu | 2 | 2 | 4 | 0.138 | 67.476 | |
| Zhejiang | 3 | 0 | 3 | 0.103 | 0.000 | |
| Anhui | 1 | 1 | 2 | 0.069 | 12.000 | |
| Fujian | 3 | 0 | 3 | 0.103 | 0.000 | |
| Jiangxi | 1 | 6 | 7 | 0.241 | 64.560 | |
| Hubei | 3 | 3 | 6 | 0.207 | 8.810 | |
| Hunan | 5 | 2 | 7 | 0.241 | 185.667 | |
| Guangdong | 3 | 2 | 5 | 0.172 | 40.143 | |
| Guangxi | 2 | 1 | 3 | 0.103 | 16.667 | |
| Hainan | 2 | 3 | 5 | 0.172 | 71.143 | |
| Chongqing | 1 | 4 | 5 | 0.172 | 166.333 | |
| Sichuan | 2 | 4 | 6 | 0.207 | 24.476 | |
| Guizhou | 3 | 1 | 4 | 0.138 | 35.000 | |
| Yunnan | 2 | 2 | 4 | 0.138 | 3.976 | |
| North | Beijing | 3 | 0 | 3 | 0.103 | 0.000 |
| Tianjin | 2 | 2 | 4 | 0.138 | 25.000 | |
| Hebei | 0 | 5 | 5 | 0.172 | 0.000 | |
| Shanxi | 4 | 2 | 6 | 0.207 | 55.524 | |
| Inner Mongolia | 1 | 8 | 9 | 0.310 | 128.667 | |
| Liaoning | 0 | 4 | 4 | 0.138 | 0.000 | |
| Jilin | 1 | 2 | 3 | 0.103 | 7.000 | |
| Heilongjiang | 2 | 1 | 3 | 0.103 | 3.667 | |
| Shandong | 2 | 3 | 5 | 0.172 | 85.810 | |
| Henan | 2 | 1 | 3 | 0.103 | 60.143 | |
| Shaanxi | 0 | 3 | 3 | 0.103 | 0.000 | |
| Gansu | 5 | 0 | 5 | 0.172 | 0.000 | |
| Qinghai | 4 | 1 | 5 | 0.172 | 17.857 | |
| Ningxia | 2 | 2 | 4 | 0.138 | 4.643 | |
| Xinjiang | 8 | 4 | 12 | 0.414 | 138.190 |
Publisher’s Note: MDPI stays neutral with regard to jurisdictional claims in published maps and institutional affiliations. |
© 2021 by the authors. Licensee MDPI, Basel, Switzerland. This article is an open access article distributed under the terms and conditions of the Creative Commons Attribution (CC BY) license (https://creativecommons.org/licenses/by/4.0/).
Share and Cite
Tang, L.; Lu, B.; Tian, T. Spatial Correlation Network and Regional Differences for the Development of Digital Economy in China. Entropy 2021, 23, 1575. https://doi.org/10.3390/e23121575
Tang L, Lu B, Tian T. Spatial Correlation Network and Regional Differences for the Development of Digital Economy in China. Entropy. 2021; 23(12):1575. https://doi.org/10.3390/e23121575
Chicago/Turabian StyleTang, Luyang, Bangke Lu, and Tianhai Tian. 2021. "Spatial Correlation Network and Regional Differences for the Development of Digital Economy in China" Entropy 23, no. 12: 1575. https://doi.org/10.3390/e23121575
APA StyleTang, L., Lu, B., & Tian, T. (2021). Spatial Correlation Network and Regional Differences for the Development of Digital Economy in China. Entropy, 23(12), 1575. https://doi.org/10.3390/e23121575